Local synaptic inputs support opposing, network-specific odor representations in a widely projecting modulatory neuron
- University of Maryland, United States
- West Virginia University, United States
- Georgia Gwinnett College, United States
- Howard Hughes Medical Institute, United States
- University of Vermont, United States
Figures
Figure 1 with 2 supplements
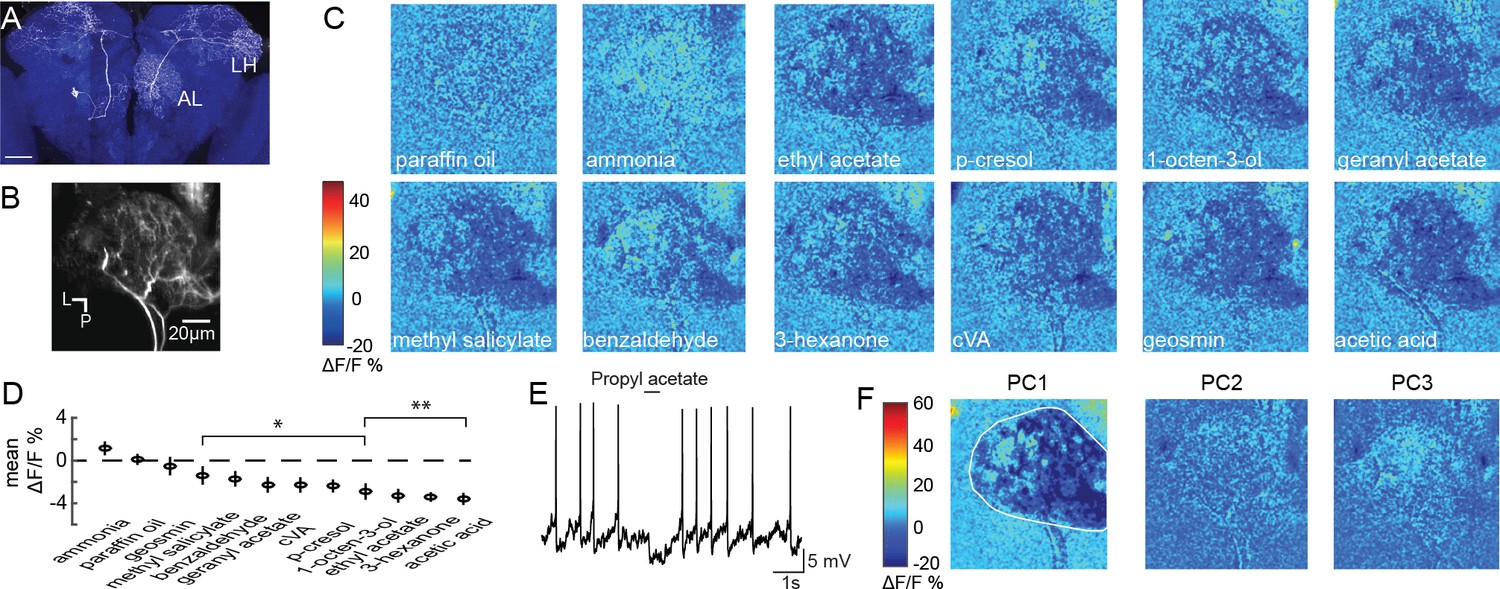
Olfactory stimulation inhibits CSDn processes in the AL.
(A) A single CSDn expressing GFP shows processes in both the AL and the LH. White = GFP expression, blue = neuropil labeling via N-cadherin immunocytochemistry. Scale bar = 50 um. (B) Background fluorescence from GCaMP6s expression in CSDn neurites in the AL. L = lateral, p=posterior. The same notation is used in subsequent figures (C) Odor-evoked changes in calcium (ΔF/F) levels in the AL processes of the CSDn. Cooler colors (blue) represent decreases in calcium levels and warmer (red) colors show increases in calcium. Color bar values are set to the maximum and minimum pixel value across all odors. Images are generated from volumetric stacks by first averaging the z-stack for each volume during the trial to generate 2D frames, and then averaging across three frames during the peak of the odor response. Each odor was presented 3–4 times and final image is the mean frame of these trials. Odors are diluted 10−2 in paraffin oil (PA), which serves as a solvent control. Images are scaled and oriented as in B. (D) Odor responses ranked according to the strength of the observed inhibition (n = 10). From left to right, p=0.06, p=0.81, p=0.51, p=0.0097, p=0.0022, p=0.0052, p=0.0051, p=0.0012, p=0.0017, p=1.82×10⁻⁴, p=2.95×10⁻⁶, p=2.50×10⁻⁵. Student’s t-test. *=p < 0.01, **=p < 0.001. (E) Odor-evoked inhibition observed in the CSDn soma via whole-cell patch-clamp recording. (F) Principal component analysis performed on the spatial pattern at the peak of the odor responses. White outline represents an ROI used to mask pixels outside of the AL for PCA. The first three PCs are shown. A structured response is only observed in PC1. Images are scaled and oriented as in B. The variance and SEM explained by PCs 1–3 are 60.3 ± 2.2%, 6.3 ± 0.4%, and 6.1 ± 0.3%, respectively.
Figure 1—figure supplement 1
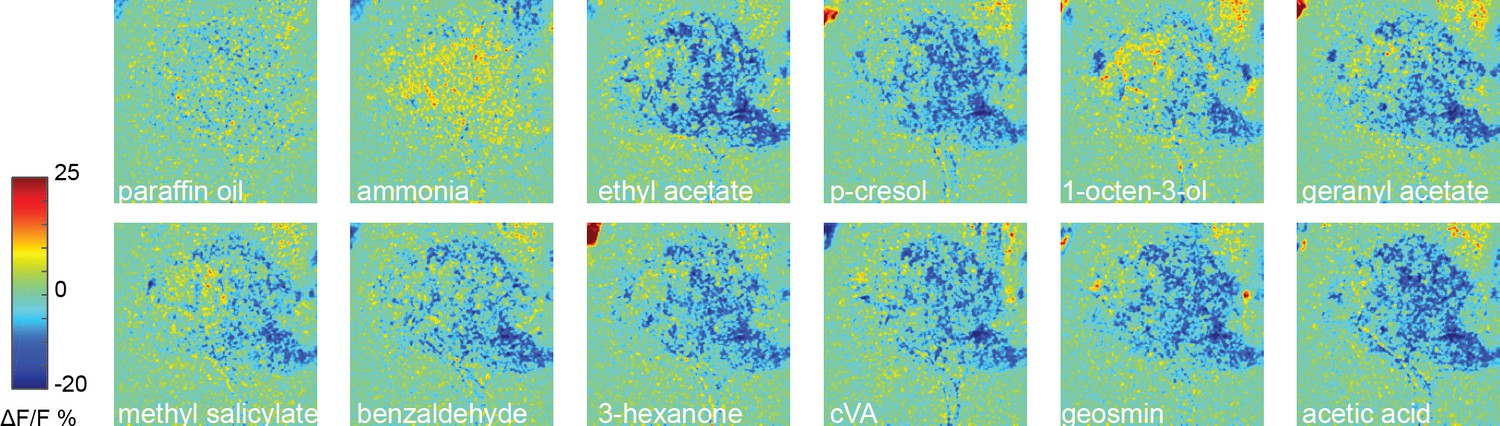
CSDn calcium responses in the AL rescaled to emphasize excitation.
The same data as Figure 1C are displayed but with a rescaled color bar.
Figure 1—video 1
Olfactory stimulation inhibits serotonergic CSDn neurites in the antennal lobe.
Left. Basal GCaMP6s fluorescence in the neurites of the CSDn. Right. The ΔF/F response of the CSDn neurite seen on the left. Scale bar = 20 μm. Color indicates percent change in ΔF/F.
Figure 2 with 3 supplements
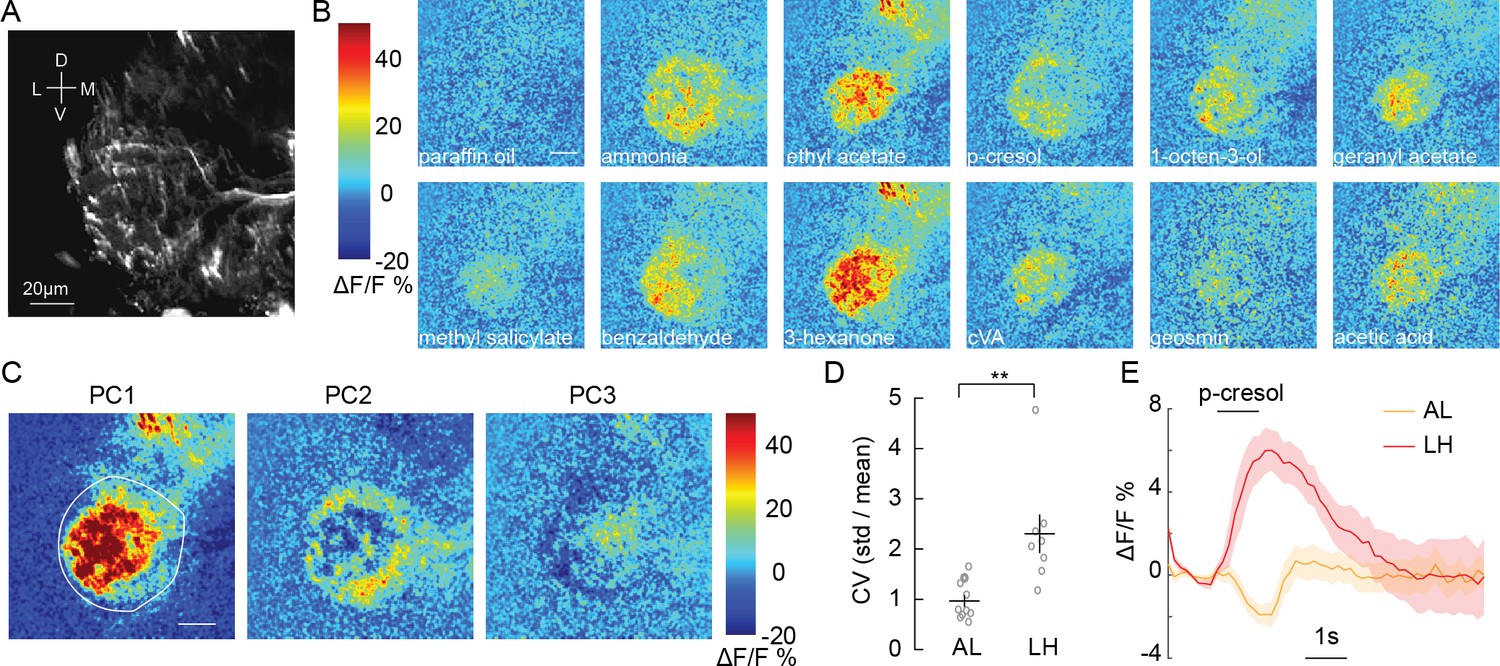
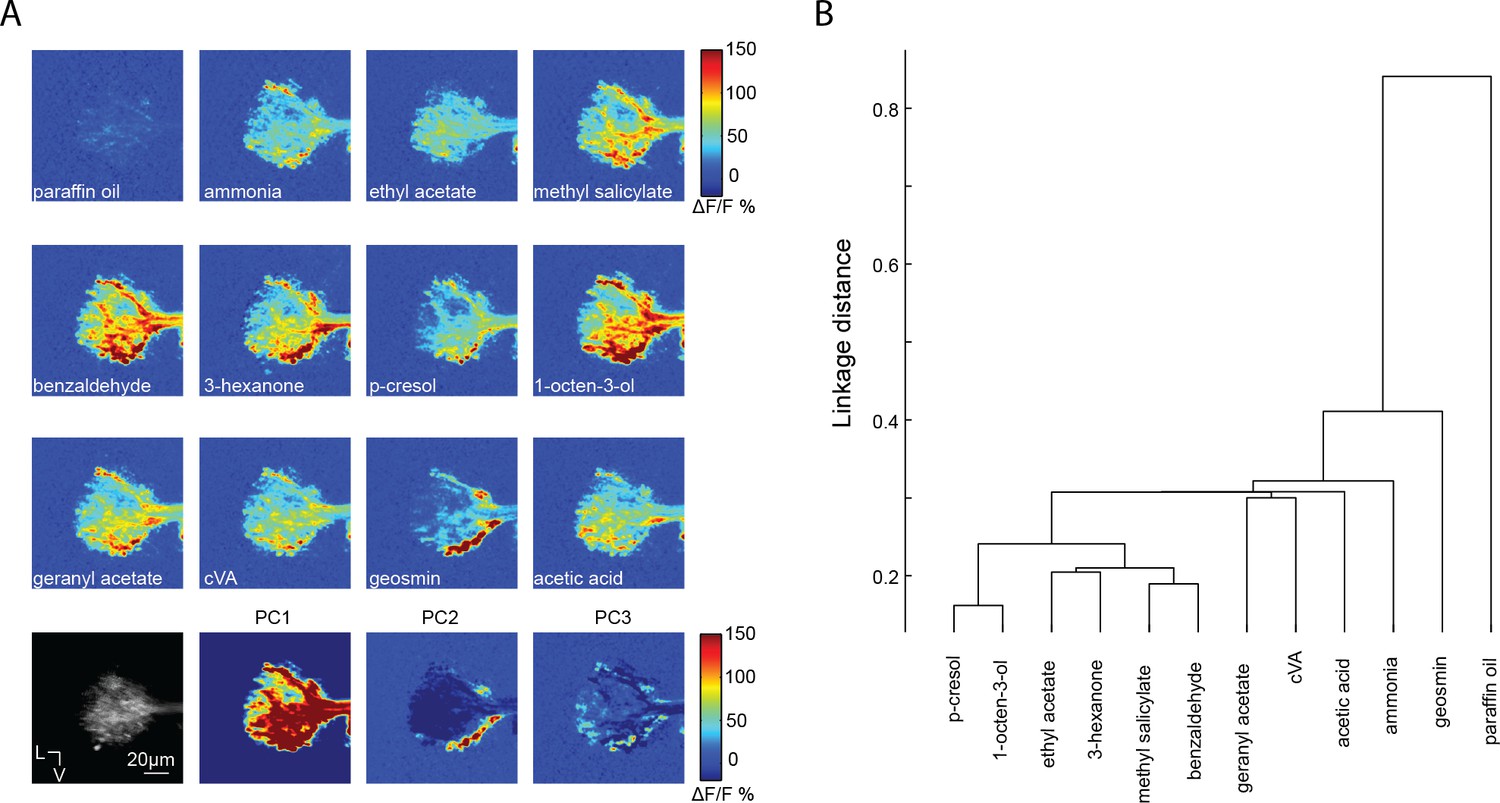
Olfactory stimulation excites CSDn processes in the LH.
(A) Background fluorescence from GCaMP6s expression in CSDn neurites in the LH. (B) Odor-evoked changes in calcium observed in CSDn processes in the LH. Odor scale bar = 20 μm (C) Principal component analysis performed on the spatial pattern at the peak of the odor responses for a sample preparation. White outline represents an ROI used for masking during PCA.The first three PCs are shown. A structured response is observed in each PC. Images are scaled as in B. The variance and SEM explained by PCs 1–3 are 45.2 ± 2.6%, 12.4 ± 0.9%, and 8.6 ± 0.6%. (D) The coefficient of variation for odor responses in the AL and LH. n = 10, AL and n = 8, LH. p=0.0021, Student’s t-test. The CV was calculated for each pixel in the odor response images and averaged across pixels for each preparation. (E) A comparison of the time series of ΔF/F responses in the AL and LH to a single odorant, p-cresol. The response is the averaged across 10 animals in the AL and eight in the LH. Error bars represent SEM.
Figure 2—figure supplement 1

Activation patterns in the LH are similar across preparations.
(A) The first 3 PC images are shown for three sample preparations (of our total data set of 8 animals). White ROI demarcates the boundaries of the LH. Note that for each preparation, PC1 shows activation of a core region of the LH, PC2 shows activation in outer shell region, and PC3 shows inhibition in the central core of the LH. (B) Differences in precise branching patterns of the CSDn across flies may contribute to the variability in odor responses across flies. Three CDNs are labeled in different flies and the exact branching pattern is unique to each animal.
Figure 2—figure supplement 2

Olfactory stimulation activates presynaptic release sites in CSDn terminals in the LH.
(A) A schematic of the Drosophila brain and the region of imaging. (B) Odor responses measured with sytGCaMP6s revealing activation of presynaptic release sites in one preparation. Similar results were obtained in eight preparations in total. (C) Skeleton of the CSDn reconstruction in the lateral horn. Blue markers represent postsynaptic sites while red markers represent presynaptic sites. Scale bar = 50 um. (D - E) Insets from (A) highlighting the proximity of presynaptic and postsynaptic sites. (F) A histogram showing the distribution of distances to the closest postsynaptic site to each presynaptic site in the CSDn. Because pre- and postsynaptic sites occur in such close proximity, it is possible that calcium entry from postsynaptic receptors may directly cause presynaptic release. Additionally, overexpression of the sytGCaMP6s at presynaptic release sites could potentially allow the sensor to report calcium entry at postsynaptic receptors.
Figure 2—video 1
Olfactory stimulation excites serotonergic CSDn neurites in the lateral horn.
Left. Basal GCaMP6s fluorescence in the neurites of the CSDn. Right. The ΔF/F response of the CSDn neurite seen on the left. Scale bar = 20 μm. Color indicates percent change in ΔF/F.
Figure 3 with 1 supplement
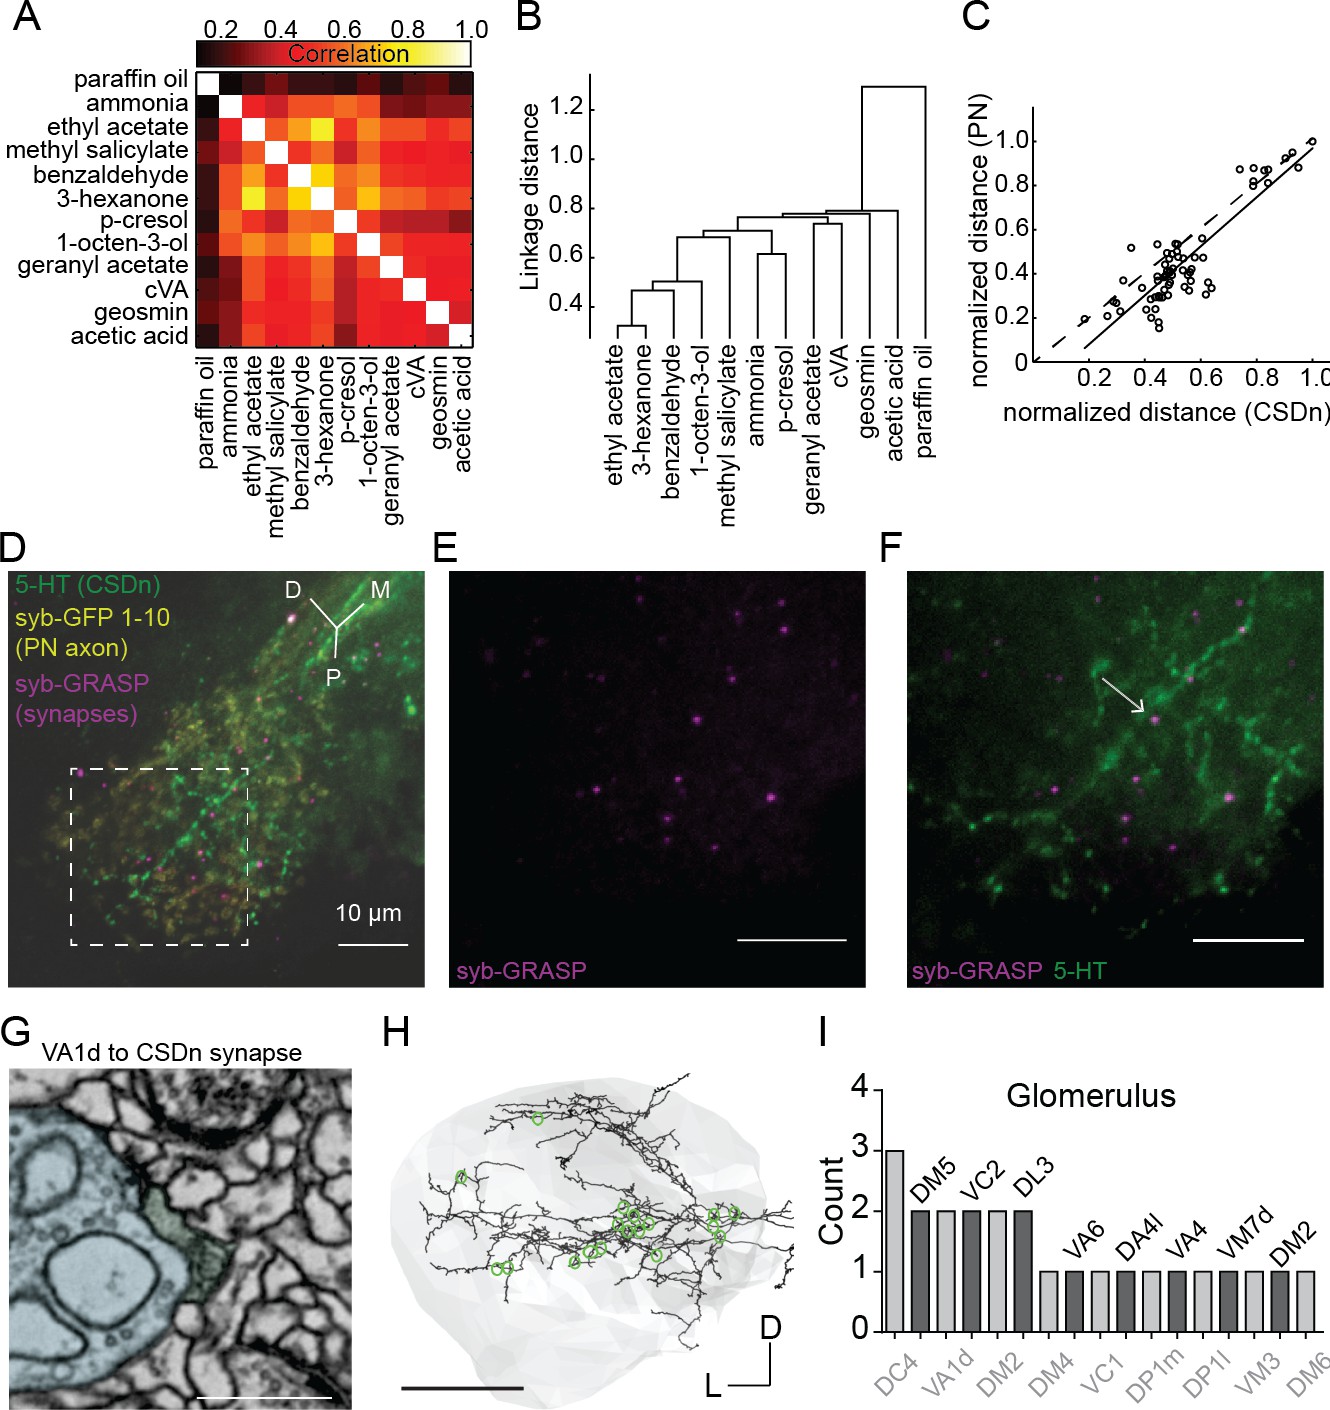
Projection neurons shape CSDn responses in the LH via direct synaptic input.
(A) A cross correlation of the spatial profile of odor responses in CSDn LH processes. (B) Clustering analysis using the Euclidean distance between correlations for odor pairs from (A). (C) Regression analysis on correlation distances between odor responses in processes of the CSDn and PN axons in the LH (R2 = 0.77, p=4.07*10−22, n = 10 preparations for CSDn and n = 5 for PN responses). Distances were normalized to the max distance observed for CSDns and PNs. The 66 open circles represent the distances for each odor pair (12 odors and 66 pairwise comparisons). PN odor responses where measured using GCaMP6s and the GH146-Gal4 promoter. (D–F) GRASP images showing direct synaptic input from PNs onto CSDn terminals. Green = 5 HT antibody to label CSDn processes, yellow = syb GFP subunits 1–10 expressed in PN axons, magenta = syb GRASP labeling of synapses. Scale bars = 20 μm. (G) EM image of a direct VA1d PN synapse onto a CSDn neurite in the AL Scale bar = 500 nm. (H) EM reconstruction of the CSDn (black) arbors in the LH (grey boundary). Location of individual PN synapses onto the CSDn are marked in green. Scale bar = 25 um. (I) A total count of PN synapses onto the CSDn in the LH separated by glomerular identity. Glomeruli are listed above and below bars for clarity. DM2 is represented twice as two synapses arose from one DM2 PN and another synapse was identified from another DM2 PN. Counts taken from one female brain.
Figure 3—figure supplement 1
The axons of projection neurons in the LH have odor specific patterns of activation.
(A) Calcium responses of PN axons in the LH revealed with GCaMP6s and the GH146-Gal4 promoter. PCA analysis shows several unique patterns of activation are required to explain the variance in the data set of odor response. (B) Clustering analysis on the Euclidean distance of correlations across odors in PN responses in the LH (n = 5).
Figure 4 with 2 supplements
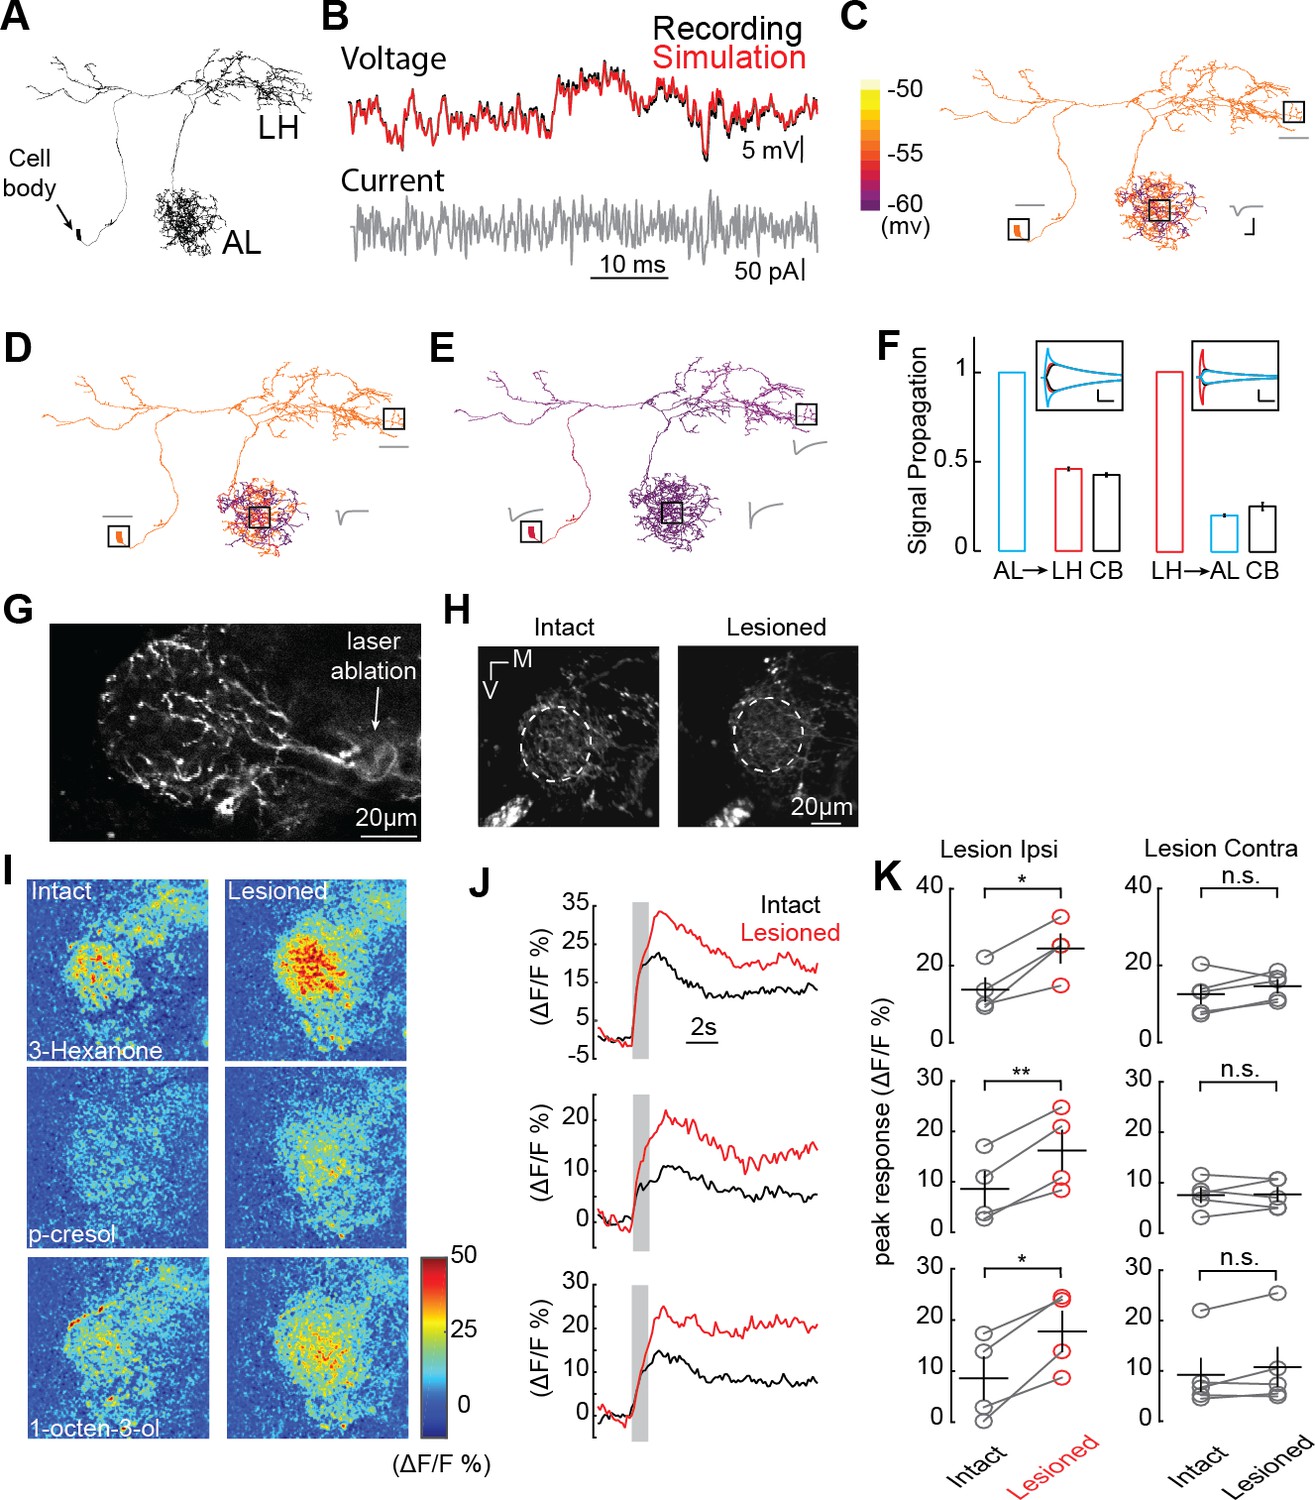
AL inhibition suppresses CSDn responses in the LH.
(A) Morphological EM reconstruction of the CSDn arborizations used for a biophysical model consisting of 6056 compartments. (B) Somatic membrane potential changes in response to a white-noise current injection during an in vivo CSDn recording compared to responses of a passive compartmental model, to the same stimulus, fitted by optimizing three anatomical parameters, Cm (μF/cm2), gleak (S/cm2), and Ra (Ωcm), (C) An example of a model with well-fit somatic responses where a hyperpolarizing current injection in the AL resulted in highly localized voltage changes in AL only. A time series of voltage responses are shown for the soma, AL, and LH as gray traces near those structures. Cm = 4.8, gleak = 3094.3, and Ra = 149.0183. Horizontal scale bar = 5 ms and vertical scale bar = 5 mV. (D) A similar model where injection of the current in the AL causes a voltage change throughout a greater portion of the AL. Cm = 4.8, gleak = 2911.3, and Ra = 28.83. Scale bars as in C. (E) A sample model where current injection into the AL causes both somatic and LH voltage changes. Cm = 1.8,wgleak = 77.33, and Ra = 0.12. See Table 1 for full model properties .Scale bars as in C. (F) The proportion of voltage signal observed in the LH, AL, and cell body (CB) when voltage changes are induced in each region. The same model as in panel E was used to generate the data. Left, voltage steps are induced into the AL and voltage deflections are reported in the LH and CB. Right, voltage steps are induced in the LH and their effects are measured in the AL and CB. Horizontal scale bar = 10 ms and vertical scale bar = 10 mV. (G) A 2P image of basal GCaMP6s signal showing the effects of laser ablation in the CSDn LH neurite. (H) Basal GCaMP6s signals remain in the LH after laser ablation. (I) ΔF/F responses of CSDn neurites in the LH to a set of odorants before and after laser ablation. (J) A times series of the changes in calcium levels in response to odorants in (I). (K) Left, quantification of odor response amplitudes in CSDn LH neurites before and after laser ablation. Right, control responses when the contralateral processes of the CSDn where ablated. Left column, top to bottom, p=0.0187, p=0.0067, p=0.0154; Right column, top to bottom p=0.2298, p=0.8958, p=0.1611. *=p < 0.05, **=p < 0.01, n.s. = not significant and p>0.05, paired Student’s t-tests.
Figure 4—figure supplement 1
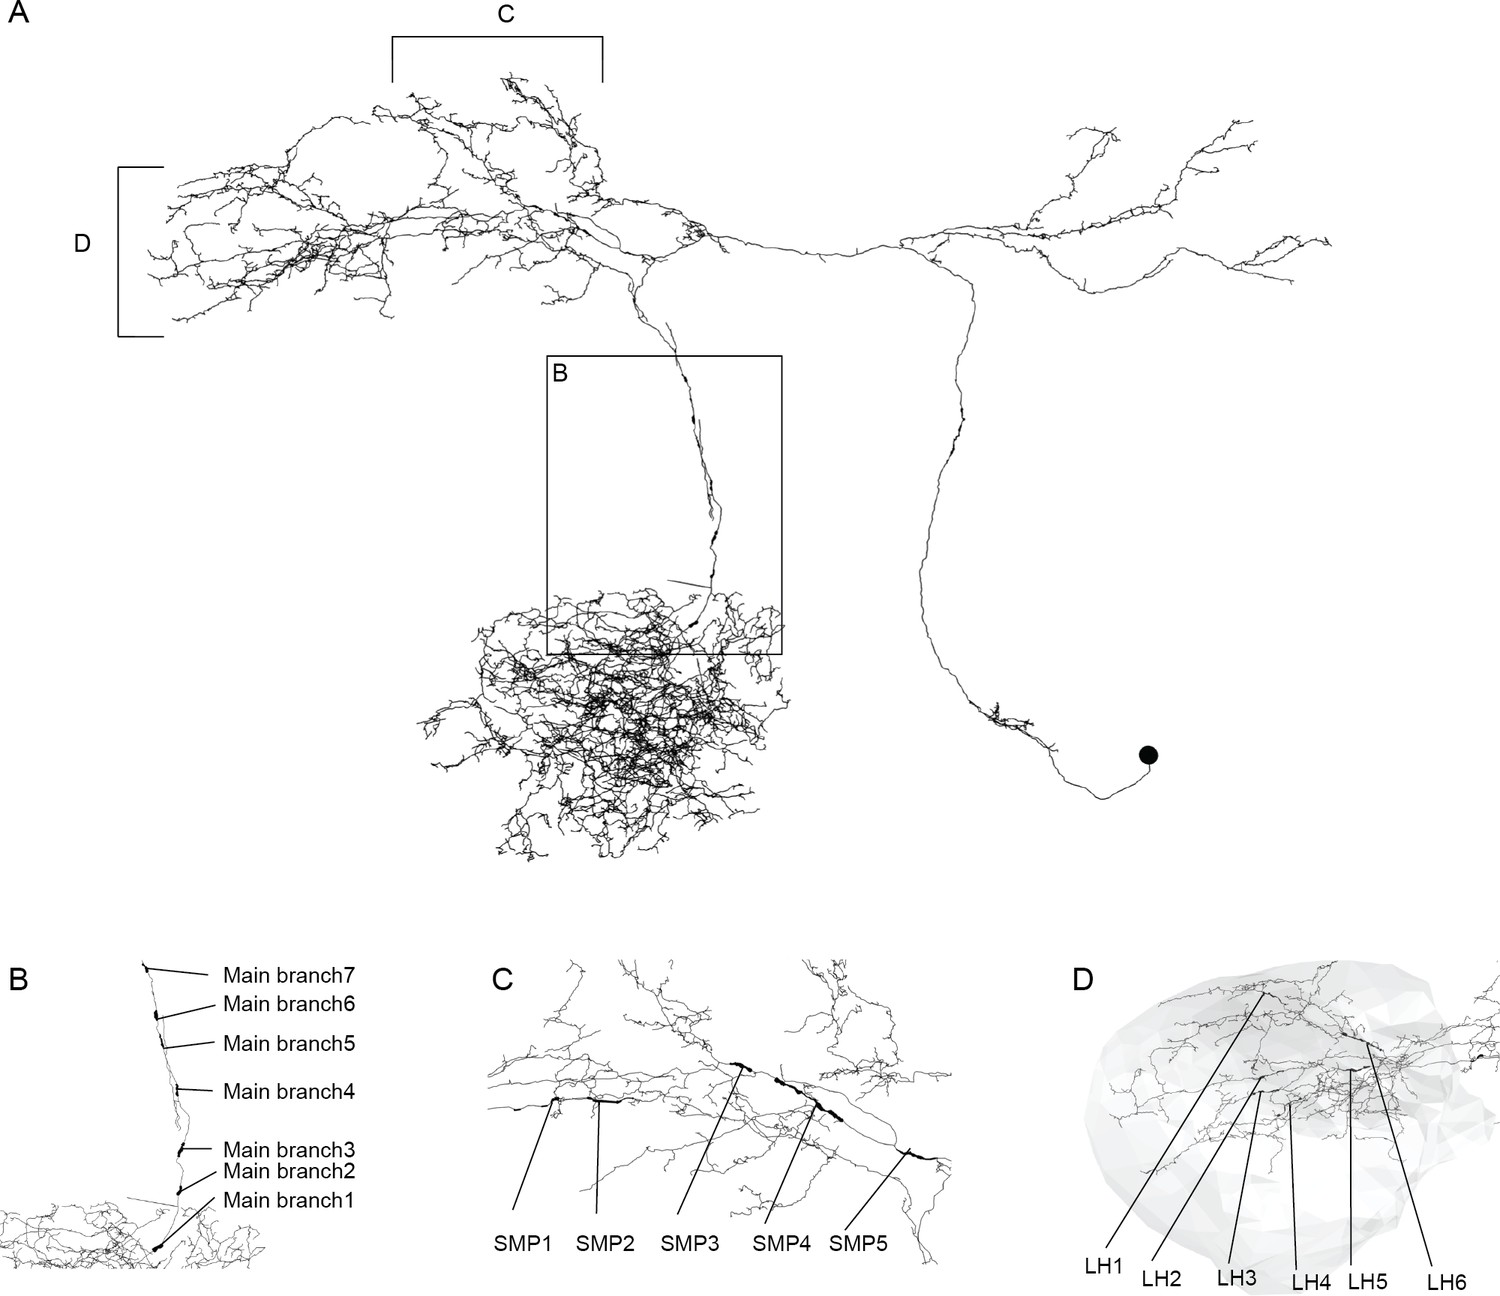
Sampling strategy for measuring CSDn axon radius.
(A) Reconstruction of the CSDn skeleton from the whole brain EM volume. Thickened processes indicate individual sampling locations from which 20–50 measures were taken. Inset box or brackets indicate individual regions from which multiple samples were taken and shown in more detail in subsequent panels. (B) Axon radius sampling locations from the main branch of the CSDn. (C) Sampling locations from the CSDn process passing through the superior-medial protocerebrum (SMP) to the LH. (D) Sampling locations from six separate branches of the CSDn in the LH (boundary shaded in grey).
Figure 4—figure supplement 2
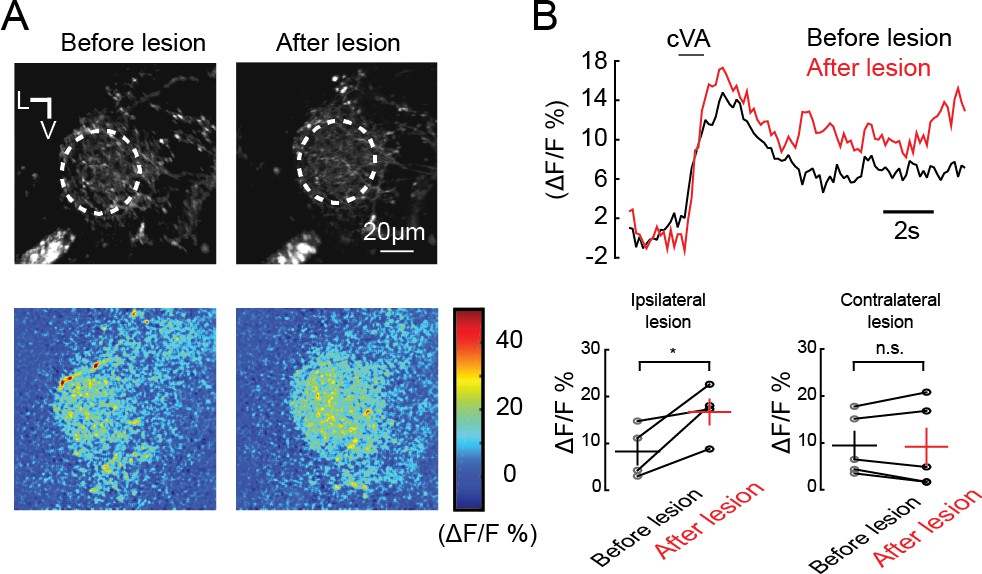
cVA excites CSDn processes in the lateral horn.
(A) Experimental approach as in Figure 4G -K. Top, basal fluorescence of GCaMP6s signal before and after ablation of the processes connecting the AL and LH. Bottom, ΔF/F responses of CSDn neurites in the LH to cVA. (B) Top, a time course of the calcium response to cVA before and after laser ablation. Bottom, quantification of the data in A and B for ipsilateral and contralateral control lesion experiments.
Tables
Table 1
Morphological statistics of CSDn neuron sections used in Figure 4E and F.
https://doi.org/10.7554/eLife.46839.015| L [μm] | Diam [μm] | Area [μm2] | Ri [MΩ] | Cm [pF] | gpas [nS] | |
|---|---|---|---|---|---|---|
| Whole cell | 11031.21 | 0.05 | 1611.09 | 370.28 | 16.11 | 4.26 |
| Cell body | 308.15 | 0.27 | 258.89 | 0.31 | 2.59 | 0.68 |
| LH | 3758.09 | 0.04 | 474.12 | 169.05 | 4.74 | 1.25 |
| AL | 6245.41 | 0.04 | 787.66 | 281.13 | 7.88 | 2.08 |
-
L, total length of section branches; Diam., length-weighted equivalent diameter of section; Area, surface area, Ri, resistance of from beginning to middle of section; Cm, total maximal capacitance of section (does not consider decay of voltage); gpas, total area-scaled leak conductance of the equivalent section.
Additional files
-
Supplementary file 1
A table of the parameters and their values used to construct the passive compartmental model of the CSDn.
- https://doi.org/10.7554/eLife.46839.017
-
Transparent reporting form
- https://doi.org/10.7554/eLife.46839.018
Download links
A two-part list of links to download the article, or parts of the article, in various formats.
Downloads (link to download the article as PDF)
Open citations (links to open the citations from this article in various online reference manager services)
Cite this article (links to download the citations from this article in formats compatible with various reference manager tools)
Local synaptic inputs support opposing, network-specific odor representations in a widely projecting modulatory neuron
eLife 8:e46839.
https://doi.org/10.7554/eLife.46839


