Vasoactive intestinal peptide-expressing interneurons are impaired in a mouse model of Dravet syndrome
- The University of Pennsylvania Perelman School of Medicine, United States
- The Children's Hospital of Philadelphia, United States
Figures
Figure 1 with 3 supplements

VIP-INs express Nav1.1 and are hypoexcitable in Scn1a+/- mice.
(A) Representative traces of layer 2/3 VIP-INs from a Scn1a+/- mouse and age matched WT littermate. Location of scale bar indicates −70 mV. Black indicates rheobase current injection, while gray indicates response to a −50 pA hyperpolarizing and a 2X rheobase suprathreshold current injection. (B) Current/frequency (I-f) output curve of n = 123 VIP-INs from 24 Scn1a+/- mice and n = 150 VIP-INs from 38 age matched WT littermates (See Figure 3—figure supplement 1 for age specific data). Line and shaded area represent mean ± SEM, and the black bar indicates significance at p<0.01 by a multivariate ANOVA and post-hoc Bonferroni correction. (C) Population average of spike amplitude (AP peak – AP threshold) of repeated action potentials measured at 3X rheobase for each cell. Line and shaded area represent mean ± SEM. The black bar indicates significance at p<0.01 by a multivariate ANOVA and post-hoc Bonferroni correction. (D) Bar graphs showing individual cell values (dots) and the population mean ± SEM for the maximal steady-state firing frequency of each cell (see Materials and methods). p values determined by Mann–Whitney U test. (E) Bar graphs showing individual cell values (dots) and the population mean ± SEM for the reduction in spike amplitude of the tenth AP measured in B normalized to the first AP. p values determined by Mann–Whitney U test. All comparisons consider each cell as n = 1 (see Table 1 for per-animal comparisons). (F) Example images of WT VIP-INs showing immunohistochemical labeling of Nav1.1 on putative axons originating either from the soma (i, inset iii) or a proximal dendrite (ii, inset iv). Asterisks indicate regions of colocalization between Nav1.1 and tdT expression in VIP-INs. Scale is 5 μm.
Figure 1—figure supplement 1
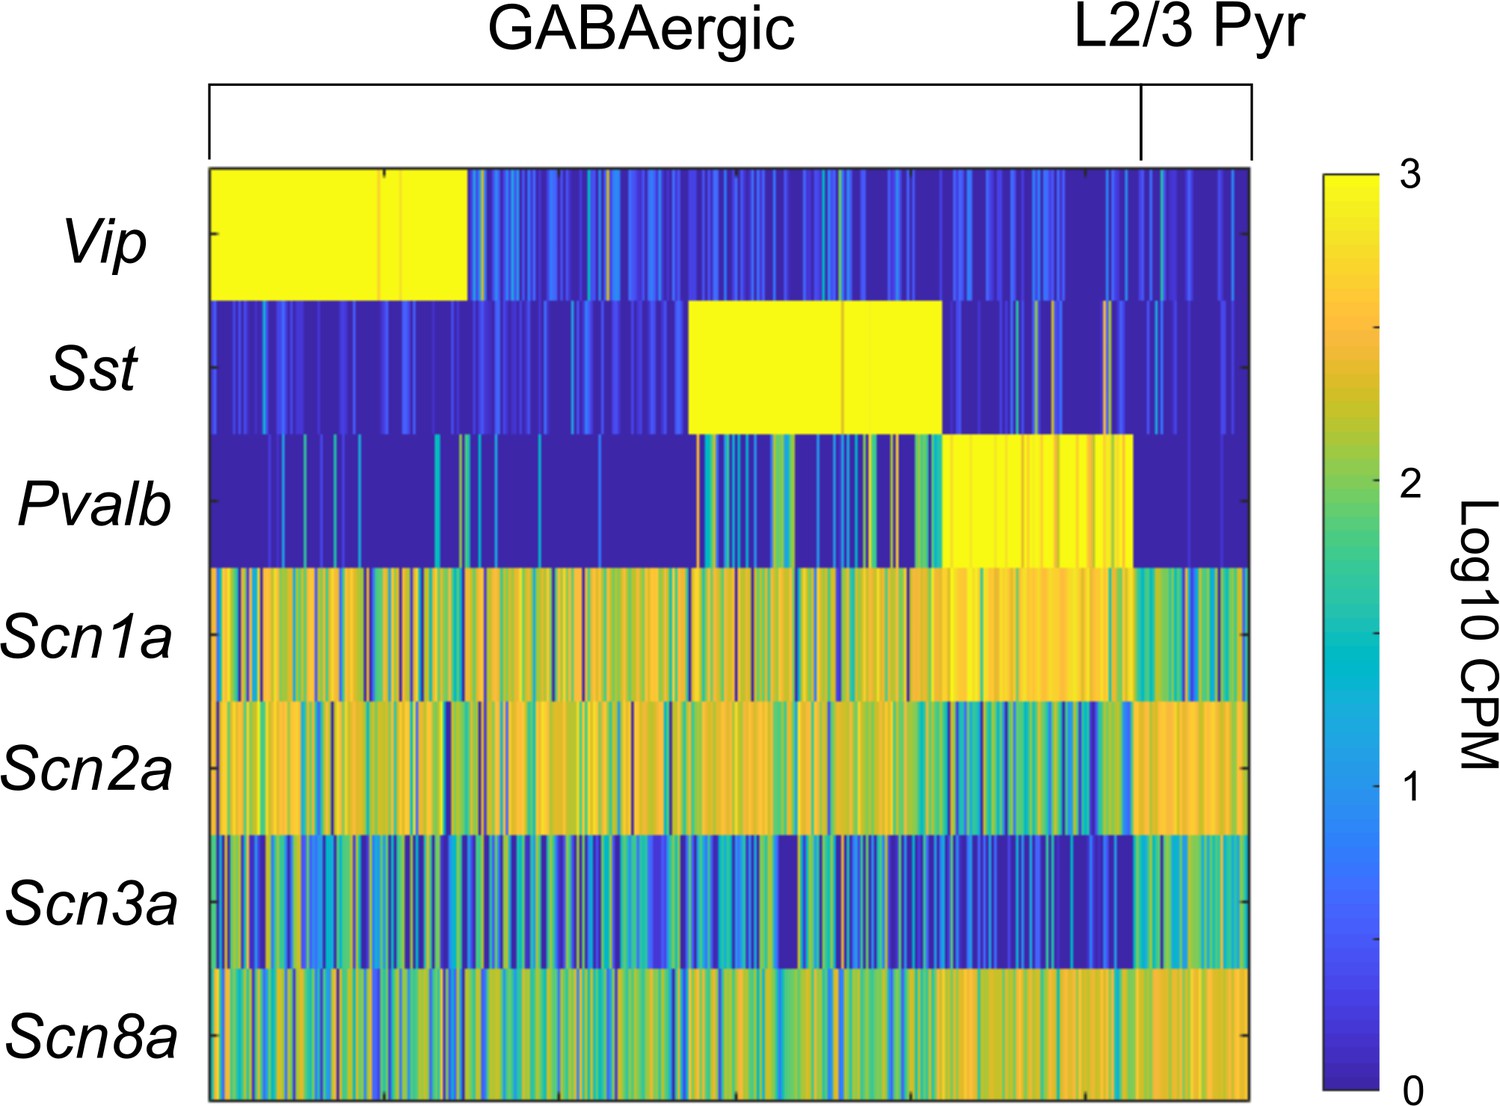
Scn1a expression in VIP-INs.
(A) Data from the Allen cell types database, celltypes.brain-map.org/rnaseq which includes 14,249 cells from the primary visual cortex and 9,573 cells from the anterior lateral motor cortex (see Materials and methods). Heat map indicating ScnXa RNA transcript levels in counts per million (CPM) for all GABAergic neurons and excitatory pyramidal cells in layer 2/3. Each vertical bar represents a single cell. Data was sorted based on expression of Vip, Sst, and Pvalb (PV). Scn1a is expressed in all GABAergic INs, including VIP-INs, with highest expression in PV-INs. PV-INs also express Scn8a at higher levels than Scn2a, while other INs preferentially express Scn2a in addition to Scn1a. Pyramidal neurons show highest expression of Scn2a and Scn8a, with relatively limited expression of Scn1a and Scn3a.
Figure 1—figure supplement 2

Localization of Nav1.1 on VIP-IN axons.
(A) tdT and Nav1.1 signals were measured through a cross sectional line-scan of 30 VIP-IN axons from n = 3 adult WT.VIP-Cre.tdT mice, and divided into positive and negative axons based on a cutoff of the mean + 2 SD of the Nav1.1 signal level. Each signal is normalized individually to the max fluorescent intensity within each line scan. Axons were determined by morphological criteria, having a thin (0.5 μM) profile and large branching angles. (B) Proportions of VIP-INs that had positive (23/30; 77%) and negative (7/30; 23%) Nav1.1 expression on an identifiable axon. All ‘negative’ VIP-INs are from the same field of view as at least one ‘positive’ VIP-IN.
Figure 1—figure supplement 3
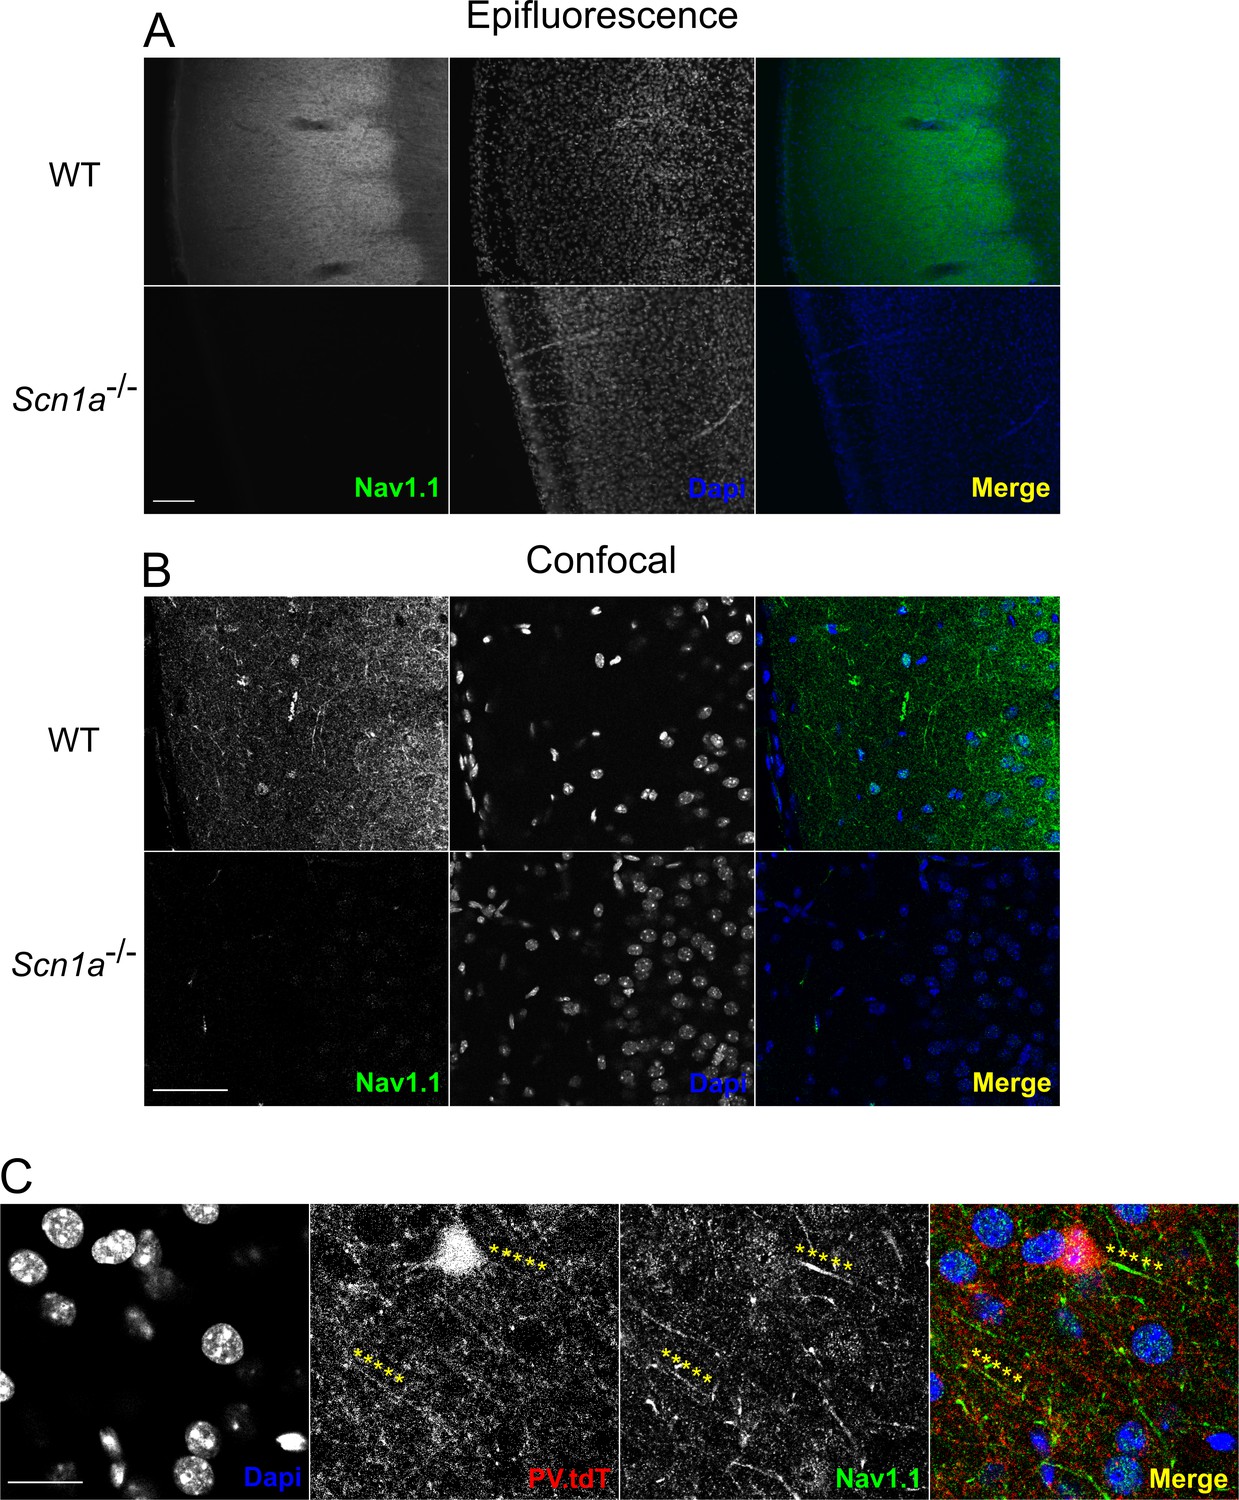
Validation of Nav1.1 staining.
(A) Epifluorescence photomicrographs depicting Nav1.1 immunohistochemistry in a representative adult WT and P13 Scn1a-/- mouse. Nav1.1 signal is most intense in layer 4 of the barrel cortex. There is no detectable signal in Scn1a mice using identical conditions. Note the apparent difference in Dapi staining is due to the age difference between WT and Scn1a+/- samples. Scale bar = 100 µM. (B) Confocal microscopy of the same experiment as in A. Nav1.1 signal in layer 2/3 is more sparse than in layer 4, but many individual processes can be resolved. Essentially no signal is present in the Scn1a-/- sample. Scale = 50 µM. For A and B, images are representative of n = 3 mice for each group with at least two technical replicates for each animal. (C) Nav1.1 immunohistochemistry in a WT.PV-Cre.tdT mouse showing co-labeling of Nav1.1 on a layer 4 PV-IN axon initial segment, as well as at a distal (presumptively nodal) portion of a PV-IN axon. Scale = 10 µM.
Figure 2 with 2 supplements
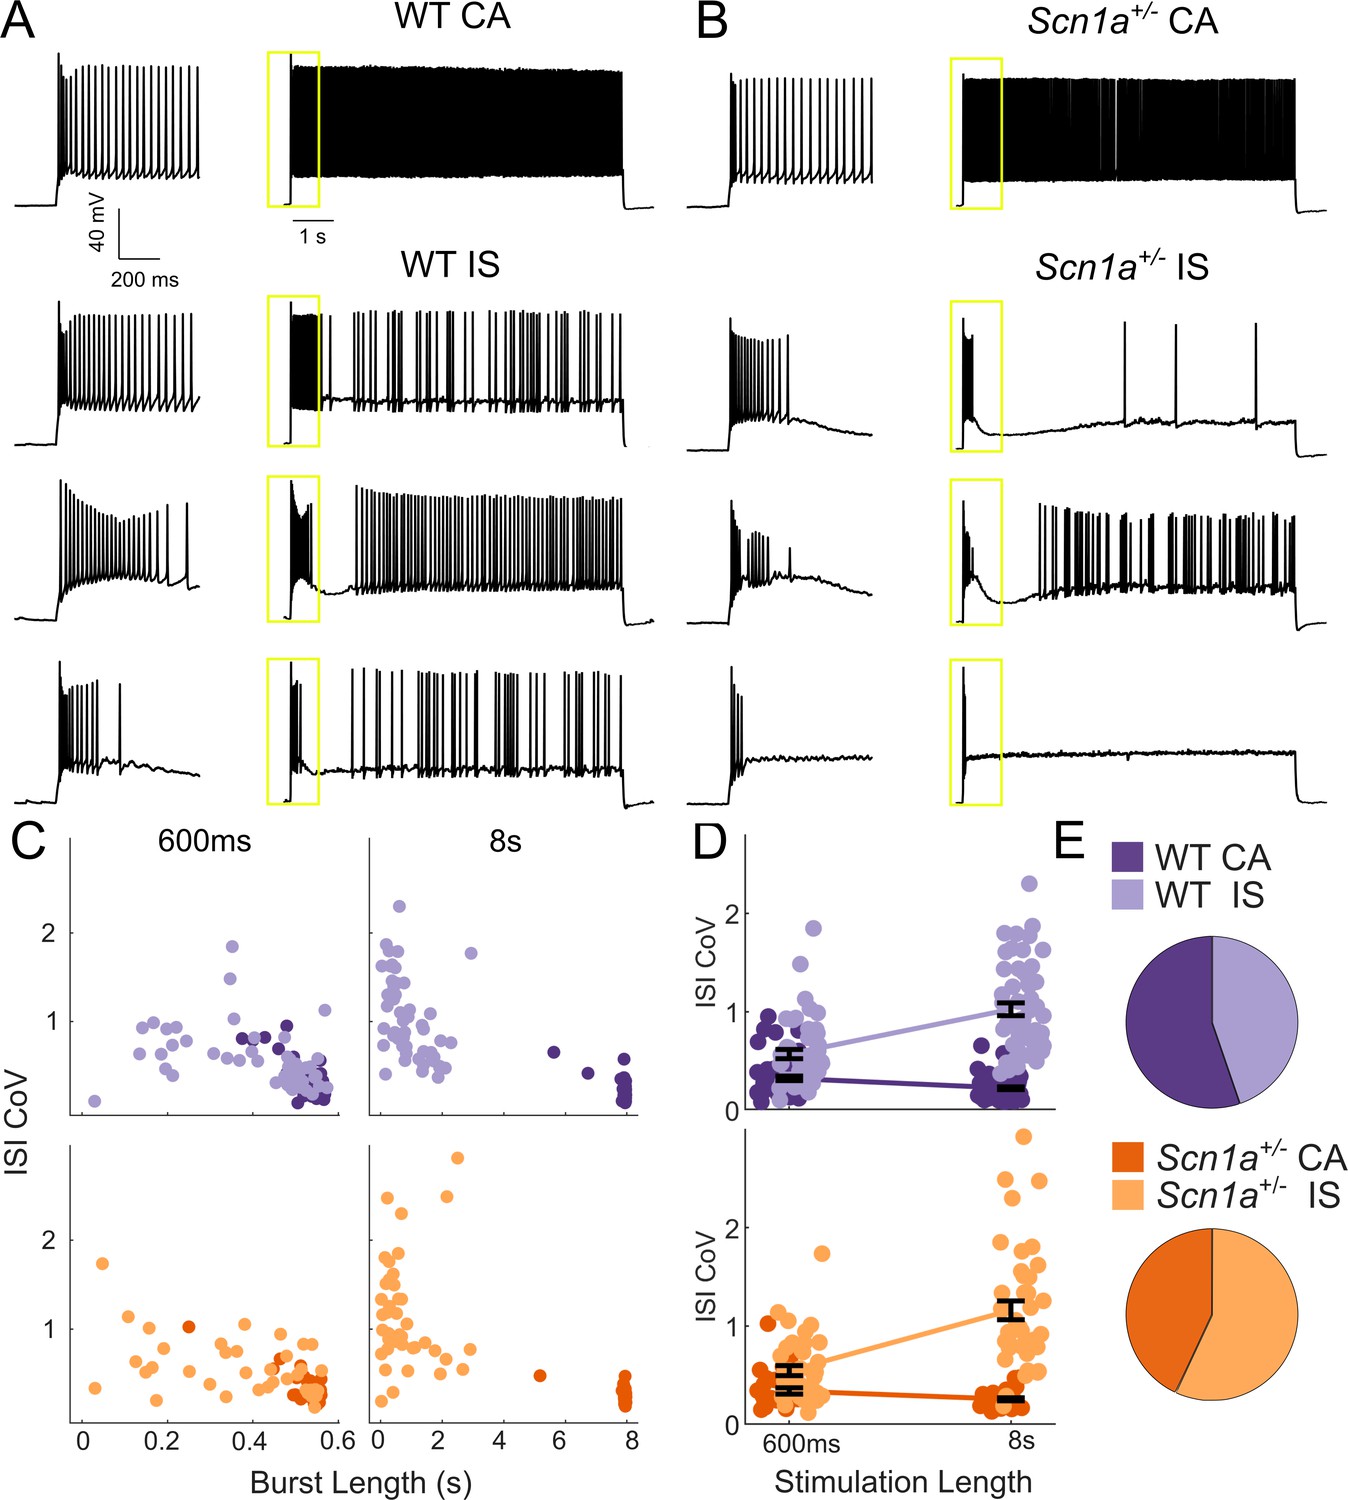
Two VIP-IN firing patterns revealed with long depolarization.
(A) Four representative cells displaying the range of VIP-IN firing patterns. On the left are APs elicited with a standard (600 ms) current injection. On the right are firing patterns recorded with 8 s long depolarizations using the same current amplitude as on the left (2X rheobase for each cell). CA and IS firing patterns are easily separated with 8 s depolarization, but not distinguishable using only the first 600 ms. These firing patterns were consistent even when we stimulated with higher current injections (see Figure 3Aii–iii). (B) Similar CA and IS patterns were observed in VIP-INs from Scn1a+/- mice, with a deficit in IS VIP-IN firing. (C) Characterization of VIP-IN firing patterns using two key measures: the length of the initial burst of action potentials, and the coefficient of variation of the inter-spike interval (ISI CoV). These parameters were measured using either 600 ms or 8 s long rectangular depolarization in cells from both WT and Scn1a+/- mice; then, k-means clustering of the 8 s data was performed (light/dark colors indicating the results of clustering into two groups). Note the clear separation between the two groups in the 8 s data, but large overlap when looking only at data generated from 600 ms current injections. (D) The same data as in C, but highlighting the dependence of the measured ISI CoV on the length of the depolarization. With 600 ms sweeps, there is considerable overlap between CA and IS cells in both genotypes; however, with 8 s depolarizations, the two groups separate with minimal overlap. (E) Similar proportions of CA and IS cells in WT and Scn1a+/- mice. For C-E, n = 51 IS and 63 CA from 24 WT mice, and n = 41 IS and 31 CA from 17 Scn1a+/- mice; p=0.10 via chi-square test; chi-square statistic = 2.63.
Figure 2—figure supplement 1
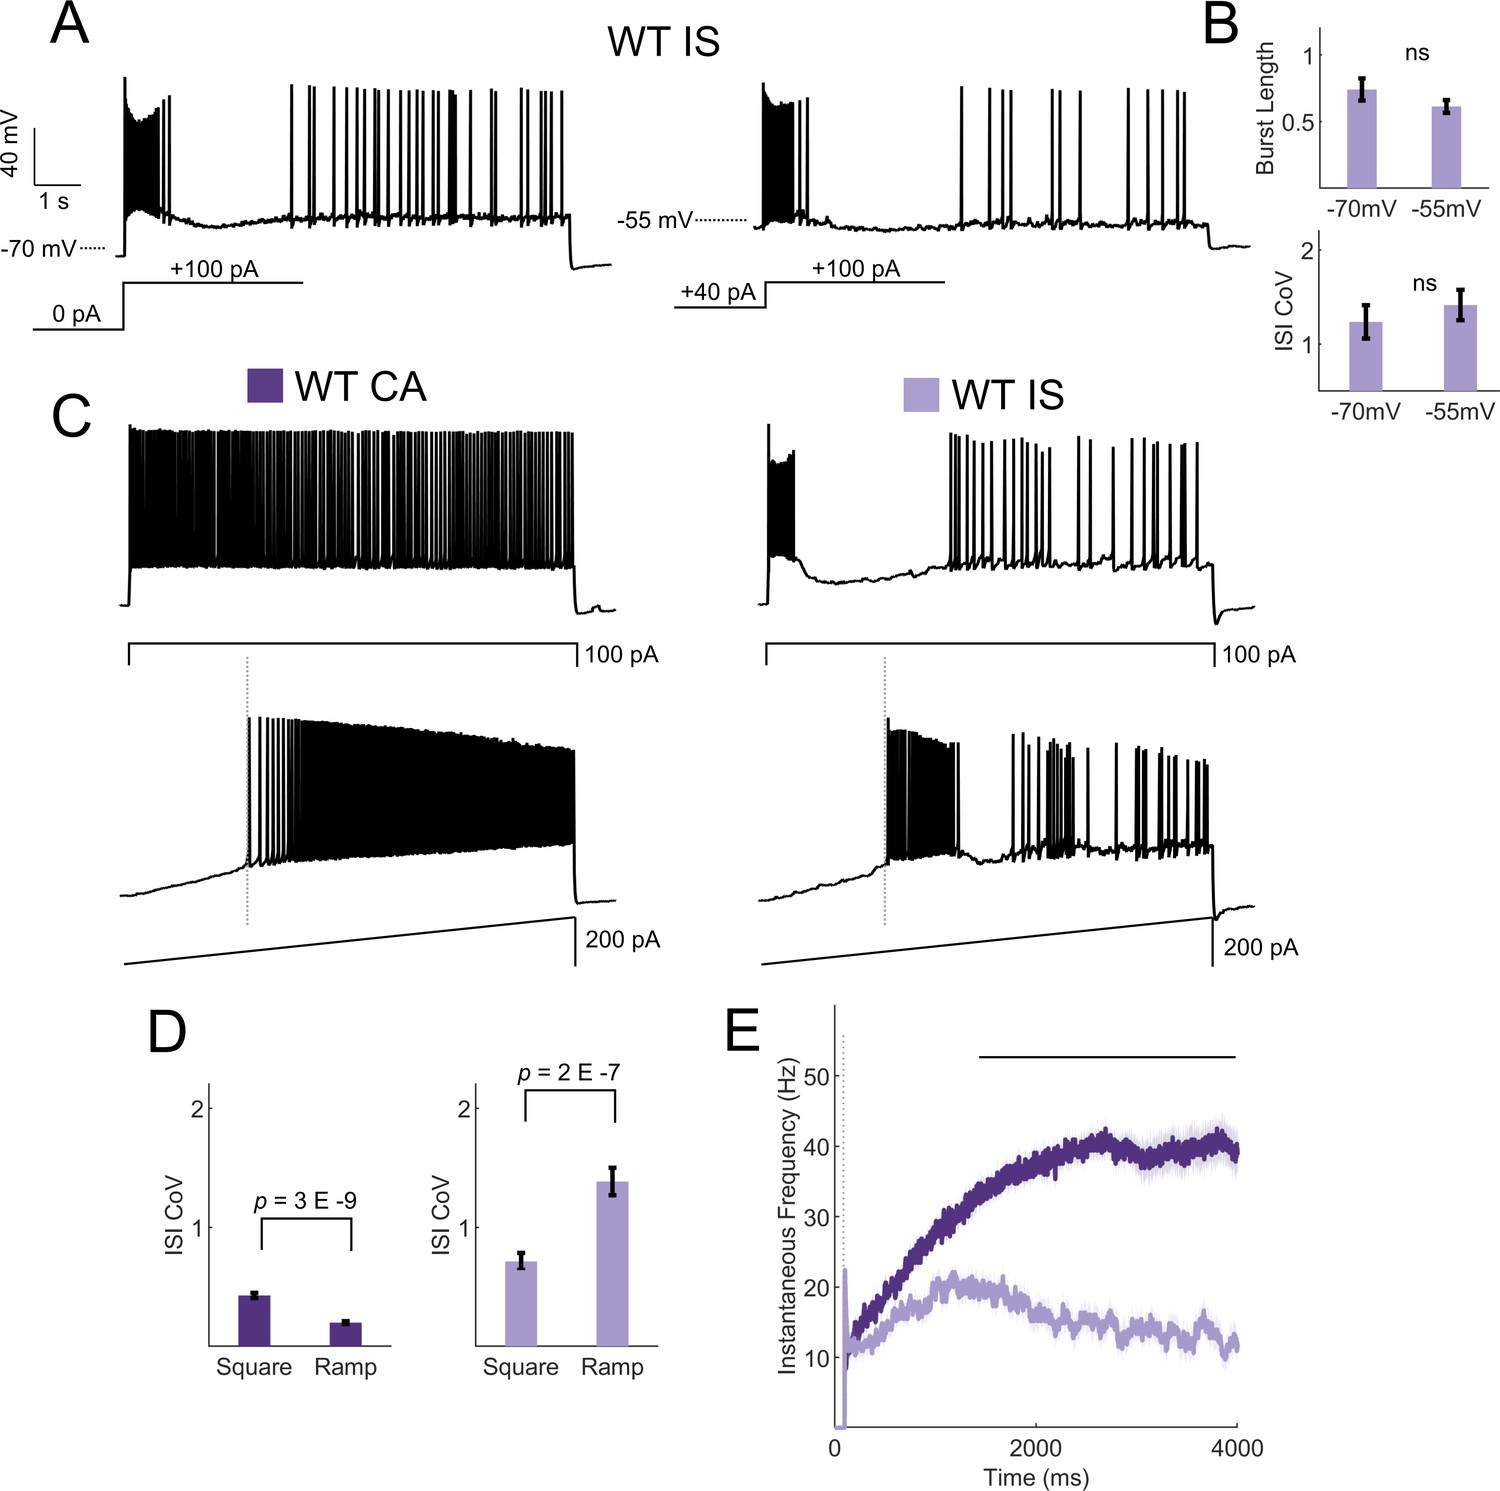
IS VIP-IN firing patterns are robust to a variety of stimulation methods.
(A) Shown is the firing pattern elicited in response to an 8 s square depolarization from an IS VIP-IN. When the resting membrane potential is depolarized with a DC offset (to −55 mV), IS VIP-INs show nearly identical firing patterns to that seen in response to suprathreshold stimulation from rest. (B) Quantification of firing patterns of n = 16 WT IS VIP-INs from eight mice shows no change in either the initial burst length or the ISI CoV in response to prepulse depolarization. (C) Example traces from a CA VIP-IN and IS VIP-IN in response to either a square 8 s current injection or a slow ramp injection with max amplitude of 200 pA. IS VIP-INs were equally distinguishable using ramp current injections. (D) Quantification of the measured ISI CoV using either a square or ramp current injection. CA VIP-INs had a smaller ISI CoV (more regular) with ramp currents, while IS VIP-INs fired with an even more irregular pattern; p-values determined by paired student’s t-test. n = 33 IS VIP-INs from 13 mice and n = 32 CA VIP-INs from 11 mice. (E) Quantification of the instantaneous firing frequency during ramp current injections to 200 pA calculated with a 20 ms sliding average and aligned to the onset of firing for each cell (dashed line in C and E). CA VIP-INs show a typical saturating input/output relationship, while IS VIP-INs show highly non-linear responses, often with initial bursting. Line and shaded area represent mean ± SEM, and bar indicates significance at p<0.001 by a multivariate ANOVA and post hoc Bonferroni test.
Figure 2—figure supplement 2
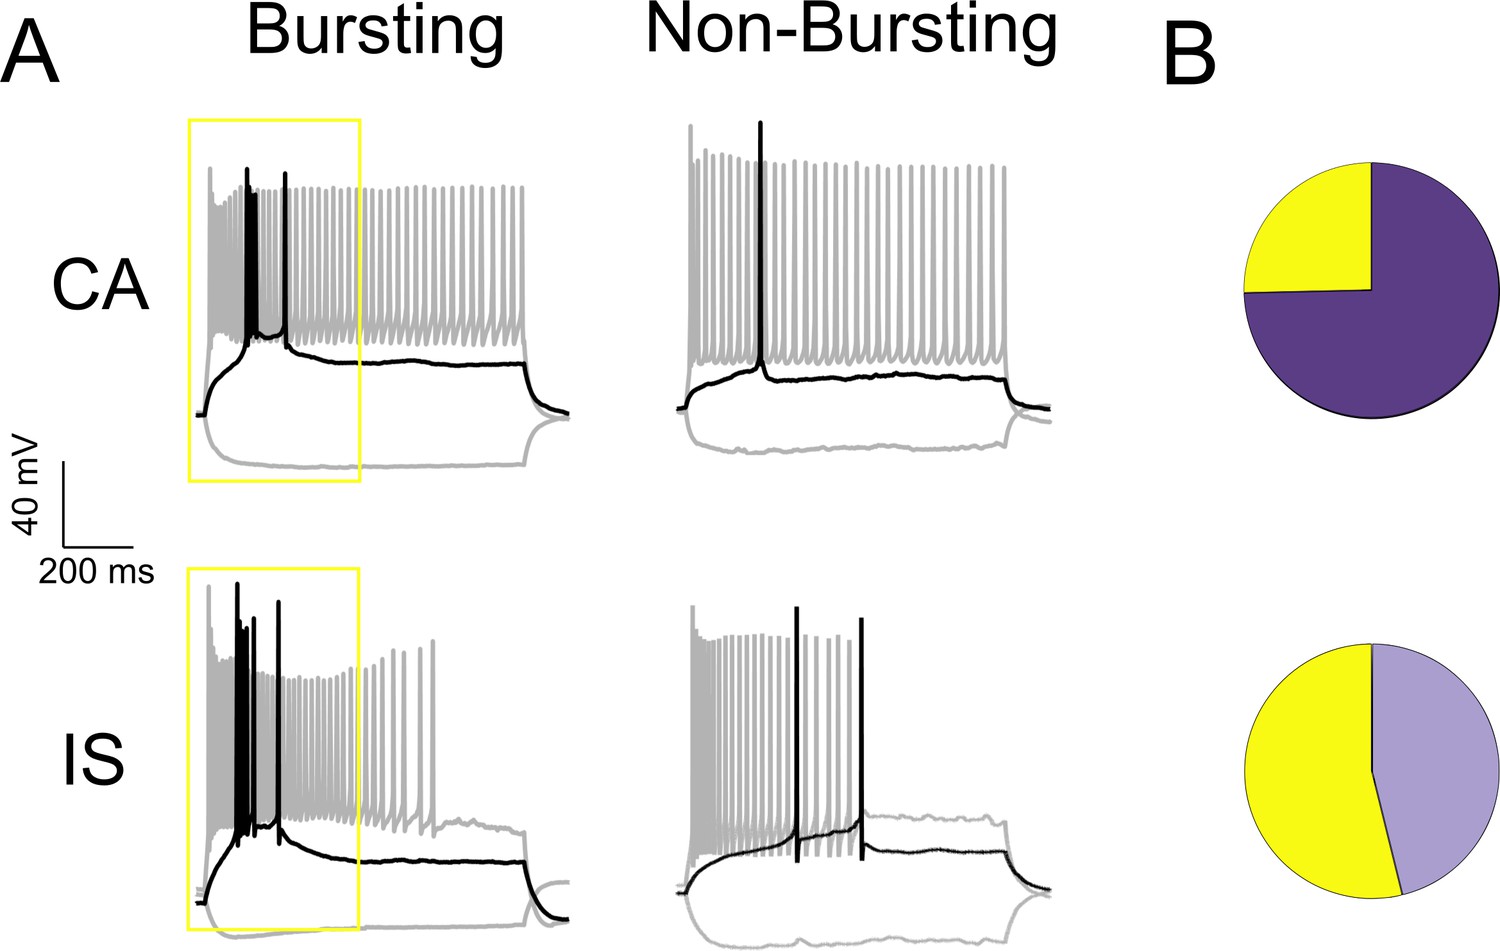
A subset of both CA and IS VIP-INs show bursting at rheobase.
(A) Examples of CA and IS VIP-INs with and without bursting at rheobase with an intra-burst frequency > 100 Hz. Black trace indicates response to a rheobase current injection, and gray to a 3X rheobase suprathreshold current injection. B)Relative proportions of CA (18/71) and IS (42/78) VIP-INs in WT.VIP-Cre.tdT mice that are bursting at rheobase (yellow = bursting, p<0.001 via chi-square test).
Figure 3 with 2 supplements

IS VIP-INs are preferentially impaired in Scn1a+/- mice.
(A) (i) Example traces of CA and IS VIP-INs from WT and Scn1a+/- mice, showing responses at −50 pA hyperpolarizing (gray), rheobase (black), and 2X rheobase current injections (gray; typically ~ 100–140 pA). (ii) Raster plots of all APs elicited with standard 600 ms current steps in 10 pA increments for the cells in i. (iii) Population averages of the raster plots in ii, represented as heat maps where the color corresponds to the instantaneous firing rate for each give current step using a 20 ms sliding average. (B) Current/frequency (IF) plots for groups shown in A. Line and shaded area represent mean ± SEM. Bar indicates significance at p<0.001 by a multivariate ANOVA and post-hoc Bonferroni correction. (C) Population average of AP amplitude for repeated action potentials elicited at 3X rheobase for each cell. Line and shaded area represent mean ± SEM. Bar indicates significance at p<0.001 by a multivariate ANOVA and post-hoc Bonferroni correction. (D) Bar graphs showing individual cell values (dots) and the population mean ± SEM for several markers of VIP-IN excitability. p values determined by Kruskal-Wallis with post-hoc Dunn’s test. For simplicity, differences between CA an IS cells are not shown (see Table 1). For B-D, n = 71 IS and 78 CA cells from 32 WT mice, and n = 66 IS and 43 CA cells from 22 Scn1a+/- mice were included. All groups were determined using 8 s square (Figure 2) or ramp depolarizations (Figure 2—figure supplement 1) or, for a subset of IS VIP-INs for which we did not record 8 s depolarizations, if their definitive firing pattern was clear with a 600 ms depolarization (as in Ai). Data for each cell are available in Figure 3—source data 1.
-
Figure 3—source data 1
VIP-IN neurophysiological data.
- https://doi.org/10.7554/eLife.46846.012
Figure 3—figure supplement 1
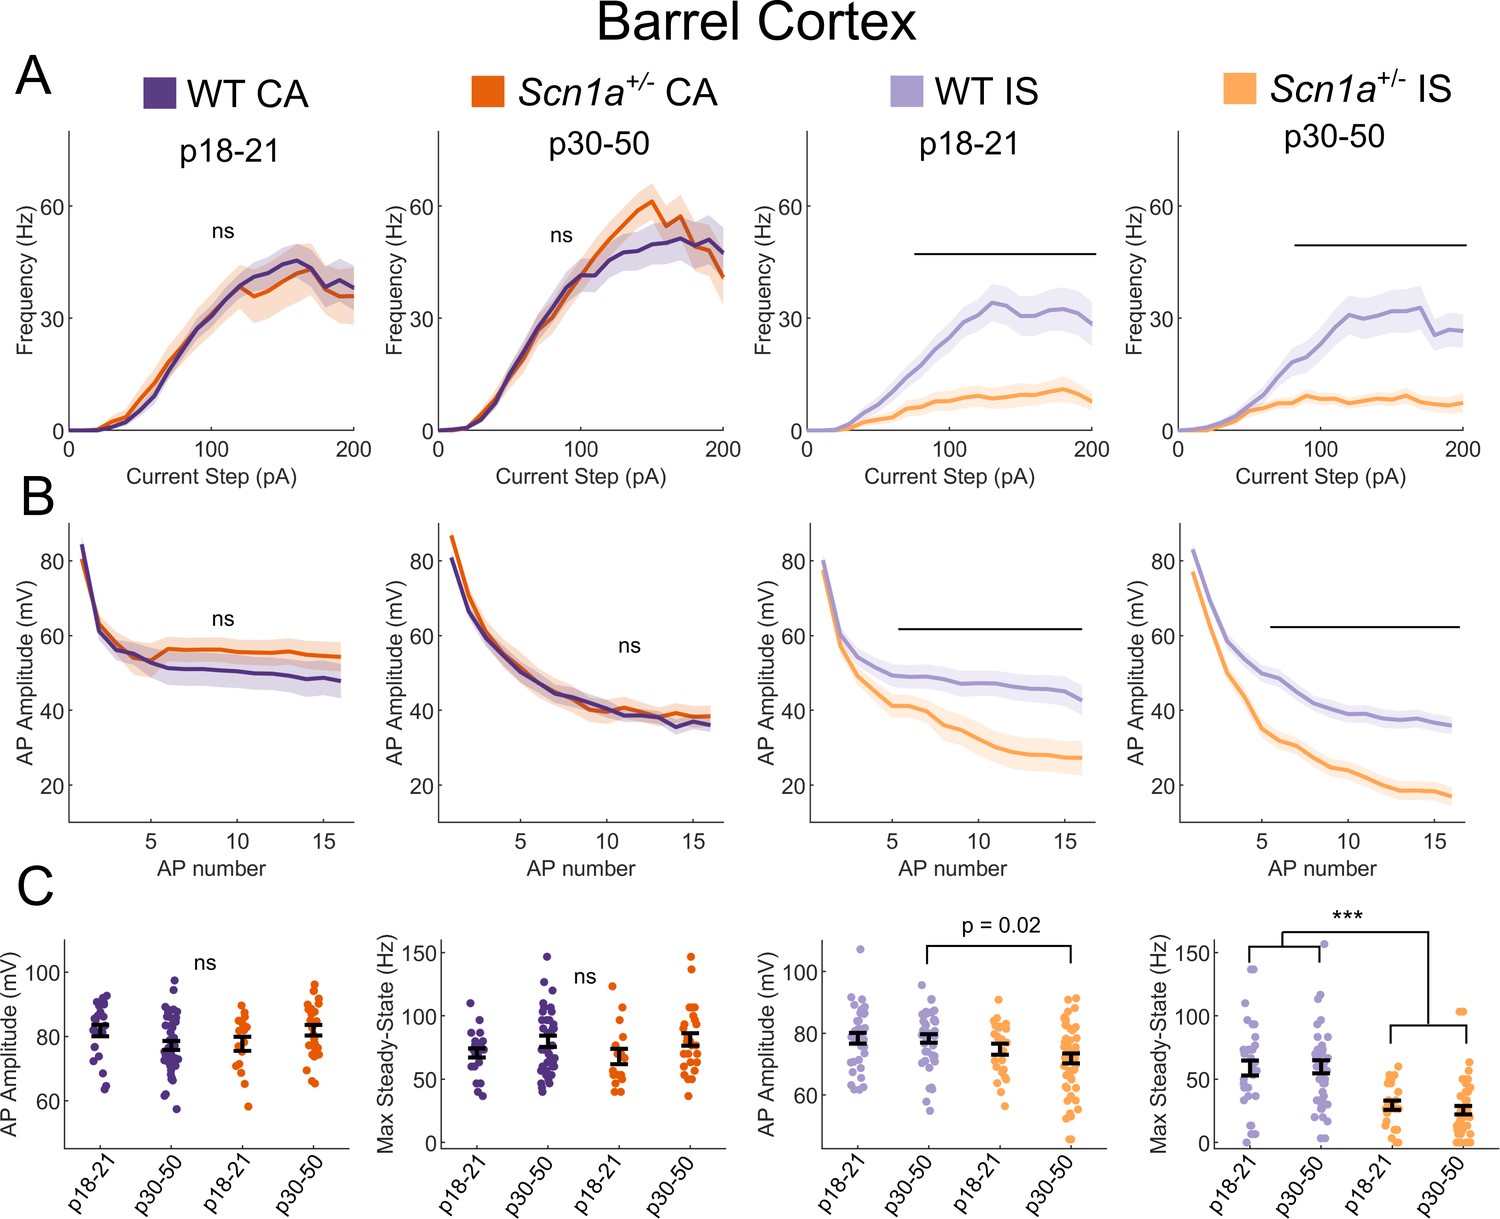
IS VIP-IN deficits in Scn1a+/- mice are consistent across development.
(A) IF curves of CA and IS VIP-INs in the two indicated age ranges. Line and area represent mean ± SEM, and bar indicates significance at p<0.01 by a multivariate ANOVA and post hoc Bonferroni test. (B) Spike amplitude rundown of the same groups in A. Amplitude of repeated action potentials was measured at 3X rheobase for each cell. Line and area represent mean ± SEM, and bar indicates significance at p<0.01 by a multivariate ANOVA and post hoc Bonferroni test. (C) Individual cells (dots) and population mean ± SEM (error bar); p values determined by a Kruskal-Wallis with post hoc Dunn’s test; ***, p<0.001. For A-C, n = 23|42 (P18|P30) CA and 34|44 (P18|P30) IS cells from 32 WT mice, and n = 17|27 (P18|P30) CA and n = 24|50 (P18|P30) IS cells from 23 Scn1a+/- mice, were included.
Figure 3—figure supplement 2
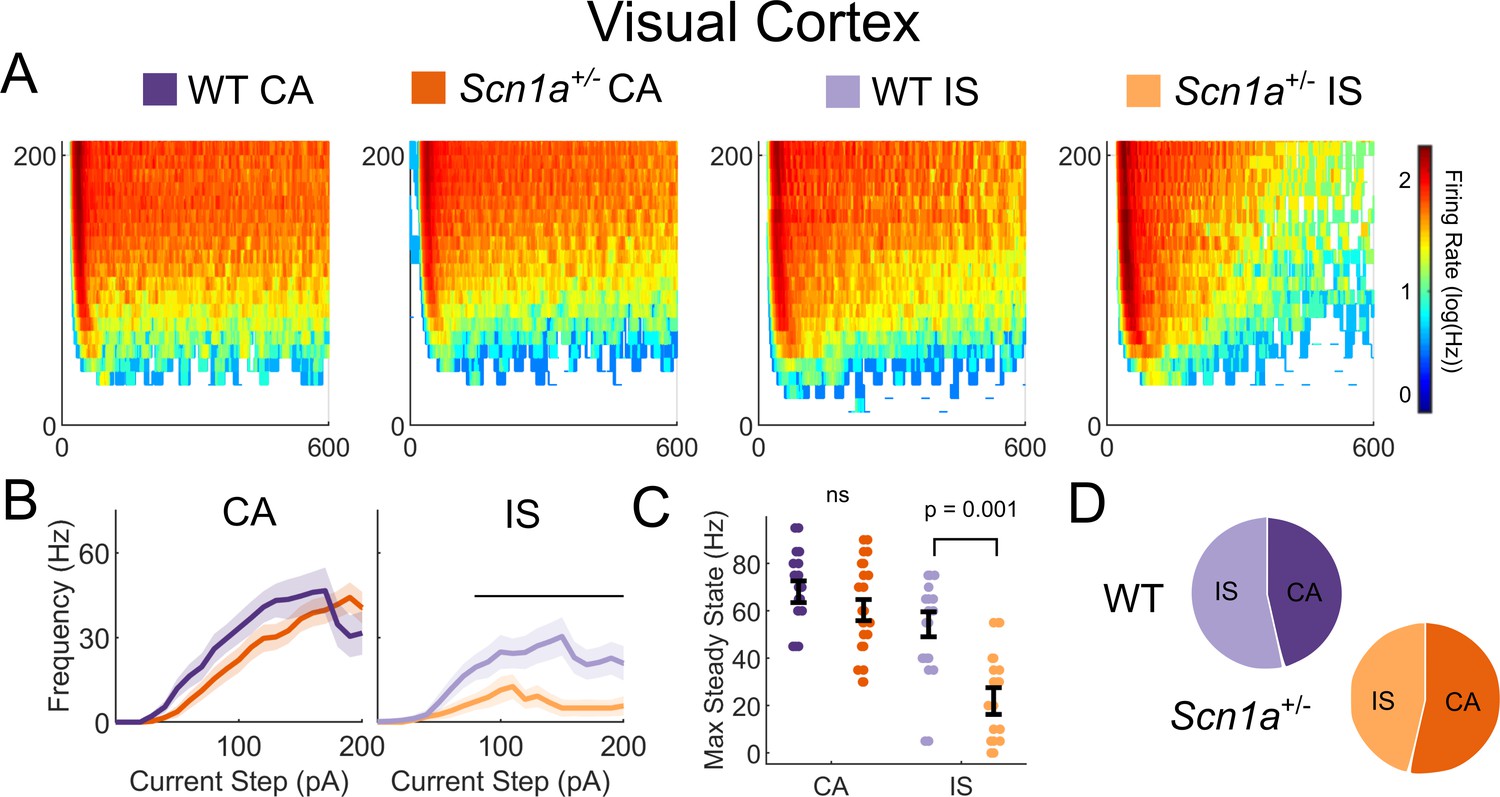
IS VIP-IN deficits in Scn1a+/- mice are consistent across cortical areas.
(A) Heat maps of VIP-IN from primary visual cortex (V1) firing in response to 600 ms test pulses at 10 pA increments (compare to Figure 3Aiii). (B) IF curves of CA and IS VIP-INs from V1 showing near identical results to barrel cortex. Line and area represent mean ± SEM, and bar indicates significance at p<0.05 by a multivariate ANOVA and post hoc Bonferroni test. (C) Individual cells (dots) and population mean ± SEM (error bar); p values determined by a Kruskal-Wallis with post hoc Dunn’s test. (D) Relative proportions of CA and IS cells in V1 (compare to Figure 2E). A total of n = 13 CA and 15 IS VIP-INs from 4 WT.VIP-Cre.tdT mice and n = 15 CA and 13 IS VIP-INs from 6 Scn1a.VIP-Cre.tdT mice were included.
Figure 4 with 1 supplement

Hm1a application modulates Na+ channels containing Nav1.1 subunits in VIP-INs and recovers IS VIP-IN hypofunction in Scn1a+/- mice.
(A) Example traces from recordings of representative CA and IS VIP-INs from Scn1a. VIP-Cre.tdT mice, as well as a PV-IN and pyramidal neuron from a Scn1a.PV-Cre.tdT mouse, before and after bath application of 1 μM Hm1a at a 3X rheobase (near maximal) current injection for each cell. Note that the horizontal scale for the PV-IN is 100 ms instead of 200 ms, to facilitate visualization of individual APs. (B) Change in the max steady state firing frequency of n = 9 CA VIP-INs, 7 IS VIP-INs, 6 PV-INs, and three pyramidal neurons from a total of 5 Scn1a.VIP-Cre.tdT and 2 Scn1a.PV-Cre.tdT P18-21 mice, with p values and significance determined using a paired students’ t-test. (C) Spike amplitude of successive APs elicited at 3X rheobase for each cell. Line and shaded area represent mean ± SEM, and bar indicates significance at p<0.01 via a multivariate ANOVA and post-hoc Bonferroni correction. (D) Example traces from voltage clamp recordings of VIP-INs from acutely dissociated cortex of P18 WT.VIP-Cre.tdT mice. Light gray shows the initial transient sodium current recorded with a single voltage command step from −80 mV to 0 mV. Black shows the response following bath application of 500 nM Hm1a. The dashed line indicates the inset (shown on the right). There is no change in the peak amplitude, but clear slowing of inactivation. (E) Example differential interference contrast image of a dissociated VIP-IN, as well as the tdT signal imaged with epifluorescence. VIP-INs had small bipolar or rounded shapes. Scale = 5 μM. (F) Quantification of the effects of Hm1a on n = 3 VIP-INs from 2 P18 WT.VIP-Cre.tdT mice. Purple lines represent the change of each individual cell, with p values determined by a paired students’ t-test.
Figure 4—figure supplement 1
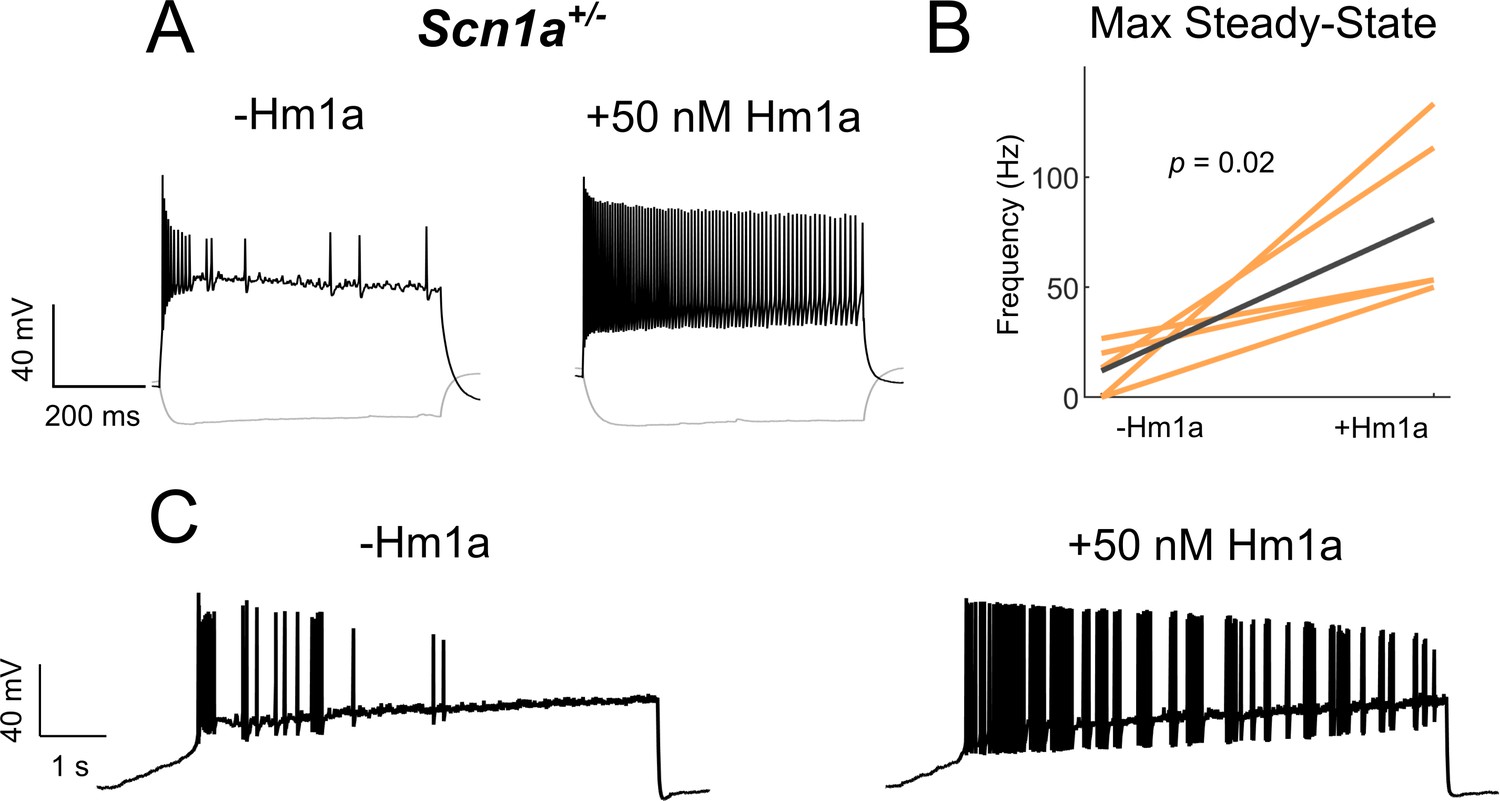
Effects of low concentration Hm1a on IS VIP-IN firing.
(A) Example traces from recordings of a representative IS VIP-IN from an Scn1a. VIP-Cre.tdT mouse before and after bath application of 50 nM Hm1a at a 3X rheobase current injection. (B) Summary data showing an increase in maximal steady-state firing frequency with application of 50 nM Hm1a. n = 5 VIP-INs from three Scn1a.VIP-Cre.tdT mice; p values determined by a paired student’s t-test. C)8 s ramp depolarization with an amplitude of 200 pA of the IS VIP-IN from panel A. While Hm1a greatly increases firing frequency, IS VIP-INs retain a distinct irregular spiking firing pattern.
Figure 5
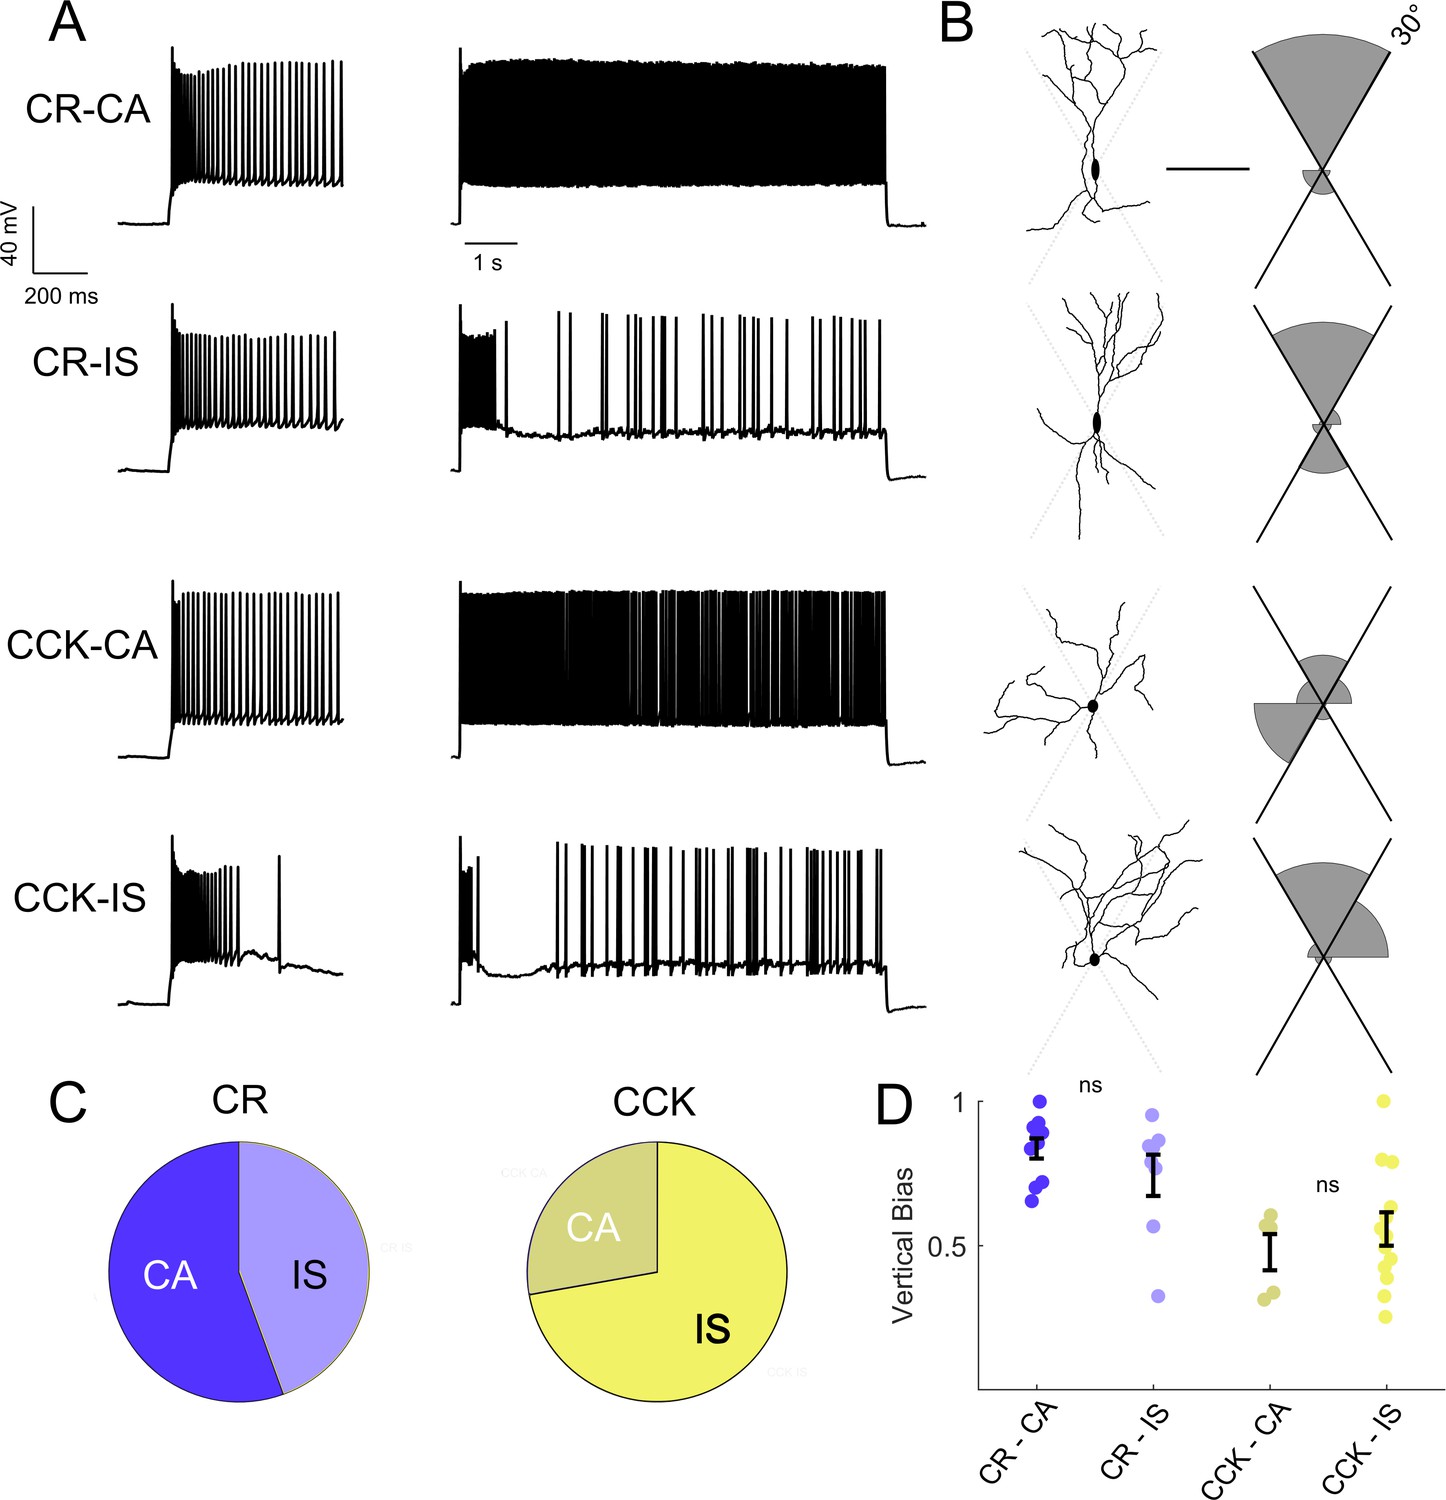
Intersectional expression of CR and CCK labels anatomical subsets of VIP-INs but does not correlate with IS vs.CA firing patterns.
(A) Example traces from layer 2/3 VIP-INs in barrel cortex of adult CR-Cre/VIP-Flp and CCK-Cre/VIP-Flp mice. Both CA and IS firing patterns were observed in each intersectional population of VIP-INs. Insets on the left show the first 600 ms of each 8 s depolarization. (B) Morphological reconstruction of the proximal dendrites of the cells in A to illustrate dendritic orientation. Scale is 100 μm. The adjoining histogram quantifies the proportion of total dendrite that lies within or outside of 30° from vertical (perpendicular to the pial surface). Black axes indicate the length of histogram corresponding to 100%. (C) Proportion of CR and CCK VIP-INs that are CA vs. IS (n = 17 total VIP-INs from 3 CR-Cre/VIP-Flp mice and n = 19 VIP-INs from CCK-Cre/VIP-Flp mice); p>0.1 by Chi-square test. (D) Individual cells (dots) and population mean ± SEM for the vertical bias of each cell calculated from the morphological reconstructions in B. Vertical bias is the percent of dendrite within 30° of the line perpendicular to the pial surface, with a value of 1 corresponding to a perfectly bipolar shape. CA and IS VIP-INs in CR-Cre/VIP-Flp mice are mostly bipolar, with high vertical bias; CA and IS VIP-INs from CCK-Cre/VIP-Flp mice are multipolar, with vertical bias of ~ 0.5. Traditional Scholl analysis did not clearly illustrate this key difference between VIP-INs.
Figure 6 with 3 supplements
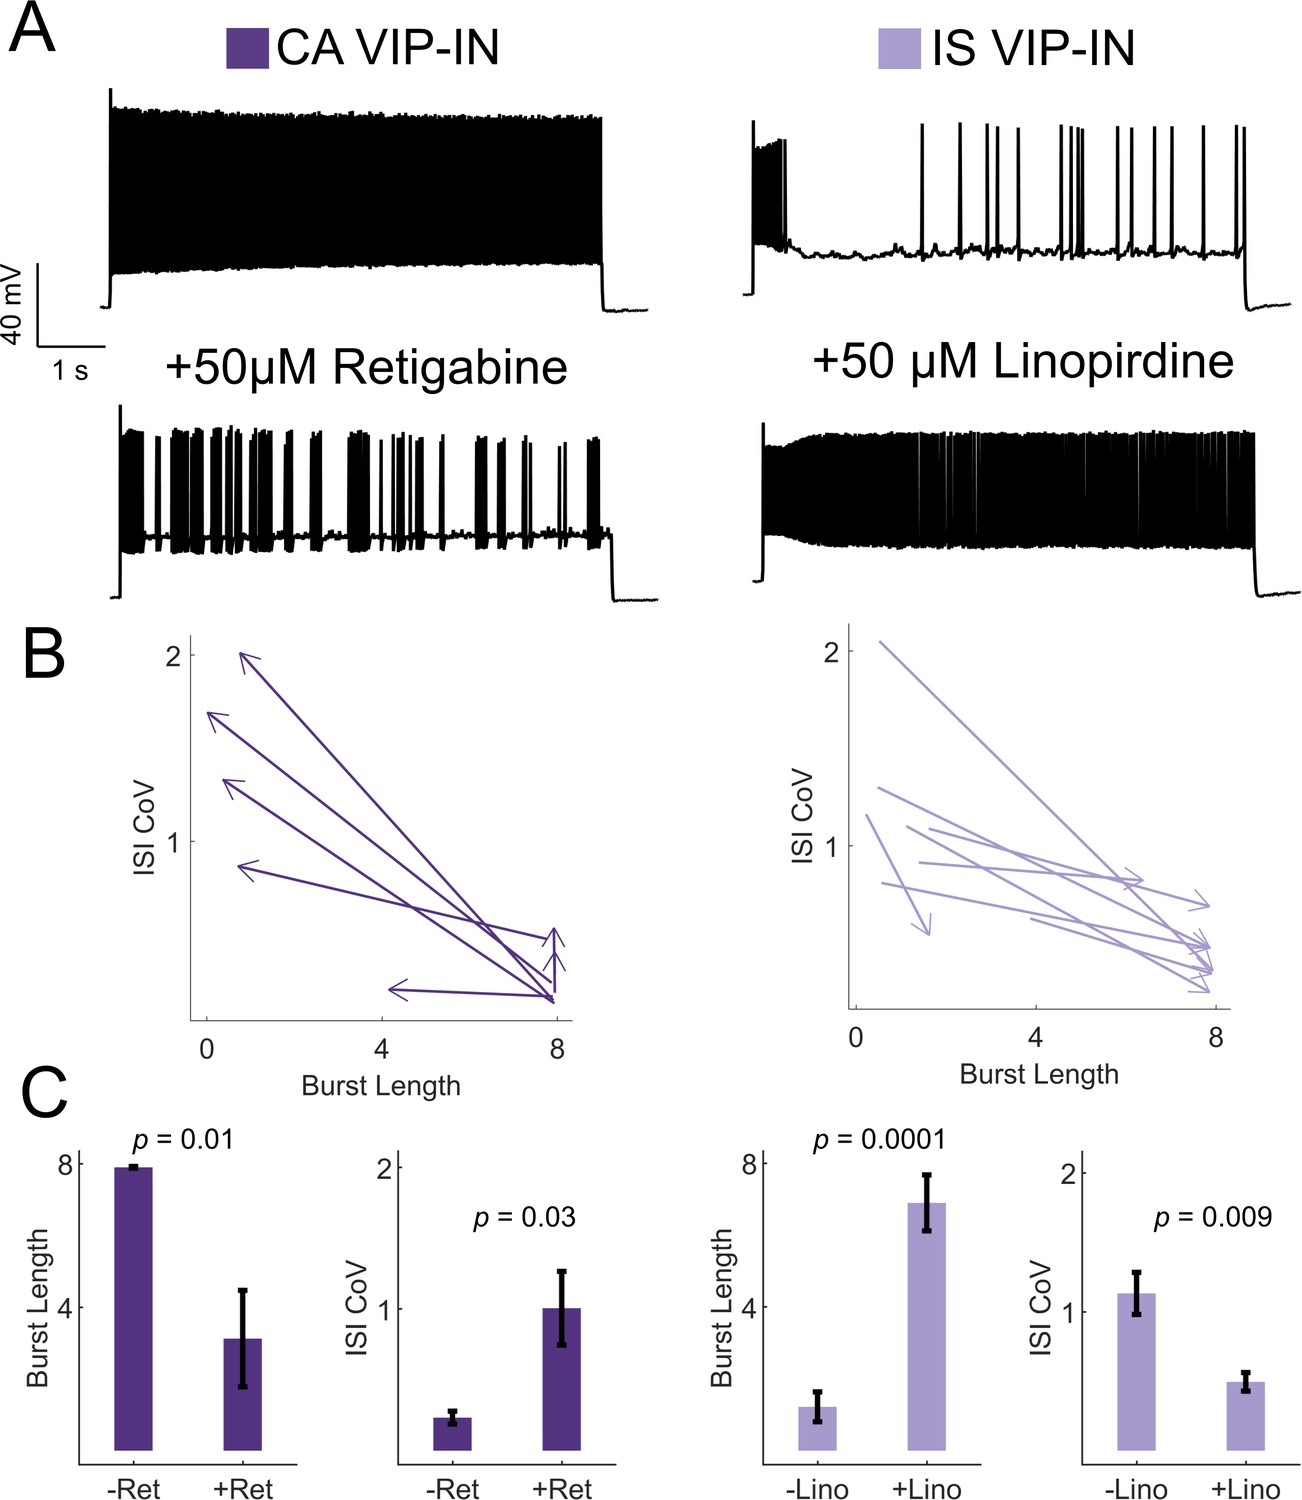
KCNQ channels regulate VIP-IN firing patterns.
(A) Example traces from representative CA and IS VIP-INs in response to 8 s depolarization at 2X rheobase before and after bath application of either the KCNQ activator retigabine (left) or inhibitor linopirdine (right), respectively. (B) The response of n = 7 CA and n = 8 IS cells from 4 WT.VIP-Cre.tdT mice to the above drug application. Arrows indicate the direction of change in ISI CoV value and burst length (as in Figure 2C) after drug appliction, with the base of the arrow corresponding to the initial measurment, and the arrowhead corresponding to the values measured after drug application. (C) Mean ± SEM of each value in B before and after drug application, with p-values and significance determined by a paired students t-test.
Figure 6—figure supplement 1
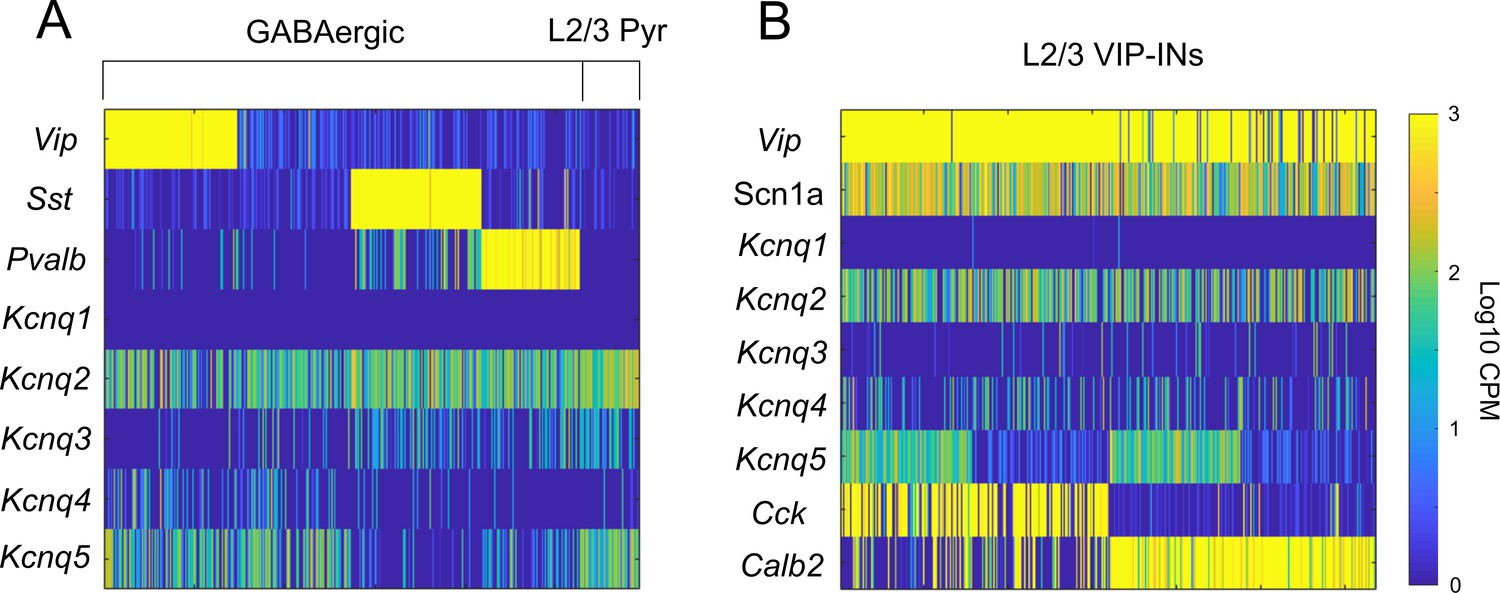
Kcnq5 is selectively expressed in a subset of VIP-INs.
(A) Data from the Allen Cell Types Database, celltypes.brain-map.org/rnaseq (as in Figure 1—figure supplement 1). Each bar represents RNA-Seq reads in counts per million (CPM) from a single cell. Kcnq2 is broadly expressed in most GABAergic INs, while Kcnq5 is generally restricted to VIP-INs, as well as other non-PV/SST INs and layer 2/3 pyramidal cells. There is very limited expression of Kcnq1,3, and four in any of these populations. (B) As in A, focusing on expression in VIP-INs in layer 2/3 grouped based on expression of Cck and Calb2 (aka CR). Scn1a is expressed in most VIP-INs with no preference for Cck or Calb2 expressing VIP-INs. Kcnq5 is also expressed equally in both Cck and Calb2 containing VIP-INs, although only approximately 50% of both populations express significant levels of Kcnq5. Cells were sorted by Kcnq5 expression to clearly show the relatively equal proportions of Kcnq5 expression in both Cck and Calb2 populations.
Figure 6—figure supplement 2
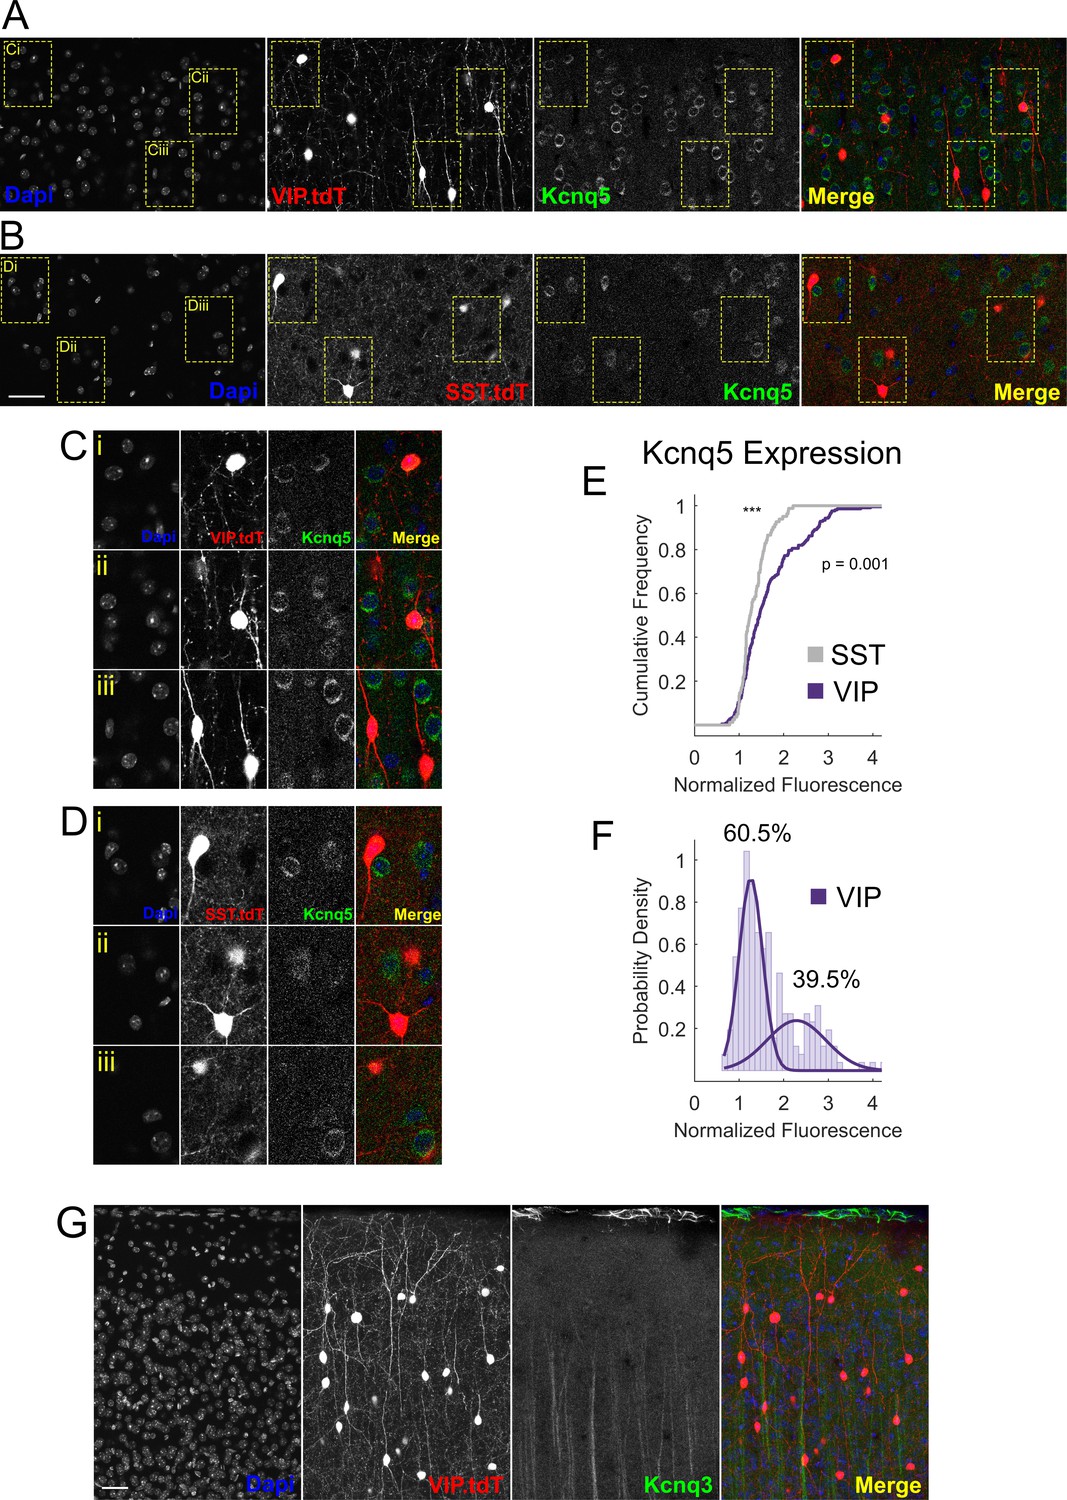
Kcnq5 but not Kcnq3 is expressed in VIP-INs.
(A) Confocal micrographs of Kcnq5 staining in layer 2/3 of an adult WT.VIP-Cre.tdT mouse. Kcnq5 localizes to the soma of many pyramidal neurons as well as a population (Ci and Cii) of VIP-INs. (B) Same as in A, but in layer 5 of an adult WT.SST-Cre.tdT mouse. Layer five pyramidal neurons, but not SST-INs, stain positive for Kcnq5. Scale = 50 µM for A and B. (C) Enlarged VIP-INs (yellow boxes) from A. (D) Enlarged SST-INs (yellow boxes) from B. (E) Quantification of Kcnq5 staining in VIP and SST-INs. The mean fluorescence of the Kcnq5 signal in each cell is normalized to the background fluorescence of neuropil. VIP-INs show a non-normal distribution (p=1 E −112, one sample KS test) and have a significantly different distribution than SST-INs (p value indicated, two sample KS test). n = 293 VIP-INs from 3 WT.VIP-Cre.tdT mice, and n = 117 SST-INs from one WT.SST-Cre.tdT mouse. (F) Histogram of the distribution of VIP-IN Kcnq5 labeling. The probability density of the data was fit with a mixture of two normal distributions using maximum likelihood estimation yielding a mixing parameter of 0.605 with mean and standard deviations of 1.2 ± 0.2 and 2.3 ± 0.6 (corresponding to 60.5% ‘negative’ and 39.5% ‘positive’ VIP-INs). (G) Confocal micrographs of Kcnq3 staining in layer 2/3 of an adult WT.VIP-Cre.tdT mouse. Kcnq3 shows very sparse labeling in cortex, mostly limited to presumptive ascending apical dendrites, and is not found on VIP-INs. Scale = 50 µM. Images are representative of n = 3 mice with two technical replicates each.
Figure 6—figure supplement 3
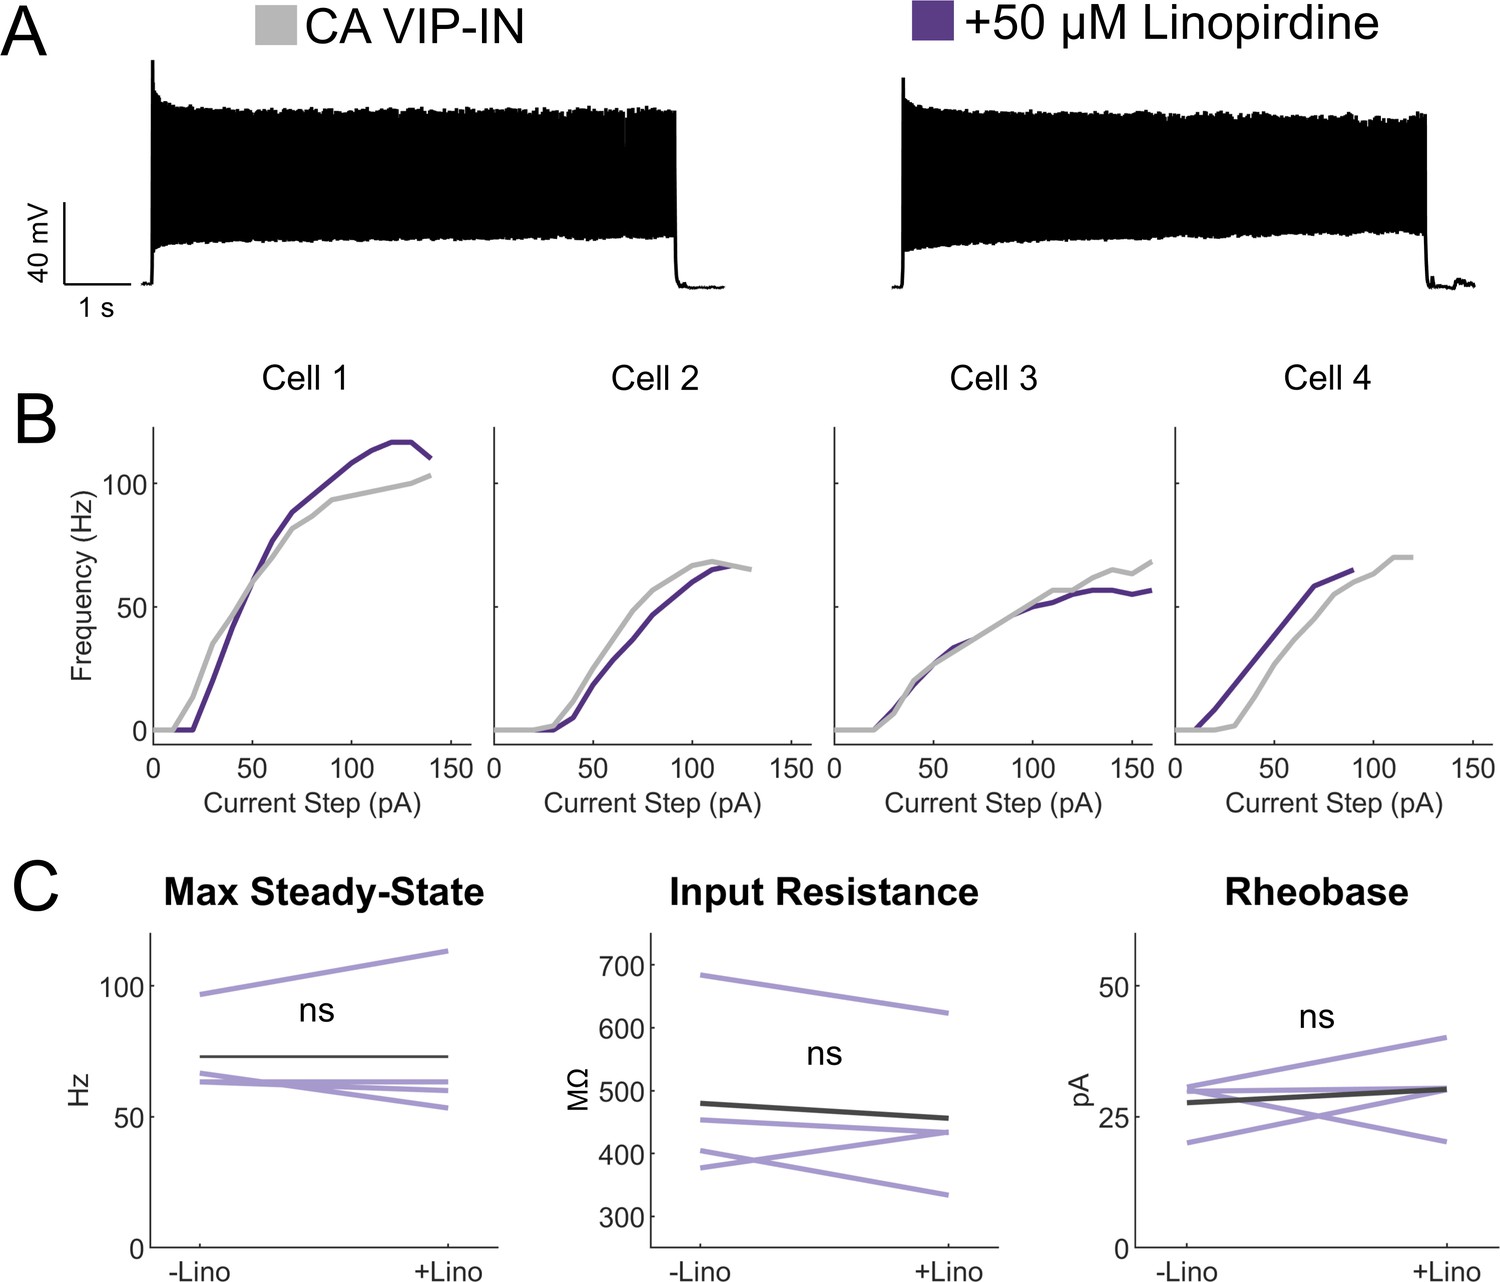
Linopirdine has no effect on CA VIP-IN excitability.
(A) Representative 8 s square depolarization at 2X rheobase of a WT CA VIP-IN showing no change in firing pattern. (B) Individual I-f curves for n = 4 cells from 2 WT.VIP-Cre.tdT mice before (gray) and after (purple) addition of linopirdine. (C) Summary of intrinsic and excitability parameters from the cells in B showing no change with the addition on linopirdine.
Figure 7 with 1 supplement
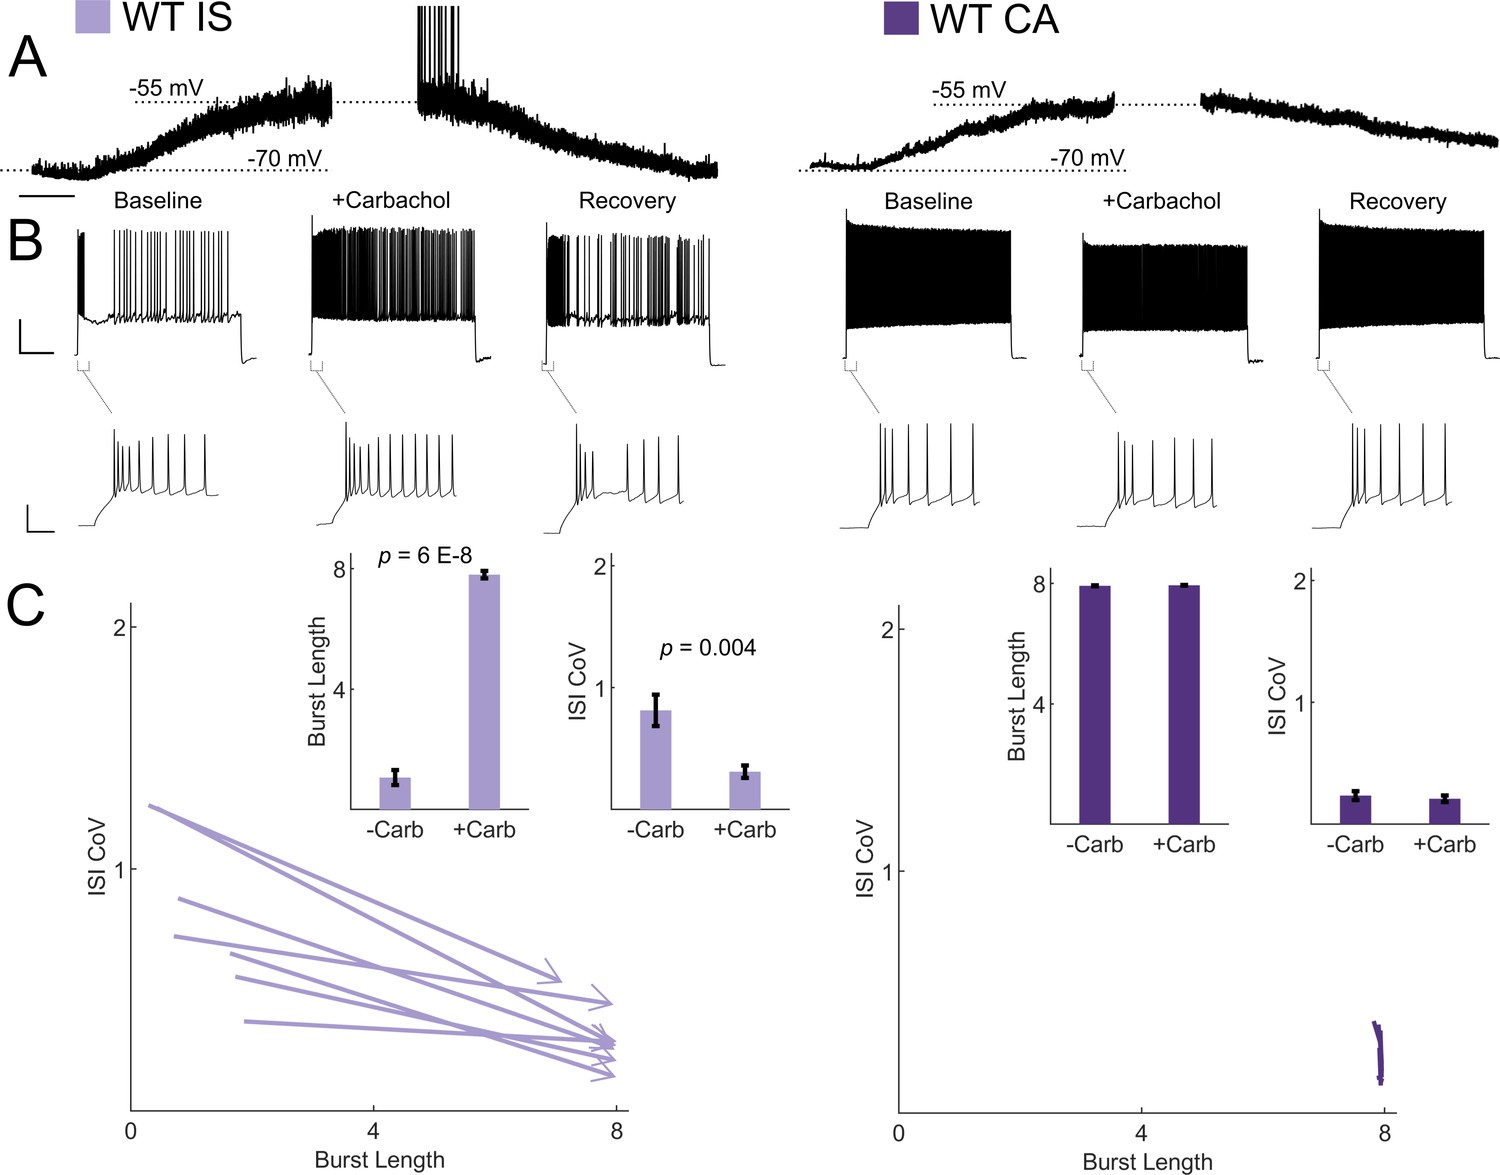
Cholinergic modulation induces switching from irregular to continuous firing in IS VIP-INs.
(A) Depolarization in resting membrane potential of IS and CA VIP-INs with bath application of 5 μM Carbachol. Horizontal scale bar, 1 min. In addition to membrane depolarization, there was a notable increase in synaptic activity, and in some cases spontaneous firing. Population mean ± SEM of the change in membrane potential was 13 ± 5 and 10 ± 5 mV for IS and CA VIP-INs respectively (p>0.05). B)Action potential trains elicited with 8 s long square depolarizations at 2X rheobase current injections before, during, and after washout of 5 μM carbachol. In each case, the membrane potential was offset to −70 mV by direct current injection. Scale bars, 40 mV and 1 s. Insets showing no change in the initial bursting characteristics at suprathreshold current injections with the application of carbachol. Scale bars, 40 mV and 50 ms. C)Quantification of changes in firing patters of n = 7 IS and n = 8 CA VIP-INs from 3 WT.VIP-Cre.tdT mice in response to carbachol. All IS cells showed a qualitative switch to a continuous firing mode represented by increased burst length and decreased ISI CoV (indicated by arrowheads as in Figure 6); p-values determined by paired students’ t-test. There were no apparent changes in CA VIP-IN firing patterns with carbachol application (arrowheads omitted for clarity).
Figure 7—figure supplement 1
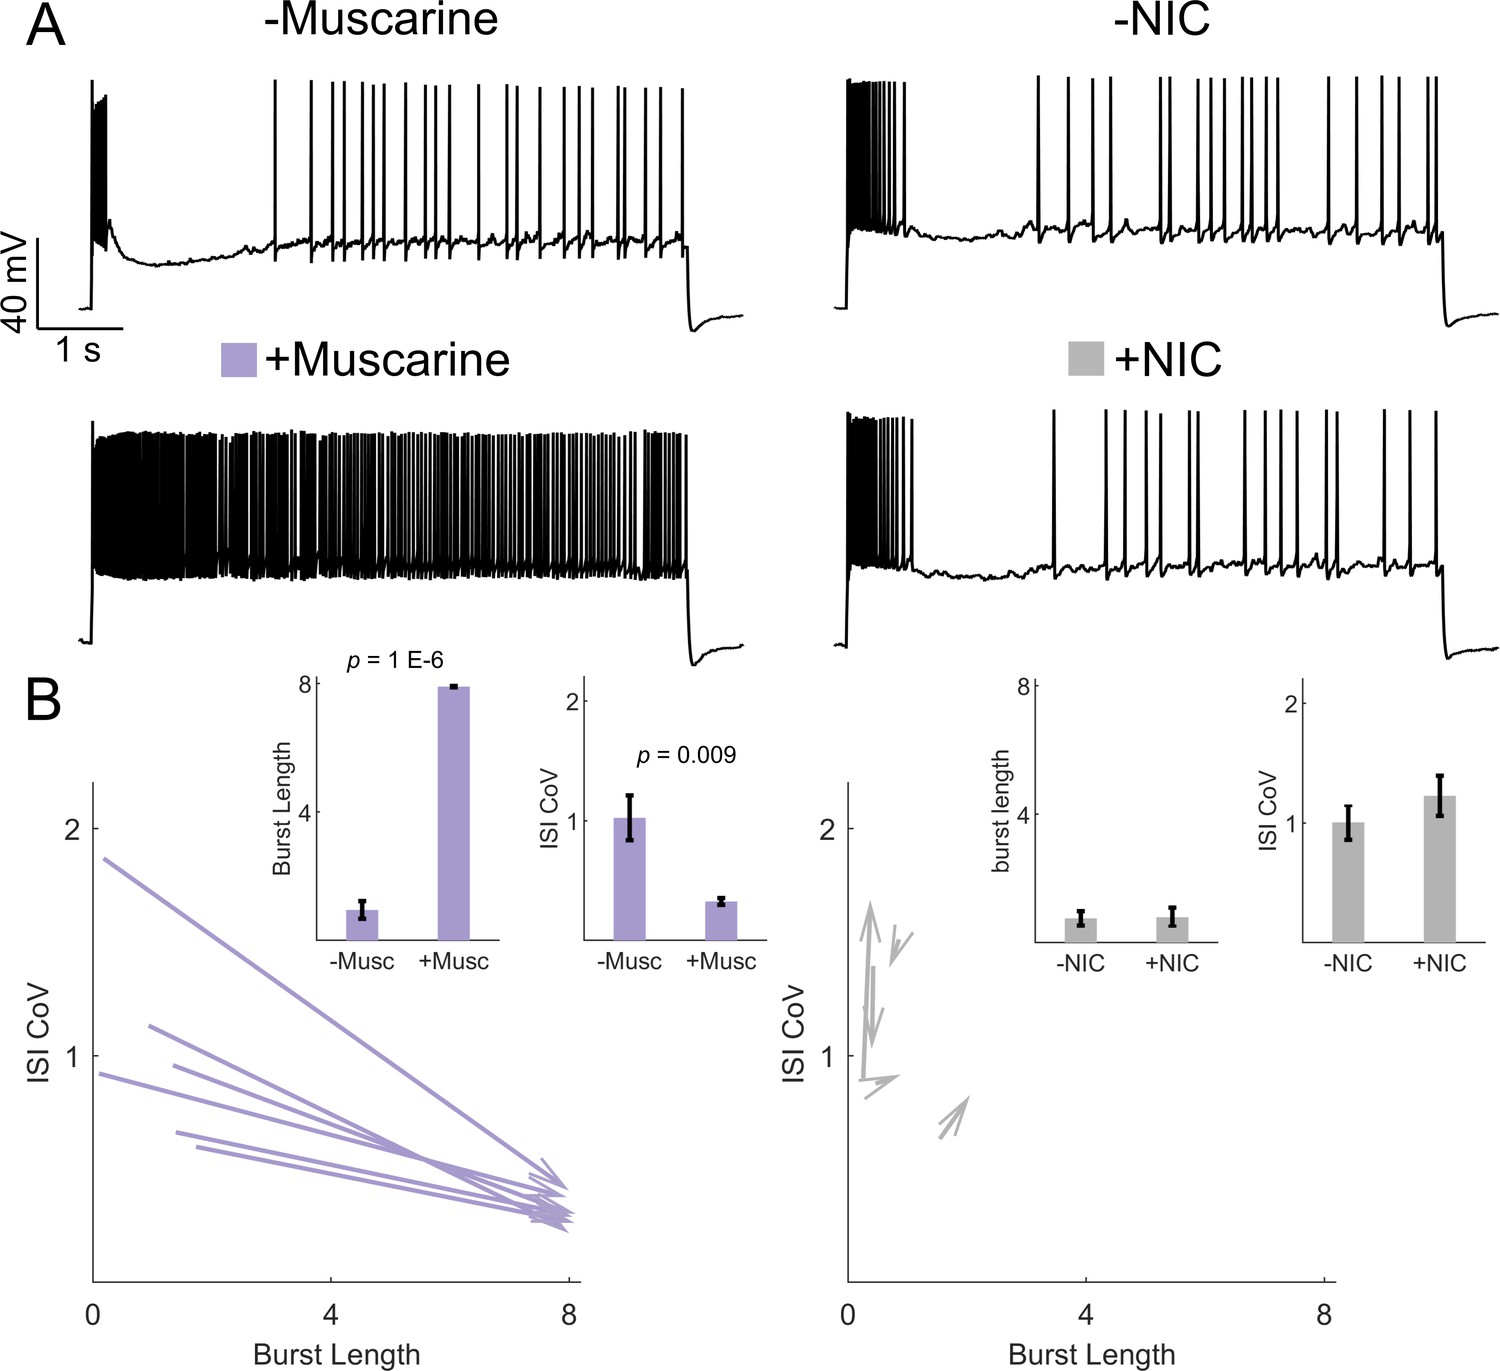
Muscarinic but not nicotinic receptor activation is sufficient to induce irregular-tonic switching in IS VIP-INs.
(A) Example of the response to an 8 s square depolarization of two IS VIP-INs from adult WT. VIP-Cre.tdT mice before (top) and after (bottom) application of either 5 µM muscarine or 1 µM of the nicotinic agonist (NIC) 4-Acetyl-1,1-dimethylpiperazinium iodide. Scale is 40 mV and 1 s. (B) Quantification of changes in firing patters of IS VIP-INs in response to muscarine (n = 6 cells; three mice) or NIC (n = 5 cells; two mice). Muscarine caused a switch to a continuous firing mode represented by increased burst length and decreased ISI CoV (indicated by arrowheads as in Figure 6); p-values determined by paired students’ t-test. There were no apparent changes in IS VIP-IN firing patterns with NIC application.
Figure 8
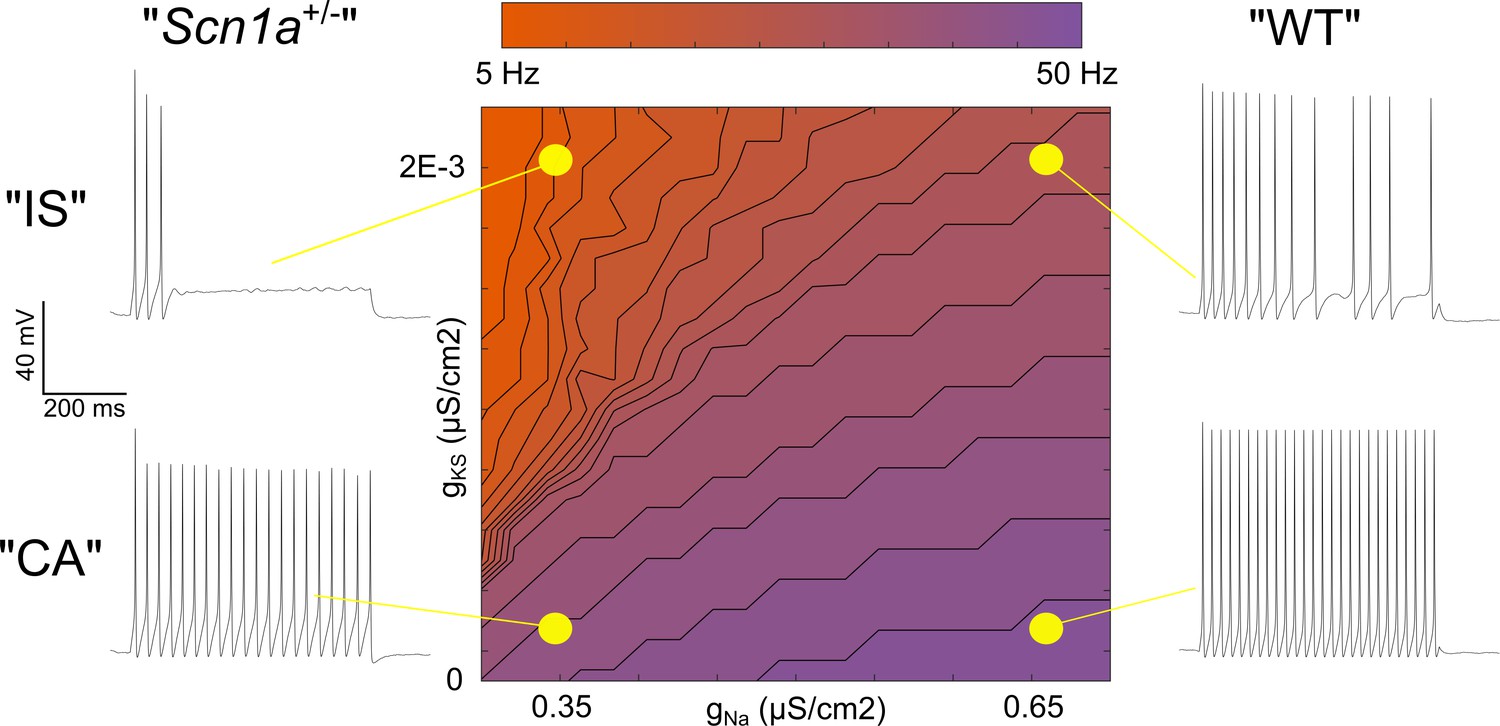
Single compartment model of a VIP-IN illustrates the interaction between M-current and Na+ current.
A single compartment Hodgkin-Huxley style conductance-based model using standard differential equations. Heat map indicates firing frequencies elicited with a 600 ms X 100 pA test pulse on a linear scale. The model was initially modified to approximate the intrinsic properties and firing rate of a typical WT CA VIP-IN observed experimentally. A slowly activating K+ current with a fixed time constant (gKS) was then added to approximate the presence of M-current; in the presence of Gaussian distributed noise, this induced irregular spiking similar to that seen in IS VIP-INs (top right). Then, the amount of total Na+ current density (gNa) in the model was varied. Models with low gNa and little or no gKS showed minimal impairment with a ~ 10–20% decrease in spike height and firing frequency. Models with low gNa and medium to high levels of gKS showed much more profound impairment, with complete collapse of repetitive action potential generation. The Matlab code used to generate this model is available in Figure 8—source code 1 (model) and Figure 8—source code 2 (figure generation).
-
Figure 8—source code 1
Hodgkin-Huxley VIP-IN model Matlab code.
- https://doi.org/10.7554/eLife.46846.024
-
Figure 8—source code 2
Hodgkin-Huxley VIP-IN model code for Figure generation.
- https://doi.org/10.7554/eLife.46846.025
Tables
Table 1
Properties of VIP-INs from Scn1a+/- and WT littermates Listed p-values indicate the result of a Kruskal Wallis test for an effect by group.
Pairwise comparisons are with Dunn's test. All comparisons are made considering the average of each mouse as n = 1.* p<0.05 vs. age and subtype matched wild-type; **p<0.01; ***p<0.001. † p<0.05 between CA and IS subtypes (consistent between WT and Scn1a+/-). Data for each cell are reported in Figure 3—source data 1.
| Subtype | CA | IS | p-value | ||||
|---|---|---|---|---|---|---|---|
| Genotype | WT | Scn1a+/- | WT | Scn1a+/- | (group) | ||
| n mice (cells) | 30(71) | 20(43) | 32(78) | 22(66) | |||
| Age (days) | 33.7 ± 1.9 | 33.5 ± 2.6 | 33.4 ± 2.0 | 34.0 ± 2.4 | 0.8 | ||
| Vm (mV) | −66.3 ± 1.0 | −65.2 ± 1.0 | −65.6 ± 0.8 | −64.0 ± 0.6 | 0.3 | ||
| Rm (MΩ) | 355 ± 16 | 391 ± 21 | 344 ± 17 | 314 ± 11 | 0.2 | ||
| Time Constant | 9.17 ± 0.9 | 9.98 ± 1.0 | 10.7 ± 1.5 | 10.1 ± 0.9 | 0.2 | ||
| Rheobase (pA) | 48.3 ± 3.2 | 45.4 ± 4.1 | 53.5 ± 3.6 | 57.7 ± 4.2 | 0.2 | ||
| AP Threshold (mV) | −41.8 ± 0.5 | −41.5 ± 0.5 | −41.2 ± 0.5 | * | −39.1 ± 0.4 | 0.01 | |
| AP Rise Time (ms) | 0.45 ± 0.01 | 0.46 ± 0.01 | 0.44 ± 0.01 | 0.44 ± 0.01 | 0.1 | ||
| Max Rise Slope (mV/ms) | 418 ± 14 | 417 ± 13 | 427 ± 17 | 371 ± 15 | 0.1 | ||
| AP Halfwidth (ms) | 0.55 ± 0.02 | 0.54 ± 0.02 | † | 0.50 ± 0.02 | 0.49 ± 0.02 | 0.04 | |
| AP Amplitude (mV) | 79 ± 1.3 | 80 ± 1.2 | 78 ± 1.6 | * | 71 ± 1.8 | 0.004 | |
| AHP Amplitude (mV) | 10.0 ± 0.63 | 10.9 ± 0.55 | 10.6 ± 0.55 | 11.0 ± 0.43 | 0.6 | ||
| AHP time (ms) | 1.75 ± 0.16 | 1.76 ± 0.21 | 1.51 ± 0.14 | 1.41 ± 0.11 | 0.09 | ||
| Sag (percent) | 14.4 ± 1.3 | 16.3 ± 1.5 | † | 23.5 ± 2.6 | 28.0 ± 2.0 | 8 E −5 | |
| APs at Rheobase | 1.38 ± 0.1 | 1.32 ± 0.1 | † | 2.41 ± 0.3 | 2.01 ± 0.2 | 7 E −5 | |
| Instantaneous (Hz) | 237 ± 11 | 235 ± 13 | 245 ± 10 | 209 ± 11 | 0.1 | ||
| Steady-State (Hz) | 81 ± 4 | 81 ± 4 | † | 55 ± 4 | ** | 25 ± 3 | 2 E −12 |
| ISI CoV | 0.30 ± 0.02 | 0.31 ± 0.02 | † | 0.61 ± 0.03 | 0.69 ± 0.04 | 4 E −13 | |
Key resources table
| Reagent type (species) or resource | Designation | Source or reference | Identifiers | Additional information |
|---|---|---|---|---|
| Genetic reagent (M. musculis) | 129S-Scn1atm1Kea/Mmjax | Jax | RRID:MMRRC_037107-JAX | Dr. Jennifer A. Kearney, Northwestern University |
| Genetic reagent (M. musculis) | Viptm1(cre)Zjh/J | Jax | RRID:IMSR_JAX:010908 | |
| Genetic reagent (M. musculis) | B6;129P2-Pvalbtm1(cre)Arbr/J | Jax | RRID:IMSR_JAX:008069 | |
| Genetic reagent (M. musculis) | B6J.Cg-Ssttm2.1(cre)Zjh/MwarJ | Jax | RRID:IMSR_JAX:028864 | |
| Genetic reagent (M. musculis) | Rosa- CAG-LSL-tdTomato | Jax | RRID:IMSR_JAX:007914 | |
| Genetic reagent (M. musculis) | 129S6.SvEvTac | Taconic Biosciences | RRID:IMSR_TAC:129sve | |
| Genetic reagent (M. musculis) | C57BL/6J | Jax | RRID:IMSR_JAX:000664 | |
| Genetic reagent (M. musculis) | Ccktm1.1(cre)Zjh/J | Jax | RRID:IMSR_JAX:012706 | Drs. Bernardo Rudy and Robert Machold, NYU |
| Genetic reagent (M. musculis) | B6(Cg)-Calb2tm1(cre)Zjh/J | Jax | RRID:IMSR_JAX:010774 | Drs. Bernardo Rudy and Robert Machold, NYU |
| Genetic reagent (M. musculis) | Viptm2.1(flpo)Zjh/J | Jax | RRID:IMSR_JAX:028578 | Drs. Bernardo Rudy and Robert Machold, NYU |
| Genetic reagent (M. musculis) | B6.Cg-Gt(ROSA)26Sortm80.1(CAGCOP4*L132C/EYFP)Hze/J | Jax | RRID:IMSR_JAX:025109 | Drs. Bernardo Rudy and Robert Machold, NYU |
| Recombinant DNA reagent | AAV.CAG.Flex.tdTomato | Penn Vector Core | AV-9-ALL864 | 2XE + 13 GC/mL |
| Peptide, recombinant protein | Hm1a | Alomone | STH-601 | 1 µM / 50 nM |
| Chemical compound, drug | Biocytin conjugated to Alexa Fluor 488 | Invitrogen | A12924 | 0.5% |
| Chemical compound, drug | Linopirdine | Sigma | L134 | 50 µM |
| Chemical compound, drug | Retigabine | Alomone | D-23129 | 50 µM |
| Chemical compound, drug | Carbamoylcholine chloride | Sigma | C4382 | 5 µM |
| Chemical compound, drug | Muscarine | Sigma | M6532 | 5 µM |
| Chemical compound, drug | 4-Acetyl-1,1-dimethylpiperazinium iodide | Tocris | 0352 | 1 µM |
| Software, algorithm | Pclamp 10 | Clampfit | RRID:SCR_011323 | V10.0 |
| Software, algorithm | Matlab | Mathworks | RRID:SCR_001622 | 2019a |
| Software, algorithm | Gramm | Morel, 2018 | Data visualization for Matlab | |
| Antibody | Anti-Nav1.1 sodium channel, clone K74/71 | NeuroMab | RRID:AB_10671830 | 1:500, IF |
| Antibody | KCNQ5 Polyclonal Antibody | Invitrogen | RRID:AB_2736022 | 1:500, IF |
| Antibody | Anti-KCNQ3 Antibody | Alomone labs | RRID:AB_2040103 | 1:200, IF |
| Antibody | Goat anti-Mouse IgG1 Cross-Adsorbed Secondary Antibody, Alexa Fluor 488 | Invitrogen | RRID:AB_2535764 | 1:1000, IF |
| Antibody | Goat anti-Rabbit IgG (H + L) Cross-Adsorbed Secondary Antibody, Alexa Fluor 488 | Invitrogen | RRID:AB_143165 | 1:1000, IF |
Additional files
-
Transparent reporting form
- https://doi.org/10.7554/eLife.46846.026
Download links
A two-part list of links to download the article, or parts of the article, in various formats.
Downloads (link to download the article as PDF)
Open citations (links to open the citations from this article in various online reference manager services)
Cite this article (links to download the citations from this article in formats compatible with various reference manager tools)
Vasoactive intestinal peptide-expressing interneurons are impaired in a mouse model of Dravet syndrome
eLife 8:e46846.
https://doi.org/10.7554/eLife.46846


