A toolkit for studying cell surface shedding of diverse transmembrane receptors
- University of Minnesota, United States
Figures
Figure 1 with 5 supplements
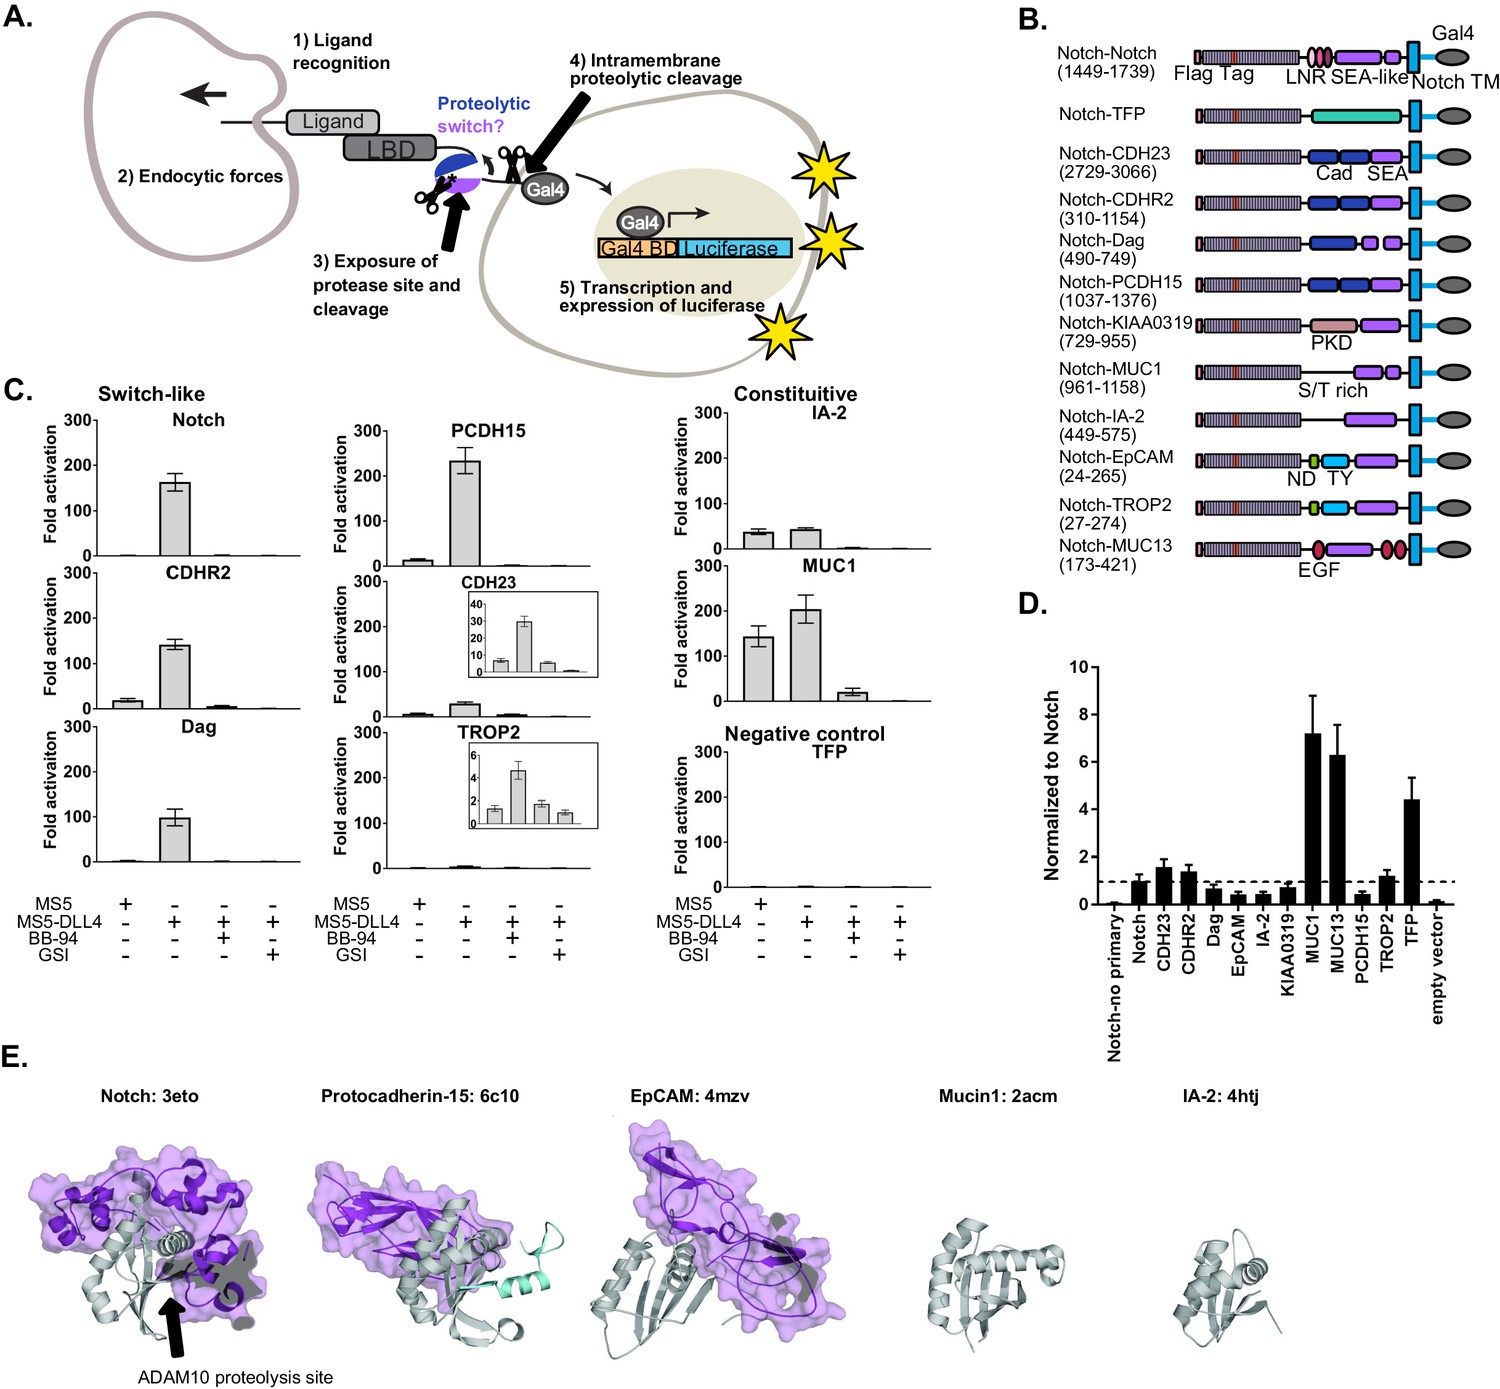
SEA-like domains cooperate with adjacent domains to behave as proteolytic switches.
(A) Schematic of Synthetic Notch Assay for Proteolytic Switches (SNAPS). Cells co-expressing Flag-Notch-X-Gal4 chimeras, where X is a putative proteolysis region of another receptor, and luciferase reporter constructs are co-cultured with DLL4 ligand-expressing cells to induce Notch activation and expression of luciferase. (B) Schematic of chimeric constructs utilized in the signaling assay. Protein domains are color coded and labeled below. Amino acid ranges used for each construct are in parentheses under the names. Note that Notch's SEA-like domain is also referred to as the Heterodimerization Domain (HD) in the literature. Abbreviations used: Cad: cadherin. EGF: Epidermal growth factor. LBD: Ligand binding domain. LNR: Lin-12 Notch-like repeats. ND: N-terminal domain. PKD: polycystic kidney disease domain. S/T rich: serine-threonine rich. TFP: Teal fluorescent protein. TM: transmembrane domain. TY: thyroglobulin type-1A domain. (C) Luciferase reporter gene activity profile of Notch and Notch chimera constructs (1 ng transfected in 96wp) co-cultured with MS5 cells or MS5 cells stably expressing DLL4. BB-94 = Batimastat (pan-metalloproteinase inhibitor) GSI = Compound E (γ-secretase inhibitor). Data shown are triplicate measurements from a representative experiment. Error bars represent the SEM of triplicate measurements. (D) Cell surface ELISA of Notch and Notch chimera constructs. Anti-Flag primary and goat anti-mouse HRP secondary antibodies were used to detect cell surface expression levels of each chimera. The horizontal dotted line corresponds to Notch expression levels. Error bars represent the SEM of triplicate measurements. (E) Structures and PDB IDs of SEA-like domains (gray) with applicable adjacent domains (purple). The Notch adjacent domain is comprised of three cysteine-rich, calcium binding Lin12 Notch repeats. Protocad15 (De-la-Torre et al., 2019; Dionne et al., 2018; Ge et al., 2018) has an Ig-like adjacent domain and EpCAM (Pavšič et al., 2014) has a cysteine-rich thyroglobulin adjacent domain. The buried surface area of the adjacent domains are 3800, 1300, and 2800 square Angstroms for Notch, Protocad15, and EpCAM, respectively. SEA-like domains were structurally aligned to the Notch SEA-like domain.
Figure 1—figure supplement 1
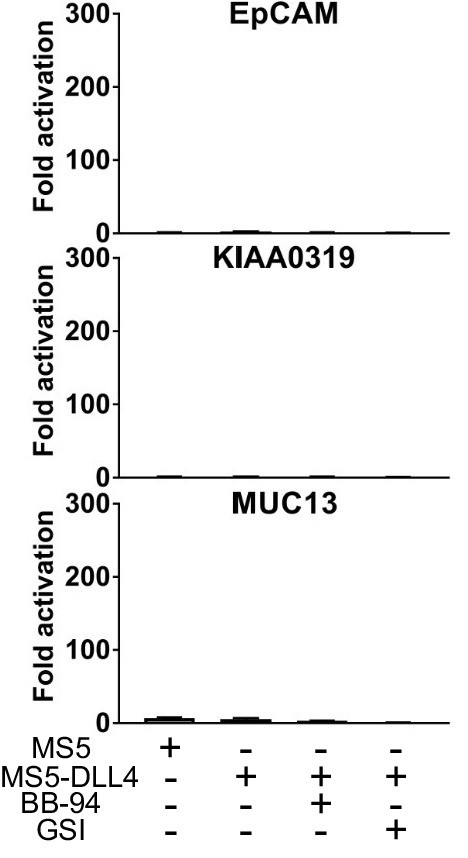
SEA domain chimeras without signaling activity.
Luciferase reporter gene activity profile of Notch chimera constructs co-cultured with MS5 cells or MS5 cells stably transfected with DLL4, including treatment with BB-94 metalloprotease and GSI gamma secretase inhibitors as noted.
Figure 1—figure supplement 2
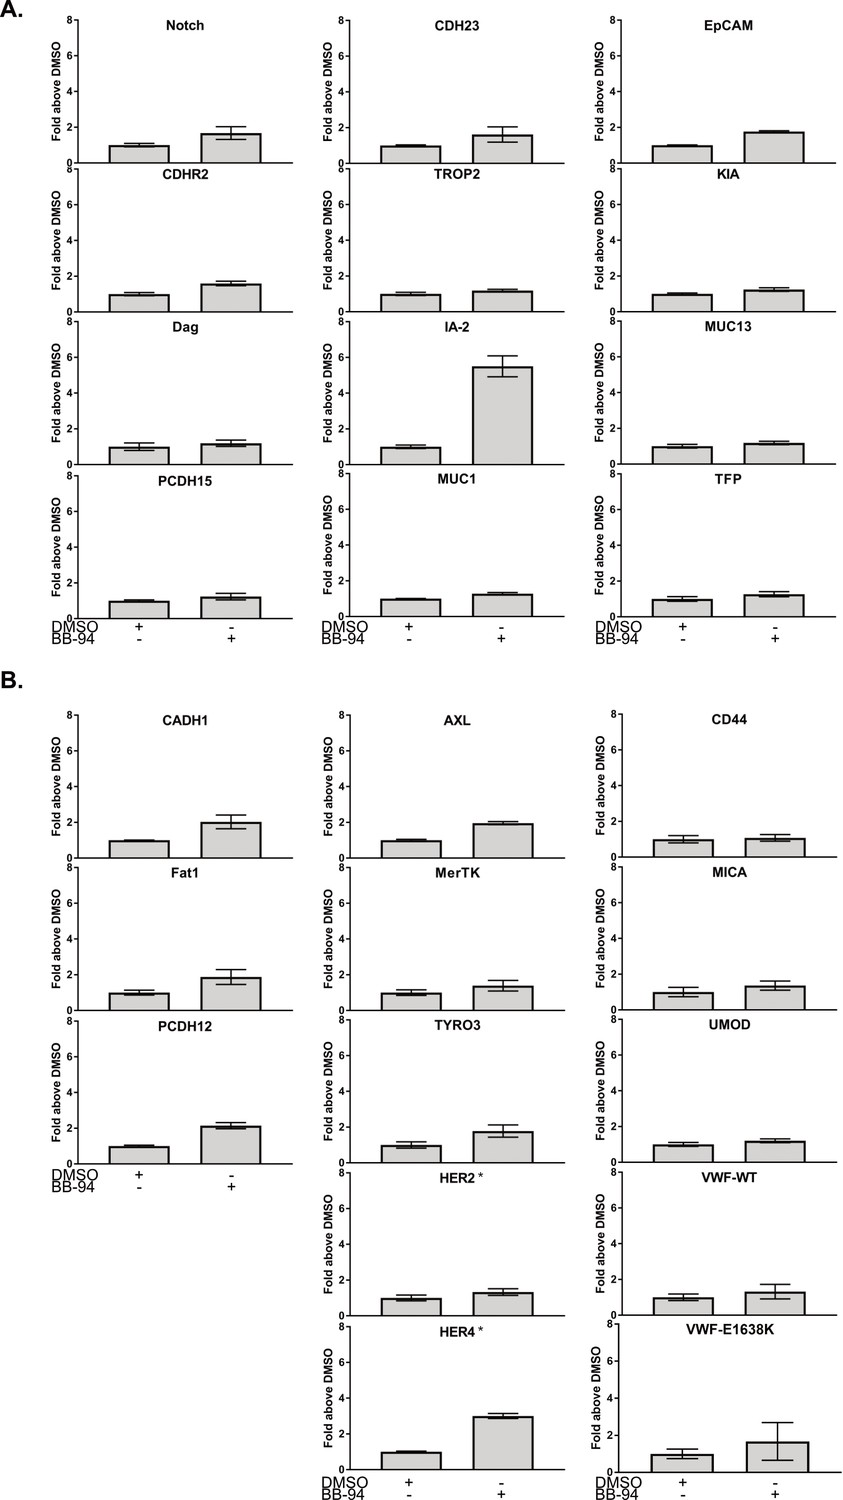
ELISA in the presence of BB-94.
Cell surface ELISA performed with DMSO (negative control) or BB-94 (pan-metalloproteinase inhibitor). Data is normalized to the signal of DMSO condition. Error bars represent the SEM of triplicate measurements. (A) SEA domains. (B) Non-SEA domains. Asterisks denote cell surface ELISA was performed on a different date.
Figure 1—figure supplement 3
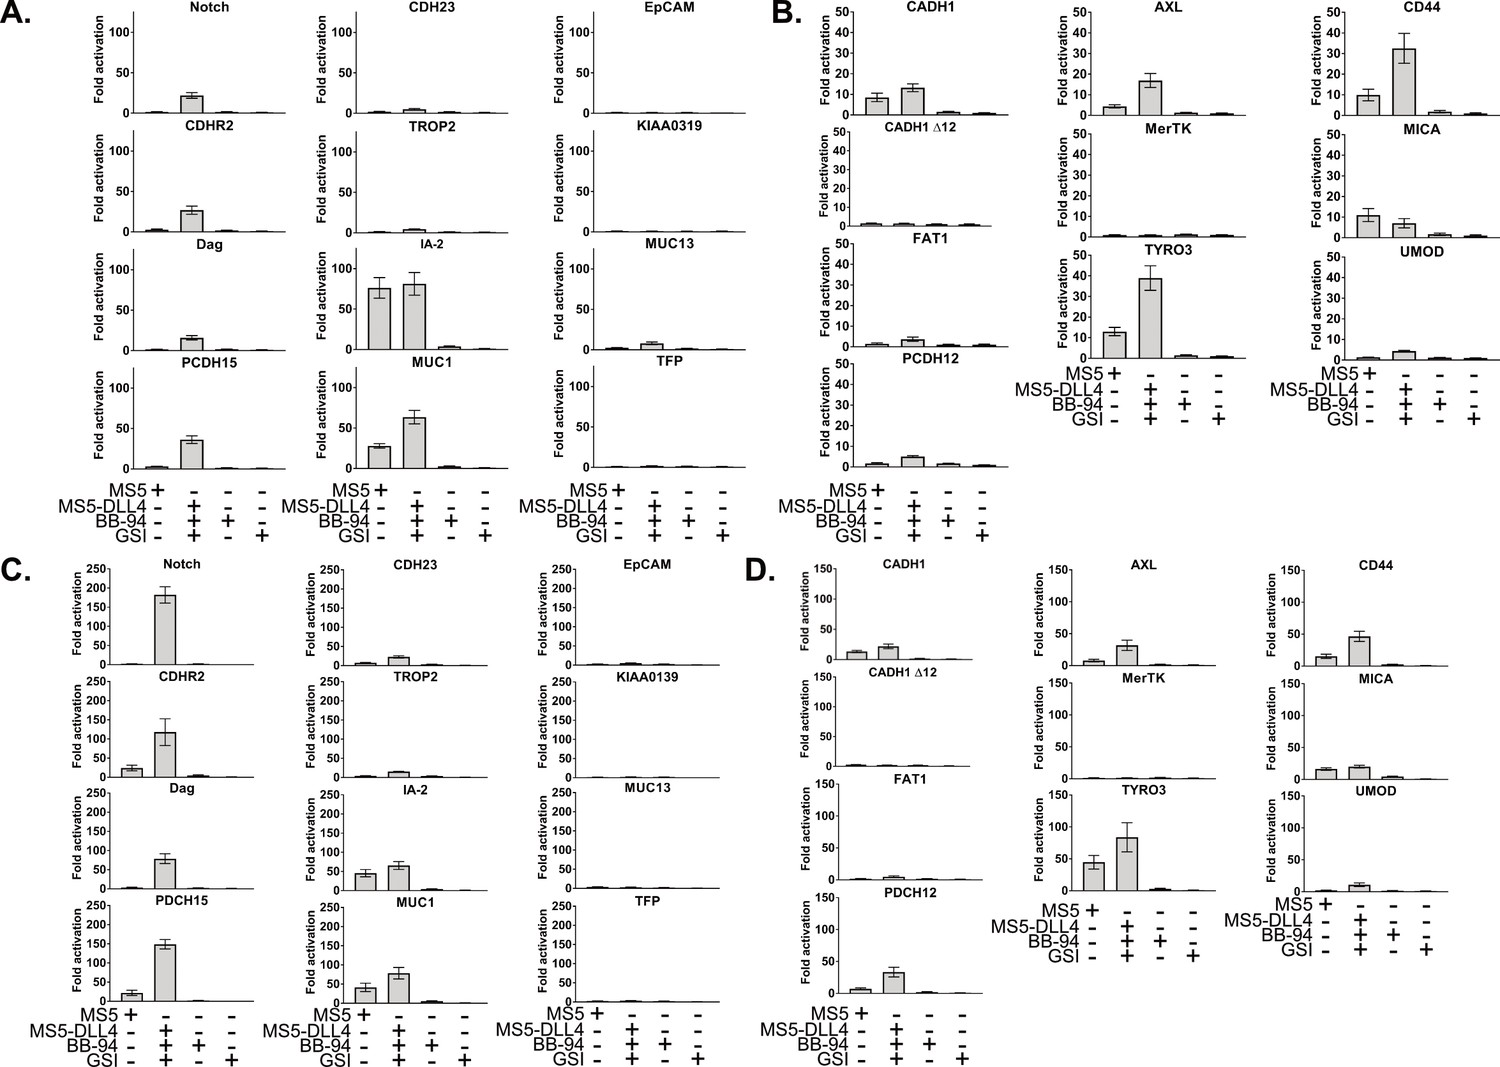
Titration of DNA used in co-culture assay.
Luciferase reporter gene activity profile of Notch in comparison to the Notch chimera constructs with SEA/SEA-like domains (A and C) or diverse receptors (B and D) co-cultured with MS5 cells or MS5 cells stably transfected with DLL4. (A and B) 0.1 ng construct DNA per well. (C and D) 10 ng construct DNA per well. Data shown are triplicate measurements from a representative experiment, error bars are SEM BB-94 = pan metalloproteinase inhibitor GSI=γ-secretase inhibitor.
Figure 1—figure supplement 4
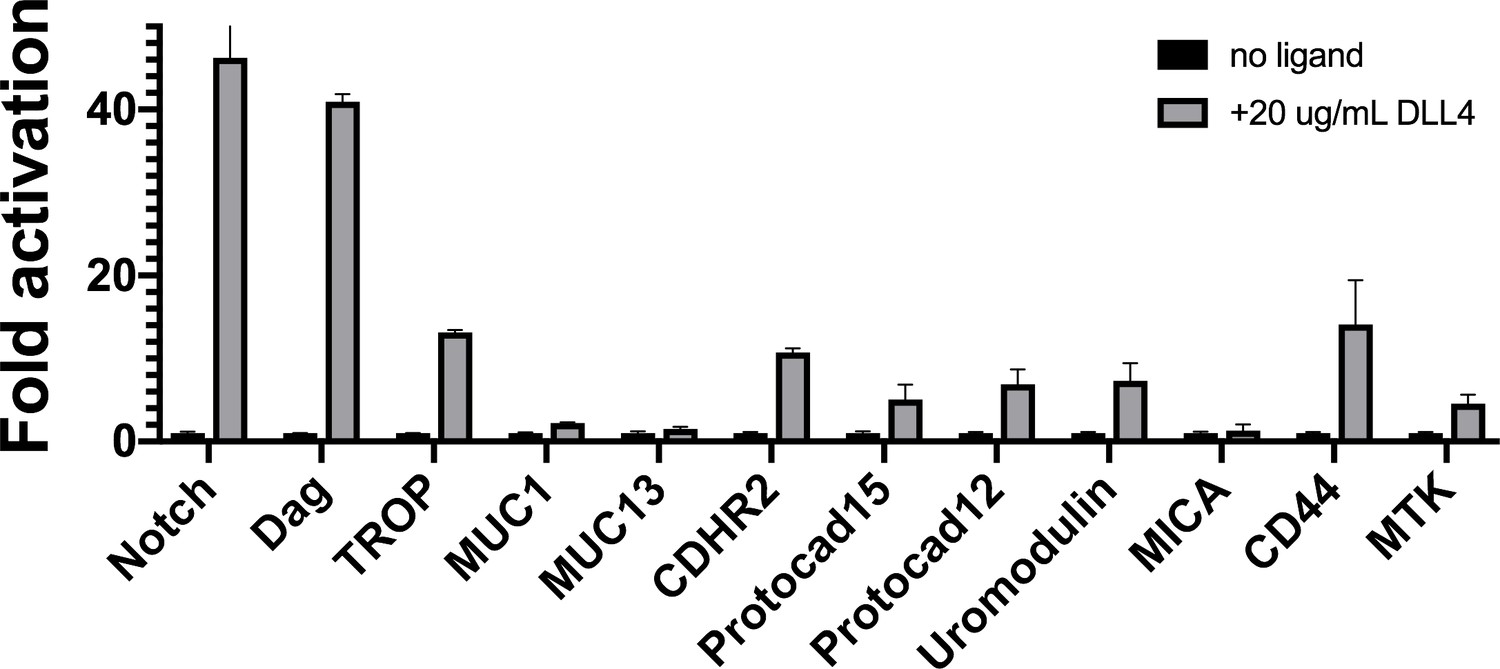
Plated ligand assay.
Luciferase reporter gene activity profile of Notch in comparison to the Notch chimera constructs plated in wells with no ligand or 20 μg/ml recombinant DLL4 ectodomain. Data shown are triplicate measurements from a representative experiment, error bars are SEM.
Figure 1—figure supplement 5
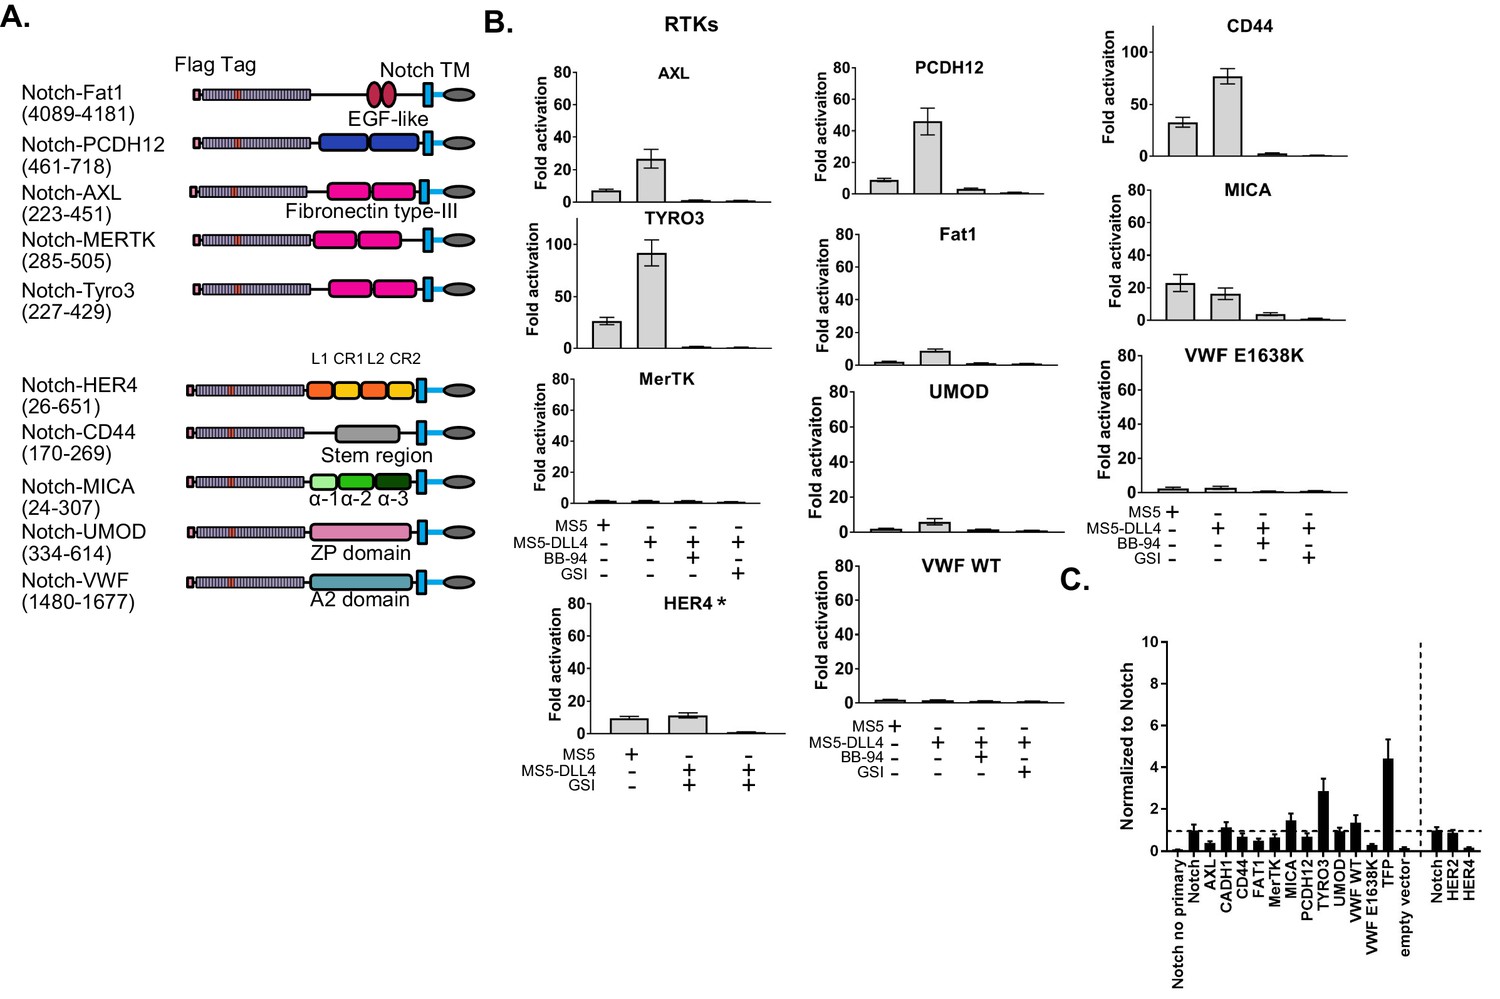
Shedding of diverse receptors detected by SNAPS.
(A) Chimera constructs. Protein domains are color coded and labeled. (B) Luciferase reporter gene activity profile of Notch chimera constructs co-cultured with MS5 cells or MS5 cells stably transfected with DLL4, including treatment with BB-94 metalloprotease and GSI gamma secretase inhibitors as noted. Asterisked graphs denote experiments performed on different days and with 2 ng DNA/well instead of 1 ng/well of DNA. Data shown are triplicate measurements from a representative experiment, error bars are SEM. CD44 and TYRO3 are shown with different scalebars due to high signal. * Experiment performed on a different day. Abbreviations:PCDH12: Protocadherin-12. CR: Cysteine rich. EGF: Epidermal growth factor. AXL: Tyrosine-protein kinase receptor UFO. HER4: Human epidermal growth factor receptor 4. MICA: MHC class I polypeptide related sequence A. Tyro3: Tyrosine-protein kinase receptor TYRO3. Cad: Cadherin. UMOD: Uromodulin. VWF: Von Willebrand Factor. L: Leucine-rich. ZP: zona pellucida. (C) Cell surface ELISA data from diverse receptor chimeras normalized to Notch signal. Horizontal dotted line denotes Notch signal, and the vertical dotted line separates cell surface ELISAs that were performed on different dates.
Figure 2
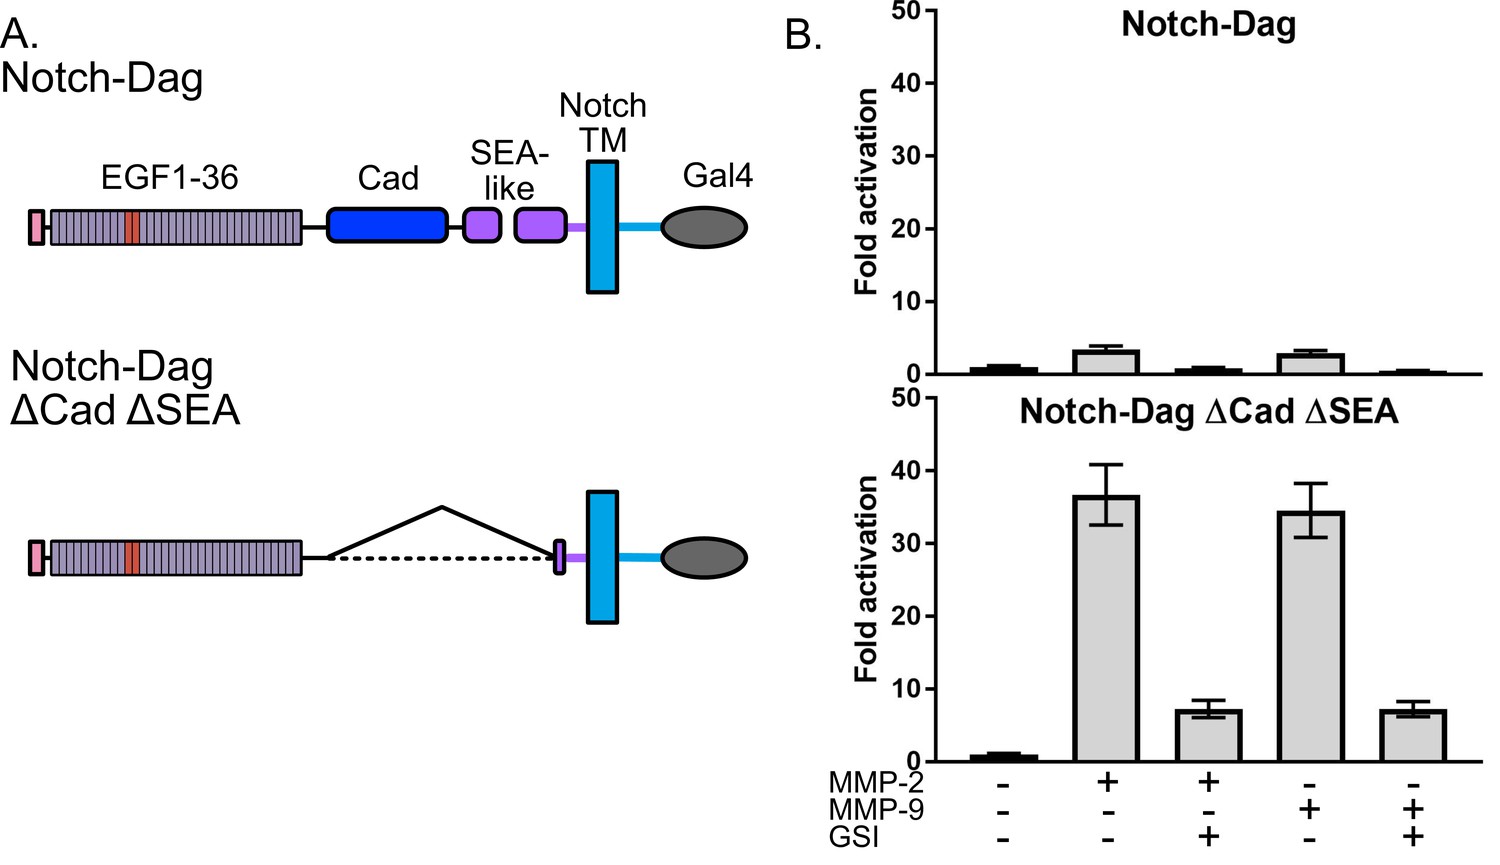
Dystroglycan containing intact proteolytic switch domain is protected from MMP cleavage.
(A) Chimera constructs used to test MMP sensitivity of Notch-Dag chimeras (B) Luciferase reporter gene activity of Notch-Dag chimeras containing intact proteolytic switch and truncated switch with constitutive MMP sites (ΔCadΔSEA) upon addition of MMPs. Data shown are triplicate measurements from a representative experiment. Error bars represent the SEM of triplicate measurements and normalization is to no added MMP condition.
Figure 3
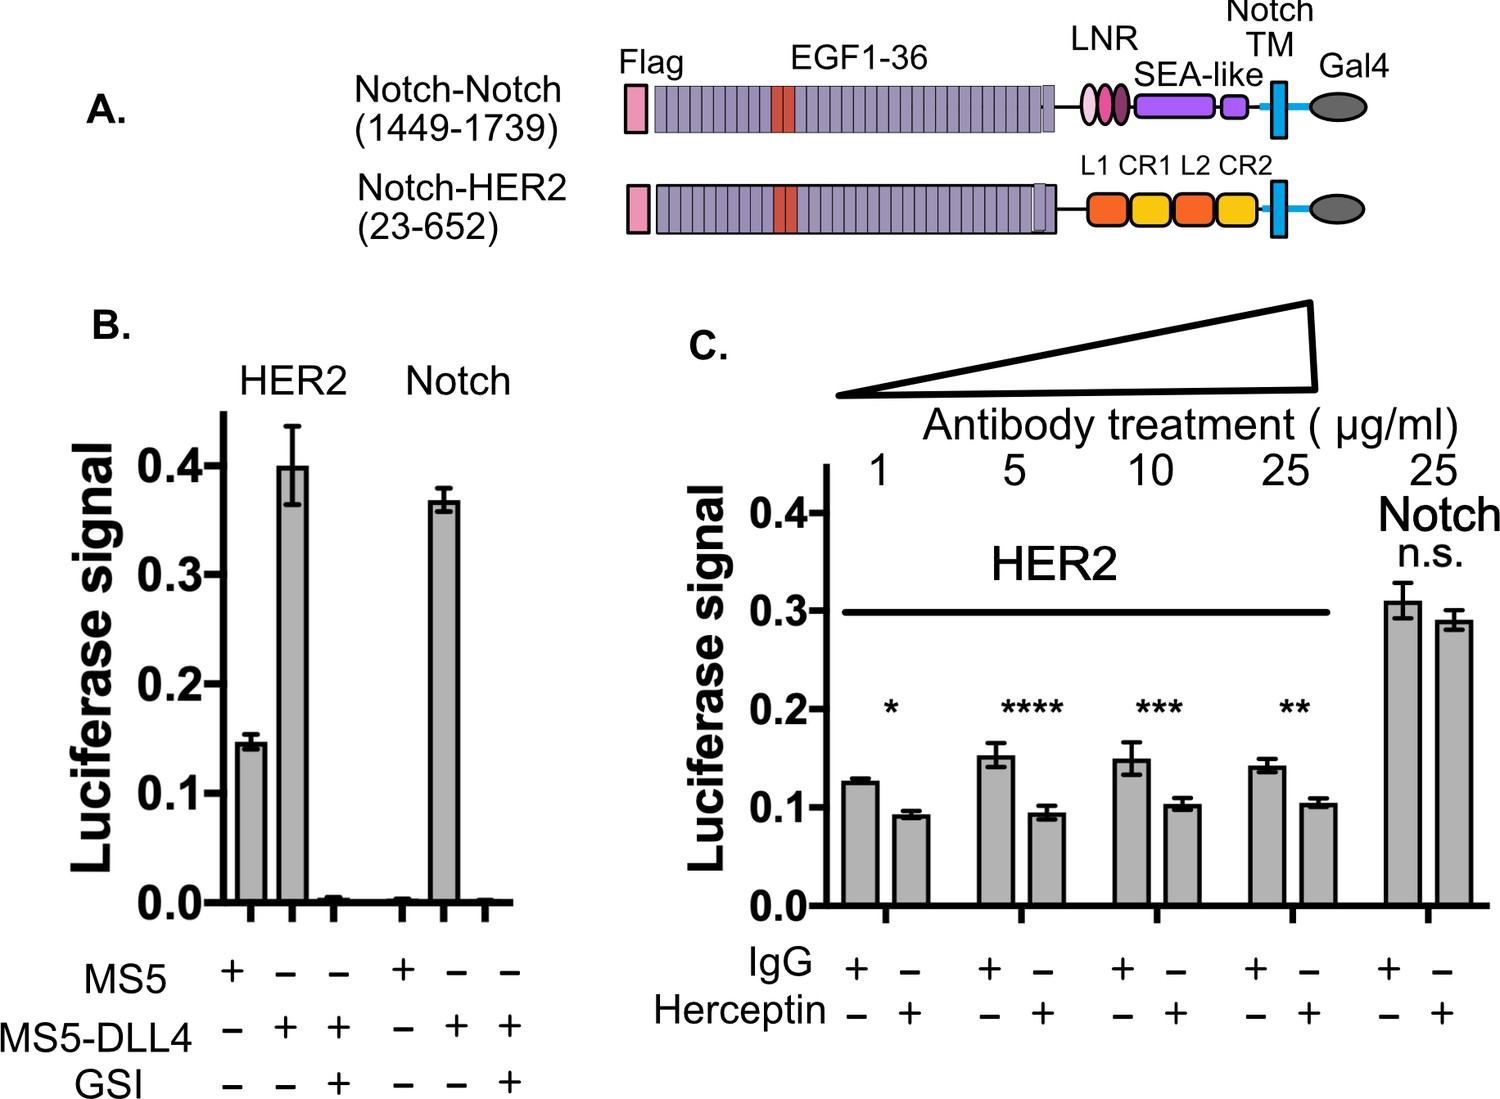
SNAPS detects HER2 shedding and shedding modulation by Herceptin.
(A) Chimera constructs for Notch and HER2 (human epidermal growth factor receptor 2. Protein domains are color coded and labeled. (B,C) SNAPS assay measuring effect of Herceptin on basal signaling of HER2-Notch chimeras. Data shown are triplicate measurements from a representative experiment, error bars are SEM. (B) Untreated cells in co-culture with MS5 or MS5-DLL4 cells ± GSI for reference. (C) HER2-Notch chimera expressing cells co-cultured with MS5 cells were treated with 1–25 ug/ml Herceptin or IgG control. Statistical significance was determined with a two-way ANOVA followed by a post-hoc Bonferroni test. ****: p<0.0001, ***: p<0.001, **:p<0.01 *: p<0.02.
Figure 4 with 1 supplement
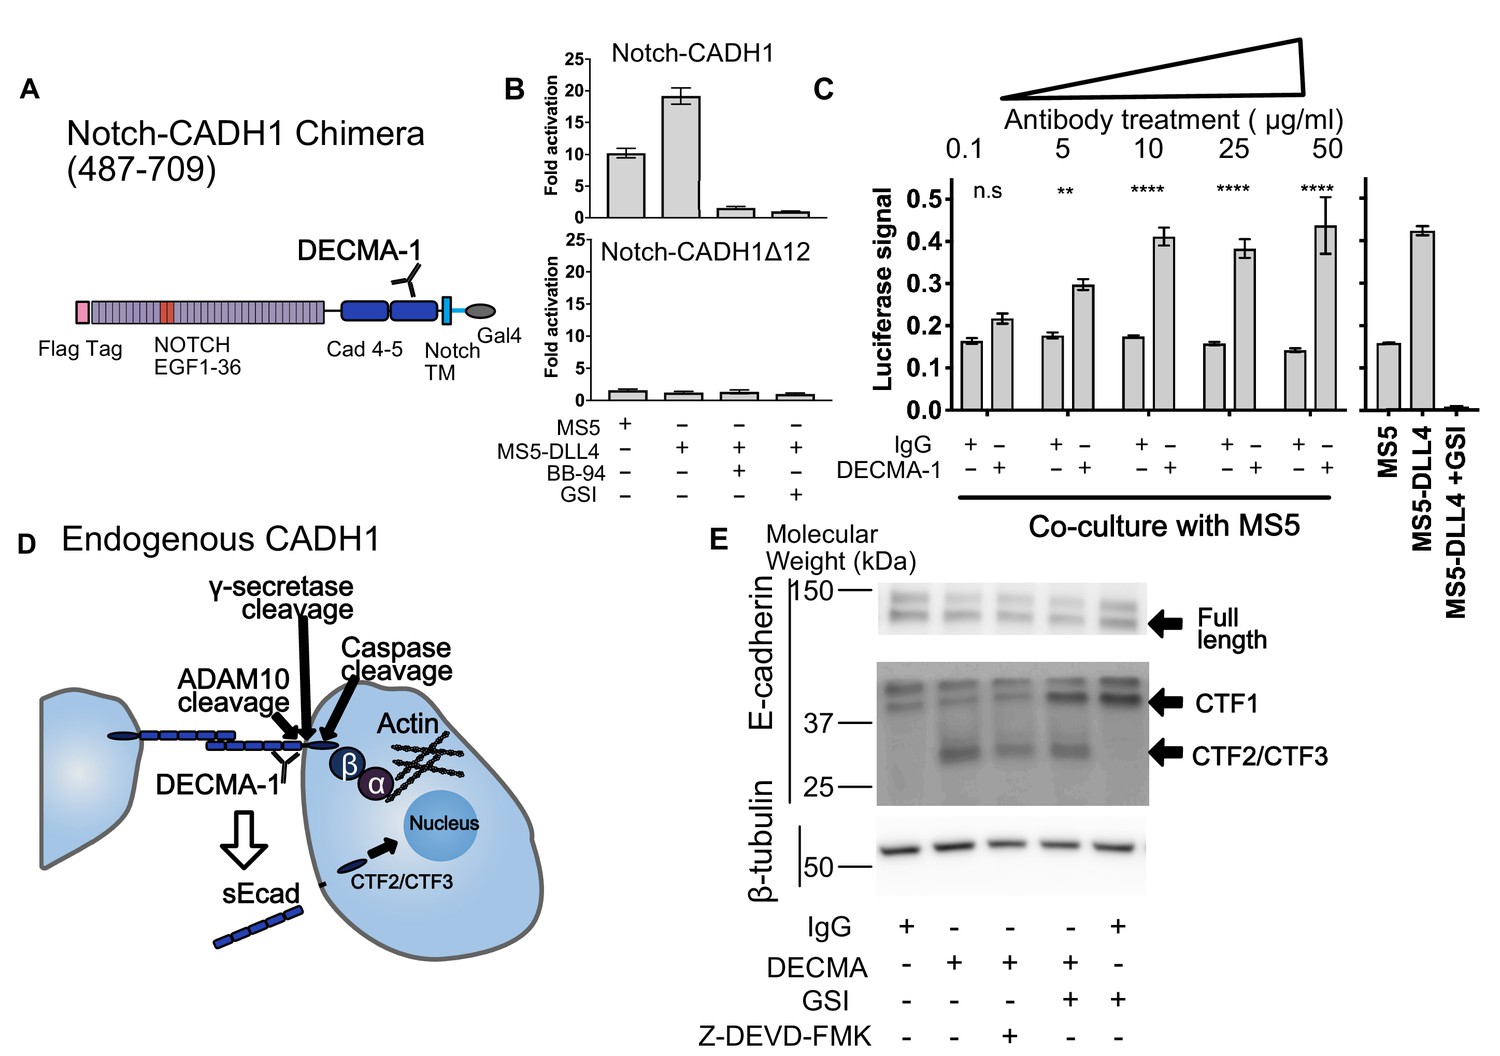
SNAPS reveals that E-cadherin proteolysis is a likely mechanism for DECMA-1 disruption of cell-cell adhesion.
(A) Scheme of Notch-E-cadherin (CADH1) chimera in which cadherin repeats 4 and 5 replace the Notch NRR. (B) SNAPS assay on Notch-CADH1 chimera (top) and a construct with 10 amino acids containing putative cleavage sites removed (bottom). Assay normalized for GSI treatment. (C) SNAPS assay in which Notch-CADH1 chimeras were co-cultured with MS5 cells and treated with increasing concentrations of IgG control or DECMA-1. Raw luciferase signal shown. Untreated Notch CADH1 chimera shown on right for reference. Data shown are triplicate measurements from a representative experiment, error bars are SEM. Statistical significance was determined with a two-way ANOVA followed by a post-hoc Bonferroni test. ****: p<0.0001, ***: p<0.001, **:p<0.01 *: p<0.02. (D) Schematic of E-cadherin in its native context, with previously observed ADAM10, intramembrane, and caspase cleavage locations denoted as well as epitope of DECMA-1 binding. Beta-catenin (β) binds to cadherin’s intracellular tail and can be translocated to the nucleus when E-cadherin is proteolyzed. (E) Western blot of E-cadherin cleavage products in MCF7 cells upon treatment with IgG control or DECMA-1 and inhibitors of gamma-secretase (GSI) and caspase cleavages (Z-DEVD-FMK).
Figure 4—figure supplement 1
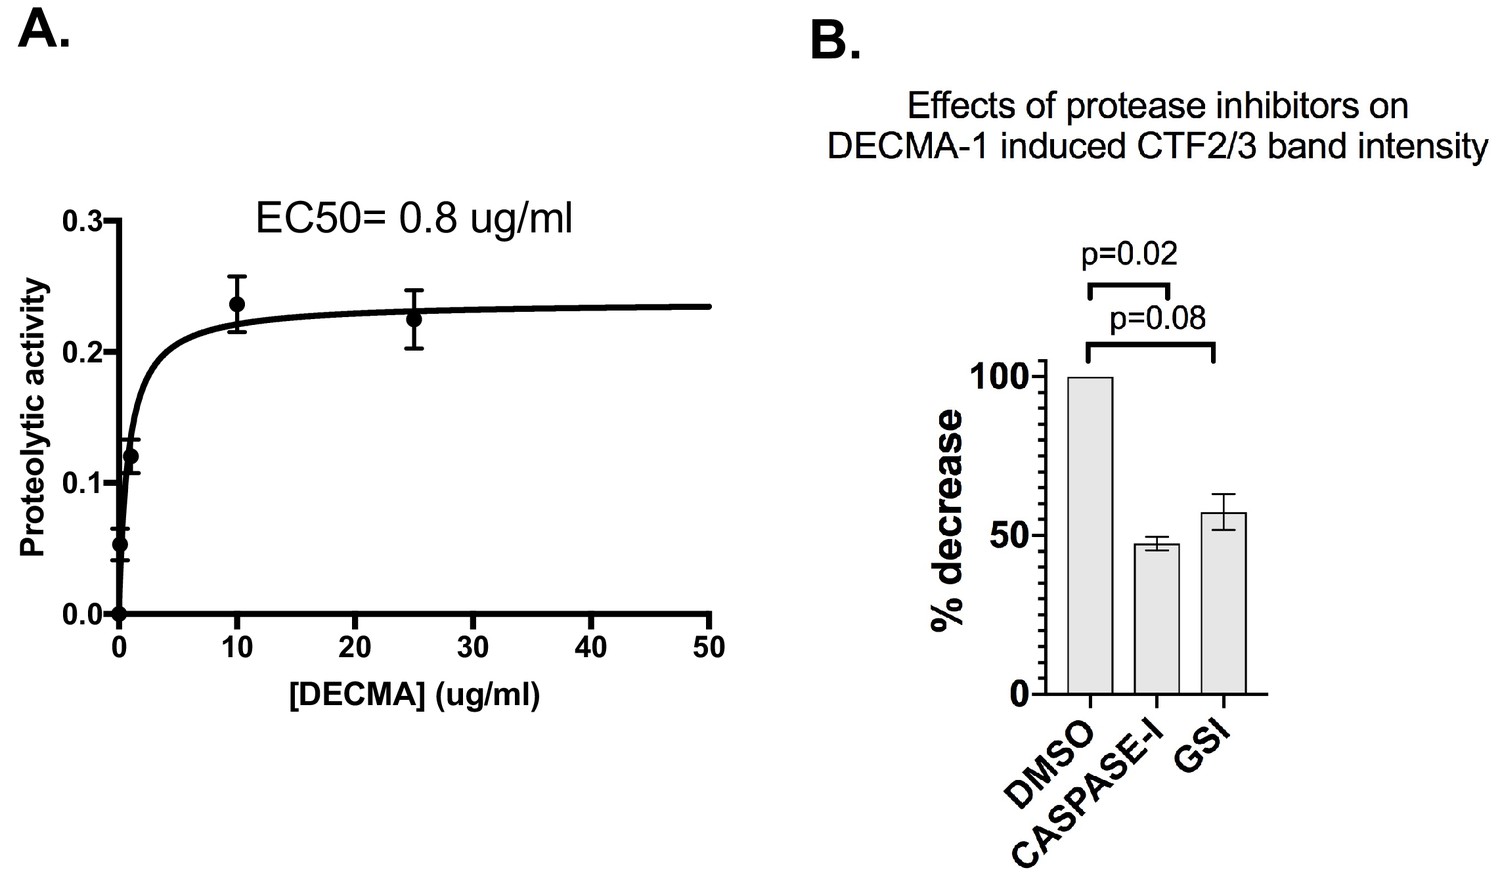
DECMA-1 additional quantification.
(A) EC50 calculation. The dose-dependent proteolytic activity enhancement of DECMA-1 was calculated by first subtracting the IgG control luciferase signal from the DECMA-1 signal at each concentration. The data was fit to a single exponential using Prism, including outlier detection. (B) Western blot quantification of CTF2/3 intensity in presence of protease inhibitors. The intensities of the DEMCA-1 induced CTF2/3 bands and their corresponding tubulin control from two experiments were quantified using Fiji. CTF2/3 bands were normalized to the corresponding tubulin band. The DMSO condition was normalized to 100% intensity and the %decrease calculated and averaged between the two blots. p-Values were calculated using two-way ANOVA followed by a post hoc Bonferroni test.
Additional files
-
Supplementary file 1
Amino acid sequences for all proteolysis domains used in Notch-X chimeras.
- https://doi.org/10.7554/eLife.46983.012
-
Transparent reporting form
- https://doi.org/10.7554/eLife.46983.013
Download links
A two-part list of links to download the article, or parts of the article, in various formats.
Downloads (link to download the article as PDF)
Open citations (links to open the citations from this article in various online reference manager services)
Cite this article (links to download the citations from this article in formats compatible with various reference manager tools)
A toolkit for studying cell surface shedding of diverse transmembrane receptors
eLife 8:e46983.
https://doi.org/10.7554/eLife.46983


