TLR induces reorganization of the IgM-BCR complex regulating murine B-1 cell responses to infections
- University of California, Davis, United States
- University of Freiburg, Germany
- Institute of Biology III at the Faculty of Biology of the University of Freiburg, Germany
Figures
Figure 1
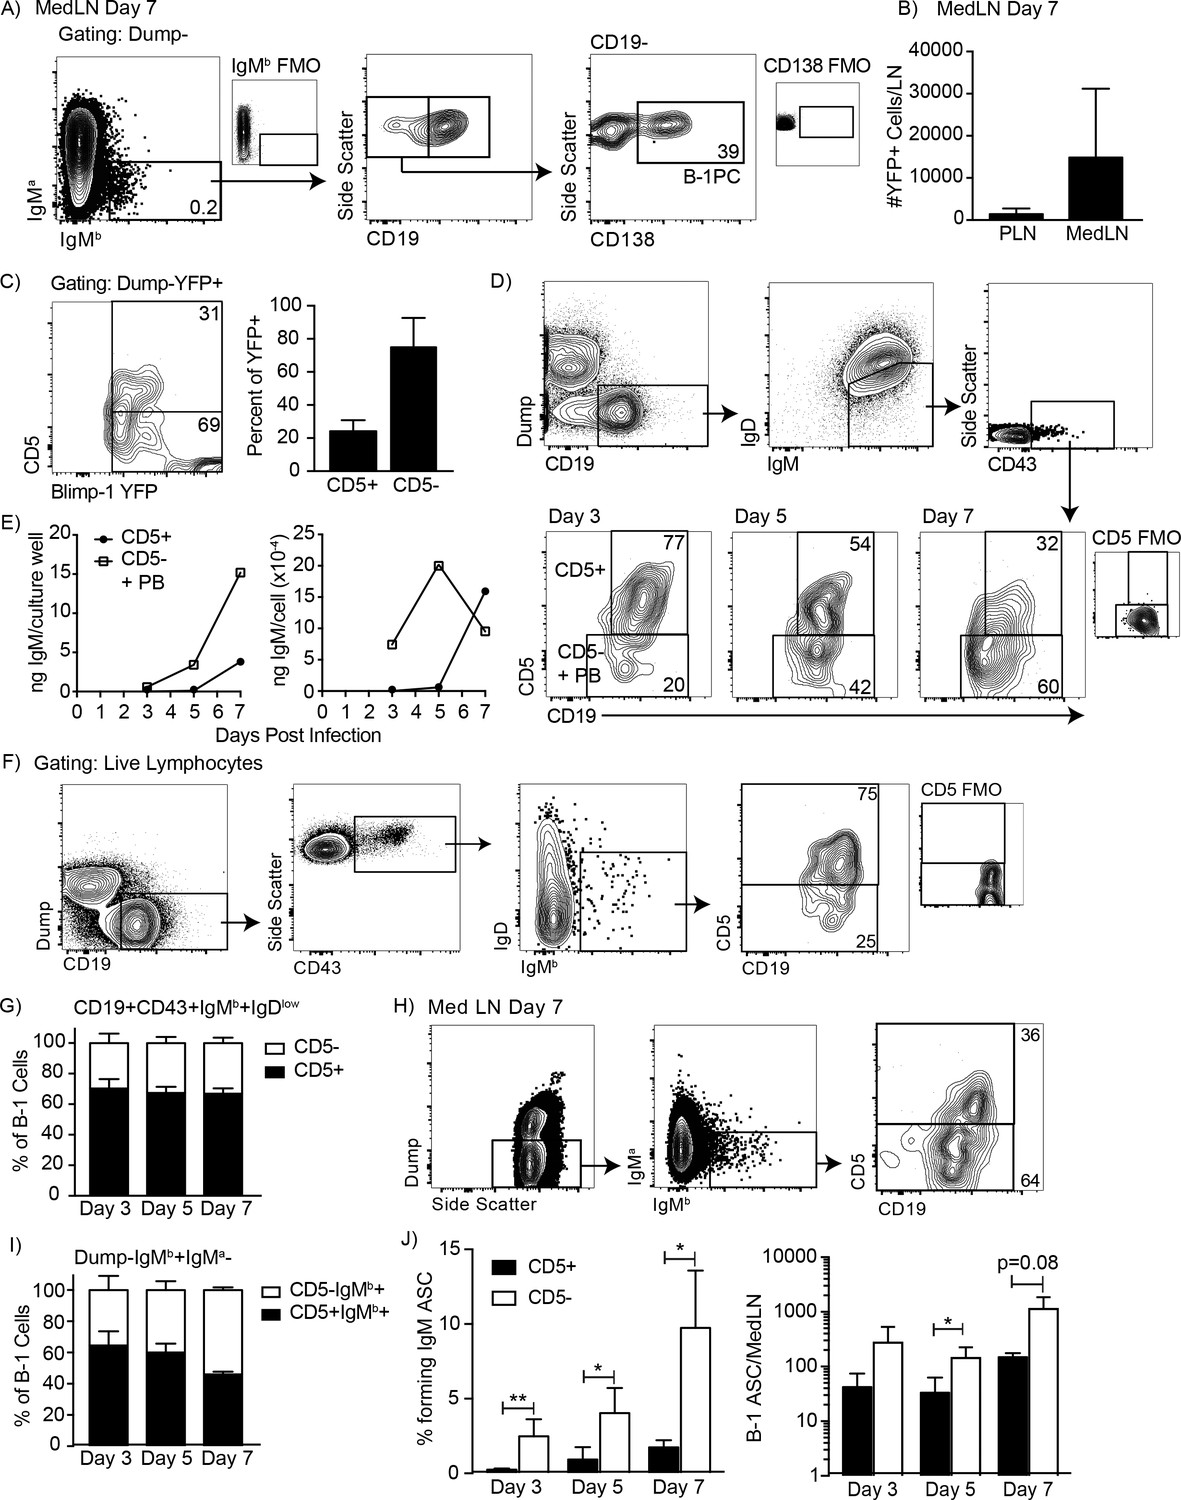
CD5 negative B-1 cells secrete most IgM in the mediastinal lymph nodes (MedLN) after influenza infection.
(A) FACS plot of MedLN cells from day seven influenza-A/PR8-infected neonatal chimeric mice generated with Ighb B-1 donor cells and Igha host cells. Shown is gating to identify IgMb+CD19+B-1 cells and IgMb+CD19 CD138+B-1PC. FMO, ‘fluorescence minus one’ control stains. (B) Mean number ± SD of Blimp YFP+ cells in peripheral LN (PLN) and MedLN of day seven influenza-infected neonatal chimera generated with B-1 donor cells from Blimp-1-YFP mice (n = 4). (C) FACS plot (left) and (right) mean percentage ± SD of CD5+ and CD5- cells among total Blimp-1 YFP+ cells (n = 13). (D) FACS gating strategy for sorting CD19+IgM+IgDloCD43+CD5+ or CD5- cells in the MedLN on days 3, 5, or seven after influenza infection of C57BL/6 mice, pooled from n = 2–3 per time point. (E) Concentration (ng/ml) IgM in supernatant (left) and secreted (ng x 10−4) per cell (right) of sorted cells measured by ELISA. (F) FACS gating strategy and (G) mean percentage ± SD of CD19+CD43+IgMb+IgDlo and CD5+ or CD5- B-1 cells among at indicated times after infection (n = 6–7 per time point). (H–I) Samples from (G) regated to show total B-1 populations. (H) Sample FACS plot and (I) percentage ± SD of CD5+ and CD5- B-1 cells among total (Dump- IgMb+ IgMa-) B-1 cells at indicated times after infection (n = 6–7 per time point). (J) Mean percentage ± SD (left) and total number ± SD (right) of FACS-sorted CD5+ and CD5- B-1 cells (IgMb+IgMa-) that formed IgM antibody-secreting cells (ASC) in each MedLN, as measured by ELISPOT (n = 3–4 per time point). Results are representative of >4 (A), 3 (B), and 2 (F, I), or are combined from 2 (D, E, G, H) or 3 (C) independent experiments. Values in (I) were compared by unpaired Student’s t test (*=p < 0.05, **=p < 0.005).
Figure 2 with 1 supplement
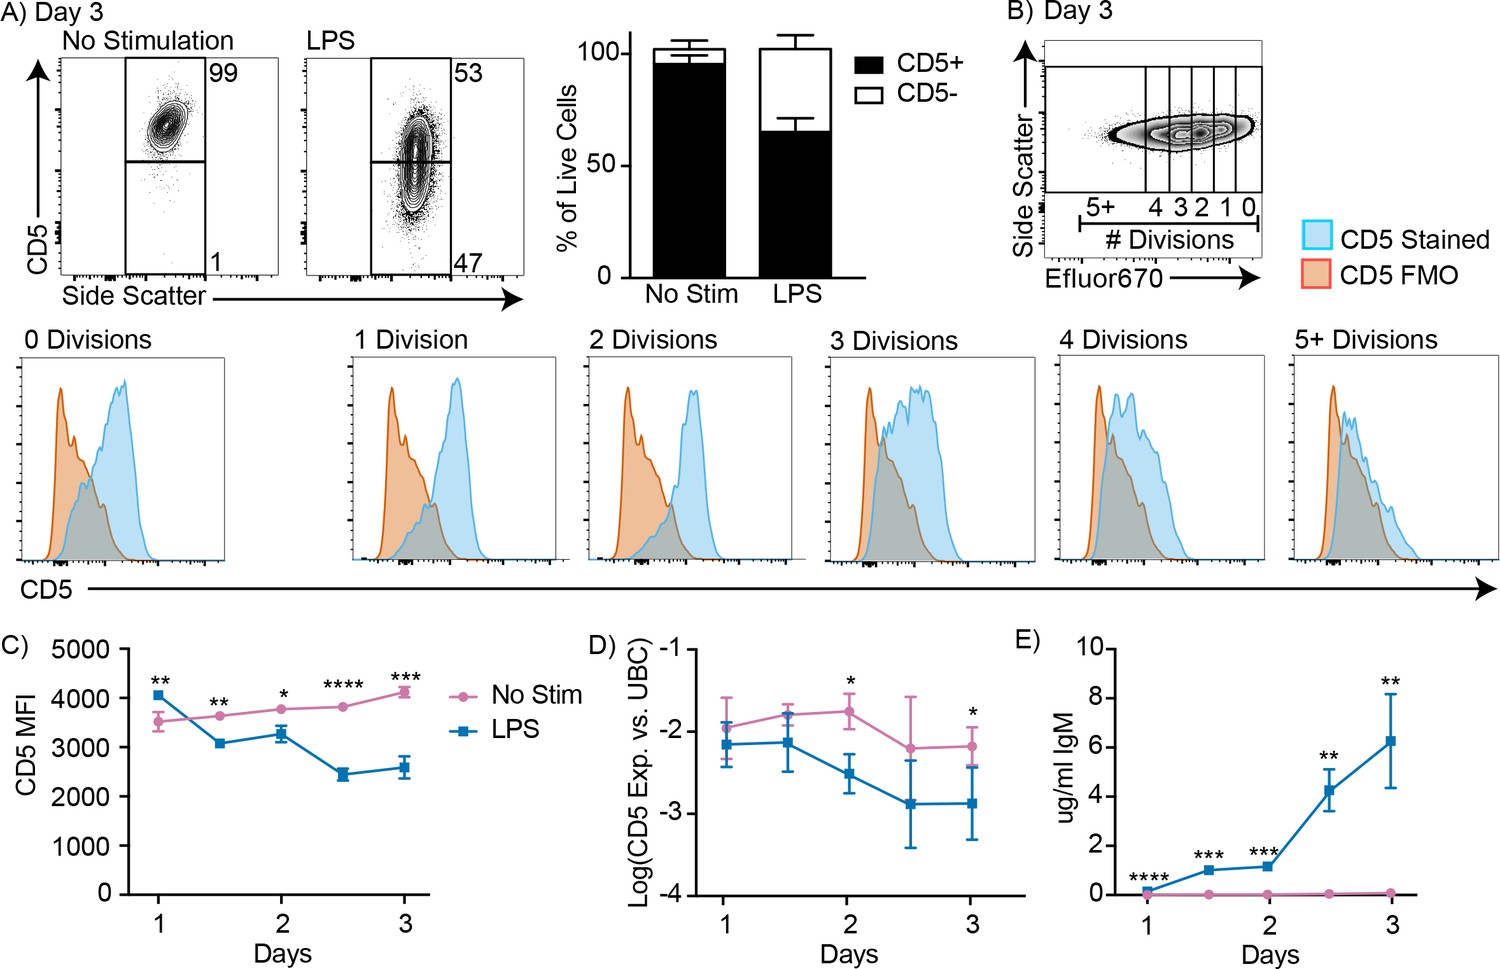
CD5+ B-1 cells decrease CD5 expression after LPS stimulation in vitro.
(A) Representative FACS plots (left) and mean percentage ± SD (right) of CD5+ and CD5- B-1 cells after FACS-purified peritoneal cavity CD19+ CD23- CD5+ B-1 cells were cultured with or without 10 µg/ml LPS for 3 days (n = 18). (B) CD5 expression on FACS-purified Efluor 670-stained proliferating peritoneal cavity CD5+ B-1 cells stimulated with LPS compared to CD5 FMO (fluorescence minus one) control. (C) Mean CD5 MFI ± SD, determined by flow cytometry, (D) mean Log(cd5 mRNA expression) ± SD, determined by qRT-PCR, and (E) mean IgM secretion ± SD (µg/ml), determined by ELISA, after purified peritoneal cavity CD5+ B-1 cells were cultured for indicated times with LPS (n = 3–4 per time and data point). Results are combined from 4 (A), or are representative of >5 (B), and 2 (C-E) independent experiments, respectively. Values in (C–E) were compared using an unpaired Student’s t test (*=p < 0.05, **=p < 0.005, ***=p < 0.0005, ****=p < 0.00005).
Figure 2—figure supplement 1

CD5- B-1 cells do not survive better or proliferate more compared to CD5+ B-1 cells.
CD5+ and CD5- B-1 cells isolated by FACS from the body cavities of wild type C57BL/6 mice were cultured separately or mixed as indicated for 72 hr in the presence or absence of LPS. (A) Sample FACS plots from cultures with or without LPS of purified CD5+ B-1 cells mixed or not with indicated percentages of CD5- B-1 cells. (B) Mean CD5 MFI ± SD (left) and mean percentage ± SD of CD5+ cells (right) of cultures in A (n = 3). (C) CD5+ (green) and CD5- (purple) B-1 cells were each labeled with either CFSE or Efluor670. Dyes used to label each population were switched for repeated experiments. (D) Mean percentage ± SD of live cells, or (E) of divided cells, (F) mean number of divisions ± SD among cells that had divided, and (G) mean percentage ± SD of cell numbers on day three compared to input numbers for CD5+ and CD5- cells cultured with LPS (n = 8). Results are representative of 2 (A–B) or 4 (D–G) independent experiments. Values in (B) and (D–G) were compared using an unpaired Student’s t test (*=p < 0.05, ****=p < 0.00005).
Figure 3
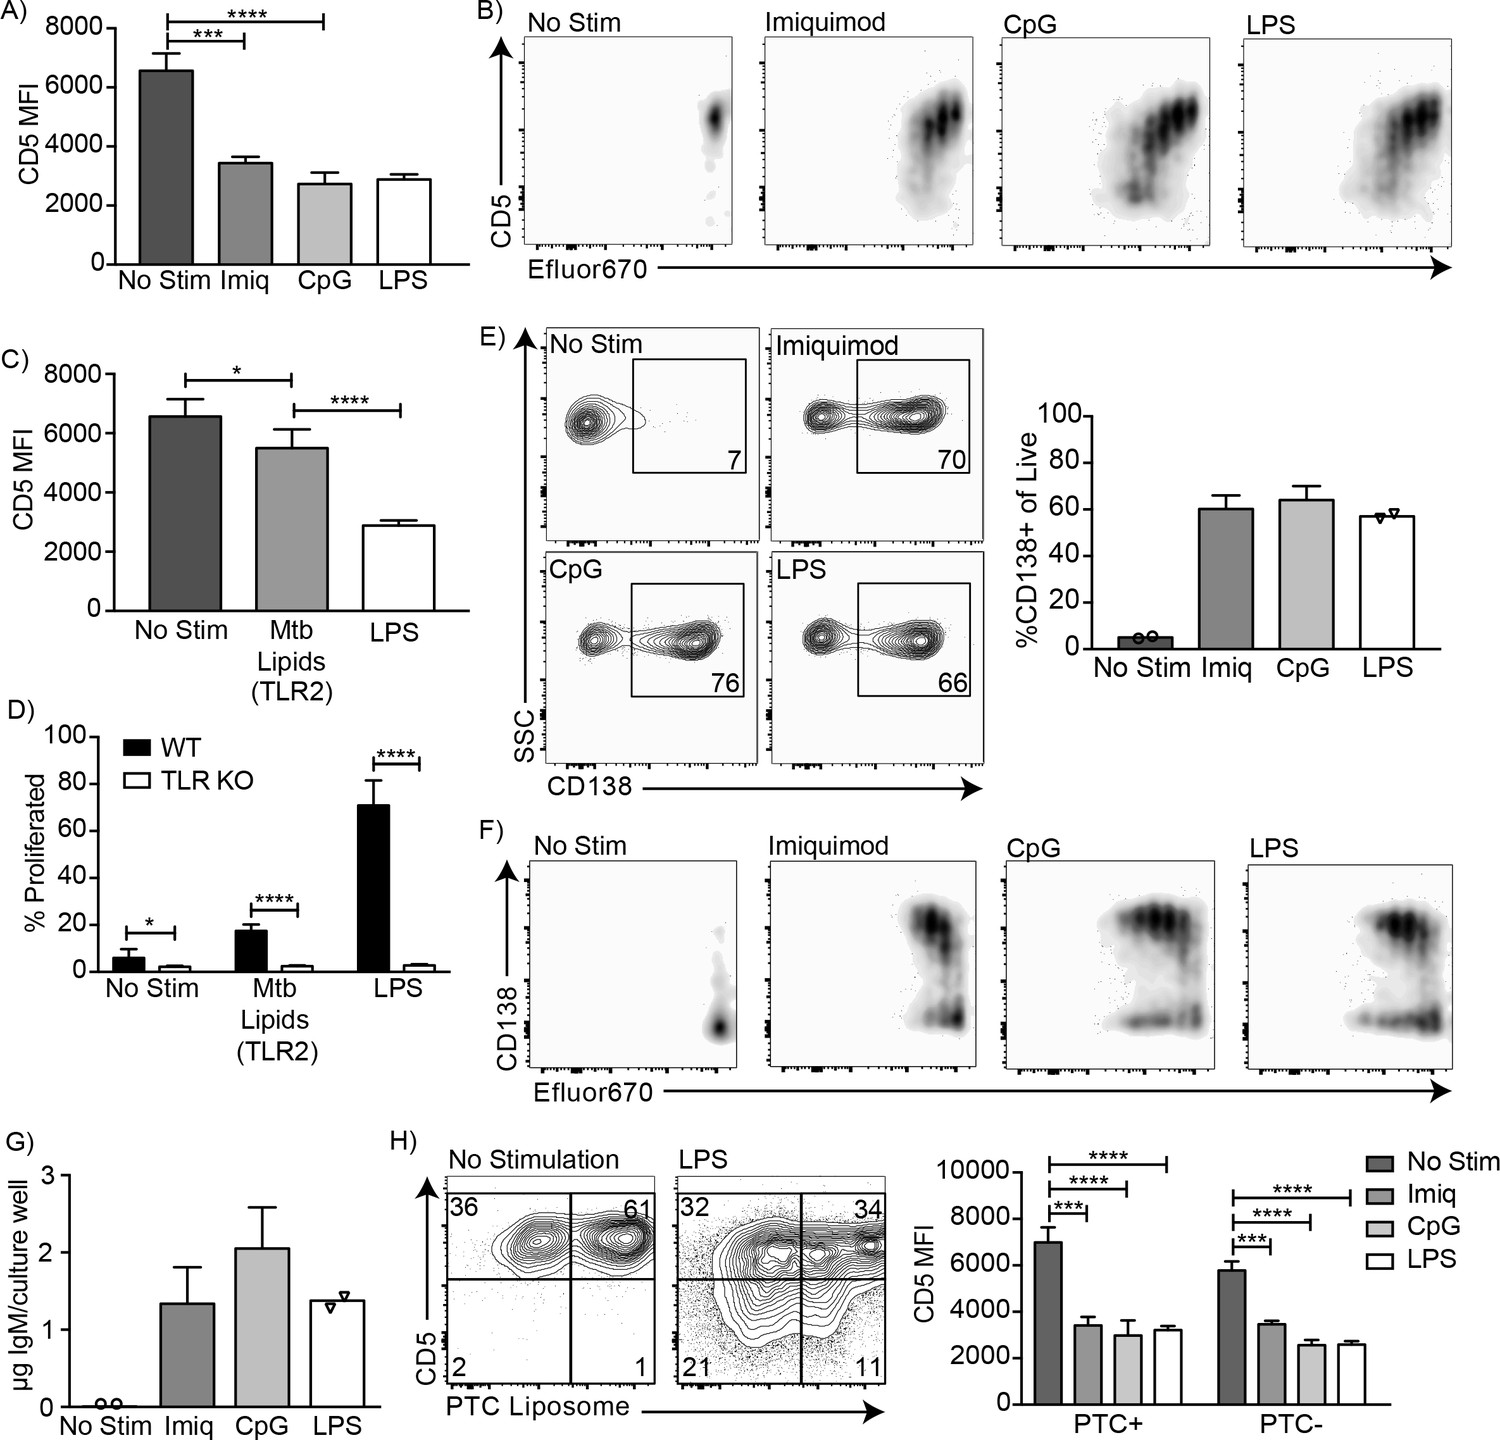
CD5+ B-1 cells differentiate into CD5- IgM secreting cells after TLR-mediated activation.
(A) CD5 MFI ± SD and (B) representative FACS plots for CD5+ B-1 cells cultured without stimulation or with Imiquimod (TLR7 agonist), CpG 7909 (TLR9 agonist), or LPS (TLR4 agonist) (n = 3–5). (C) Mean CD5 MFI ± SD of CD5+ B-1 cells cultured without stimulation or with Mycobacterium tuberculosis (Mtb) lipids (TLR2 agonist) or LPS (n = 4–5). (D) Mean percentage ± SD of B-1 cells from wild type (WT) or Tlr2−/−xTlr4−/−xUnc93b13d/3d (TLR KO) mice that underwent at least one division after culture without stimulation or stimulated with Mycobacterium tuberculosis (Mtb) lipids or LPS (n = 6–9 per group). (E) FACS plots (left) and mean percentage ± SD (right) of CD138+ cells, and (F) representative FACS plots for CD138 expression among proliferating cells. (G) Mean IgM concentration ± SD (µg total per culture well) of cultured CD5+ B-1 cells stimulated or not with Imiquimod (TLR7 agonist), CpG 7909 (TLR9 agonist), or LPS (TLR4 agonist) (n = 2 for no stimulation and LPS, n = 5 for Imiquimod and ODN). (H) Sample FACS plot (left) and mean CD5 MFI ± SD (right) of PTC liposome-binding (PTC+) and non-PTC liposome-binding (PTC-) cells for CD5+ B-1 cells cultured without stimulation or with Imiquimod (TLR7 agonist), CpG 7909 (TLR9 agonist), or LPS (TLR4 agonist) (n = 3–5). Results are combined from two (D, E–G), or are representative of three (A) or two (B, C, H) independent experiments, respectively. Values compared in (A, C–D) using an unpaired Student’s t test (*=p < 0.05, **=p < 0.005, ***=p < 0.0005, ****=p < 0.00005).
Figure 4 with 1 supplement
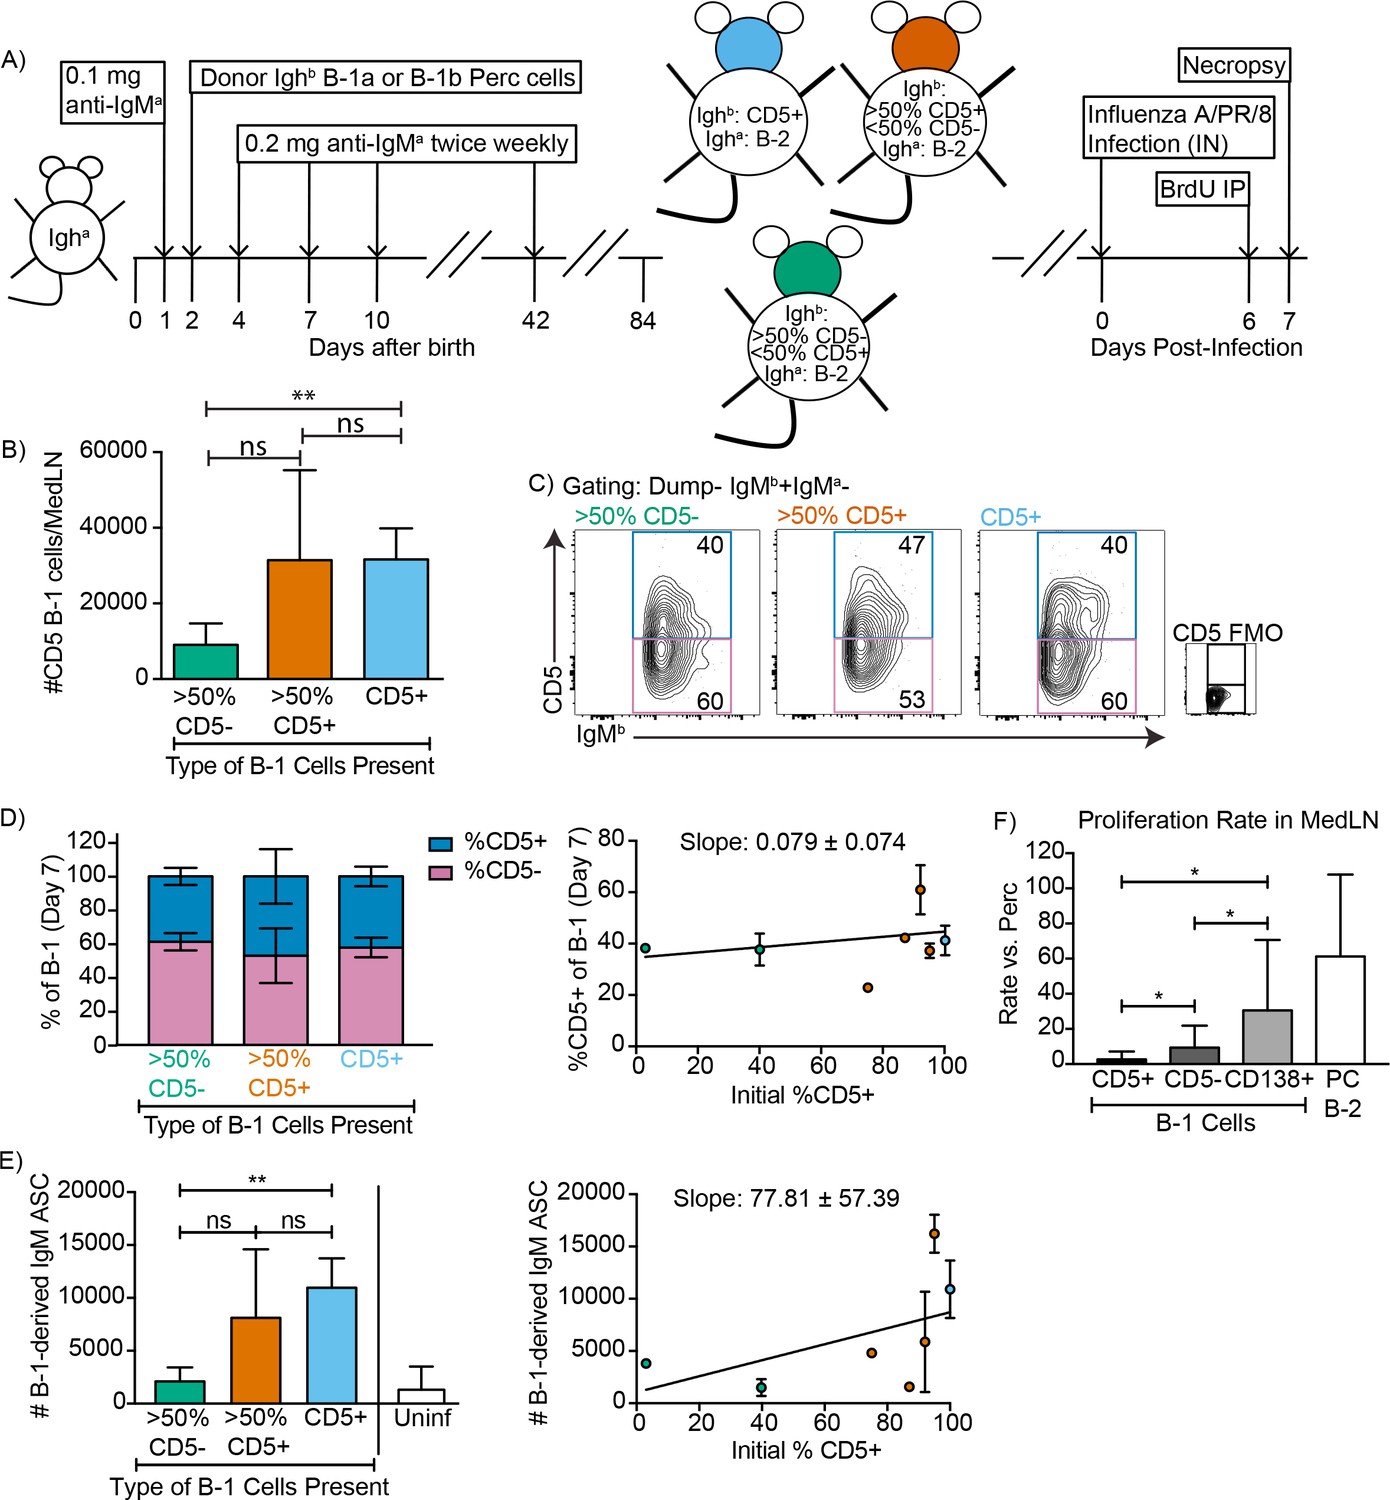
CD5+ B-1 cells differentiate to CD5- IgM ASC in the MedLN after Influenza infection.
(A) Neonatal chimeric mice were generated with FACS sorted CD19+ CD23- Ighb+ CD5+ (100%, blue), mostly CD5+ (orange), or mostly CD5- (green) peritoneal cavity-derived B-1 cells and infected with influenza A/Puerto Rico 8/34 for 7 days. (B) Mean number ± SD of B-1 cells in the MedLN of mice 7 days after infection. (C) FACS plot and (D, left) mean percentage ± SD of Dump- IgMb+ IgMa CD5+ and CD5- MedLN B-1 cells on day 7. CD5 FMO (fluorescence minus one) control for CD5. (D, right) Mice were grouped by initial percentage of CD5+ and CD5- B-1 cells (left) and % MedLN CD5+ B-1 cells present on days 0 (initial %) and 7 of infection were plotted with a line of best fit. (E) Mean B-1 derived IgM ASC ± SD per MedLN, grouped by initial percentage of CD5+ and CD5- cells (left) and plotted based on initial starting percentage of CD5+ cells (right) with a line of best fit. (F) Mean proliferation rate per day ± SD of CD5+, CD5-, and CD138+ B-1 cells and CD138+ B-2 cells (B-2 PC) in the MedLN of infected chimeras compared to proliferation rate per day of similar populations (B-1 or B-2 cells) in the peritoneal cavity of each mouse as determined by BrDU incorporation. Results for infected mice in (B–F) are combined from four independent experiments (n = 4 for>50% CD5-, n = 7 for>50% CD5+ cells, n = 5 for pure CD5+ cells). Results for uninfected chimeras in (E) are combined from three independent experiments, n = 6. Values in (B, D–F) were compared by unpaired Student’s t test (*=p < 0.05, **=p < 0.005).
Figure 4—figure supplement 1
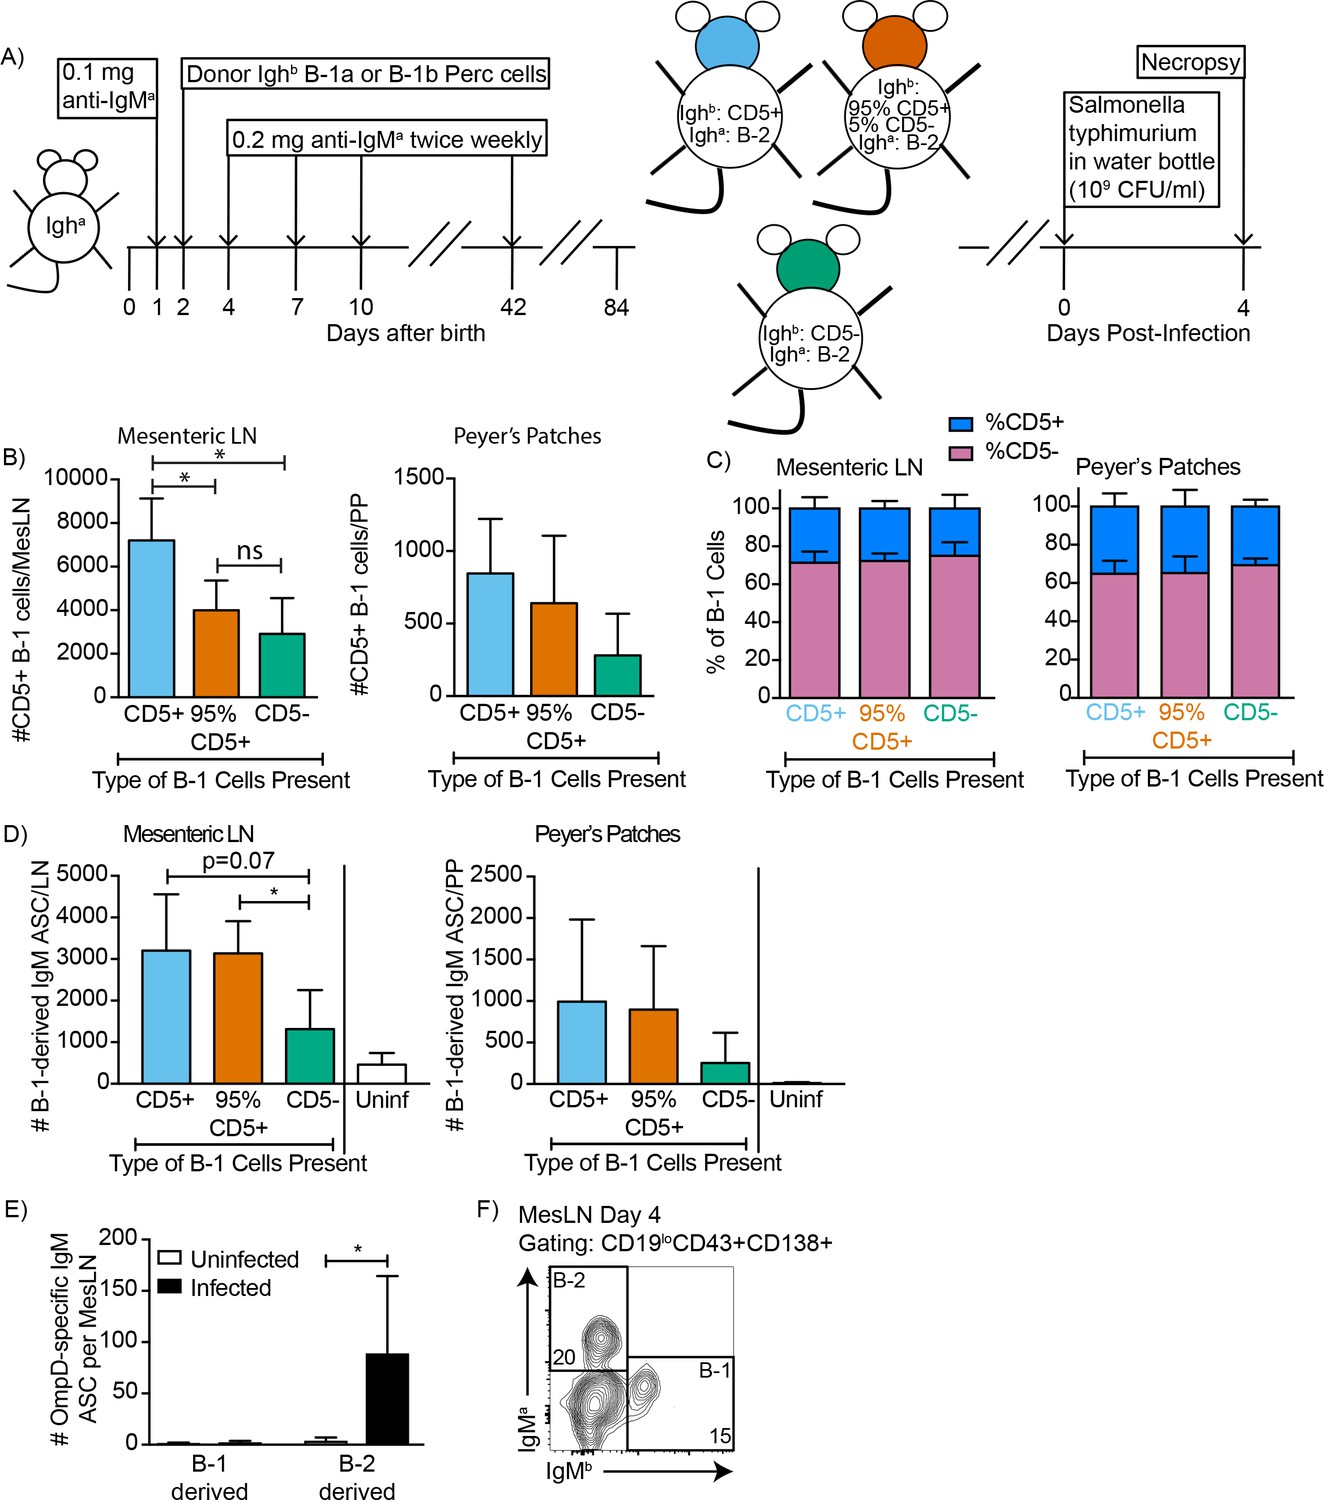
CD5+ B-1 cells differentiate to CD5- IgM ASC in the MesLN and Peyer’s patches after S. typhimurium infection.
(A) Neonatal chimeric mice were generated with FACS sorted Dump- CD19+ CD23- Ighb+ CD5+ (100%, blue), CD5- (98%, green), or mostly CD5+ (orange) peritoneal cavity B-1 cells. (B) Mean number ± SD of CD5+ B-1 cells (IgMb+IgMa-) per Mesenteric LN (MesLN) (left) and Peyer’s Patch (PP) (right) and (C) mean percentage ± SD of CD5+ and CD5- B-1 cells in the MesLN (left) and PP (right) on day four after oral infection with S. typhimurium via drinking water (n = 3, CD5-; n = 4, 95% CD5+; n = 6, CD5+). (D) Mean B-1 derived IgM ASC ± SD per MesLN (left) and PP (right) (n = 3, CD5-; n = 4, 95% CD5+; n = 6, CD5+, uninfected). (E) B-1 and B-2 derived OmpD-binding IgM ASC per MesLN in uninfected and infected neonatal chimeric mice (n = 5–6). (F) Sample FACS plot showing B-1 (IgMb+) and B-2 (IgMa+) derived IgM+ plasmablasts (CD19 low CD43+CD138+) in the MesLN on day four after oral infection with S. typhimurium. Results in (B–F) are combined from two independent experiments, uninfected chimeras in (D) are combined from three independent experiments. Values in (B–E) were compared with an unpaired Student’s t test (*=p < 0.05).
Figure 5
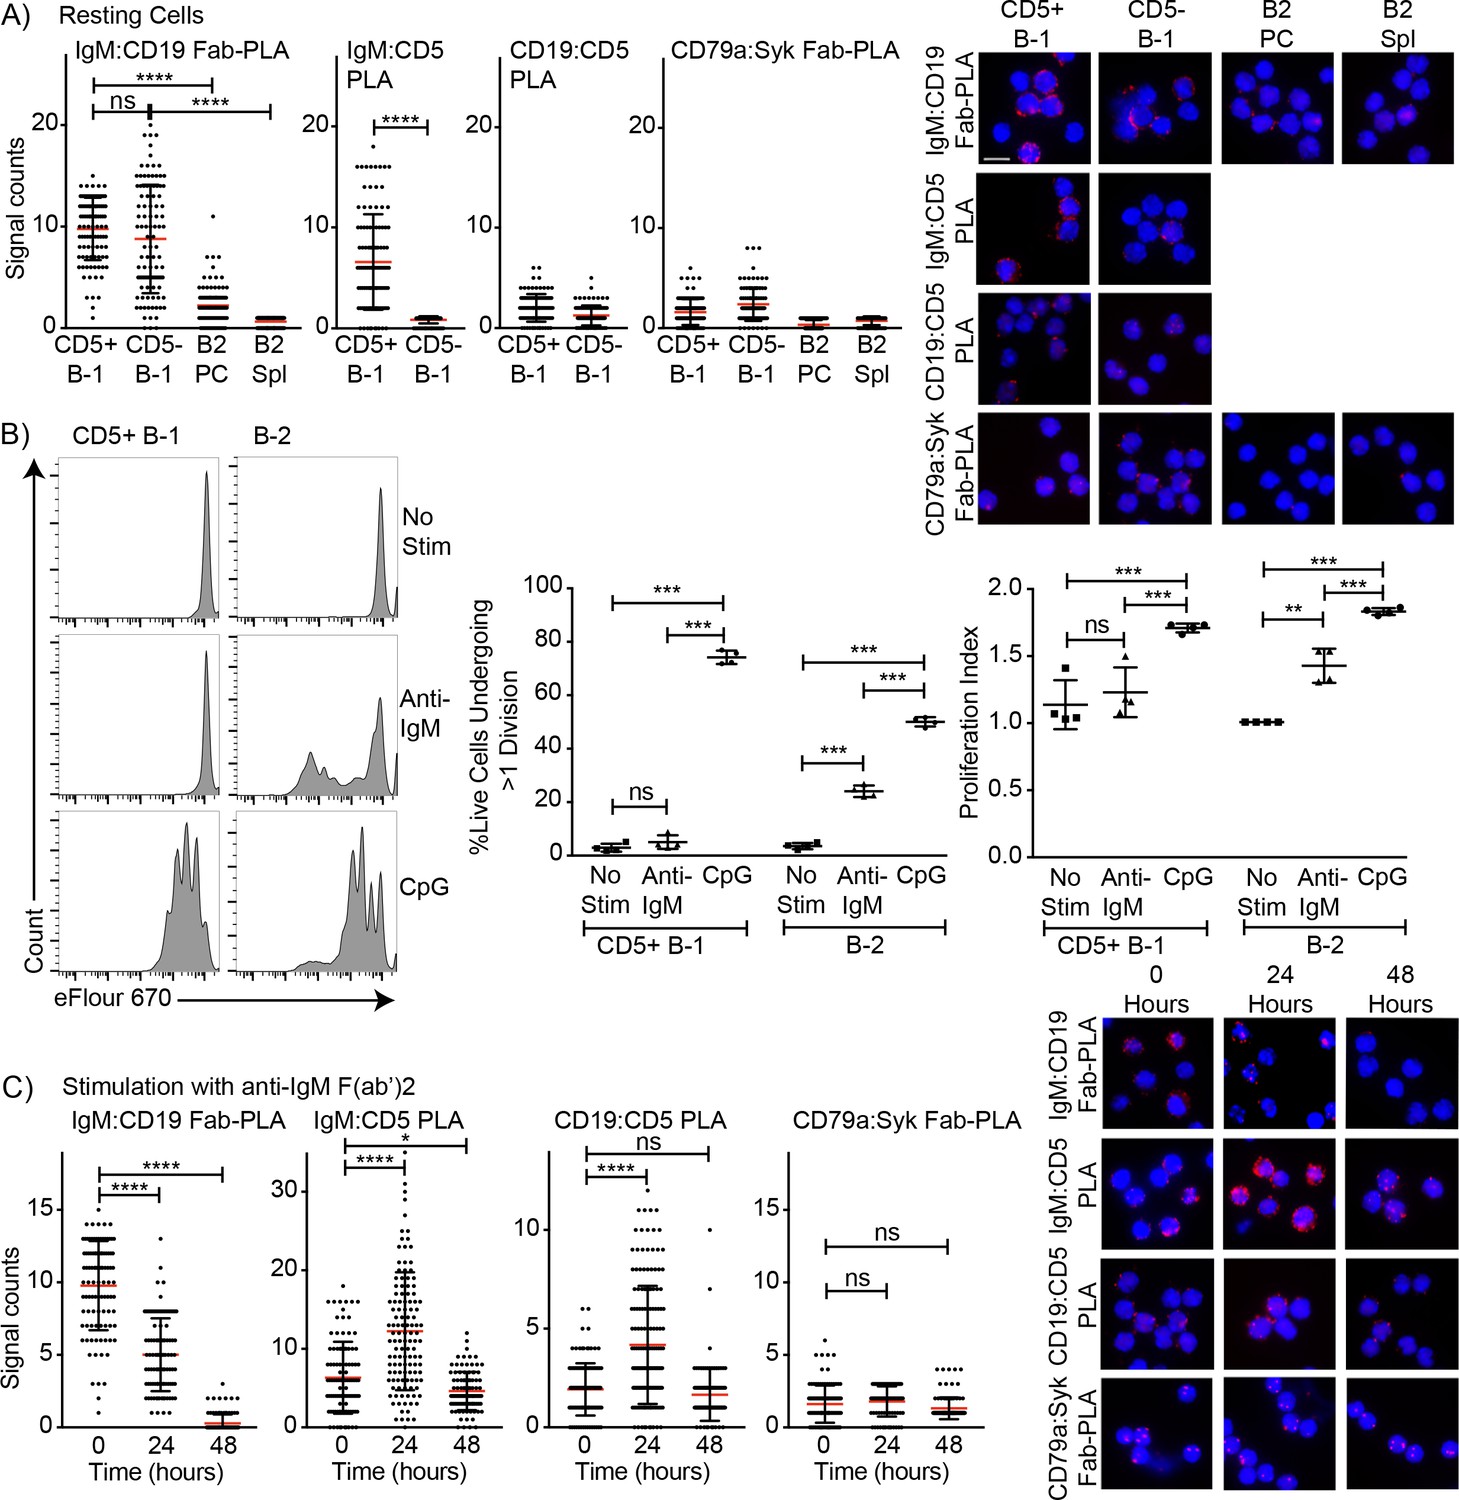
Association of CD5 with IgM-BCR in resting B-1a cells is increased after BCR-stimulation.
(A) Indicated FACS-purified B cell subsets from the peritoneal cavity (PC) and spleen (Spl) of BALB/C mice were analyzed by proximal ligation assay for the following interactions (left to right): IgM:CD19, IgM:CD5, CD19:CD5 and CD79:syk. Left panel shows summarizes data on signal counts for 200 individual cells analyzed. Each symbol represents one cell, horizontal line indicates mean signal count per cell. Right panel show representative fluorescent images. (B) FACS-purified CD19hi CD23- CD5+ CD43+ B-1 cells from the peritoneal cavity and CD19+ CD23+ splenic B-2 cells of BALB/C mice were labeled with efluor670 and then cultured in the absence (top) or presence of 20 ug/ml anti-IgM (middle) or 10 ug/ml CpGs for 72 hr. Left panels show representative histogram plots, middle panel shows the % cells in each culture having undergone at least one cell division and right panel indicates the proliferation index (average number of proliferations undergone per divided cell). (C) Summary of proximal ligation assay results of B-1 cells purified as in (A) and then stimulated for indicated times with anti-IgM(Fab)2. Interactions of the following proteins were analyzed on 200 cells per condition (left to right): IgM:CD19, IgM:CD5, CD19:CD5 and CD79:syk. Right panels shows representative fluorescent images from one experiment of at least two done. Values were compared using an unpaired Student’s t test (*=p < 0.05, **=p < 0.005, ***=p < 0.0005, ****=p < 0.00005).
Figure 6
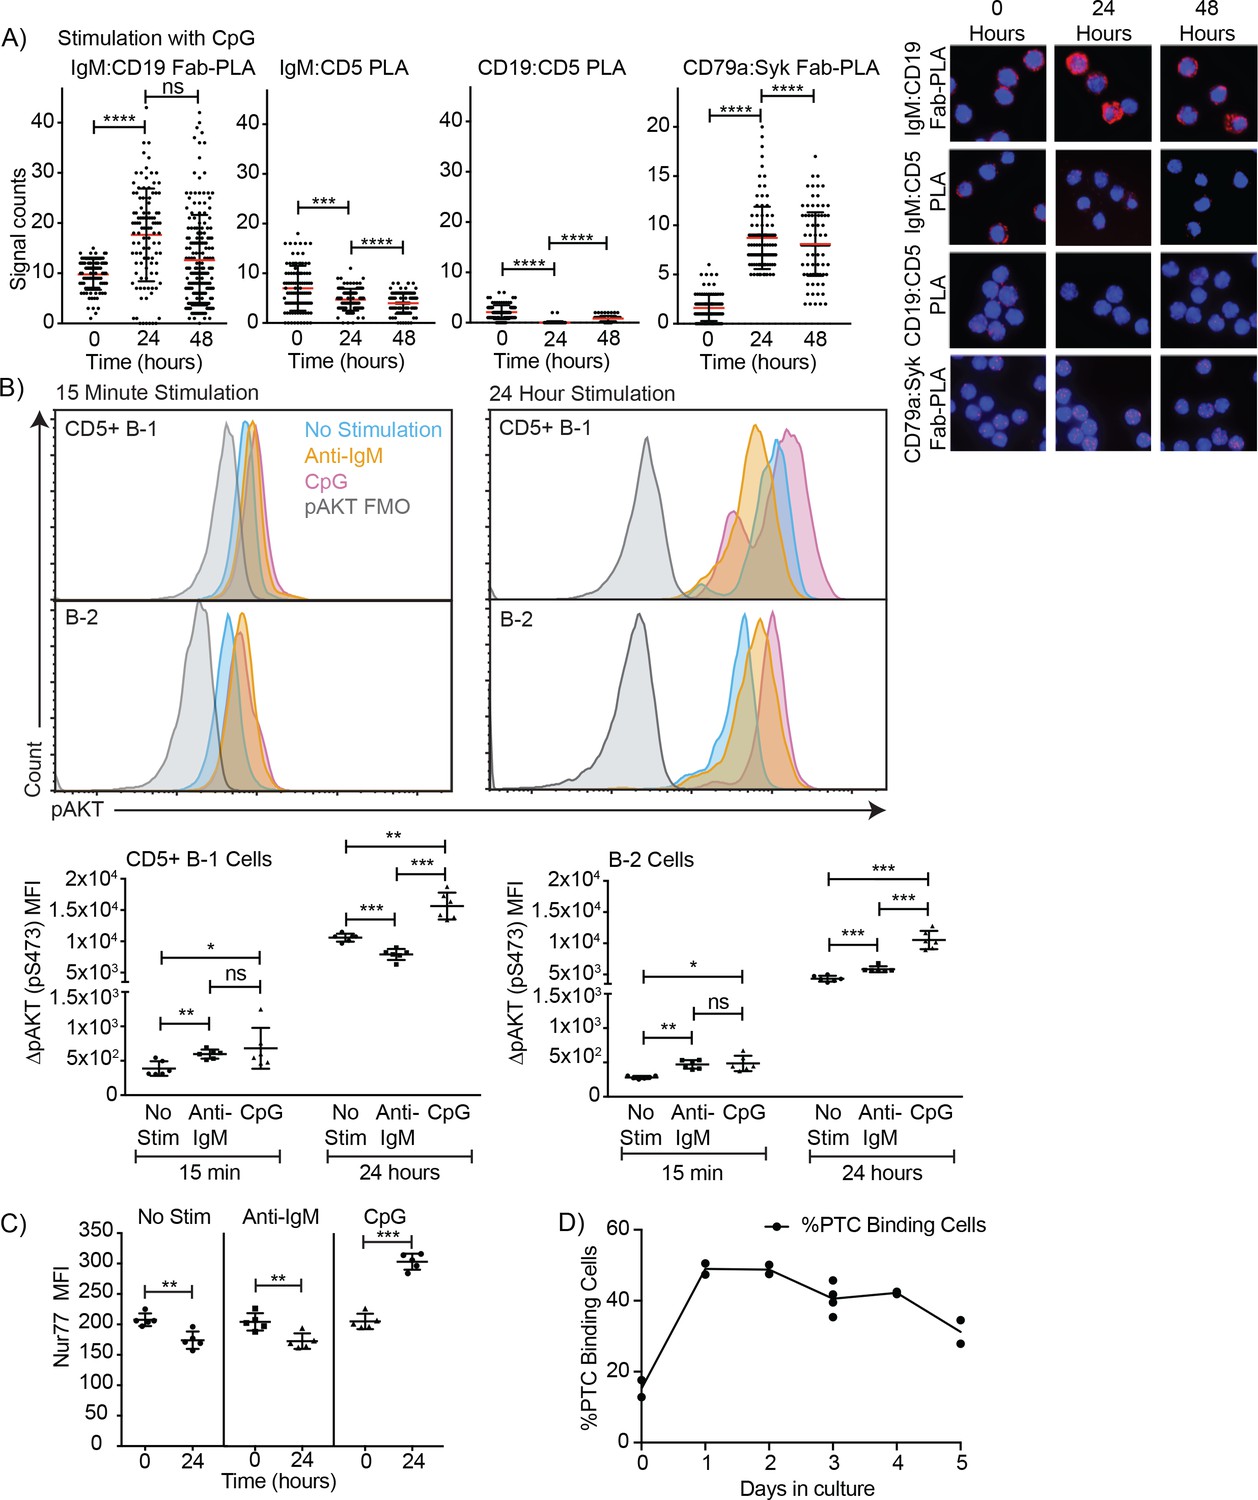
TLR-mediated stimulation of CD5+ B-1 cells alters the BCR-signalosome.
(A) FACS-purified peritoneal cavity CD19hi CD23- CD43+ CD5+B-1 and splenic CD19+ CD23+ CD43 CD5- B-2 cell of BALB/C mice were stimulated for the indicated times with TLR9-agonist ODN7909 prior to analysis by proximal ligation assay, probing for the following interactions (left to right): IgM:CD19, IgM:CD5, CD19:CD5 and CD79:syk. Left panel summarizes data on signal counts for 200 individual cells analyzed. Each symbol represents one cell, horizontal line indicates mean signal count per cell. Right panel show representative fluorescent images. (B) Analysis of the phosphorylation status of Akt by probing for Akt pS473 by flow cytometry on FACS-purified CD19hi CD23- CD5+ CD43+ B-1 cells from the peritoneal cavity and CD19+ CD23+splenic B-2 cells of BALB/C mice. Top panels show representative histogram plots, bottom summarizes the results. (C) Mean fluorescence intensity ± SD of staining for the immediate early activation factor Nur77, in CD5+ B-1 cells isolated as described in (A) and cultured for up to 2 days in the absence and presence of the indicated stimuli. (D) Shown are % frequencies of live PtC-binding B-1 cells among live FACS-purified CD5+ peritoneal cavity B-1 cells cultured with LPS stimulation for the indicated times, as assessed by flow cytometry. Each symbol represents results obtained from one culture well. Results are representative from experiments conducted at least twice with multiple repeats done per experiment (n = 2–5). Results in D are combined from two independent experiments. Values were compared using an unpaired Student’s t test (*=p < 0.05, **=p < 0.005, ***=p < 0.0005).
Figure 7
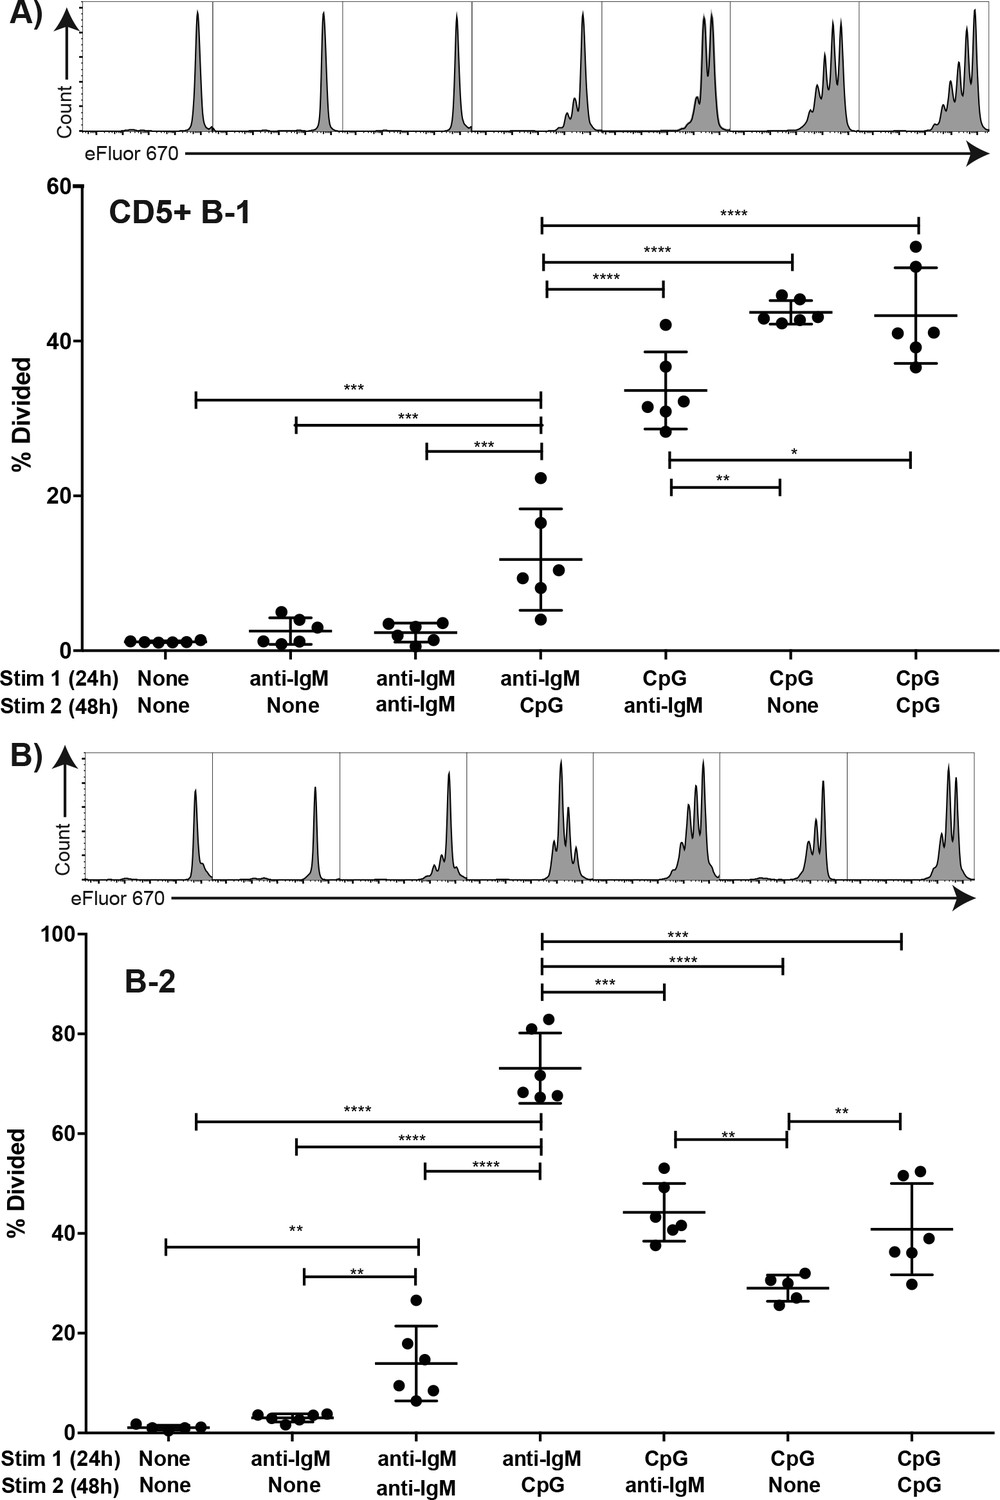
TLR but not BCR-stimulation induces CD5+ B-1 cell proliferation FACS-purified.
(A) peritoneal cavity CD19hiCD23- CD43+ CD5+ B-1 and (B) splenic CD19+ CD23+ CD43 CD5- B-2 cell from BALB/C mice were labeled with eFluor 670, rested for 2 hr and then cultured for 24 hr with the indicated stimulus 1 (none/anti-IgM at 10 μg/ml or CpG ODN7909 at 5 μg/ml), washed and recultured for 48 hr with stimulus 2 (none/anti-IgM at 10 μg/ml/ CpG ODN7909 at 5 μg/ml) prior to analysis for efluor 670 staining. Top panels show representative FACS histogram plots and bottom panels shows the % cells in each culture having undergone at least one cell division. Each symbol represents results from one culture well, horizontal line indicates mean for the group. Results are compiled from two independent experiments. Statistical analysis was done by one-way ANOVA, followed by an unpaired Student’s t test with Holm-Sidak correction for multiple comparisons (*p<0.05, **p<0.005, ***p<0.0005, ****p<0.00005).
Figure 8
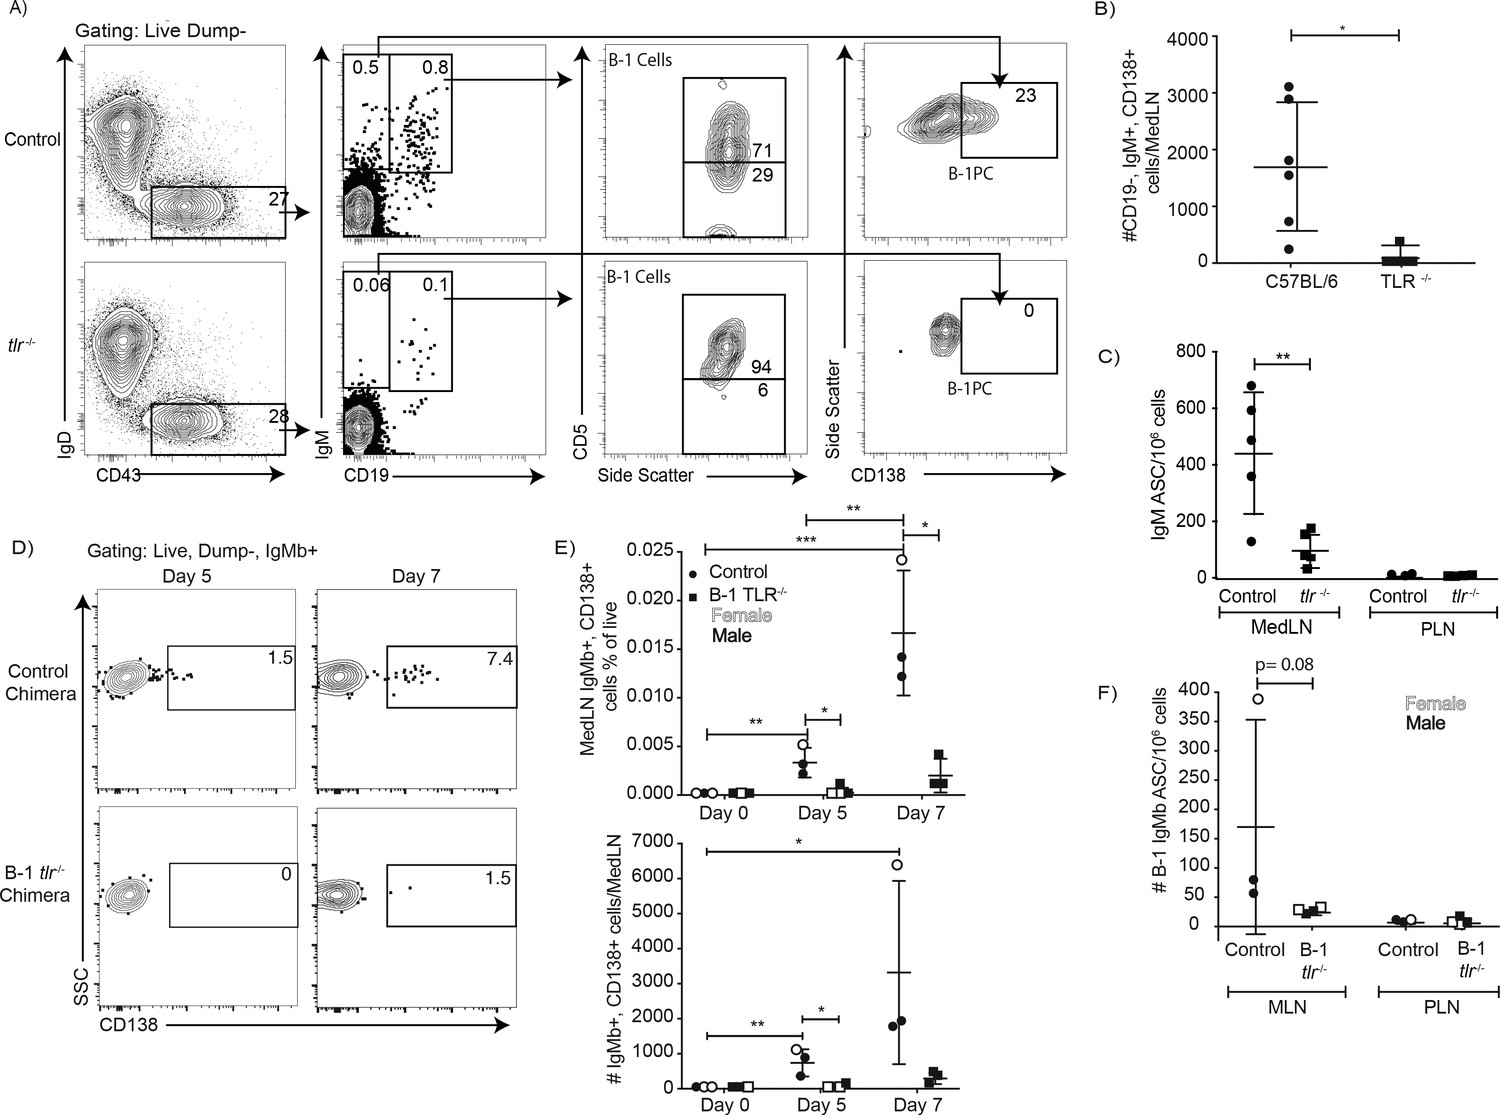
TLR-mediated stimulation is required for maximal IgM responses to influenza virus infection.
(A) C57BL/6 (n = 5) and congenic total TLR-deficient mice (n = 5; lacking TLR2, TLR4 and Unc93) were infected with influenza A/Puerto Rico/8/34 for 5 days. Shown are representative FACS plots from control C57BL/6 (top) and TLR-deficient (bottom) mice FACS analysis of MedLN for the presence of B-1 and B-1PC. (B) Number of B-1PC per MedLN as assessed by FACS and (C) number of IgM-secreting cells in MedLN as assessed by ELISPOT analysis. (D-F) Similar analysis as for A-C but using allotype chimeras generated with wild type recipients and B-1 cells from either C57BL/6 or tlr-/- mice. (D) Representative FACS analysis of CD138+ B-1PC pre-gated for live, dump-, B-1 donor (IgMb+) cells in MedLN on days 5 and 7 after influenza infection. (E) Mean ± SD of data summarized from analysis shown in D. (F) Mean ± SD of B-1 IgM-ASC in MedLN on day 7 after infection, as assessed by ELISPOT. Each symbol represents results from one mouse with female mice shown as open symbols, males as closed symbols. Results are combined from two independent experiments. Values were compared using an unpaired Student’s t test (*=p < 0.05, **=p < 0.005, n.s. not significant).
Tables
Key resources table
| Reagent type (species) or resource | Designation | Source or reference | Identifiers | Additional information |
|---|---|---|---|---|
| Strain, strain background (mouse) musculus (mouse), C57BL/6J (M + F) | C57BL/6, Control, Ighb | The Jackson Laboratories | Stock 000664 | Mus musculus (mouse), C57BL/6J (M + F) |
| Strain, strain background (mouse) | Igha | The Jackson Laboratories | Stock 001317 | Mouse, B6.Cg- Gpi1aThy1aIgha/J (M + F) |
| Strain, strain background (mouse) | BALB/C | The Jackson Laboratories | Stock 000651 | Mouse, BALB/CJ mice (F) |
| Strain, strain background (mouse) | Blimp-1YFP | Rutishauser et al., 2009 | Breeding pairs from Michel Nussenzweig (The Rockefeller University) Mouse, B6-Cg- Tg(PRDM1- EYFP)^(1Mnz) (M + F) | |
| Strain, strain background (mouse) | TLR-/- | Other | Breeding pairs from Greg Barton (The University of California, Berkeley) Mouse, Tlr2-/- Tlr4-/- Unc93b1^(3d/3d) (M + F) | |
| Strain, strain background (mouse) | Chimera | Lalor et al., 1989 | Generated in-house Mouse, Igha/Ighb B-1 Cell Neonatal Chimera | |
| Strain, strain background (mouse) | Chimera | Lalor et al., 1989 | Generated in-house Mouse, Igha/Ighb- YFP B-1 Cell Neonatal Chimera |
Additional files
-
Transparent reporting form
- https://doi.org/10.7554/eLife.46997.012
Download links
A two-part list of links to download the article, or parts of the article, in various formats.
Downloads (link to download the article as PDF)
Open citations (links to open the citations from this article in various online reference manager services)
Cite this article (links to download the citations from this article in formats compatible with various reference manager tools)
TLR induces reorganization of the IgM-BCR complex regulating murine B-1 cell responses to infections
eLife 8:e46997.
https://doi.org/10.7554/eLife.46997


