Variable opportunities for outcrossing result in hotspots of novel genetic variation in a pathogen metapopulation
- University of Helsinki, Finland
- University of Zurich, Switzerland
- Aalto University, Finland
Figures
Figure 1 with 11 supplements
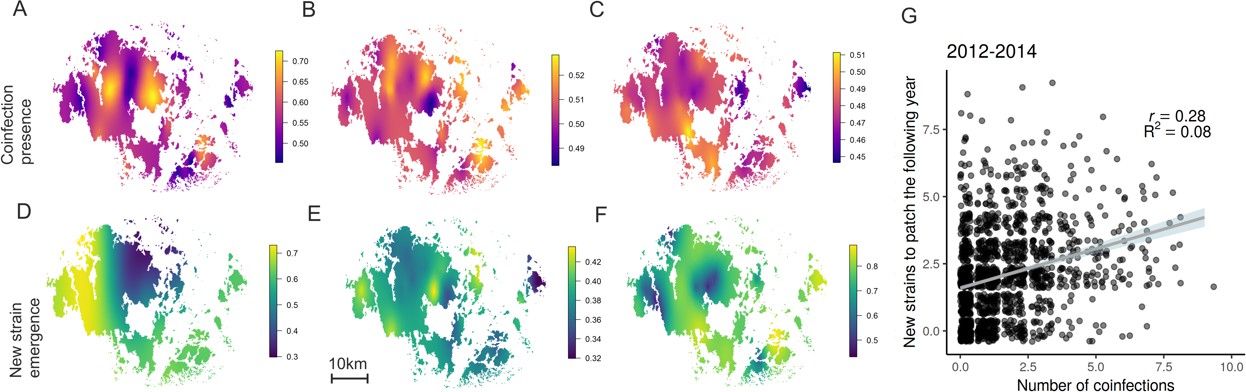
Hotspots for pathogen outcrossing - Novel pathogen genotypes emerge in populations with high prevalence of coinfection the previous year.
The heatplots for the spatial occurrence probability of coinfection in 2012–14 (A-C, respectively), and probability of a novel MLG emerging in pathogen populations in 2013–15 (D-F, respectively), were obtained by fitting spatial intercept-only models as presented in Table 1. The probabilities of events for each location were obtained from the linear predictor based on the estimated intercept and the spatial random field. Warmer tones correspond to areas of higher event occurrence probabilities. The number of genotyped samples supporting coinfection in a pathogen population correlated positively with the probability of detecting a MLG that had not been previously detected in that population using all data collected in 2012–15 (G). The fitted line corresponds to the 95% confidence level interval generated by the linear model in Table 1. Darker shades indicate higher data density.
Figure 1—figure supplement 1

The estimated posterior distributions of the spatial ranges for the fitted spatio-temporal models described in Table 1.
Range corresponds to the distance at which the spatial autocorrelation becomes negligible (smaller than 0.1).
Figure 1—figure supplement 2
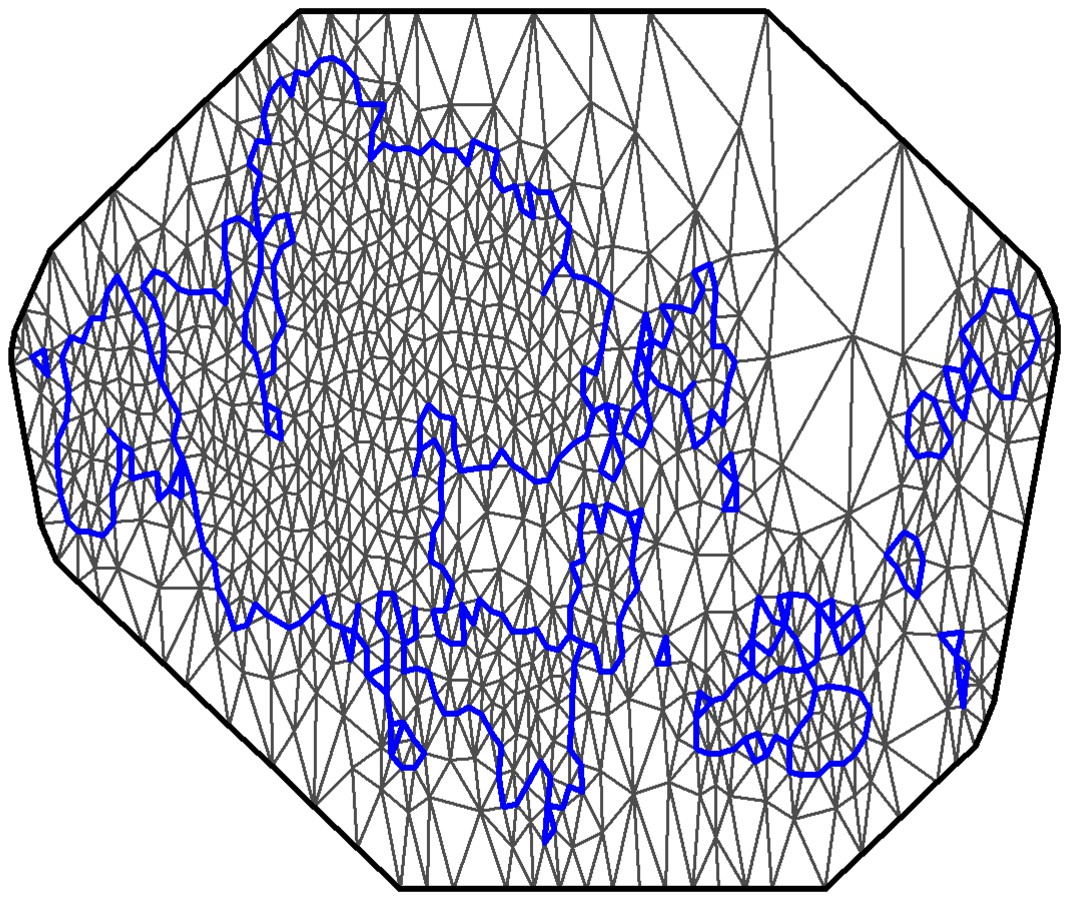
Mesh used for the spatio-temporal model.
The coastline of the study area is shown in blue. The spatial random field is approximated at the mesh nodes, and these values are then projected into the observation locations.
Figure 1—figure supplement 3
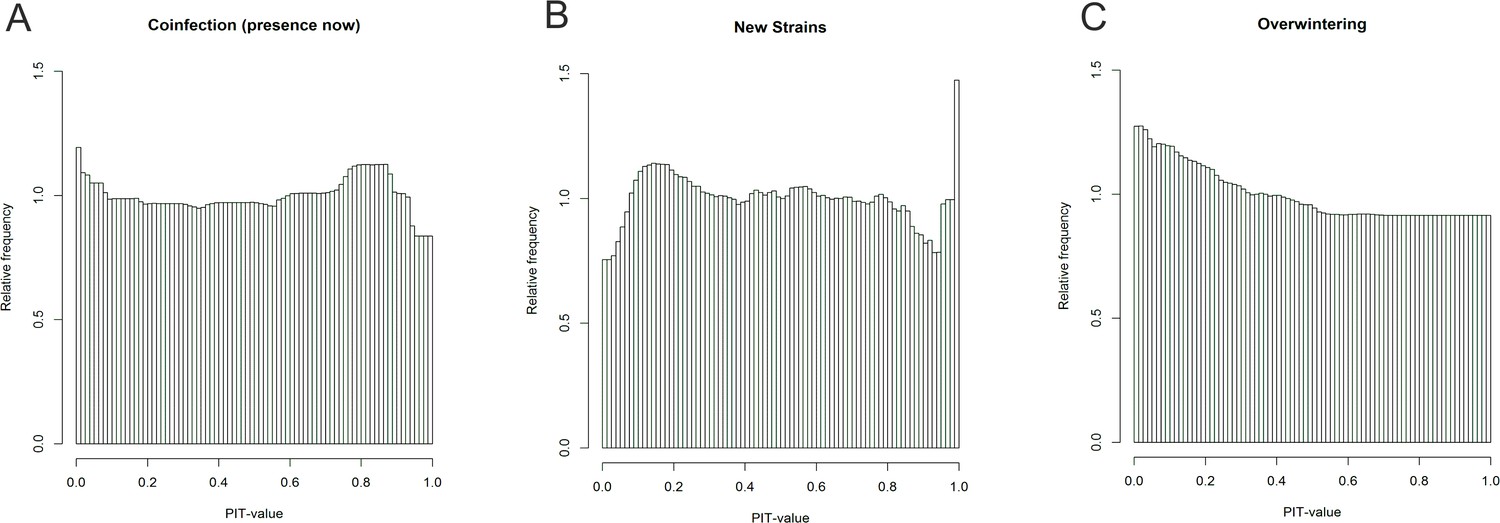
PIT-value distributions.
The close-to-uniform distributions of the corrected PIT-value for the coinfection (A), new strain emergence (B) and overwintering (C) indicate adequacy of the models.
Figure 1—figure supplement 4
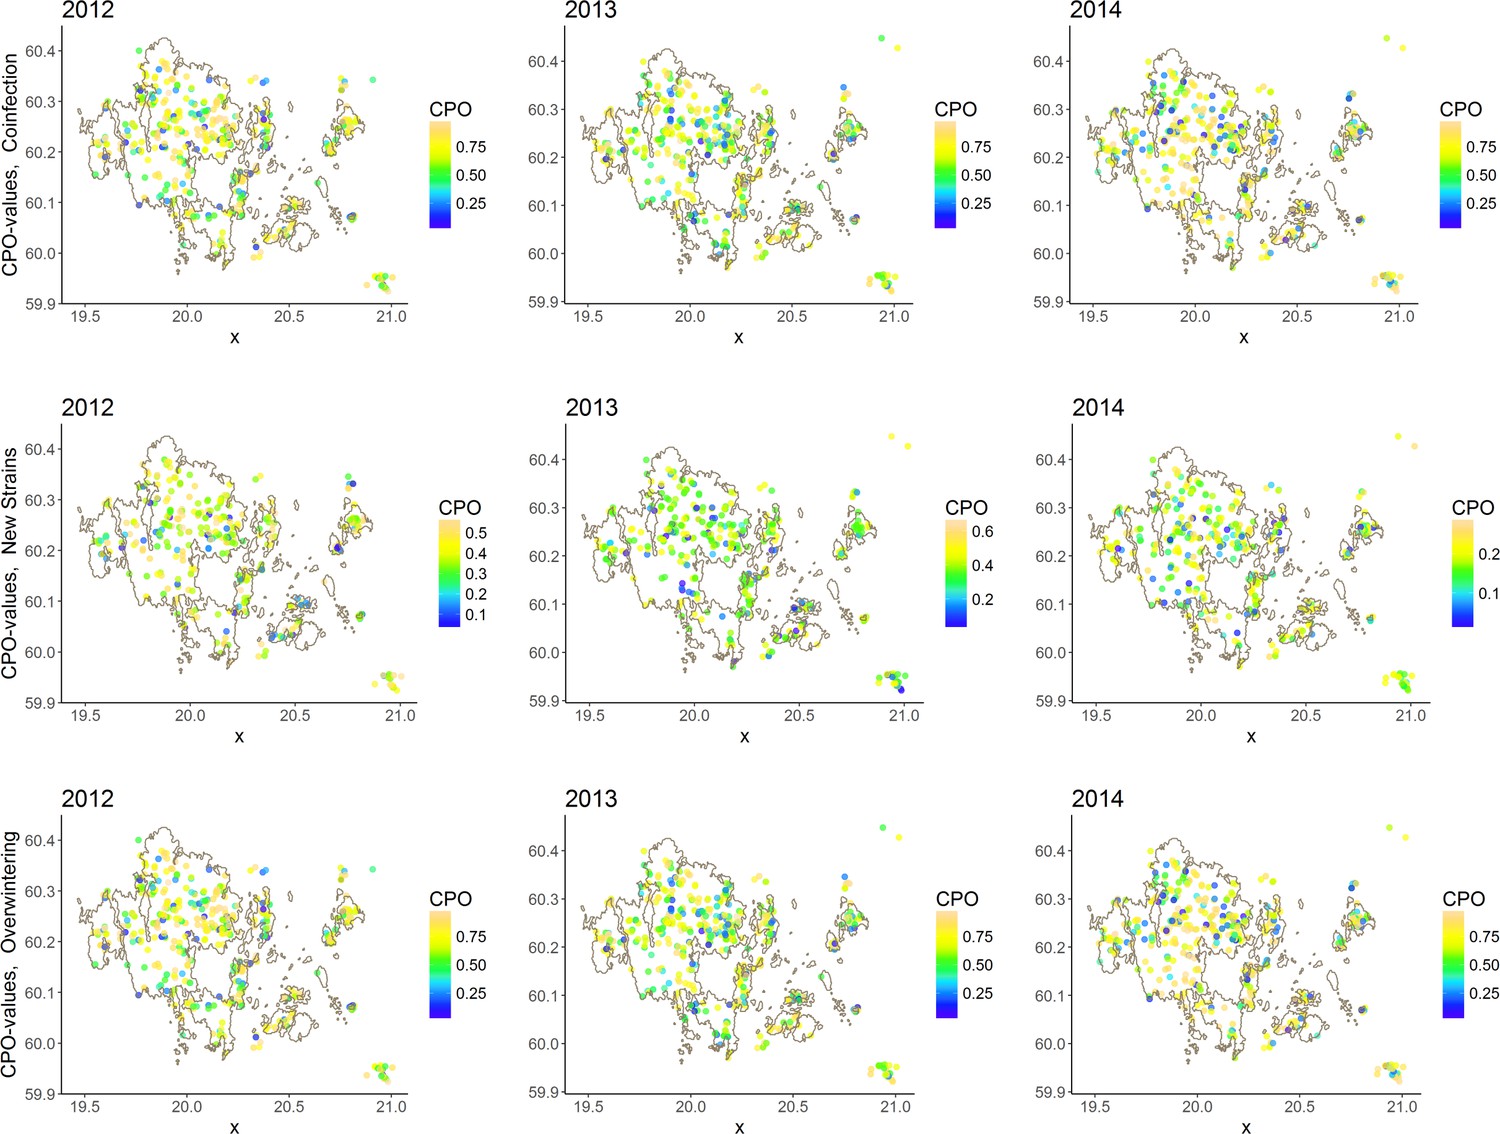
CPO-values distributed in space.
The CPO-values for the three models exhibit no particular spatial patterns, providing a further model validation argument.
Figure 1—figure supplement 5
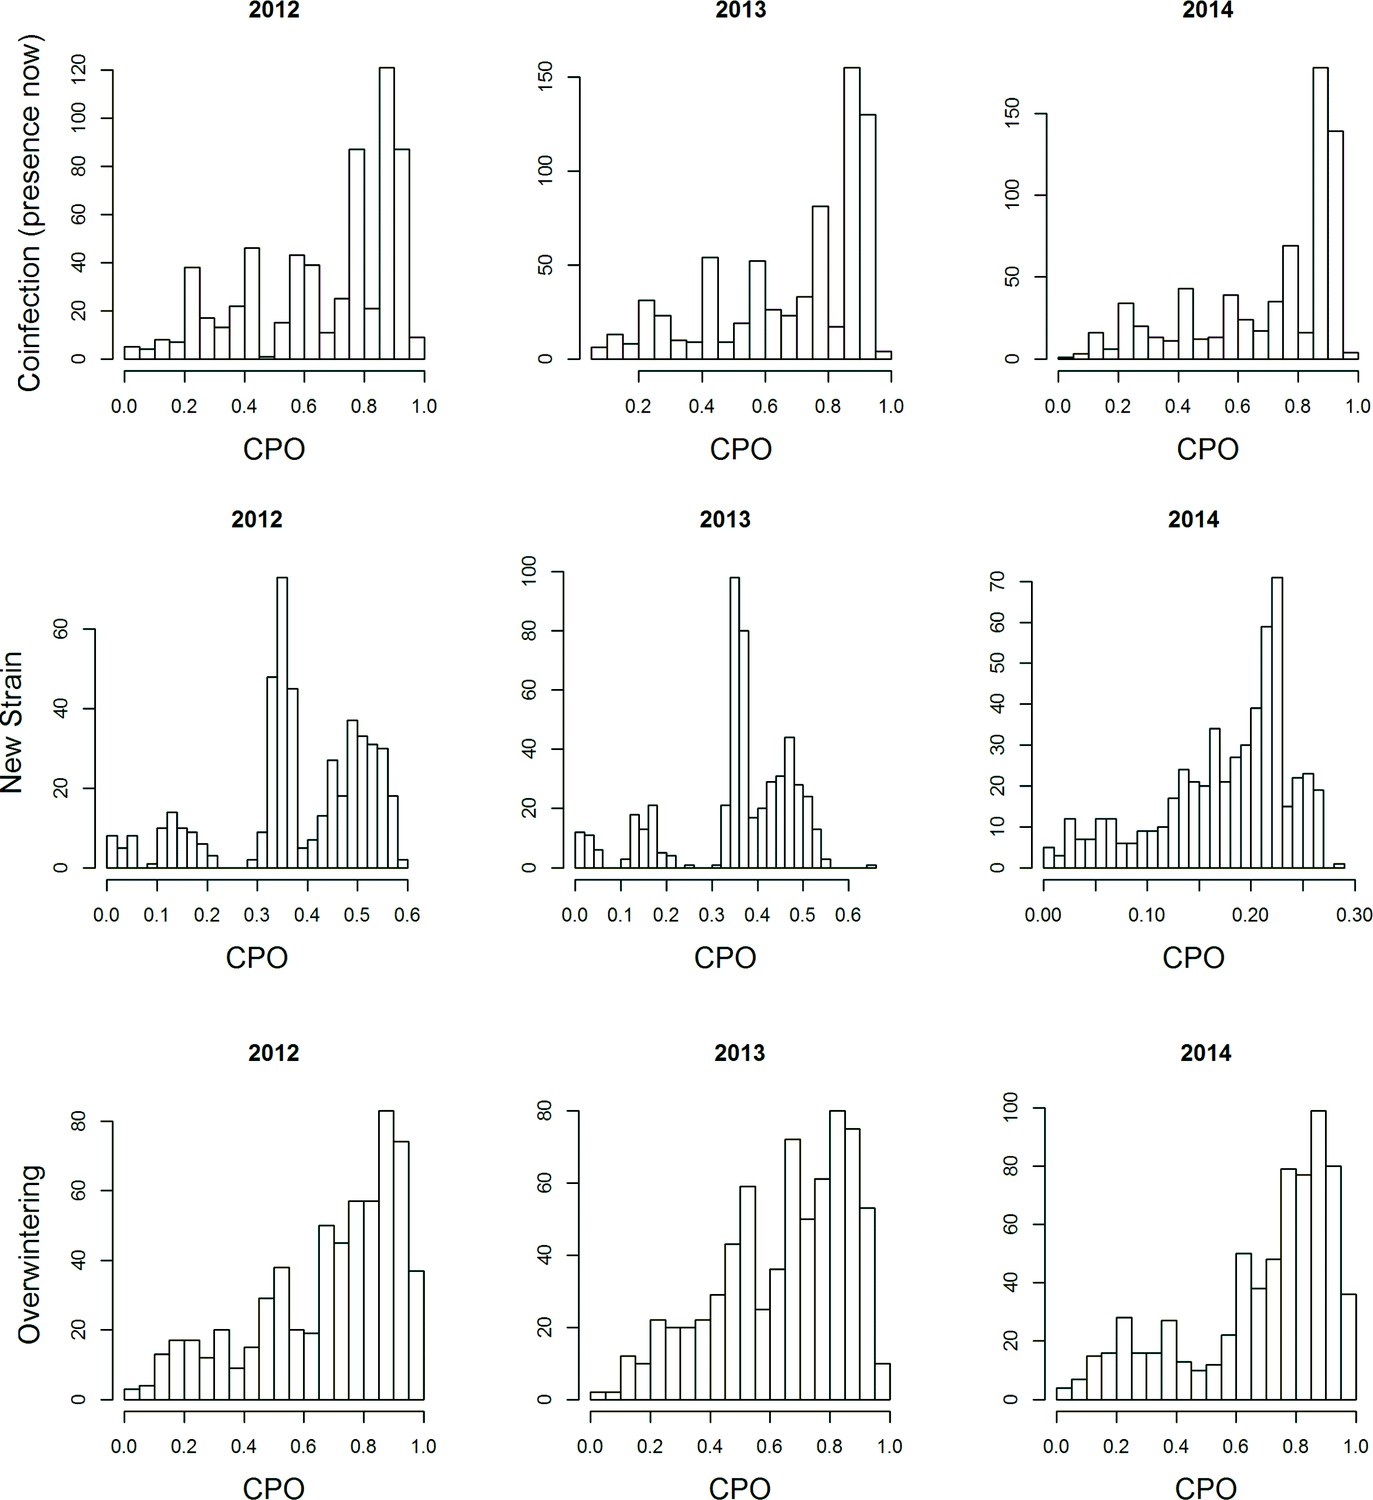
Distributions of the CPO-values for the four models for the different years.
No particular temporal structure is visible indicating the adequacy of the models.
Figure 1—figure supplement 6

Posterior distributions of the parameter values from the ABC inference on the infections and co-infections.
Each panel shows the posterior distribution for one parameter and separately for the two years. The posterior distributions for the two years are very similar for most parameters. The biggest difference is for the parameter , which controls the average number of mildew strains infecting each patch. This is not unexpected, given the highly dynamic nature of the pathogen metapopulation. The posterior probability that was 0.98 for 2012 and 0.988 for 2013 indicating that coinfections are more common than expected by chance.
Figure 1—figure supplement 7
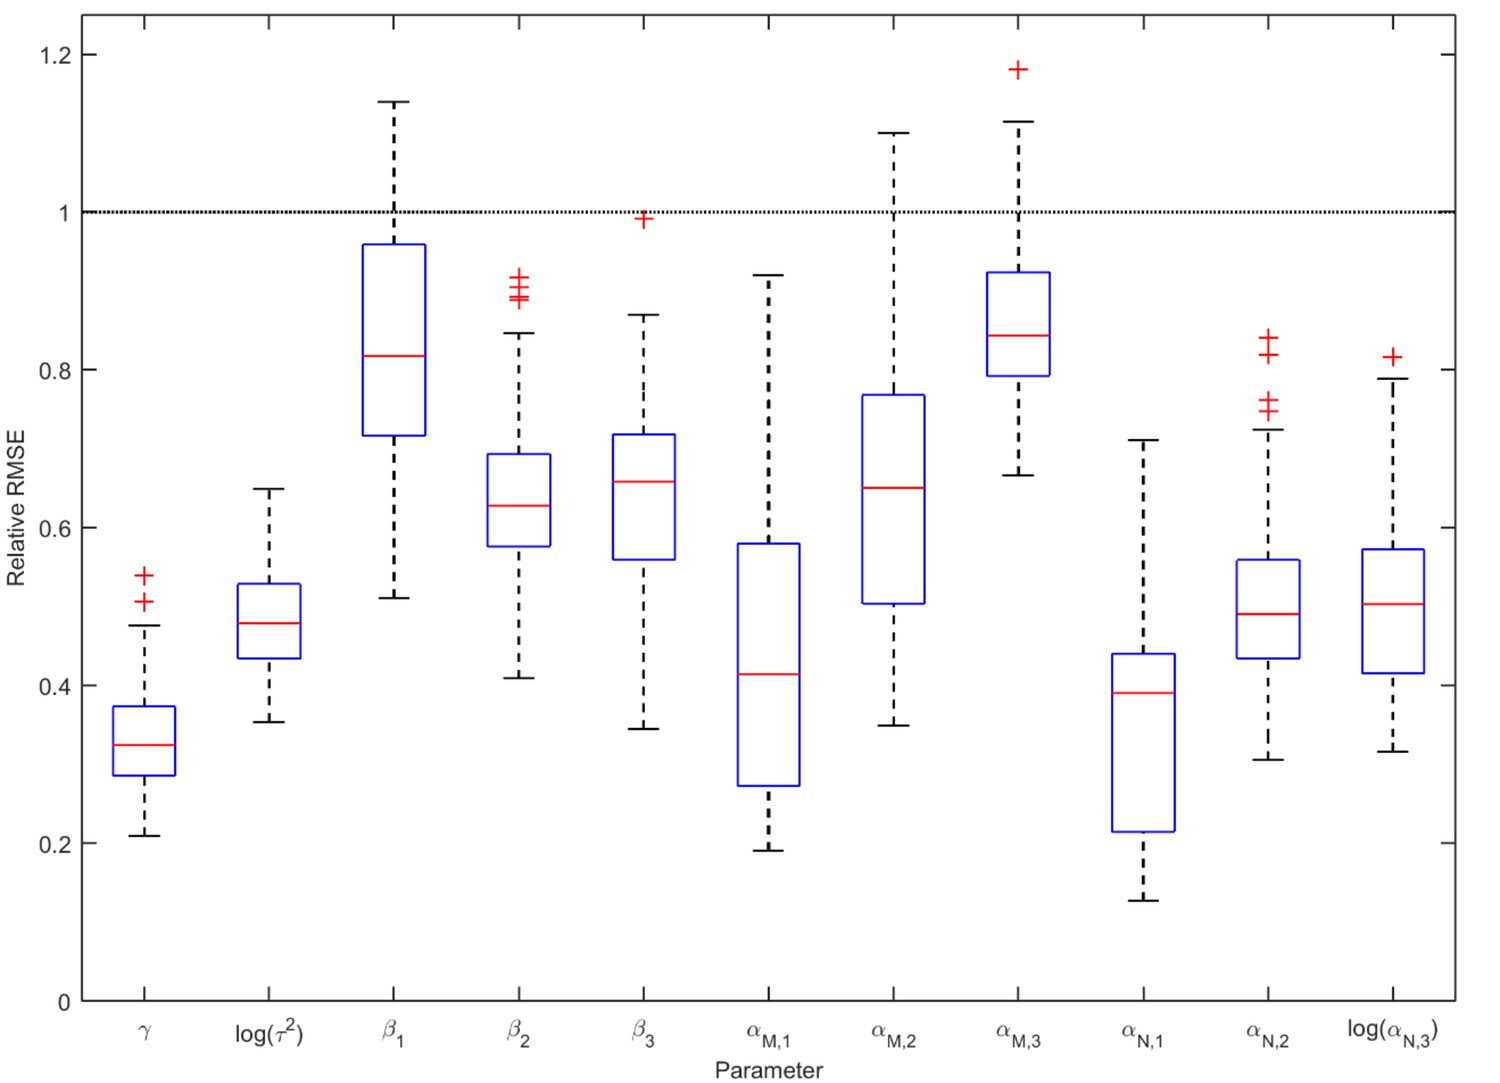
Accuracy of the parameter estimates from the ABC analysis of infections and co-infections.
Each boxplot shows the distribution of relative RMSE values for one parameter for year 2012 evaluated over 100 simulated test data sets with known parameter values. Relative RMSE 1 indicates no improvement over the prior distribution, while a value of 0 indicates perfect estimate. The parameter affecting the incidence of coinfections, , is among the best-estimated ones.
Figure 1—figure supplement 8

Posterior distributions of the parameter values from the ABC inference on the infections and co-infections under different modeling assumptions using data for 2012.
Each panel shows the posterior distribution for one parameter under four different modeling assumptions. Red line shows the results under the standard assumptions used in other analyses. For the parameter , the standard choices produce more conservative (closer to 0) distributions than the others and the probability that is lowest, suggesting that the modeling assumptions have not led to an overestimation of the incidence of coinfections.
Figure 1—figure supplement 9
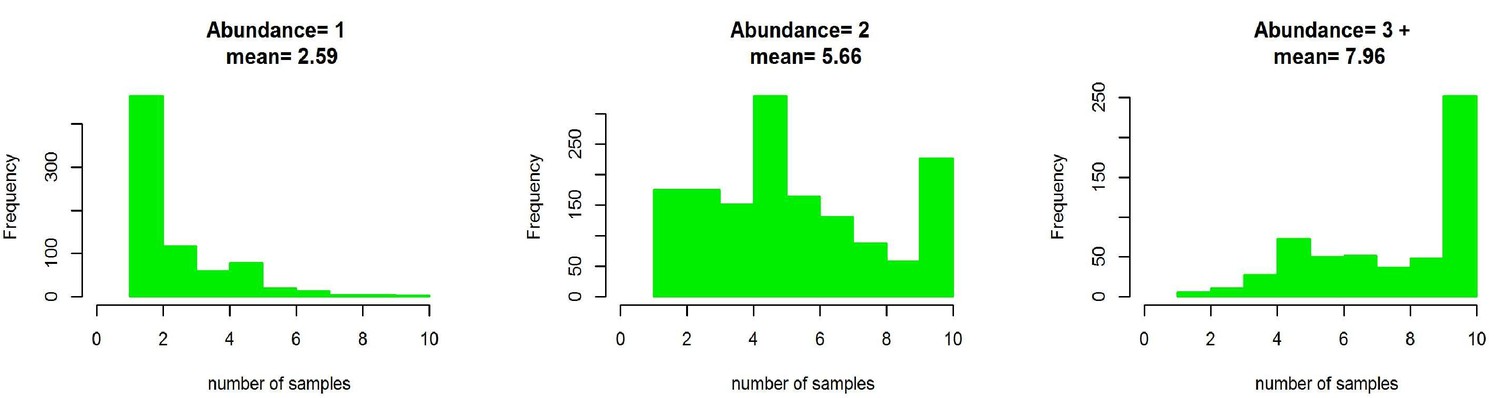
The number of samples collected from Podosphaera plantaginis populations in 2013–15 depicted according to population size categories.
Population size categories are’3’ and ‘4’ are merged in this figure.
Figure 1—figure supplement 10
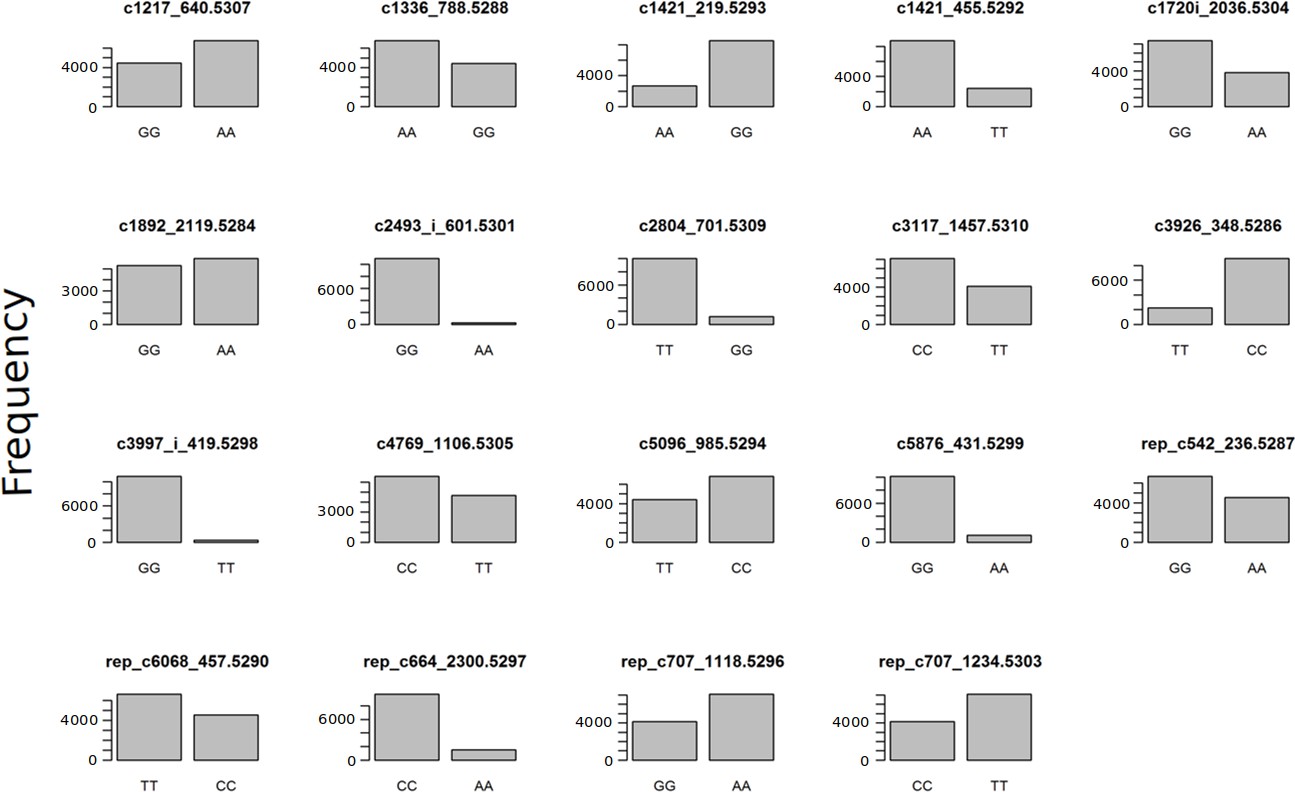
The global allele frequencies of the 19 SNP loci used for genotyping.
https://doi.org/10.7554/eLife.47091.013
Figure 1—figure supplement 11
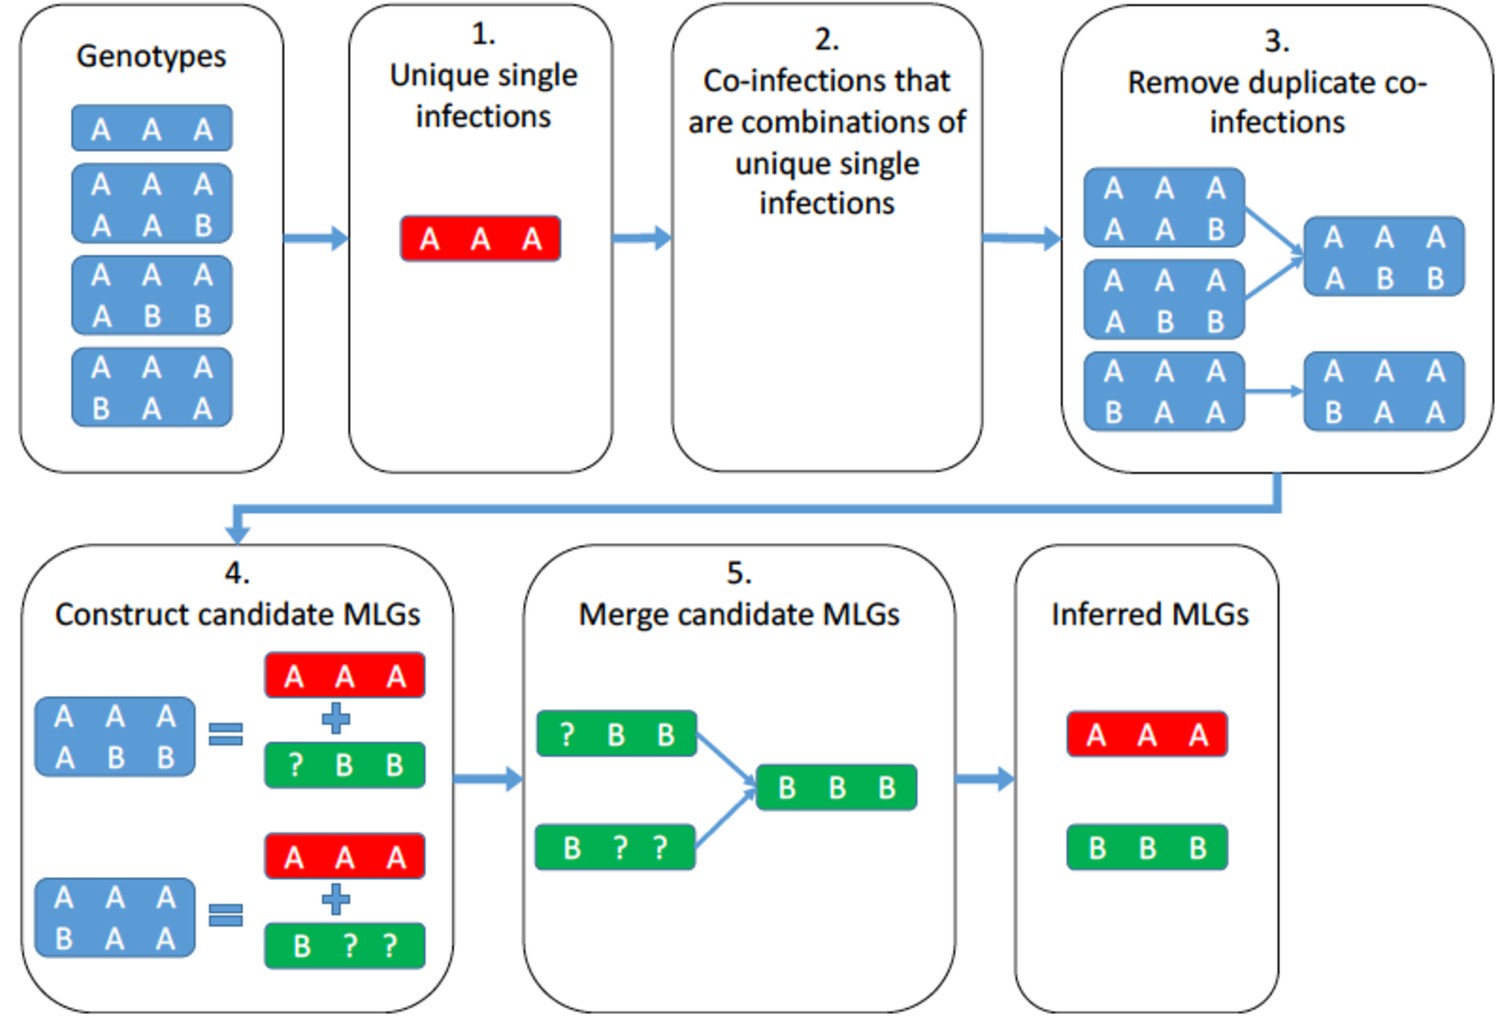
A schematic representation of the algorithm that identifies the unique multilocus genotypes that form the observed coinfections.
https://doi.org/10.7554/eLife.47091.014
Figure 2
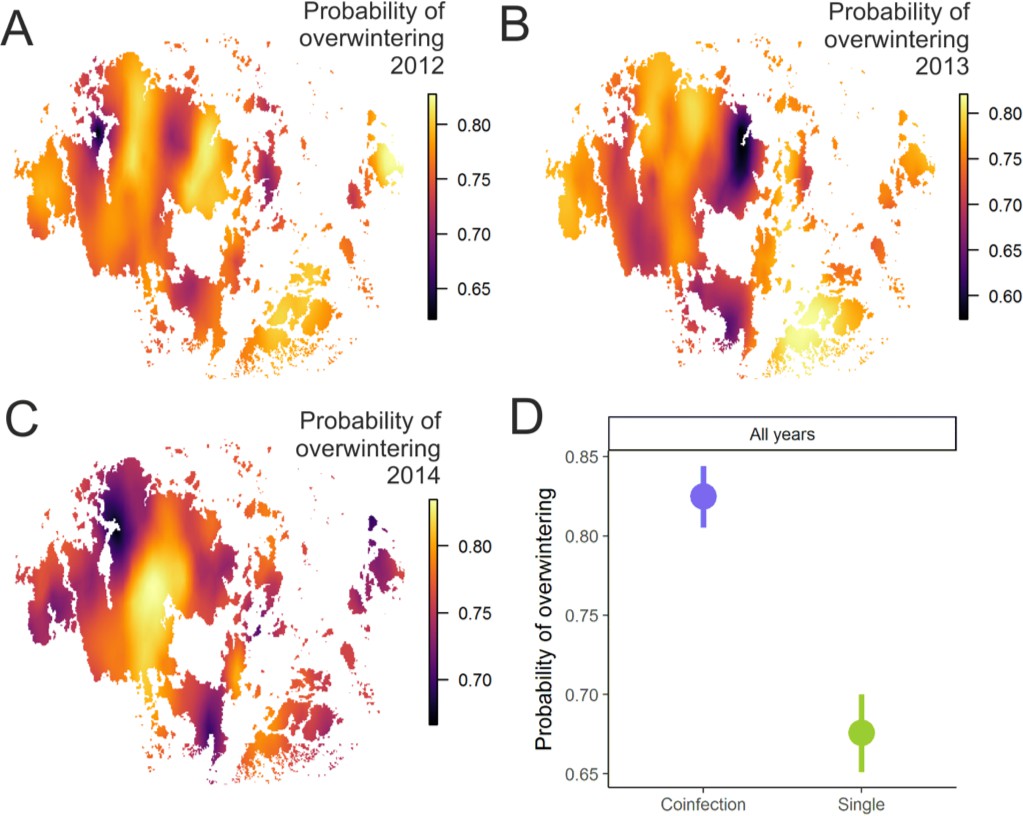
Pathogen overwinter survival was highest in populations that supported higher levels of coinfection.
The heatplot for the spatial occurrence probabilities of overwinter survival were obtained by merging the corresponding event data from corresponding years and fitting spatial intercept-only models as presented in Table 1. The probabilities of events for each location were obtained from the linear predictor based on the estimated intercept and the spatial random field. The maps shows spatial variation in overwinter survival for 2012–13 (A), 2013–14 (B) and 2014–15 (C) with warmer tones corresponding to areas of higher event occurrence probabilities. (B) The average probability of successful pathogen population overwintering was higher in populations with coinfection than in populations without coinfection in all three years in 2012–15.
Tables
Table 1
The estimated posterior means and 95% credibility intervals for the parameters of the fitted spatio-temporal models.
In each model, the abundance of infection category one is considered as the baseline factor level for every model. Whenever the credibility interval does not include zero (denoted with bold), the effect is considered significant. For temporal and spatial range, and the nominal variance, significance cannot be estimated as they can only get positive values. For more information about the predictors, please see the Model Variables-section in the Methods.
| Model | |||
|---|---|---|---|
| Parameter | Coinfection presence in a pathogen population (0/1) | Number of new strains within a population | Successful pathogen population overwintering (0/1) |
| Intercept | −1.04,(−1.16,–0.92) | −0.38,(−0.49,–0.27) | 1.17, (0.93, 1.41) |
| Number of coinfections | not fitted | 0.06, (0.02, 0.11) | 0.28,(0.11, 0.46) |
| Number of strains | 1.07, (0.93, 1.21) | 0.08, (0.04, 0.13) | 0.34,(0.18, 0.5) |
| Abundance of infection (category 2) | 0.37, (0.22, 0.53) | −0.03, (−0.08, 0.02) | 0.39, (0.27, 0.51) |
| Abundance of infection (category 3) | 0.61, (0.46, 0.75) | −0.04, (−0.1, 0.01) | 0.55, (0.39, 0.72) |
| Year 2013 | not fitted | 0.17, (0.03, 0.32) | 0.05, (−0.27, 0.37) |
| Year 2014 | not fitted | 1.45, (1.33, 1.58) | 0.52, (0.19, 0.85) |
| Pathogen connectivity () | 0.05, (−0.08, 0.19) | 0.02, (−0.02, 0.07) | −0.04, (−0.19, 0.1) |
| Host population size (logm2) | 0.01, (−0.12, 0.14) | 0.09, (0.04, 0.14) | 0.03, (−0.1, 0.16) |
| Temporal autocorrelation () | 0.03, (−0.41, 0.43) | 0, (−0.41, 0.41) | −0.08, (−0.43, 0.28) |
| Spatial range (meters) | 11410, (460, 50811) | 14229, (3266, 38058) | 8512, (1775, 25860) |
| Nominal variance) | 0.2, (0, 1.33) | 0.07, (0.01, 0.22) | 0.45, (0.1, 1.28) |
Additional files
-
Supplementary file 1
Characteristics of the pathogen metapopulation for each year.
MLG: MultiLocus Genotype.
- https://doi.org/10.7554/eLife.47091.017
-
Transparent reporting form
- https://doi.org/10.7554/eLife.47091.018
Download links
A two-part list of links to download the article, or parts of the article, in various formats.
Downloads (link to download the article as PDF)
Open citations (links to open the citations from this article in various online reference manager services)
Cite this article (links to download the citations from this article in formats compatible with various reference manager tools)
Variable opportunities for outcrossing result in hotspots of novel genetic variation in a pathogen metapopulation
eLife 8:e47091.
https://doi.org/10.7554/eLife.47091


