The microbiota protects from viral-induced neurologic damage through microglia-intrinsic TLR signaling
- University of Utah School of Medicine, United States
Figures
Figure 1 with 1 supplement
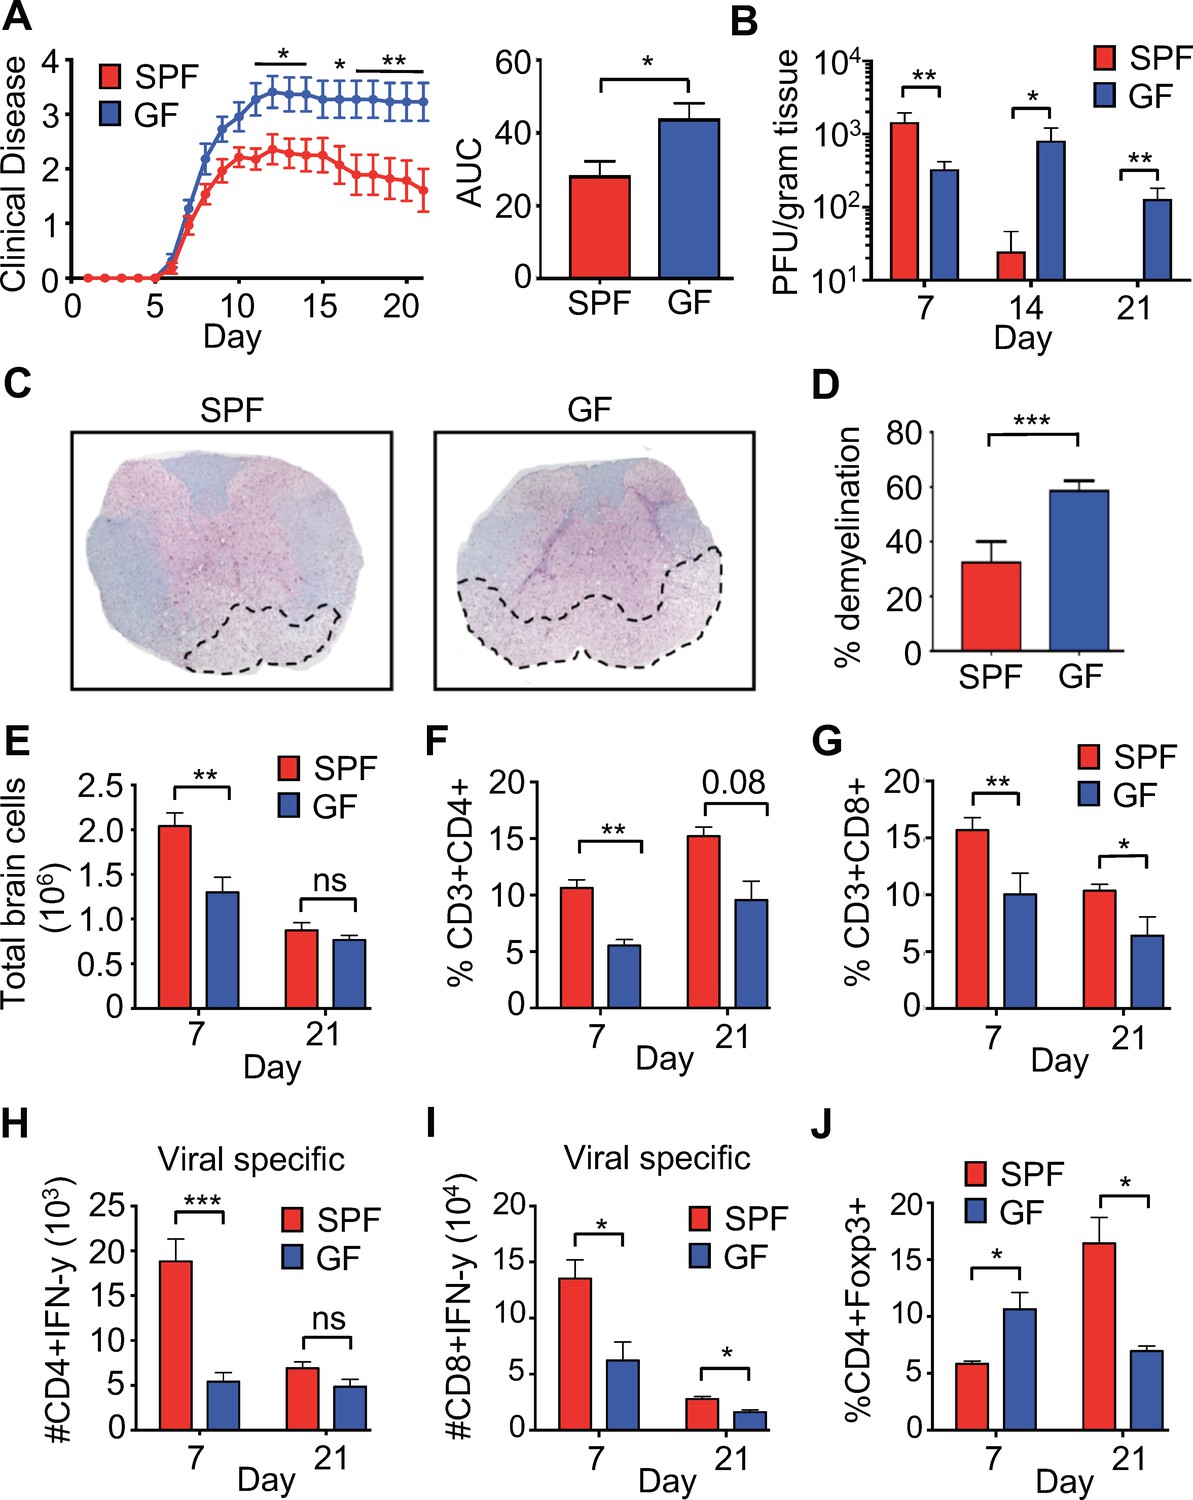
Perturbations to the microbiota leads to enhanced viral persistence and neuro-autoimmunity.
(A) Clinical scoring (left) and the associated area under the curve (right) of SPF (n = 14) or GF C57BL/6 mice (n = 11) following intracranial (i.c.) infection with 150–300 PFU JHMV. Clinical disease was measured as described in the Materials and methods. Results shown from two independent experiments. (B) Supernatant from homogenized brains of JHMV infected SPF (n = 6–8) or GF mice (n = 6–9) at the indicated time points were used for determining viral titers. (C) Representative image of luxol fast blue/H&E stained spinal cords isolated from JHMV infected SPF or GF 21 days post-infection (p.i.), dashed lines highlight loss of myelin staining indicating demyelination. (D) Quantification of demyelination of SPF (n = 3) or GF (n = 3) mice at 21 days p.i. as represented in 1 c. (E–J) Brains from GF and SPF mice were analyzed via flow cytometry 7 and 21 days p.i. with 150 PFU of JHMV (n = 3–12). Results from one to two independent experiments. (E) Total number of brain cells isolated after homogenization of brain tissue and percoll gradient centrifugation. (F) CD3+, CD4+ frequency of recovered cells (G) CD3+, CD8+ frequency of recovered cells. Numbers of virus-specific CD4+ (H) and CD8+ (I) T cells as determined by intracellular IFN-γ staining in response to defined viral epitopes at indicated time points. (J) Foxp3+ frequency of CD4+ T cells recovered. All data displayed as mean with SEM. Means are of biological replicates (i.e. each data point is from a different mouse). Clinical score significance determined using two-way ANOVA statistical test with multiple comparisons. Viral titer significance determined by Mann-Whitney test. All other significance determined using Student’s t-test. *p<0.05, **p<0.01, ***p<0.005.
Figure 1—figure supplement 1
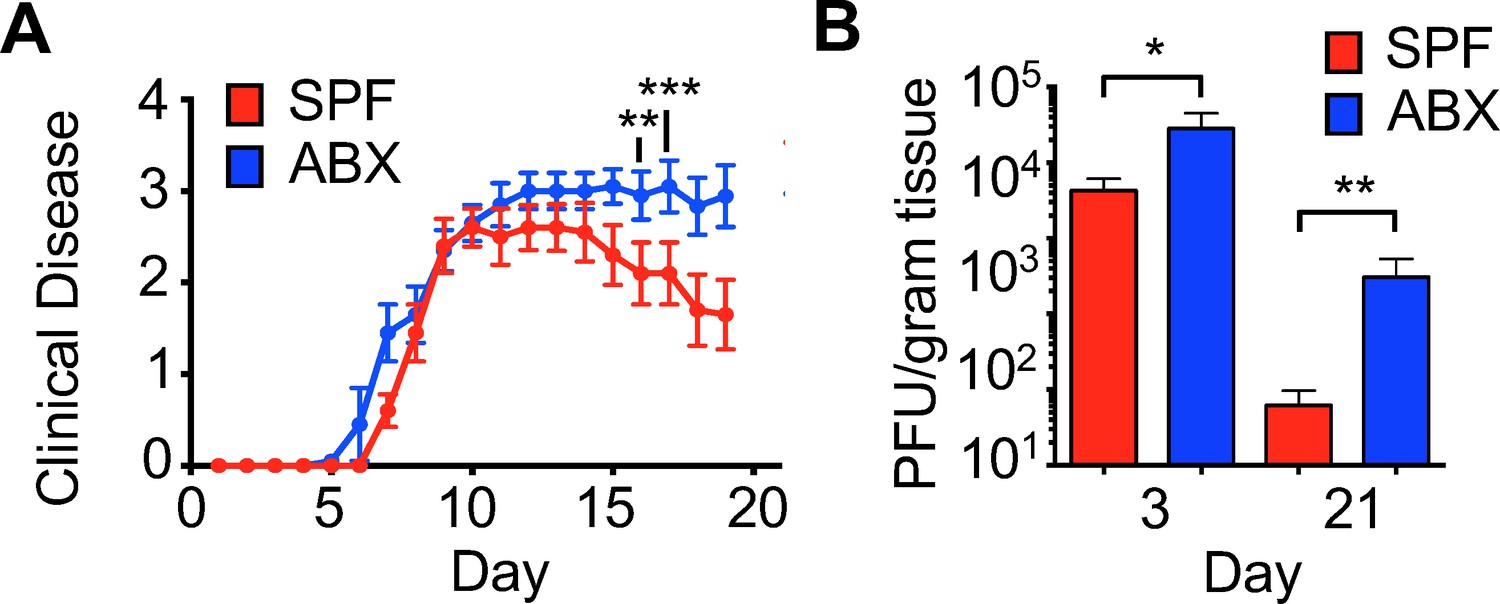
Reduced virus-specific immune responses within the CNS.
(A) Clinical scoring of JHMV-infected mice (150 PFU) born to breeder pairs treated with antibiotics and reared with ad libitum access to antibiotic-containing drinking water (ABX) or SPF mice (n = 10). (B) Viral titers within brains of birth-antibiotic (n = 4 (day 3) and 13 (day 21) or SPF (n = 4 and 13) mice at indicated times p.i. Data represented as mean + SEM. Means are from biological replicates. Significance determined by two-tailed student’s t test.
Figure 2 with 1 supplement

T cell-intrinsic defects are not responsible for reduced viral clearance during CNS infection in GF mice.
(A) Schematic of experimental design; SPF or GF mice were intraperitoneally (i.p.) infected with the hepatotropic MHV-DM and CD4+ or CD8+ T cells were isolated from donor spleens at day 7 p.i. Subsequently, 2.5 × 10⁵ virus-specific T cells (determined via tetramer staining) were retro-orbitally injected into SPF Rag1-/- and recipient mice that were i.c. infected with JHMV (150 PFU) three days prior to cell transfer; recipient mice were subsequently sacrificed 7 days post-transfer to determine viral titers within the brains. (B–C) Flow cytometry analysis and percentages of CD4+ T cells from CNS of JHMV-infected Rag-/- mice (n = 7). (D) Viral titers in brains of JHMV-infected Rag1-/- mice receiving virus-specific CD4+ T cells from either SPF or GF mice or vehicle alone (n = 4–7). (E and F) Flow cytometry analysis and percentages of CD8+ T cells from CNS of Rag-/- mice given viral-specific CD8+ T cells and infected with 150 PFU of JHMV. n = 5–6. (G) Viral titers in brains of JHMV-infected Rag1-/- mice receiving virus-specific CD4+ T cells from either SPF or GF mice or vehicle alone. Significance determined by Student’s t-test. All data displayed as mean with SEM. Means are of biological replicates.
Figure 2—figure supplement 1
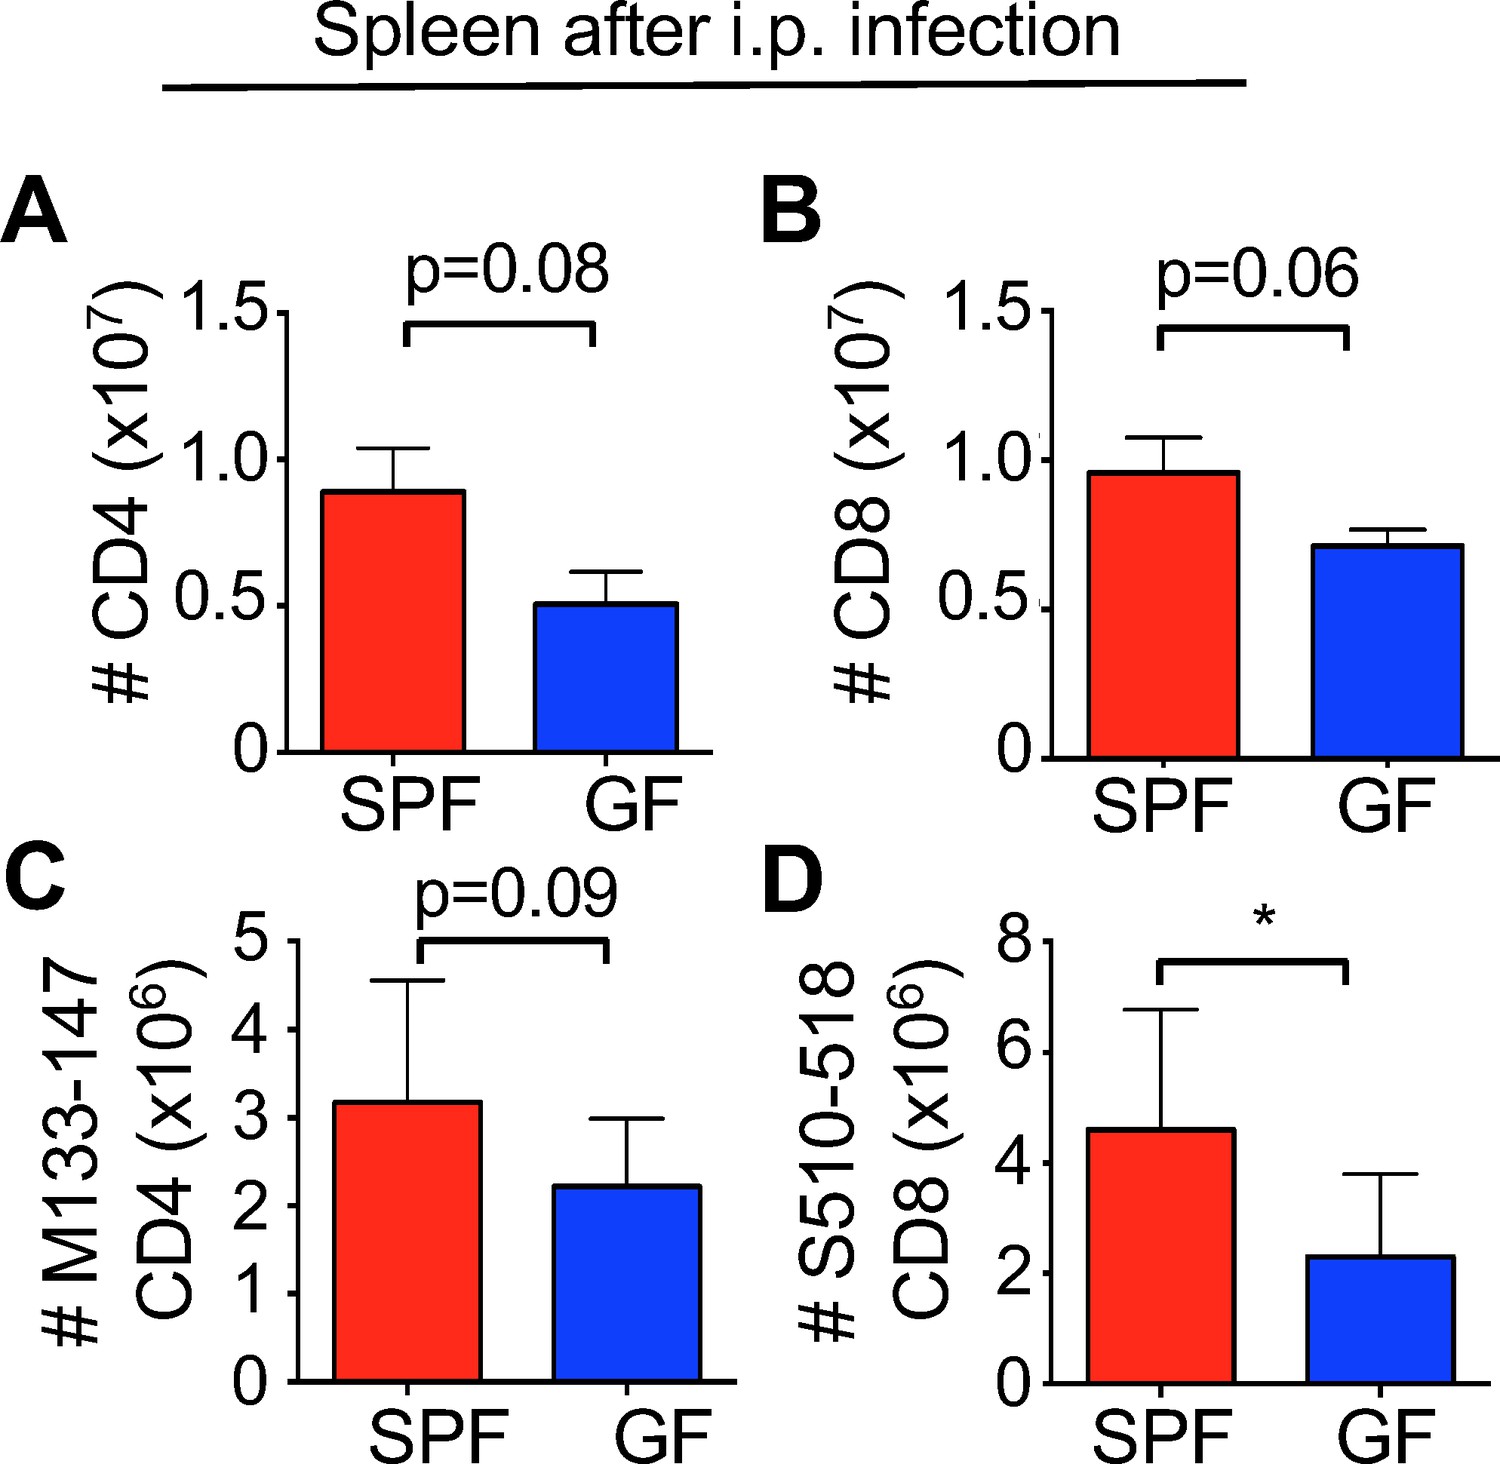
Reduced immune responses in GF mice are not a result of T cell-intrinsic defects.
Whole number counts of (A) CD4+ or (B) CD8+ splenocytes from SPF or GF mice infected intra-peritoneally with MHV-DM that were used for transfer into Rag 1-/- (n = 9 ). Virus-specific tetramer’s for (C) CD4+ T cells and (D) CD8+ T cells show reduced numbers of virus-specific T cells in JHMV-DM-immunized mice compared to SPF mice. Data represented as mean + SEM. Means are from biological replicates. Significance determined by two-tailed student’s t test *p<0.05.
Figure 3 with 1 supplement

The microbiota promotes antigen presentation by microglia.
(A) Representative flow plots showing microglia isolated from brains of uninfected SPF and GF mice; (B) Quantitation from multiple mice from (A). (C) Representative flow plots of CD45lo, CD11b+, F480+ cells isolated from the brain of antibiotic treated (ABX) and SPF mice. (D) Quantitation from multiple mice from (C). (E) Representative flow cytometric analysis of MHC class II expression on microglia from uninfected SPF and ABX mice; (F) quantification of frequency of MHC class II positive microglia from (E). (G) Microglia from uninfected SPF and GF mice were evaluated for CD40 by flow cytometry. (A–G) Results are combined from two to three independent experiments (n = 3–9/experiment). (H) qPCR of Ciita from purified microglia from SPF or GF mice at day 3 p.i. with JHMV (n = 5–6). (I) qPCR of Ciita from FACS purified microglia from ABX or SPF mice at day 3 p.i. with JHMV (n = 3–4). (J) Quantification of proliferation of CFSE labeled JHMV specific CD8+ T cells incubated with microglia from antibiotic treated mice (n = 5), pulsed with viral peptide. Data from two independent experiments and represented as mean. All data displayed as mean with SEM. All means are from biological replicates. All significance determined by Student’s t test. *p<0.05, **p<0.01.
Figure 3—figure supplement 1
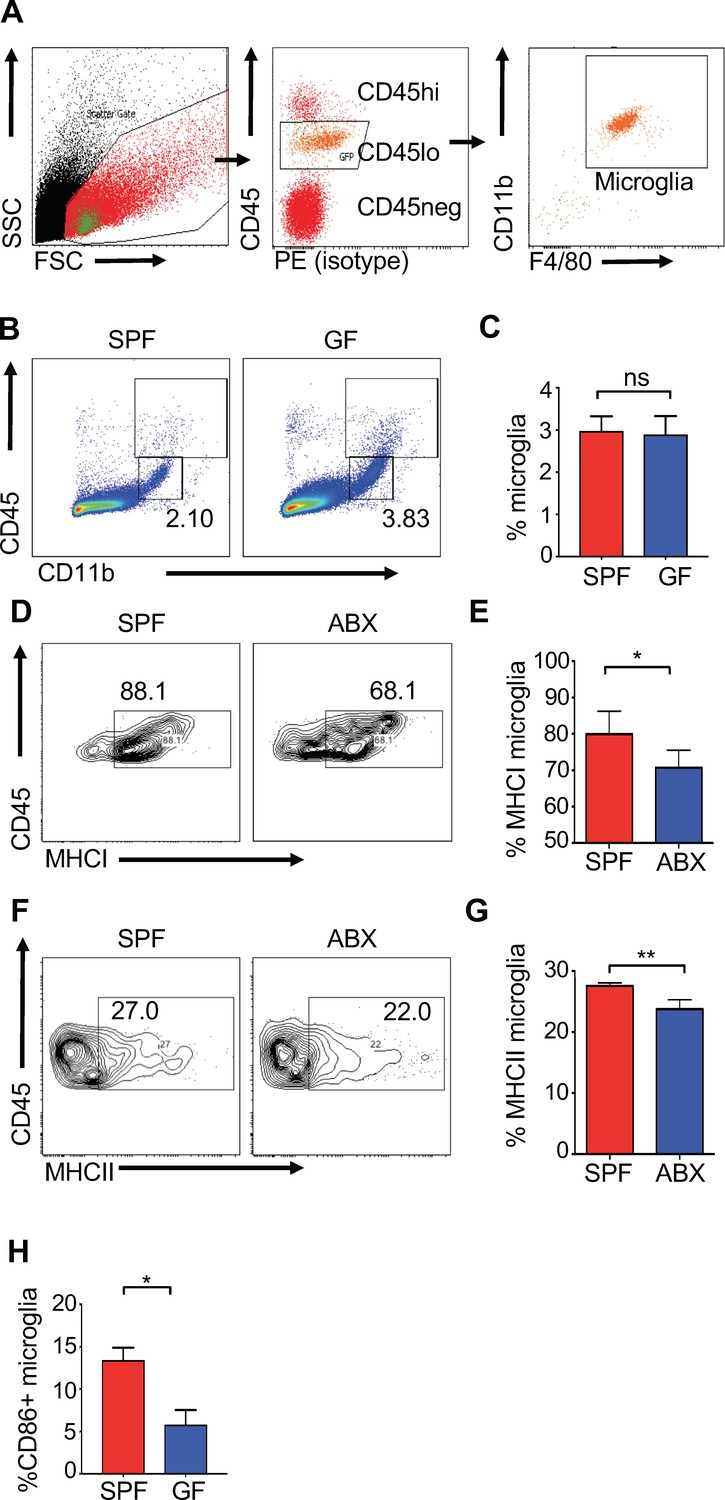
Perturbations to the microbiota lead to reduced activation of microglia.
SPF or antibiotic treated (ABX) mice (6 to 8 weeks old) were analyzed under homeostatic conditions. (A) Representative flow cytometric gating strategy for microglial (CD45lo, CD11b+, F4/80+) cells isolated from the brains of experimental mice in all experiments. (B,C) Representative flow cytometry plots of percentage of microglia isolated from uninfected GF or SPF mice. (D–G) Brains from SPF and ABX mice were analyzed at day 3 p.i. following i.c. infection with JHMV (n = 4–5). Representative flow cytometry plot (D) and quantification (E) of MHC class I expressing microglia. Representative flow cytometry plot (F) and quantification of MHC class II + expressing microglia (G). (H) Flow cytometry plot of microglia expression of CD86 in uninfected animals from GF or SPF mice. Data indicates mean + SEM. Means are calculated from biological replicates. Significance determined by student’s t test. *p<0.05, ***p<0.001.
Figure 4 with 1 supplement
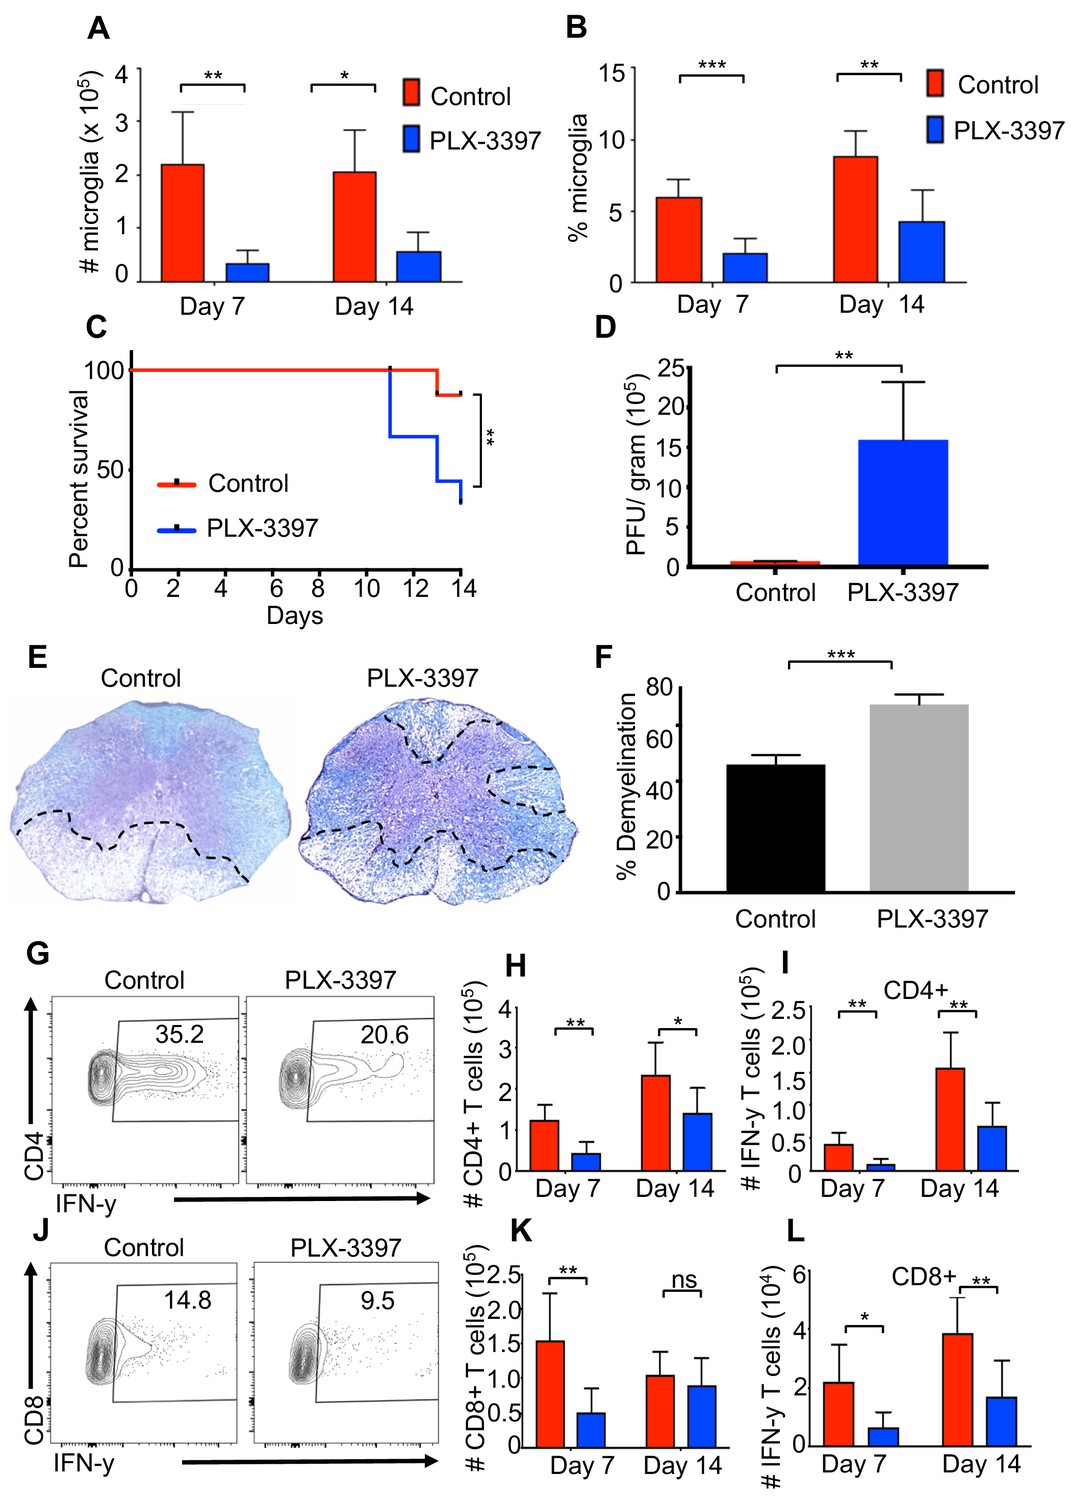
Microglia are beneficial in limiting JHMV-induced demyelination.
SPF mice were fed chow containing PLX-3397 7 days prior to i.c. infection with 150 PFU JHMV. (A) Numbers and (B) frequency of microglia as determined by flow cytometric analysis at days 7 and 14 p.i. (n = 5–9). (C) Survival of microglia depleted and control mice after infection. JHMV-infected mice surviving out to day 14 p.i. were sacrificed and viral titers (D) and the severity of spinal cord demyelination determined (D–F). (E) Representative LFB-stained spinal cords illustrate demyelination (outlined with black hashed lines) in PLX-3397-treated mice compared to control mice. (F) Quantification of the severity of spinal cord demyelination a represented in 4e. (G) Representative flow plots of IFN-γ+, CD4 T cells in the brains of control or PLX-3397 fed mice at day 7 p.i. (H–I) Quantification of CD4 T cell number and IFN-γ+ CD4 T cell number at days 7 and 14 p.i. in control and PLX-3397 fed mice. (J) Representative flow plots of IFN-γ+, CD8 T cells in the brains of control or PLX-3397 fed mice at day 7 p.i. (K–L) Quantification of CD8+ T cell number and IFN-γ+, CD8 T cell number at days 7 and 14 p.i. in control and PLX-3397 fed mice. IFN-γ was induced by restimulation with ionomycin and PMA. Survival curve significance determined by using the logrank test. All other significance determined by Student’s t test. Survival curve is displayed as percent survival within each group. All other data displayed as mean with SEM. Means are of biological replicates. *p<0.05, **p<0.01.
Figure 4—figure supplement 1
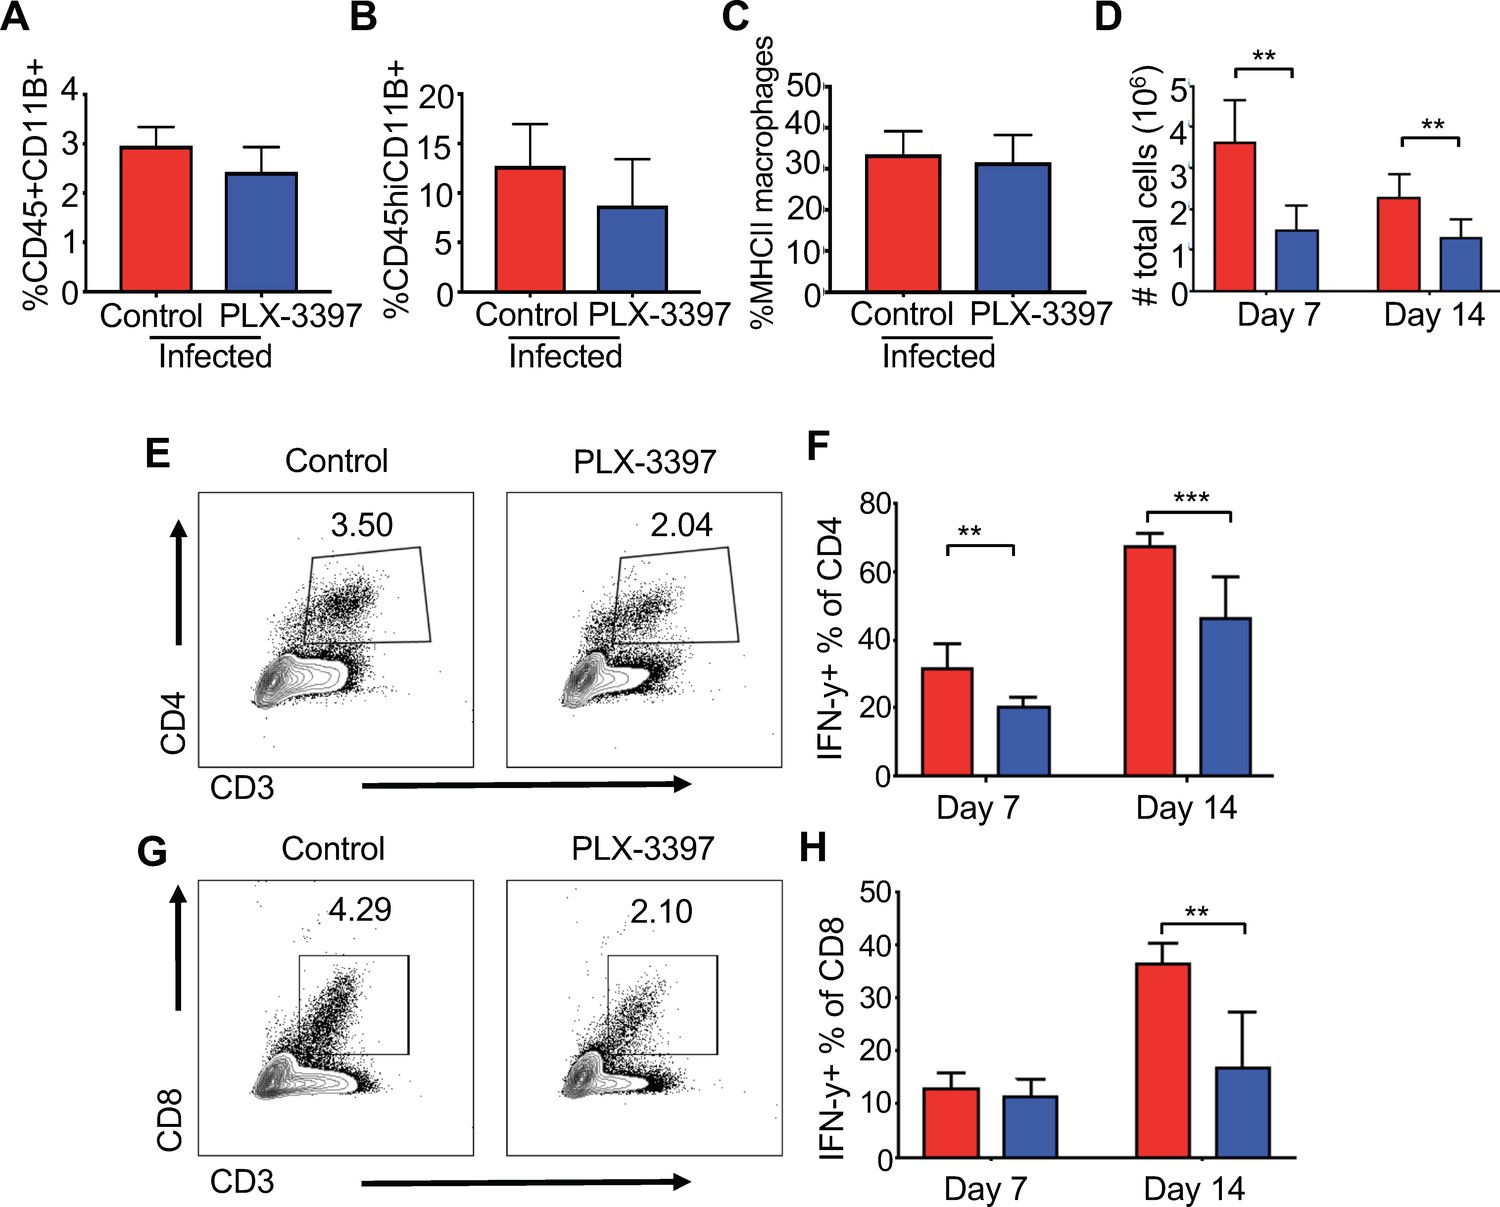
Microglia depletion leads to reduced inflammatory T cell infiltration.
SPF animals were given PLX-3397-containing chow (blue) or control chow (red) for 7 days prior to i.c. infection with JHMV and remained on respective diet for 14 days. The frequency of (A) splenic macrophages (CD45+, CD11b+) and (B) brain macrophages in control and PLX-3397-treated mice. (C) MHC class II expression on splenic macrophages at day 8 p.i. in control and PLX-3397-treated mice. (D) Total number of cells recovered from the brains of infected mice at days 7 and 14 p.i. (E) Representative flow plots of CD4+ T cells from experimental mice at day 7 and (F) frequency of CD4+ T cells positive for IFN-γ after restimulation at days 7 and 14 p.i. (G) Representative flow plots of CD8+ T cells day 7 p.i. (H) Percentage of CD8+ T cells positive for IFN-γ after restimulation with ionomycin and PMA at day 7 and 14 p.i. *p<0.01, ***p<0.001. Data represented as mean + SEM. Means are calculated from biological replicates.
Figure 5 with 2 supplements
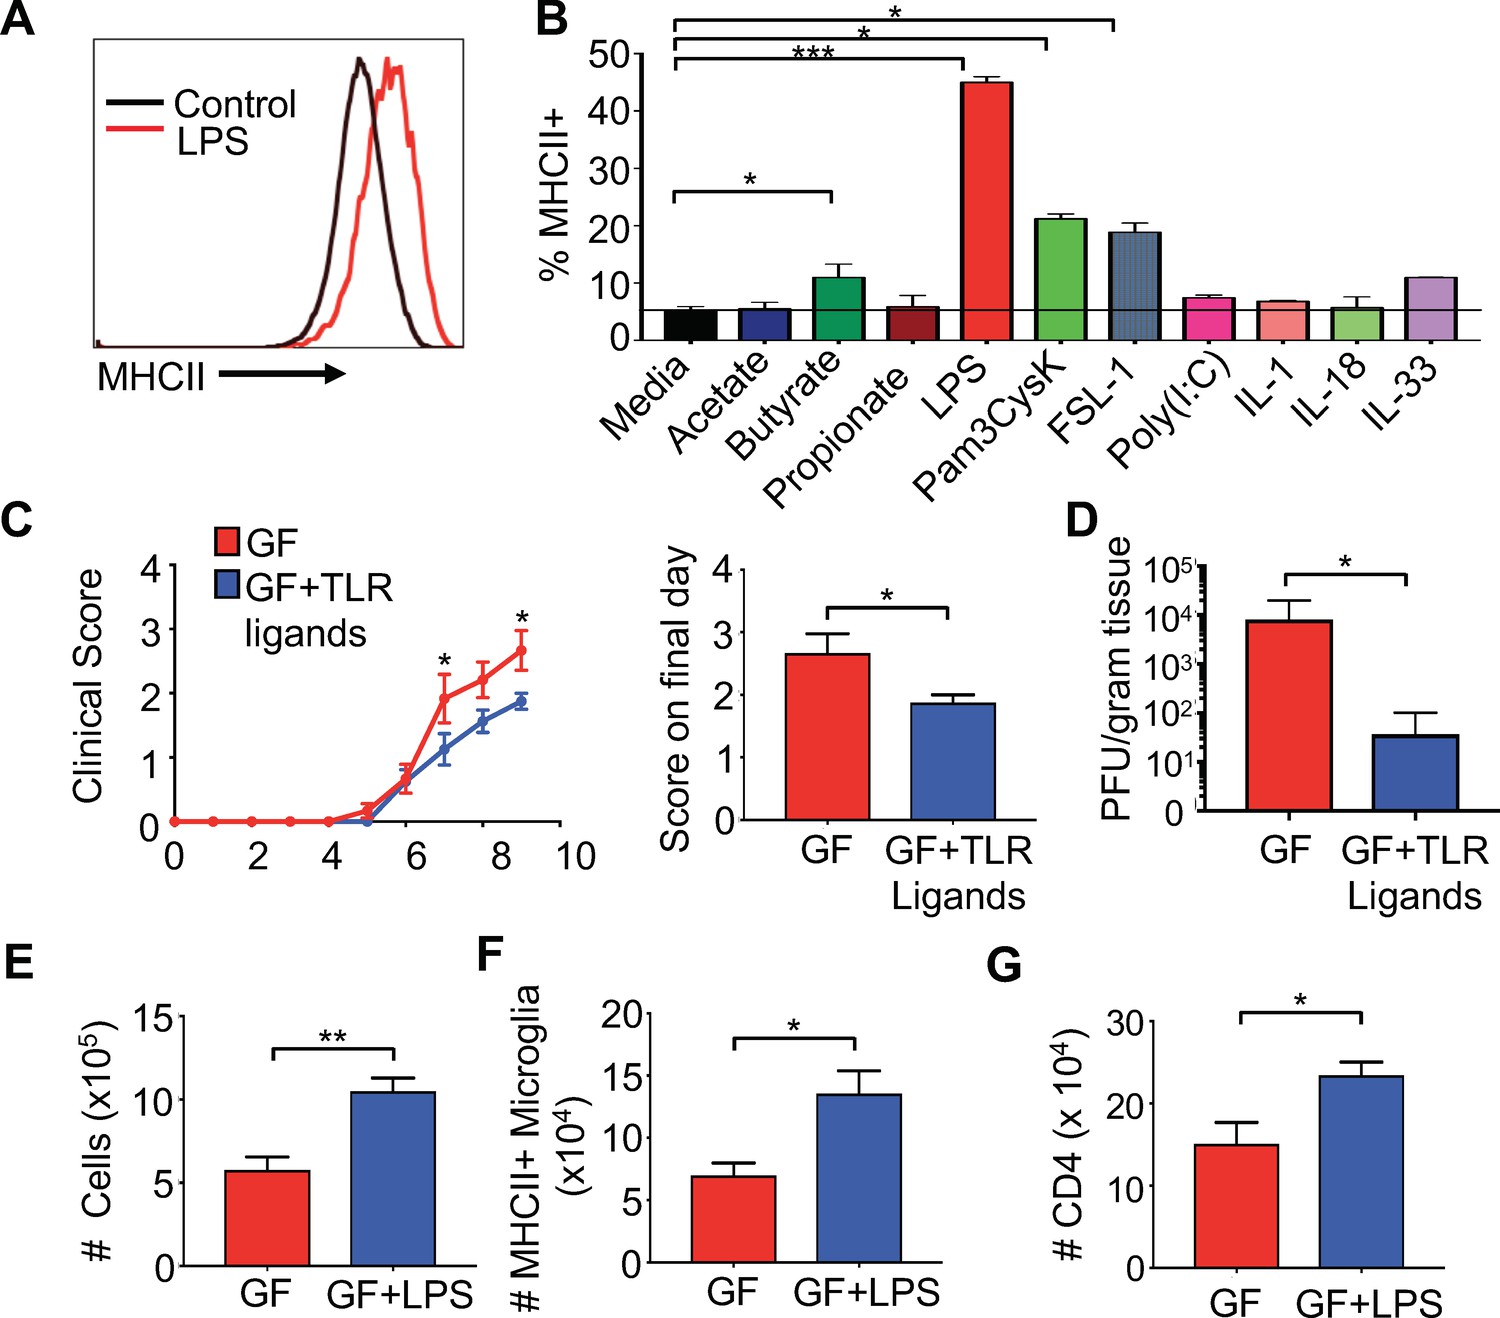
Gut administration of TLR ligands is sufficient to promote microglia antigen presentation and protection from neuro-autoimmune disease.
(A) Representative flow cytometric analysis of MHC class II staining on BV2 microglial cell lines treated with LPS. (B) Quantification of flow cytometric analysis of MHC class II + BV-2 cells treated with SCFAs, TLR ligands (at 0.1 μg/mL), or indicated cytokines (0.25 μg/mL); data presented as mean with SEM and represent four independent experiments. Means are of technical replicates (i.e. multiple aliquots from the same cell line were tested for response to each ligand). (C to K) GF (n = 12) and GF mice with ad libitum access to drinking water containing Pam3CysK4 and LPS (n = 5) or LPS alone (n = 3) were i.c. infected with 150 PFU JHMV. (C) Disease scores and (left) and score on final day (right) and final day brain viral titer (D) of JHMV-infected mice. Number of cells (E) and MHCII+ microglia (F) on day 9 of infection. (G) Number of CD4+ T cells from brains of GF mice or GF mice fed LPS. Error bars represent SEM. Means are calculated from biological replicates. Clinical score significance determined using two-way ANOVA statistical test. All other significance determined by Student’s t test. *p<0.05, **p<0.01, ***p<0.005.
Figure 5—figure supplement 1
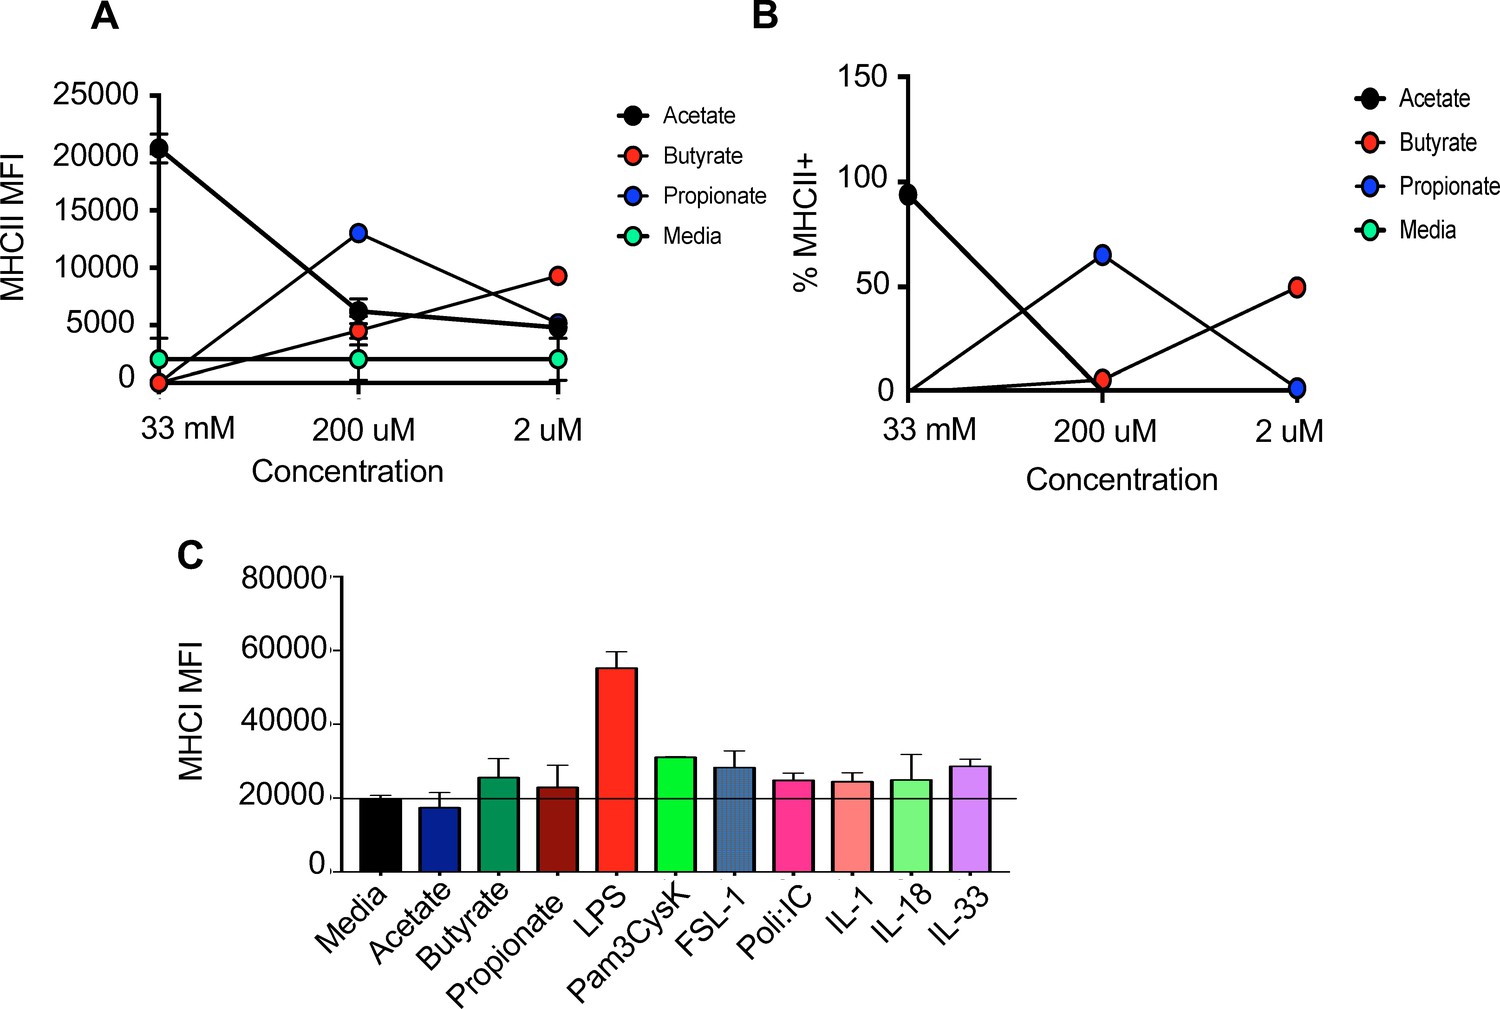
TLR ligands upregulate antigen presentation machinery with a microglia cell line.
(A,B) Quantification of flow cytometric analysis of BV2 cells treated with various concentrations of indicated SCFAs for 24 hr. (C) MHCI MFI of BV2 cells treated as described in Figure 3B. Data is represented as mean ± SEM and representative of four independent experiments. Means are calculated from technical replicates.
Figure 5—figure supplement 2
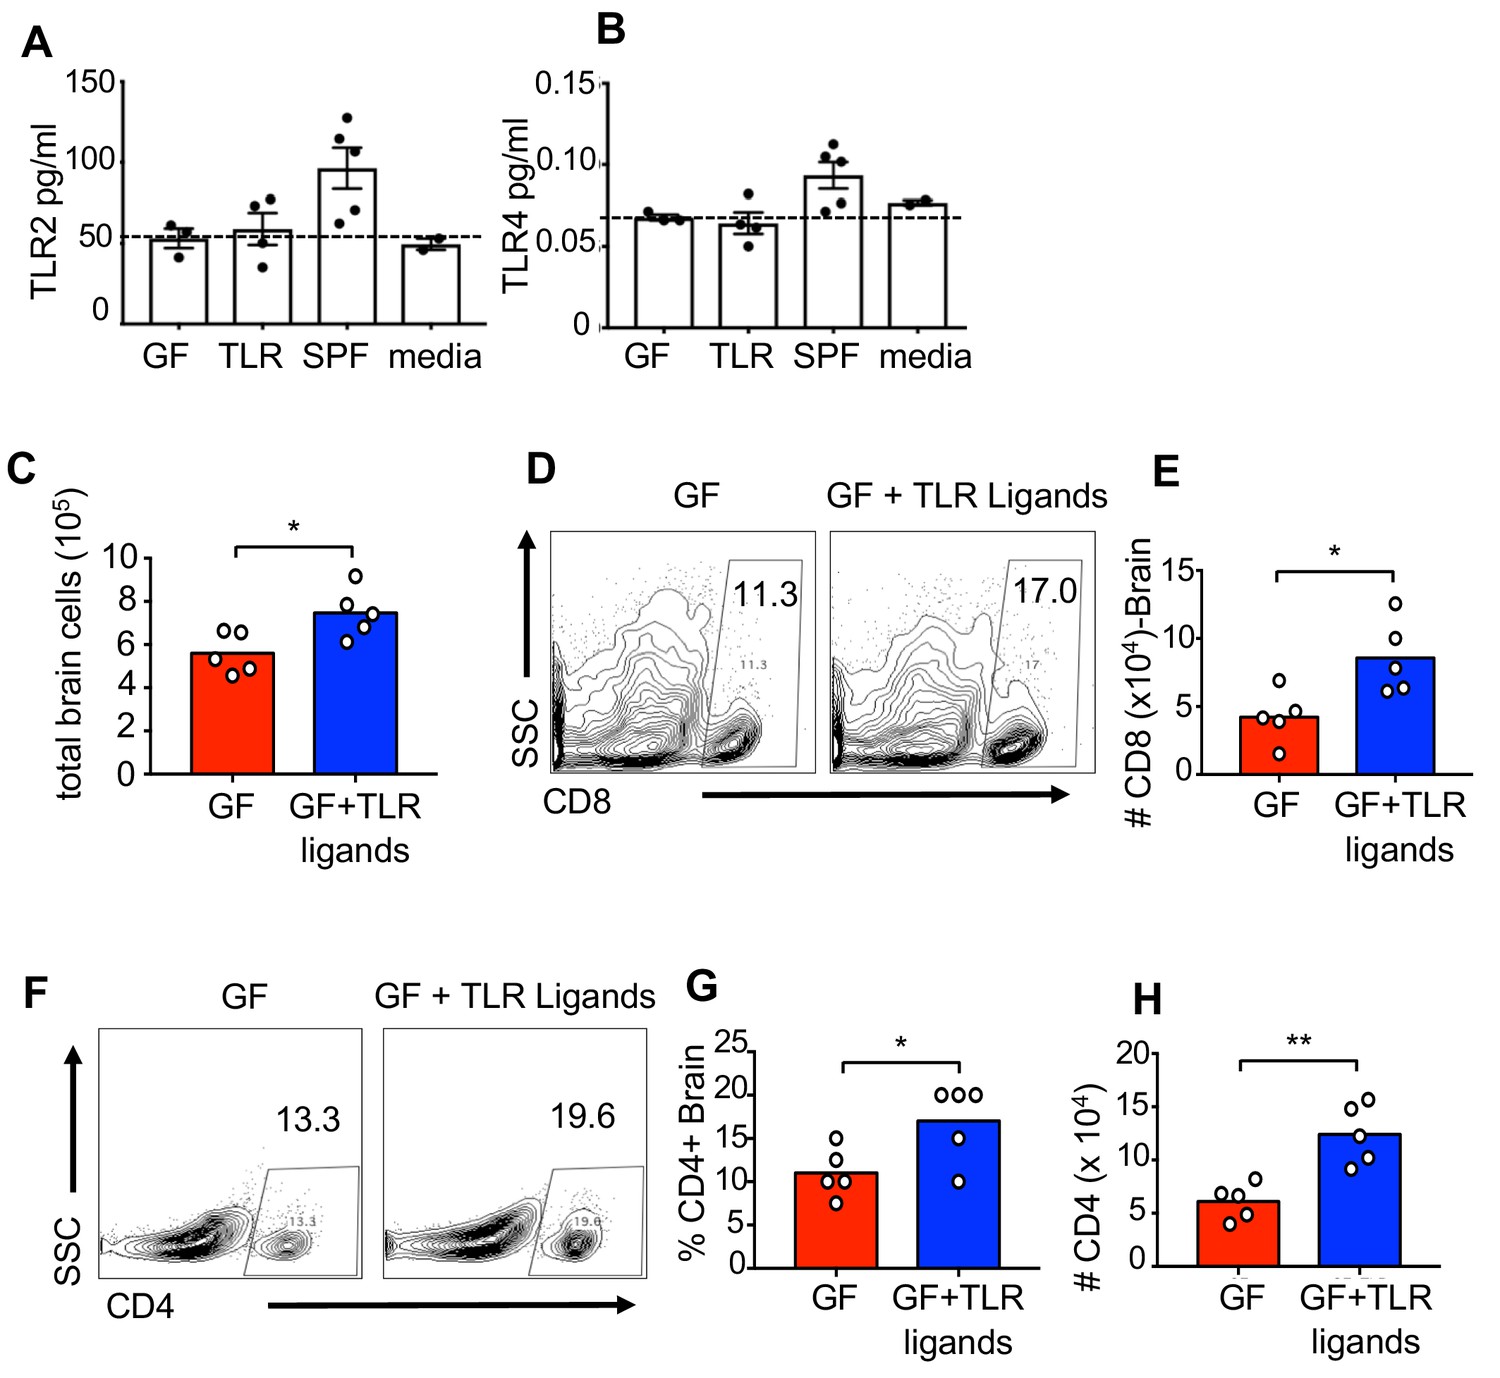
Oral treatment with TLR ligands is sufficient to increase the immune response during CNS viral infection.
Serum levels of (A) TLR2 and (B) TLR4 ligands in animals that are germfree (GF), TLR ligand-treated (TLR) specific pathogen free (SPF) or from media using the HEK293 cells from invivoGen. (C-H) GF mice or GF mice receiving the TLR ligands LPS and Pam3CysK4 in their drinking water were infected with 150 PFU of JHMV as shown in Figure 4. Brains were removed from JHMV-infected mice at day 9 p.i. and (C) total number of cells isolated determined. (D) Representative flow plots for CD8+ T cell frequency. (E) total numbers of CD8+ T cells. (F) Representative flow plots for CD4+ T cells as well as (G) frequency and (H) total number counts of CD4 T cells (n = 5). Significance determined by two-tailed student’s t test *p<0.05, **p<0.01, ***p<0.001. Data represents individual mice (biological replicates) and means + SEM.
Figure 6 with 1 supplement

TLR4 signaling protects from JHMV-induced neurologic disease.
WT C57BL/6 (n = 8) and TLR4-/- (n = 6) were infected i.c. with 150 PFU of JHMV and followed for 21 days. (A) Clinical scores (left) and associated area under curves (right) from infected mice. (B) Representative luxol fast blue/H&E staining of spinal cord sections, with lines illustrating demyelination of WT and TLR4-/- mice at 21 days p.i. (C) Quantification of spinal cord demyelination of WT (n = 7) and TLR4-/- (n = 4) mice at 21 days p.i. Representative flow plot (D) and total number of MHC class II + microglia (E) from WT and TLR4-/- mice under steady state conditions (n = 5). (F–G) WT and TLR4-/- (n = 8) mice were infected with JHMV and analyzed at day 9 p.i. Representative flow plots of microglia (F), total number of MHCII+ microglia (G). All data displayed as mean with SEM. Means are of biological replicates. All significance determined by Student’s t test. *p<0.05, **p<0.01, ***p<0.001.
Figure 6—figure supplement 1
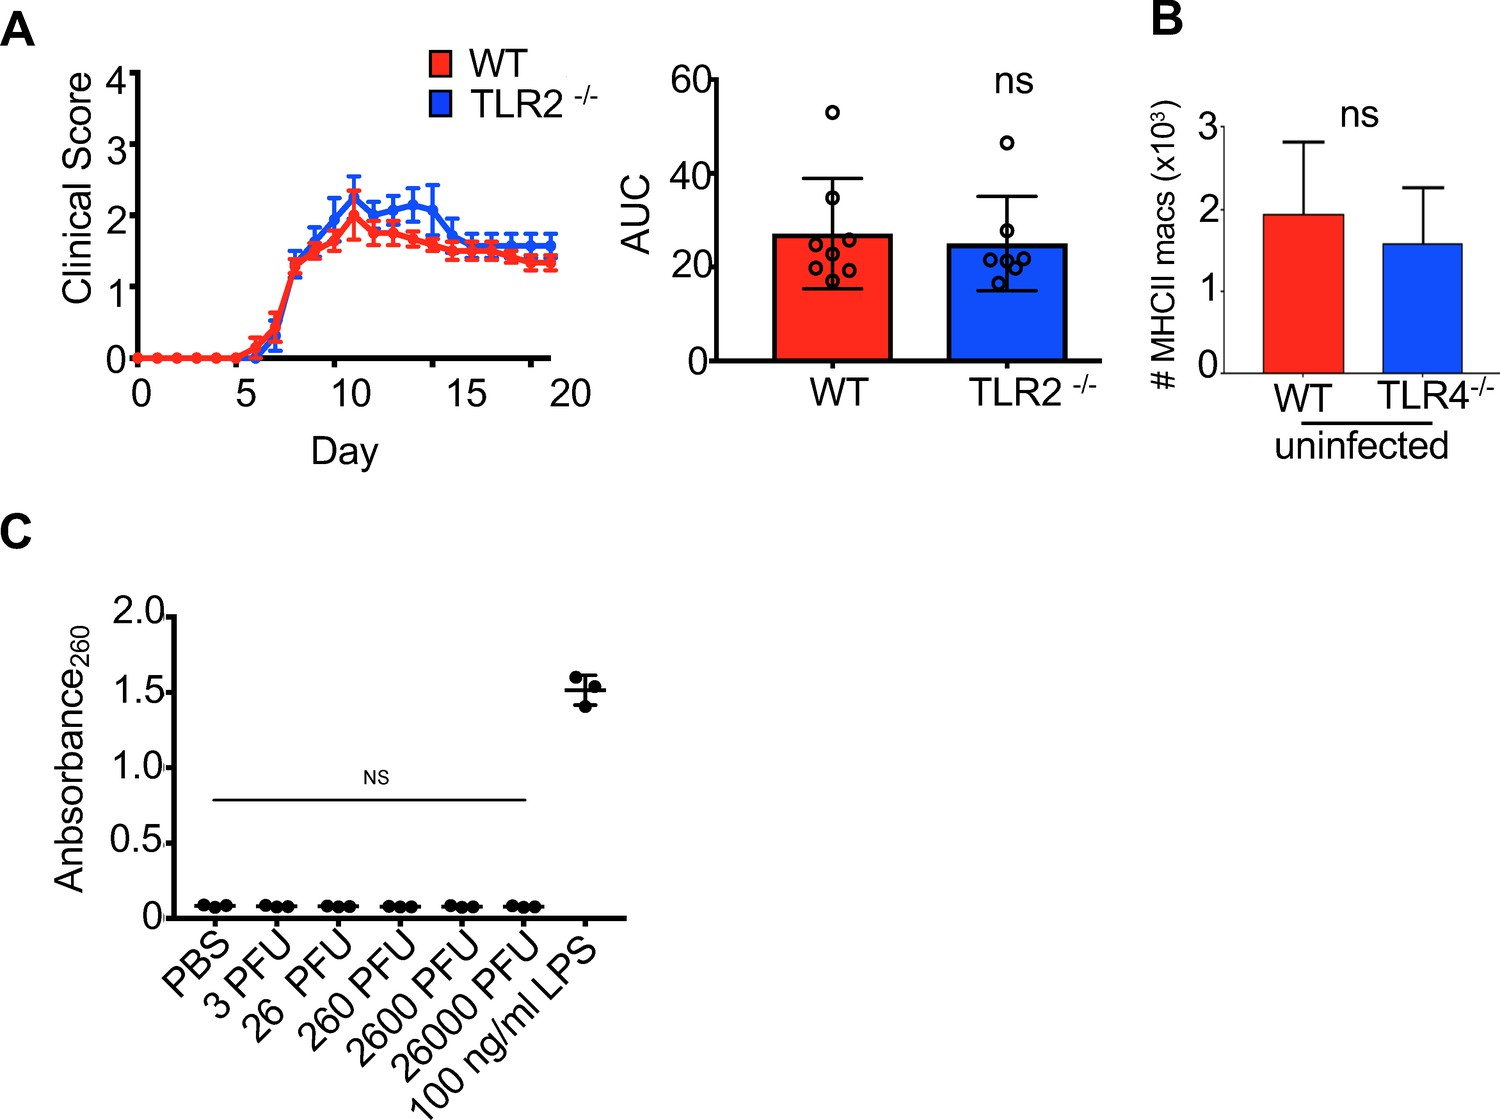
TLR4 signals within microglial cells to limit morbidity in response to JHMV infection of the CNS.
(A) Clinical scores (left) and area under the curve (right) of TLR2 KO vs WT mice after infection with JHMV (n = 7–8 ). (B) Number of MHCII-positive macrophages from WT and TLR4-/- mice under steady state conditions (n = 5). (C) HEK-Blue TLR4 detection cell lines were incubated with indicated concentrations of JHMV to determine whether JHMV itself could signal through TLR4, PBS or 100 ng/ml LPS. Data points indicate technical replicates (n = 3) and mean ± SEM. Data represented as mean ± SEM. Means are calculated from biological replicates.
Figure 7 with 1 supplement
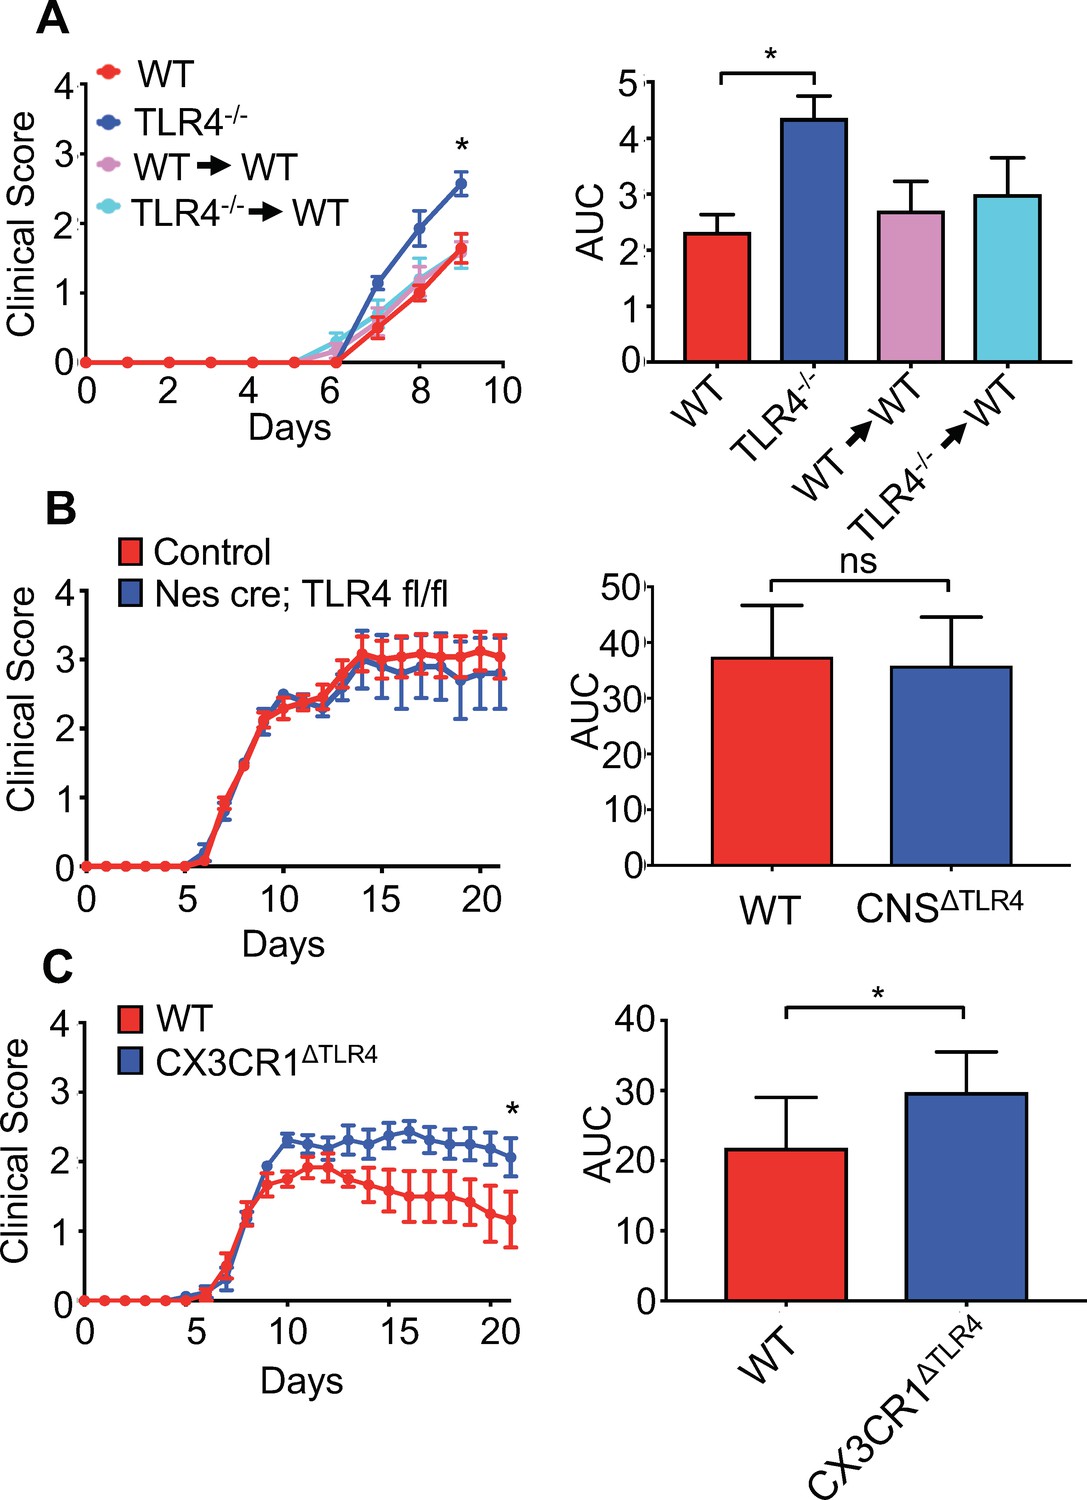
Microglial-specific TLR4 signaling protects from neurologic disease.
(A) WT, TLR4-/-, WT mice receiving WT bone marrow and WT mice receiving TLR4-/- bone marrow were infected with JHMV and clinical scores (left) and area under curve (right) calculated. (B) Nestin-Cre or TLR4-fl/fl (as WT controls) (n = 12) and nestin-Cre TLR4-fl/fl (n = 5) were infected with JHMV and clinical scores (left) and area under curve (right) determined. Results representative of two independent experiments (C) TLR4 fl/fl (n = 6) (as WT controls) and CX3CR1CreER TLR4 fl/fl (n = 8) mice were treated with tamoxifen, and 1 month later infected with 150 PFU of JHMV. Clinical scores (left) and area under curve were calculated. All data displayed as mean with SEM. Means are of biological replicates. Clinical score significance determined using two-way ANOVA statistical test with multiple comparisons. Area under the curve significance calculated by one-way ANOVA, comparing each group to WT (B) or by Student’s t test (C). *p<0.05, ***p<0.001.
Figure 7—figure supplement 1
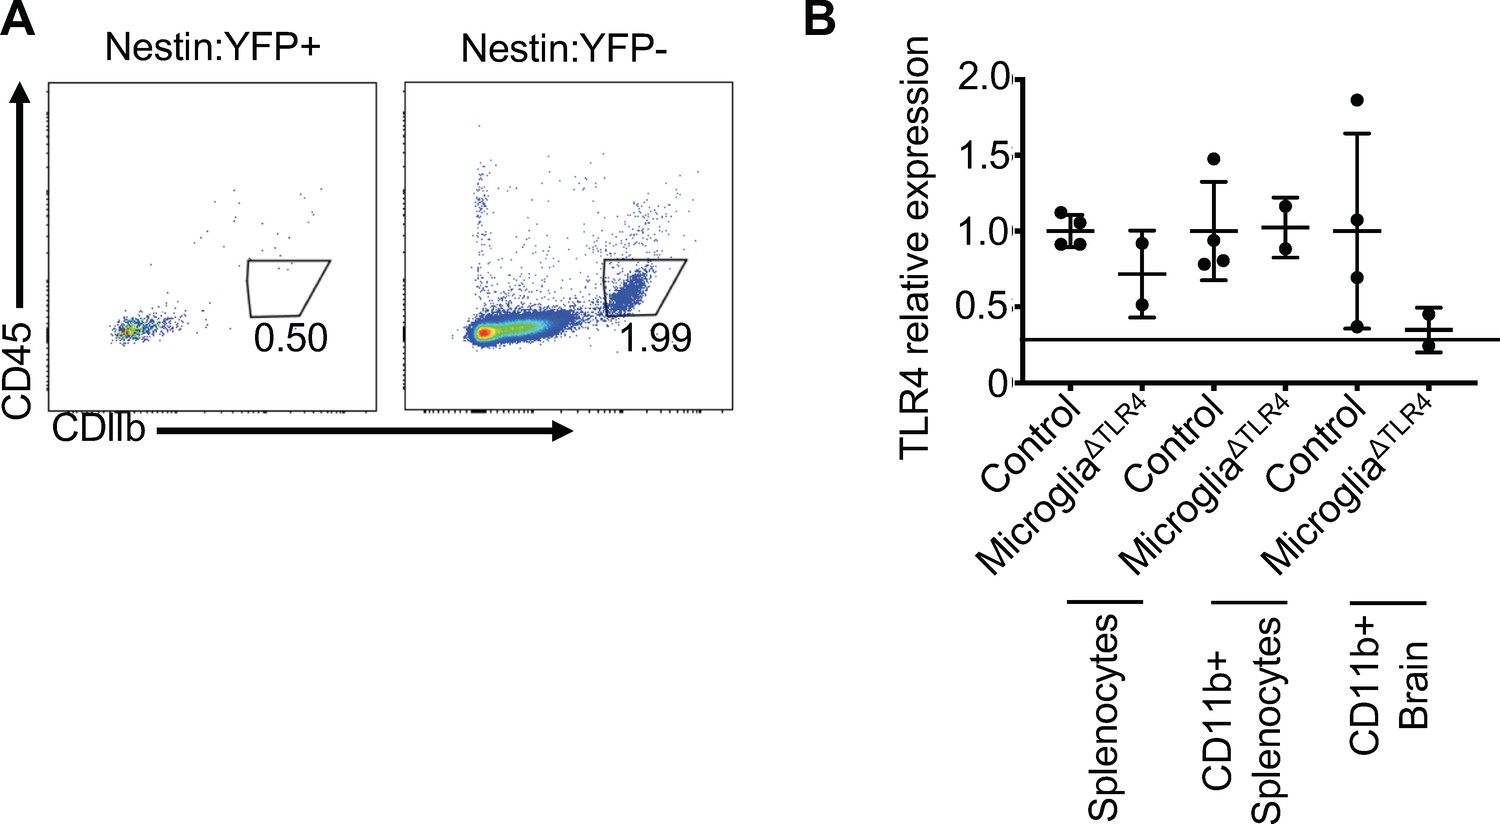
TLR4 signals within microglial cells to limit morbidity in response to JHMV infection of the CNS.
(A) Brains from R26R-EYFP; nestin-Cre mice were gated on YFP+ (left) or YFP- (right) populations and microglial markers displayed. (B) qPCR of TLR4 from unpurified splenocytes, CD11b+ MACS purified splenocytes, and CD11b+ MACS purified brain cells of tamoxifen-treated control (TLR4-fl/fl) and microglialΔTLR4 (CX3CR1CreER); TLR4-fl/fl) mice. Data represented as mean ± SEM. Means are calculated from biological replicates.
Additional files
-
Supplementary file 1
Key resources table.
- https://doi.org/10.7554/eLife.47117.018
-
Transparent reporting form
- https://doi.org/10.7554/eLife.47117.019
Download links
A two-part list of links to download the article, or parts of the article, in various formats.
Downloads (link to download the article as PDF)
Open citations (links to open the citations from this article in various online reference manager services)
Cite this article (links to download the citations from this article in formats compatible with various reference manager tools)
The microbiota protects from viral-induced neurologic damage through microglia-intrinsic TLR signaling
eLife 8:e47117.
https://doi.org/10.7554/eLife.47117


