Identification of an allosteric binding site on the human glycine transporter, GlyT2, for bioactive lipid analgesics
- University of Sydney, Australia
- The Australian National University, Australia
- University of Technology Sydney, Australia
Figures
Figure 1 with 10 supplements
Defining the bioactive lipid binding site.
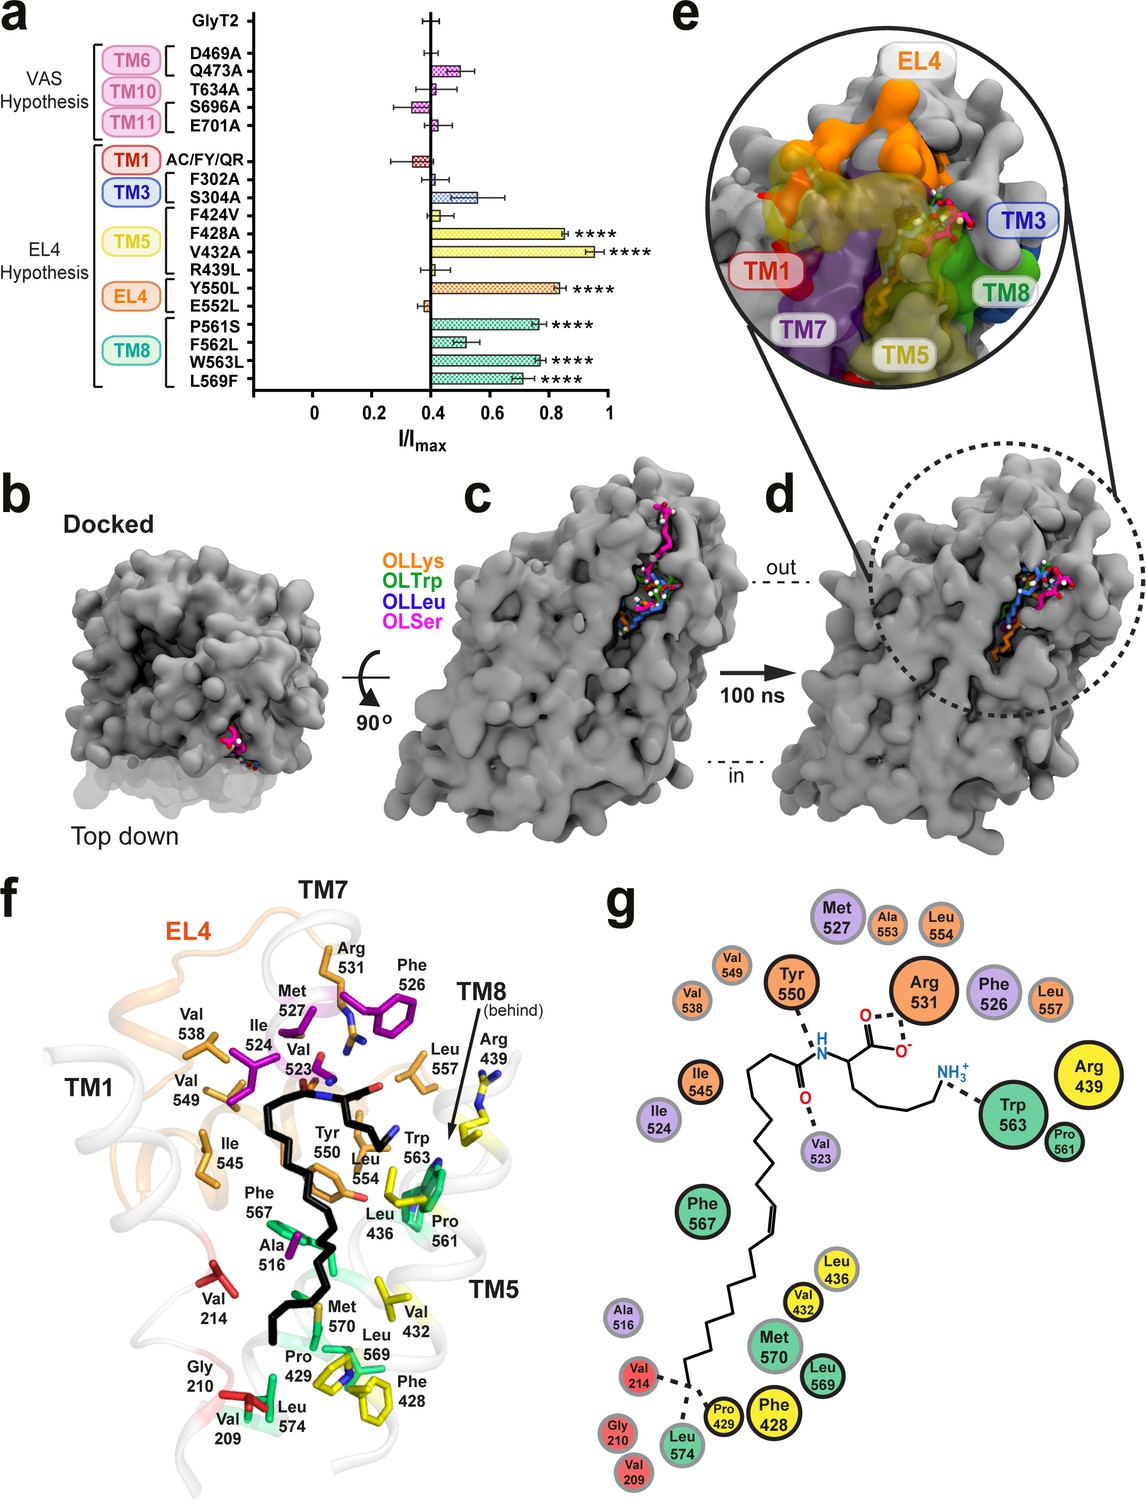
(a) Inhibition of GlyT2 by 1 µM oleoyl L-carnitine. Transporters were WT or with mutations to the vestibule allosteric site (VAS) or adjacent to EL4. The reduced glycine transport currents were normalised to the current elicited by glycine alone. Data represented are means ± SEM with ****p<0.001 following a one way ANOVA test. (b–e) All lipid inhibitors docked to GlyT2 and burrowed into an area between EL4, TM1, TM5, TM7, and TM8 during 100 ns of simulation. (b) The initial docked poses, viewed top down from the extracellular side of GlyT2 (grey surface). Sections of TM1, TM5, and TM7 are cut away in (b–d) to show the docking cavity (transparent surface). (c) The initial docked poses of OLLys (orange sticks), OLTrp (green sticks), OLLeu (blue sticks), and OLSer (magenta sticks) overlaid on GlyT2. (d) The conformations of the lipid inhibitors after 100 ns of unrestrained MD simulation, overlaid on GlyT2 from the OLLys simulation. (e) A close-up view of the inhibitors following 100 ns of simulation, with surrounding TM helices, including those cut away in panels (b–d), shown as a coloured surface. (f–g) Map of key regions in the extracellular allosteric site. (f) 3D arrangement of residues within 4 Å of OLLys (black sticks) following 100 ns of simulation. Residues have side chains shown as sticks, with side chains coloured TM1 (red), TM5 (yellow), TM7 (purple), EL4 (orange), TM8 (green). V523 is a backbone interaction. F428, R439, and L569 are >4 Å but shown for reference. (g) 2D representation, with residues studied via mutagenesis outlined in black.
Figure 1—figure supplement 1

Protonation states of OLLys (orange), OLTrp (green) OLLeu (blue), and OLSer (magenta) used in the docking and molecular dynamics simulations.
https://doi.org/10.7554/eLife.47150.003
Figure 1—figure supplement 2
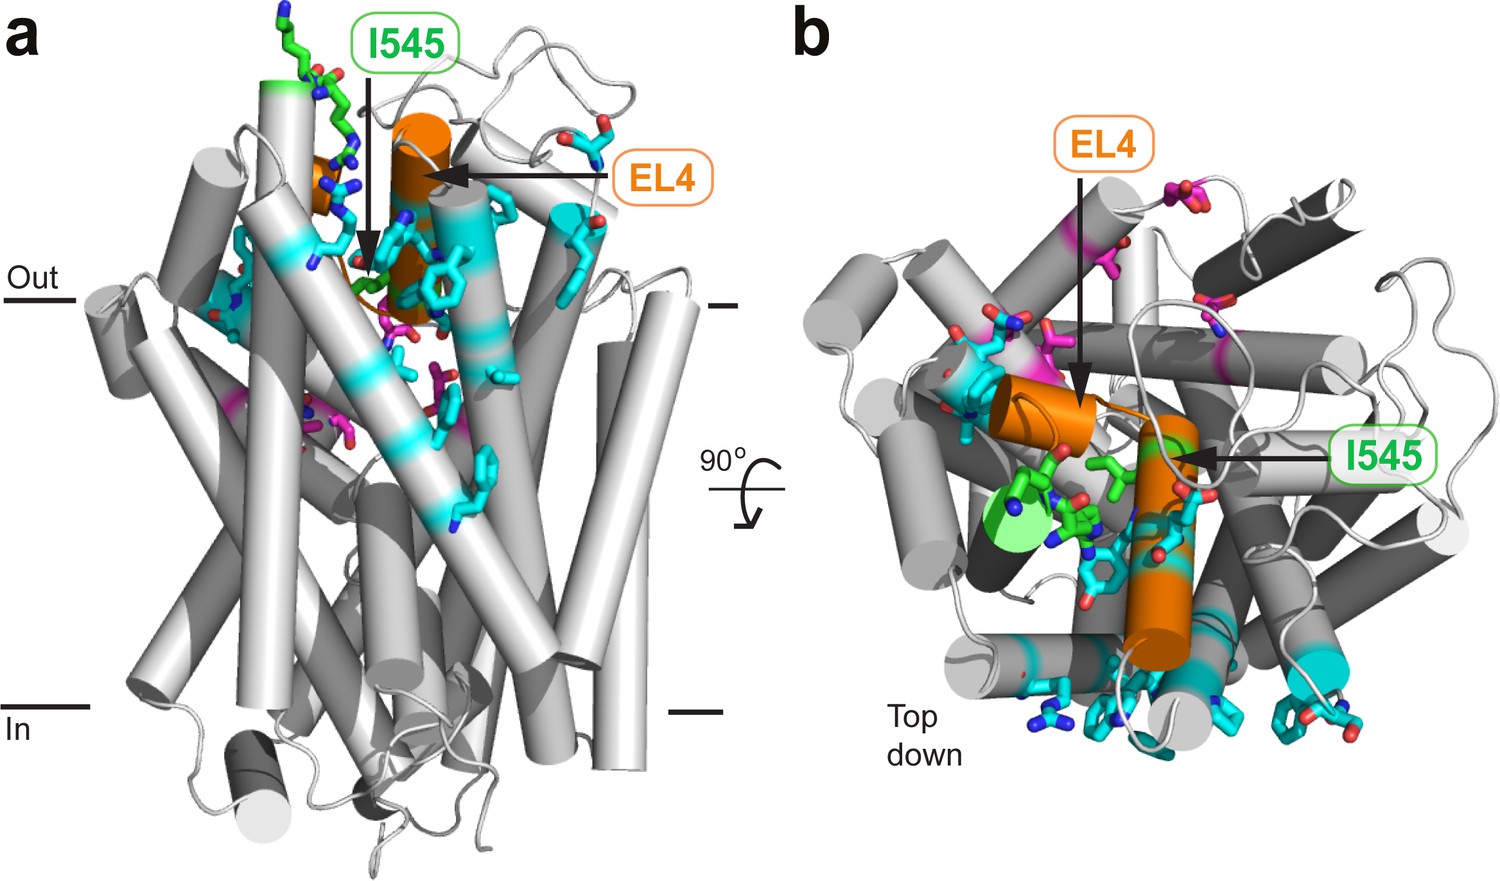
Location of mutated residues on GlyT2.
(a) Reverse face (b) Top down. Residues which were mutated are shown in licorice representation and coloured red (oxygen), blue (nitrogen), and either magenta or cyan (carbon) for residues in the vestibule allosteric site, or EL4 adjacent respectively. I545, R531, and K532 are also shown in green licorice. EL4 is coloured orange.
Figure 1—figure supplement 3
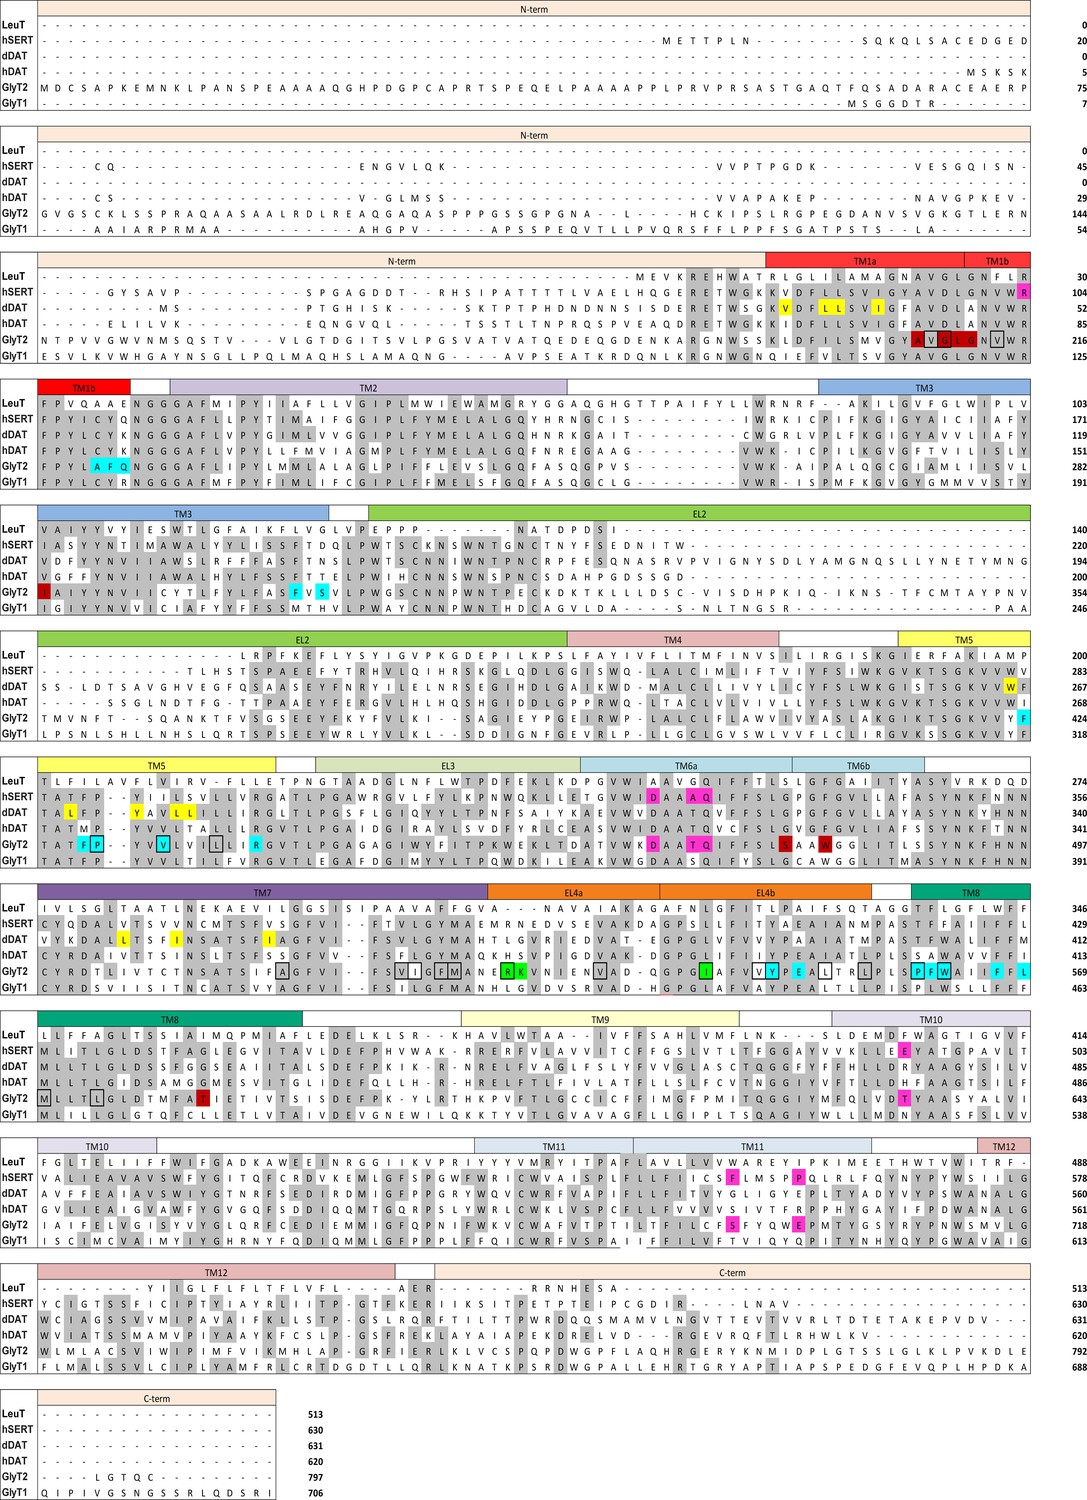
Sequence alignment of LeuT, hSERT, dDAT, hDAT, GlyT2, and GlyT1.
Conserved residues are coloured grey. I545, R531, and K532 are indicated with coloured green boxes. Residues tested in the vestibule allosteric site are coloured magenta, and mutated residues chosen for their relationship with EL4 are coloured cyan. Residues within 4 Å of OLLys following 100 ns of simulation are outlined with a black box. Also highlighted are the glycine binding site of GlyT2 (maroon), the cholesterol binding site of dDAT from Penmatsa et a., 20133 (yellow), and the (s)-citalopram binding site of hSERT from Coleman et al. (2016) (magenta).
Figure 1—figure supplement 4
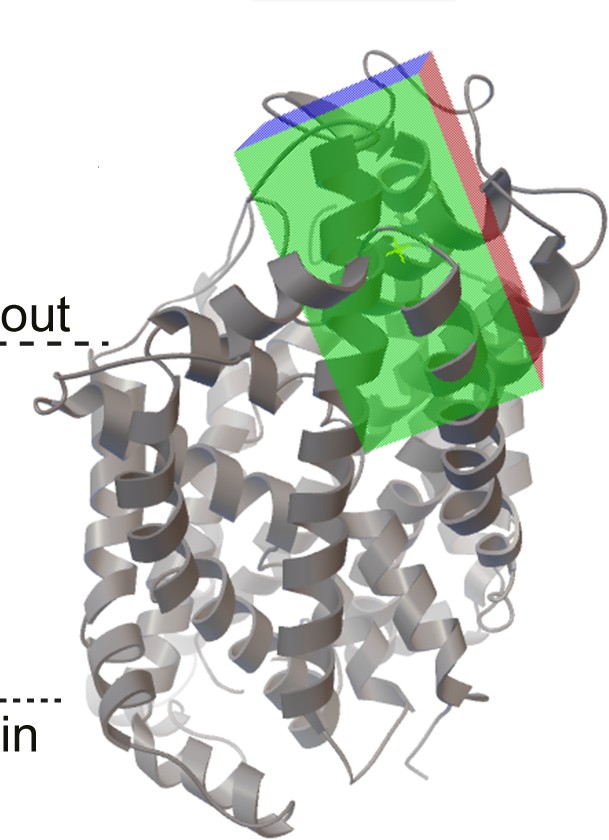
The search space for the docking to the GlyT2 homology model (grey ribbons) was defined as a rectangular box (green/red/blue shaded walls) near mutated residues on EL4, TM5, TM7 and TM8.
https://doi.org/10.7554/eLife.47150.006
Figure 1—figure supplement 5
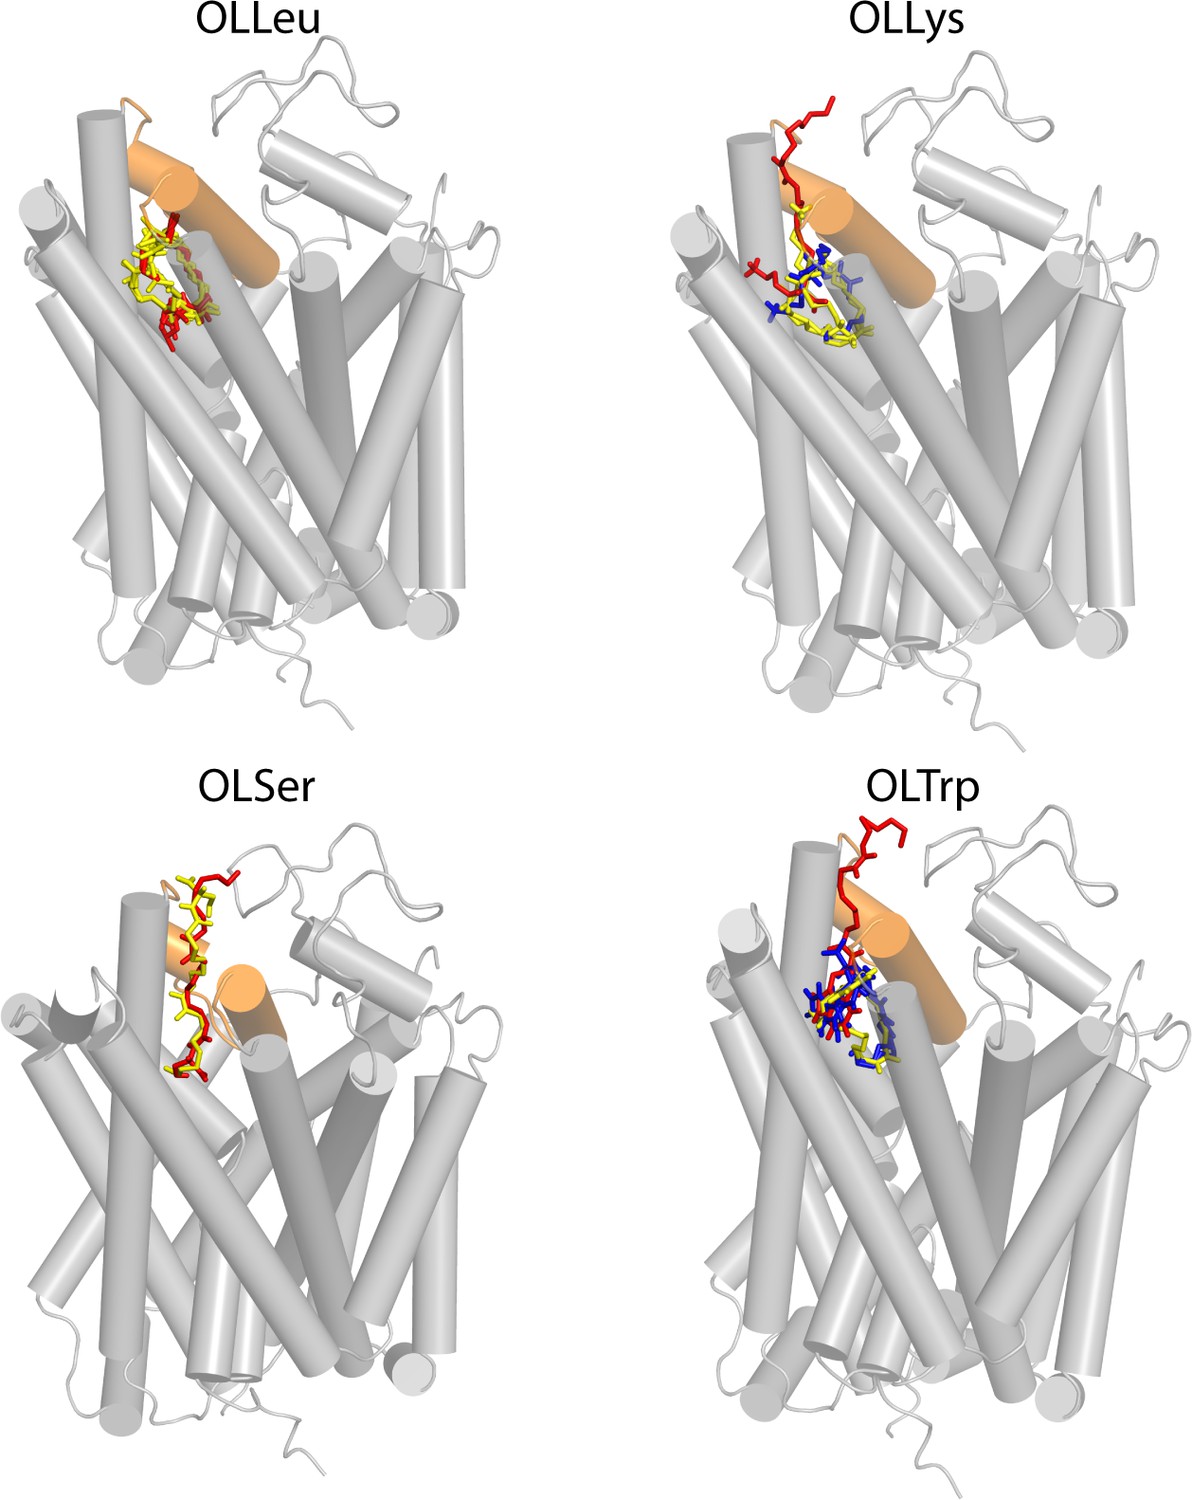
Resulting poses from docking to the GlyT2 homology model (grey ribbons), with EL4 highlighted in orange.
For each inhibitor, the headgroup docked in a similar location, with relative differences in the spatial orientation of the tail. Poses were classified as (1) the head inserted into extracellular pocket with the tail exposed to water (red); (2) the tail inserted into extracellular pocket with the double-bond in close proximity to 1545 of EL4 (blue); and (3) tail inserted into extracellular pocket with the double-bond in close proximity to TM5 and the protein-lipid interface (yellow). Note that Pose one represents an inversion of the molecule along the membrane normal relative to Pose two and Pose 3. Pose 2 and 3 represent a rotation of the inhibitor by ~180° within the plane of the membrane.
Figure 1—figure supplement 6
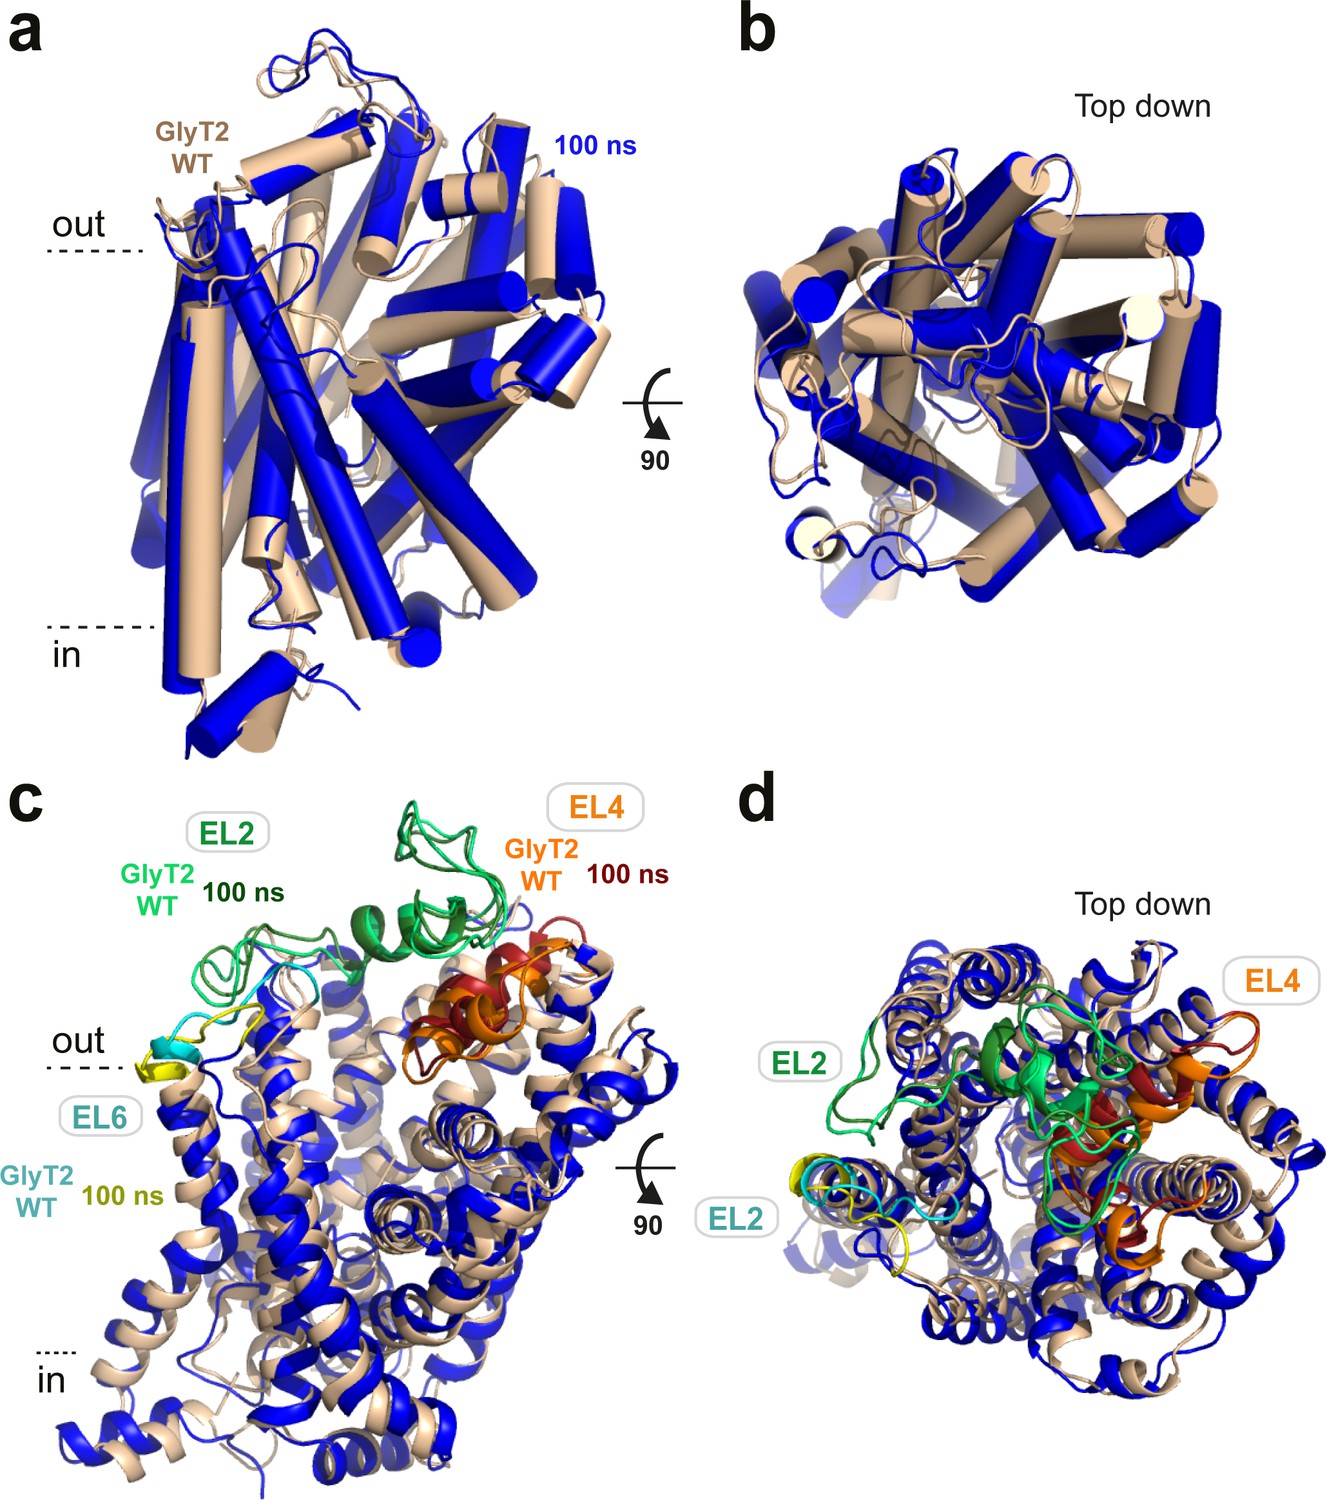
After 100 ns of simulation, GlyT2 retained a similar overall conformation when the lipid inhibitors were present (GlyT2 with OLLys - blue) or absent (GlyT2 WT - wheat), as shown.
(a) In plane of the membrane and (b) Top down. Extracellular loops EL2 and EL6 displayed the highest increase in root-mean-square fluctuation (RMSF) between the unbound and inhibitor-bound simulations of membrane-embedded GlyT2, as shown in (c) In plane of the membrane and (d) Top down. EL2 is coloured light green (GlyT2 WT) and dark green (100 ns), EL6 is coloured cyan (GlyT2 WT) and yellow (100 ns), and EL4 is coloured orange (GlyT2 WT) and red (100 ns) for reference. Note that the POPC/cholesterol bilayer is hidden for clarity.
Figure 1—figure supplement 7
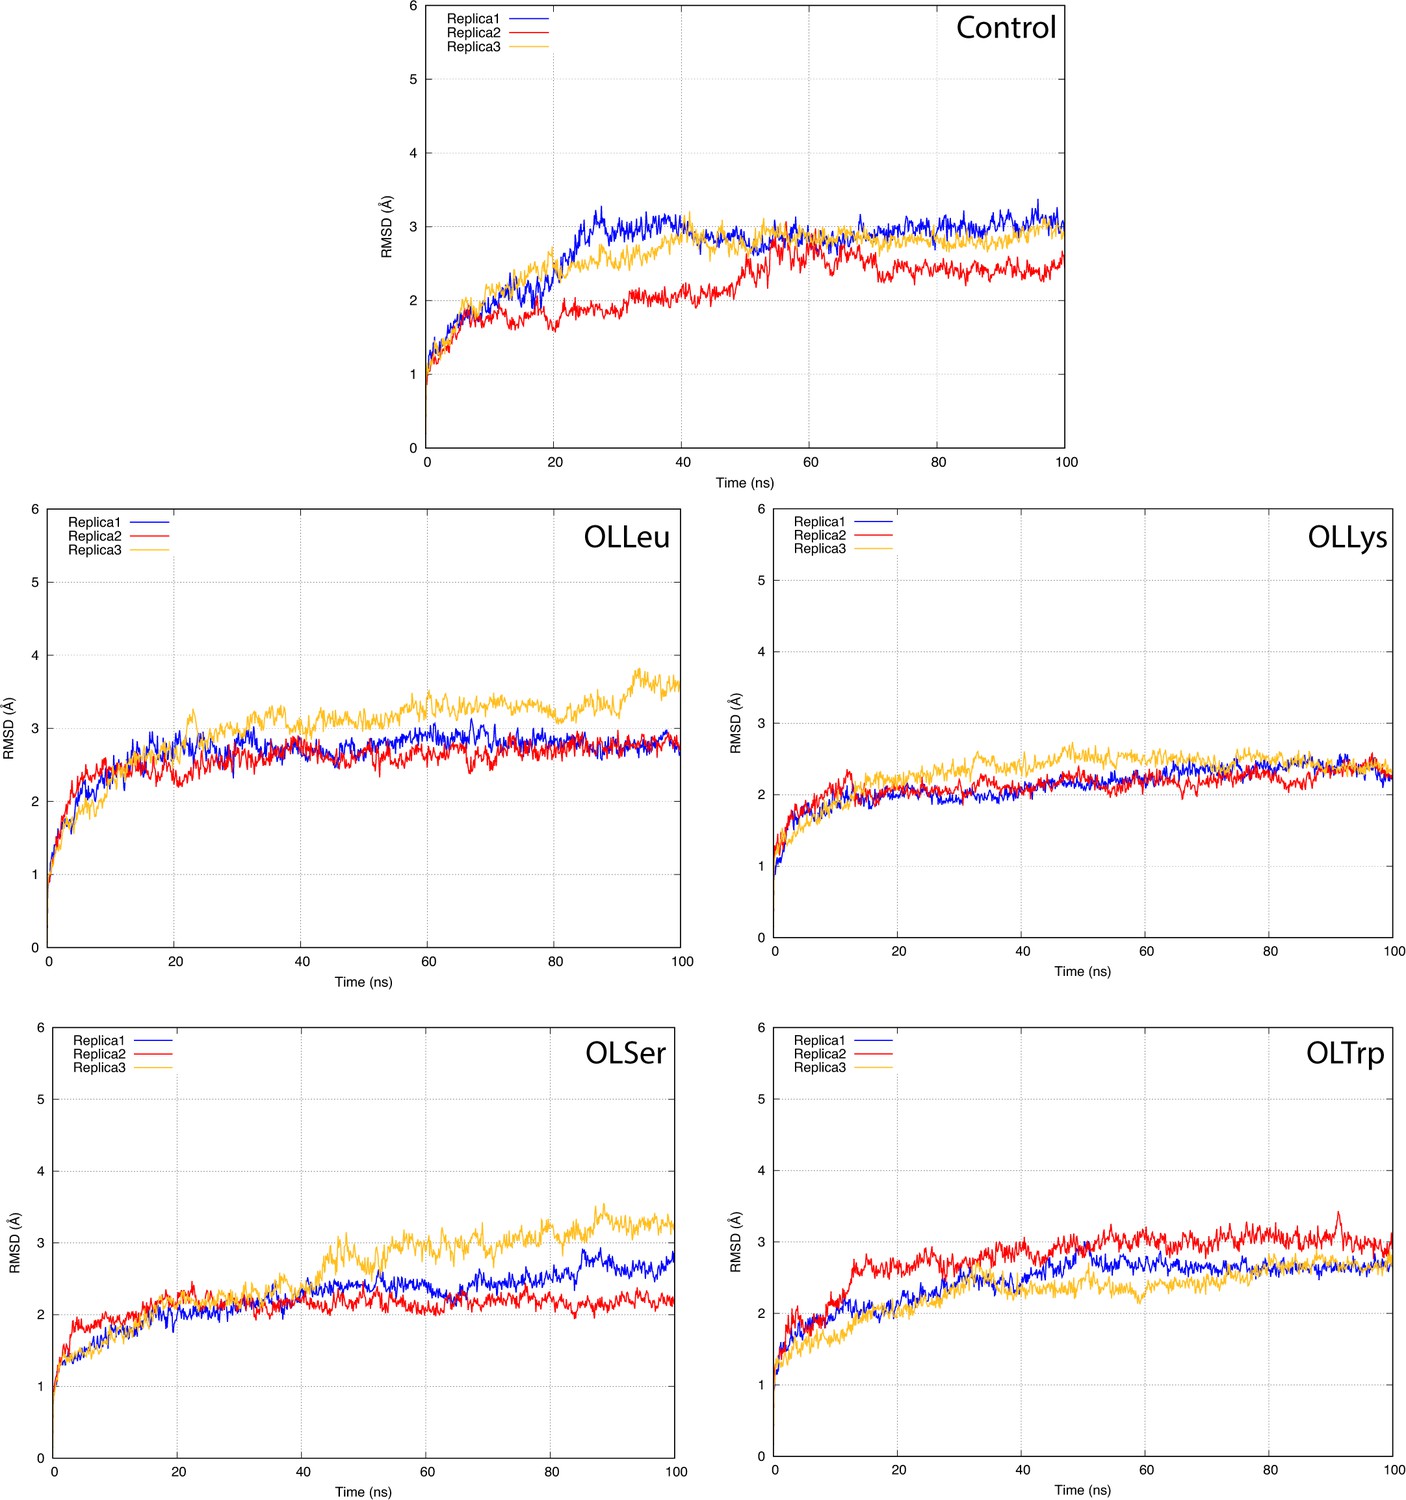
The root-mean-square deviation (RMSD) of GlyT2 with no lipid inhibitor bound or when the lipid inhibitor is bound with tail inserted into extracellular pocket and directed towards TM5.
The RMSD was calculated for protein backbone.
Figure 1—figure supplement 8
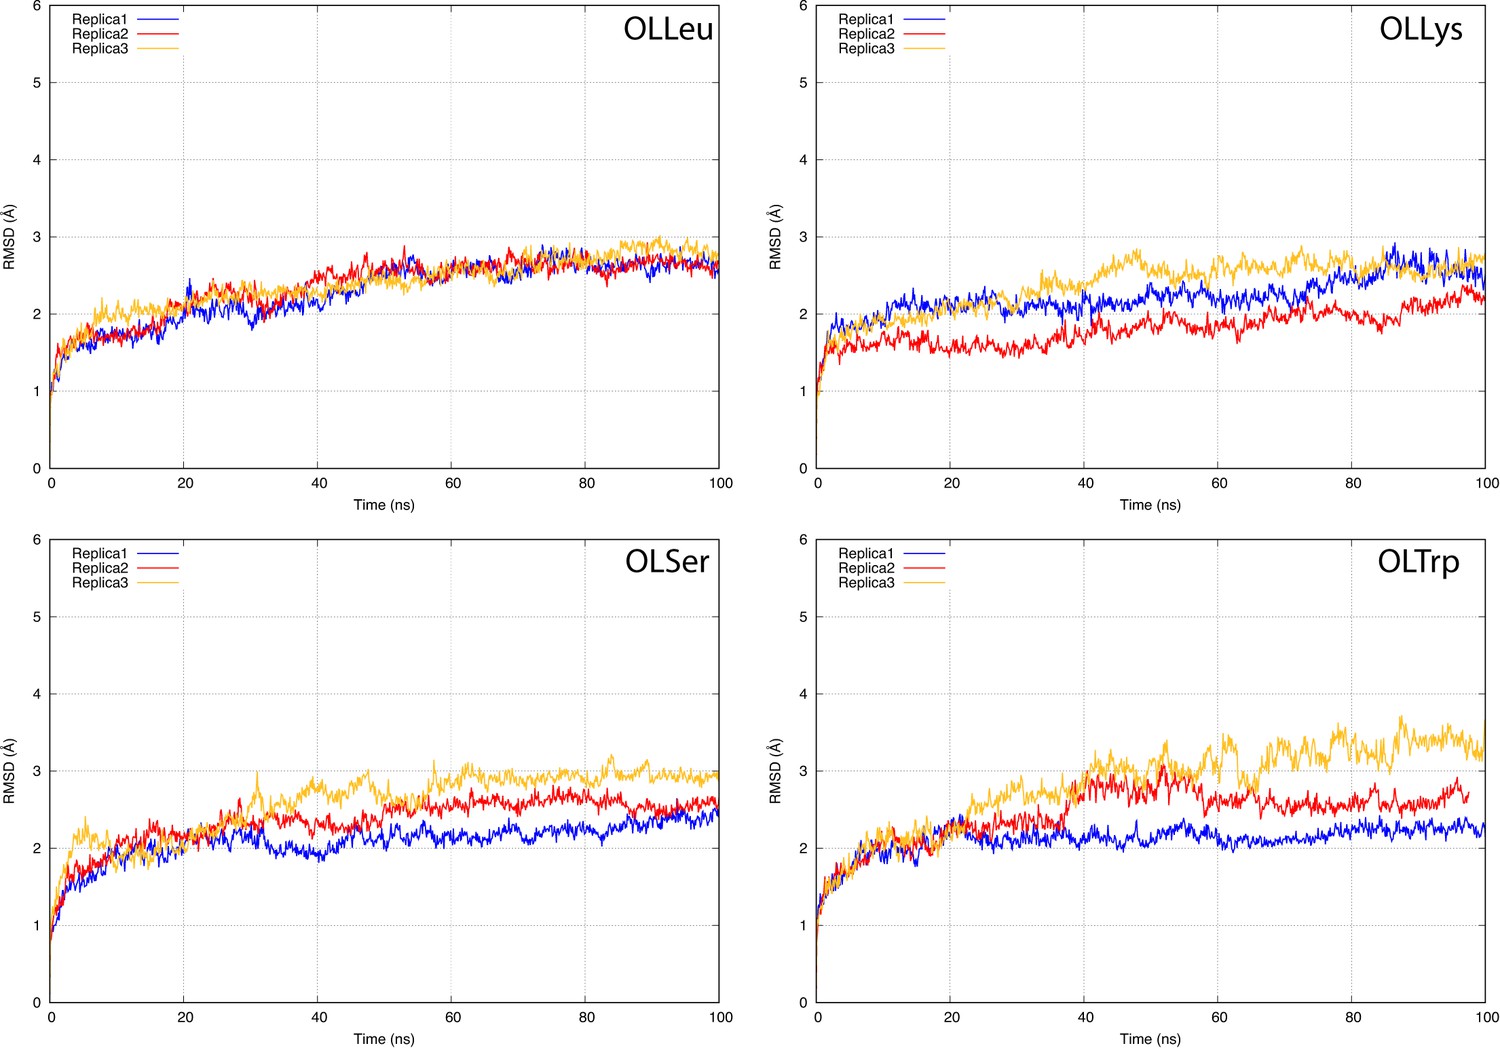
The root-mean-square deviation (RMSD) of GlyT2 when the lipid inhibitor is bound with the head inserted into extracellular pocket.
The RMSD was calculated for protein backbone.
Figure 1—figure supplement 9
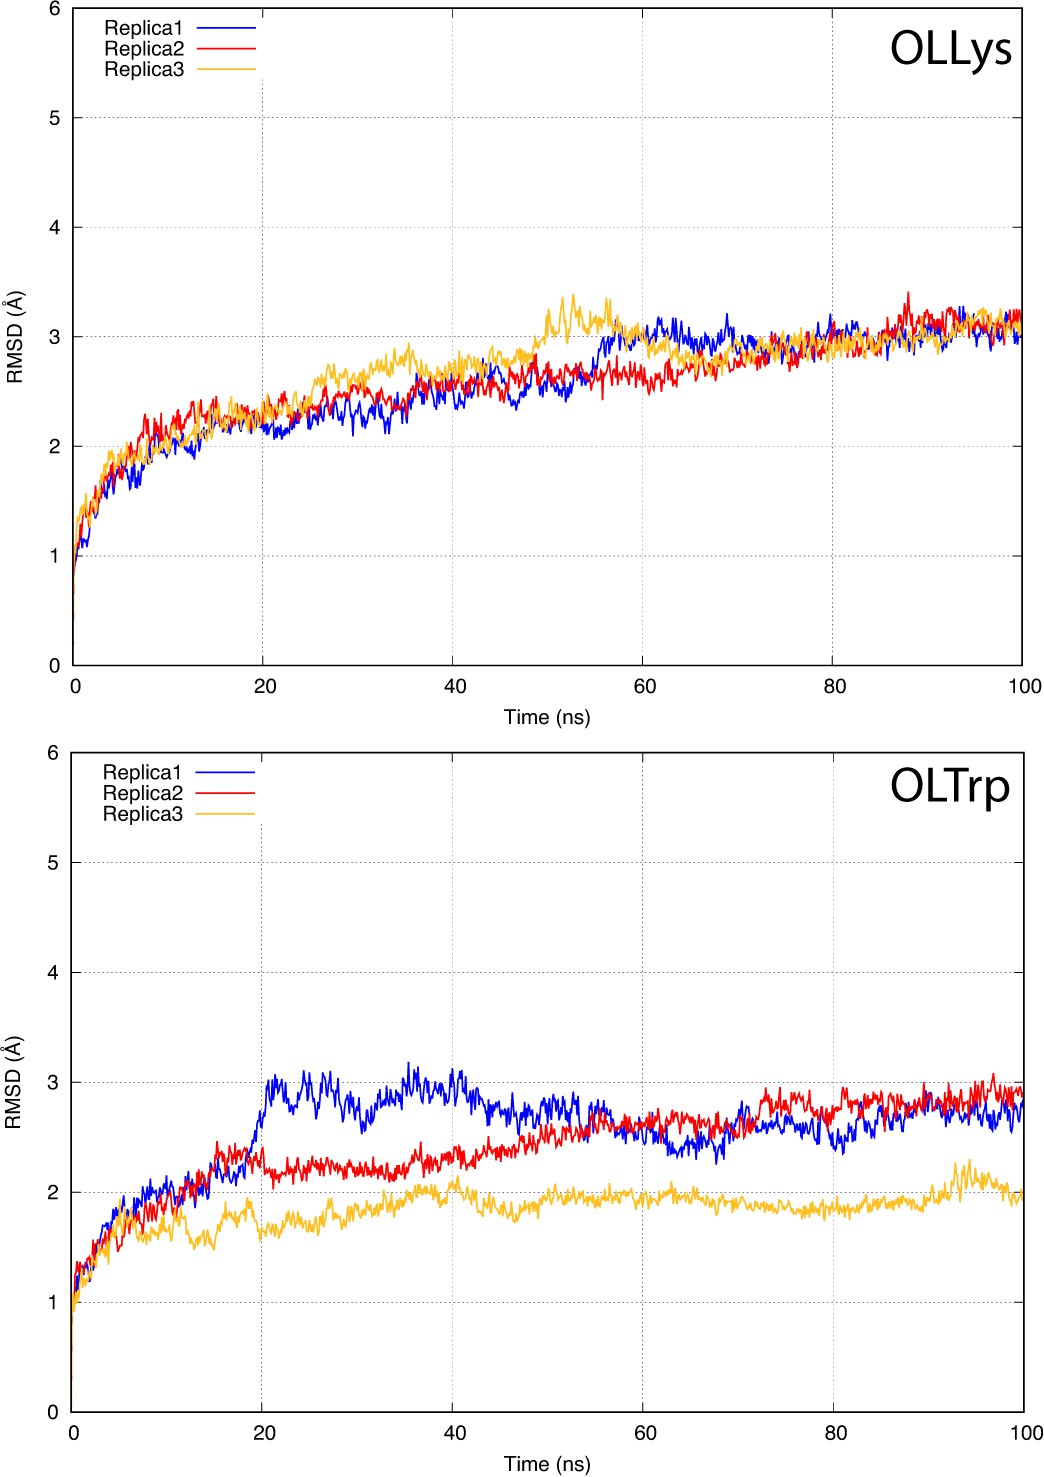
The root-mean-square deviation (RMSD) of GlyT2 when the lipid inhibitor is bound with tail inserted into extracellular pocket and directed towards EL4.
The RMSD was calculated for protein backbone.
Figure 1—figure supplement 10

The root-mean-square fluctuation (RMSF) of GlyT2 diverged in specific, local regions of GlyT2 when no lipid inhibitor is bound.
(a), or when the lipid inhibitor is bound with the head inserted into extracellular pocket (b), tail inserted into extracellular pocket and directed towards EL4 (c), tail inserted into extracellular pocket and directed towards TM5 (d) or tail inserted into extracellular pocket in the I545L mutant (e). The RMSF was calculated for the α-carbon atoms of the protein backbone. Note that the homology model does not contain part of EL2, as indicated by the gap in the x-axes.
Figure 2

I545 facilitates lipid inhibitor binding to the extracellular allosteric site.
(a) Docked position of OLLys (magenta spheres) where the acyl tail is folded at the double bond, and neighbours EL4. (b). Throughout the simulation I545 (cyan spheres) faces towards the binding cavity and interacts with the acyl tail, where there is a substantial kink adjacent to the head group. (c) Overlay showing snapshots of OLSer as it moves from the docked position (0 ns, green sticks) and into the cavity between TM5/7/8 of WT GlyT2 (50 ns, red sticks; 100 ns, blue sticks). I545 is shown as cyan spheres. TM5 and TM7 are transparent to show the cavity. (d-f) The I545L mutation (cyan spheres) sterically blocks deep insertion into the cavity. (d) Docked position of OLLys (magenta spheres) on the I545L mutant transporter and (e) following 100 ns of simulation – OLLys maintains head group interactions but the acyl tail adopts a hairpin structure to bind at a shallower cavity. (f) Overlay of OLSer as it leaves the docked position and cannot insert into the I545L mutant GlyT2, but instead idles above in the extracellular compartment. Coloured as in (c). (g-h) Acyl amino acids inhibit glycine transport currents of WT and mutant GlyT1 and GlyT2 transporters. Glycine transport currents were measured in the presence of lipids to generate concentration inhibition curves for (e). OLCarn (⊗) and (f) oleoyl l-Lys (□). GlyT2 WT is shown in black, GlyT1 WT is in grey, I545L (G2) is in teal, and L425I (G1) in pink.
Figure 3
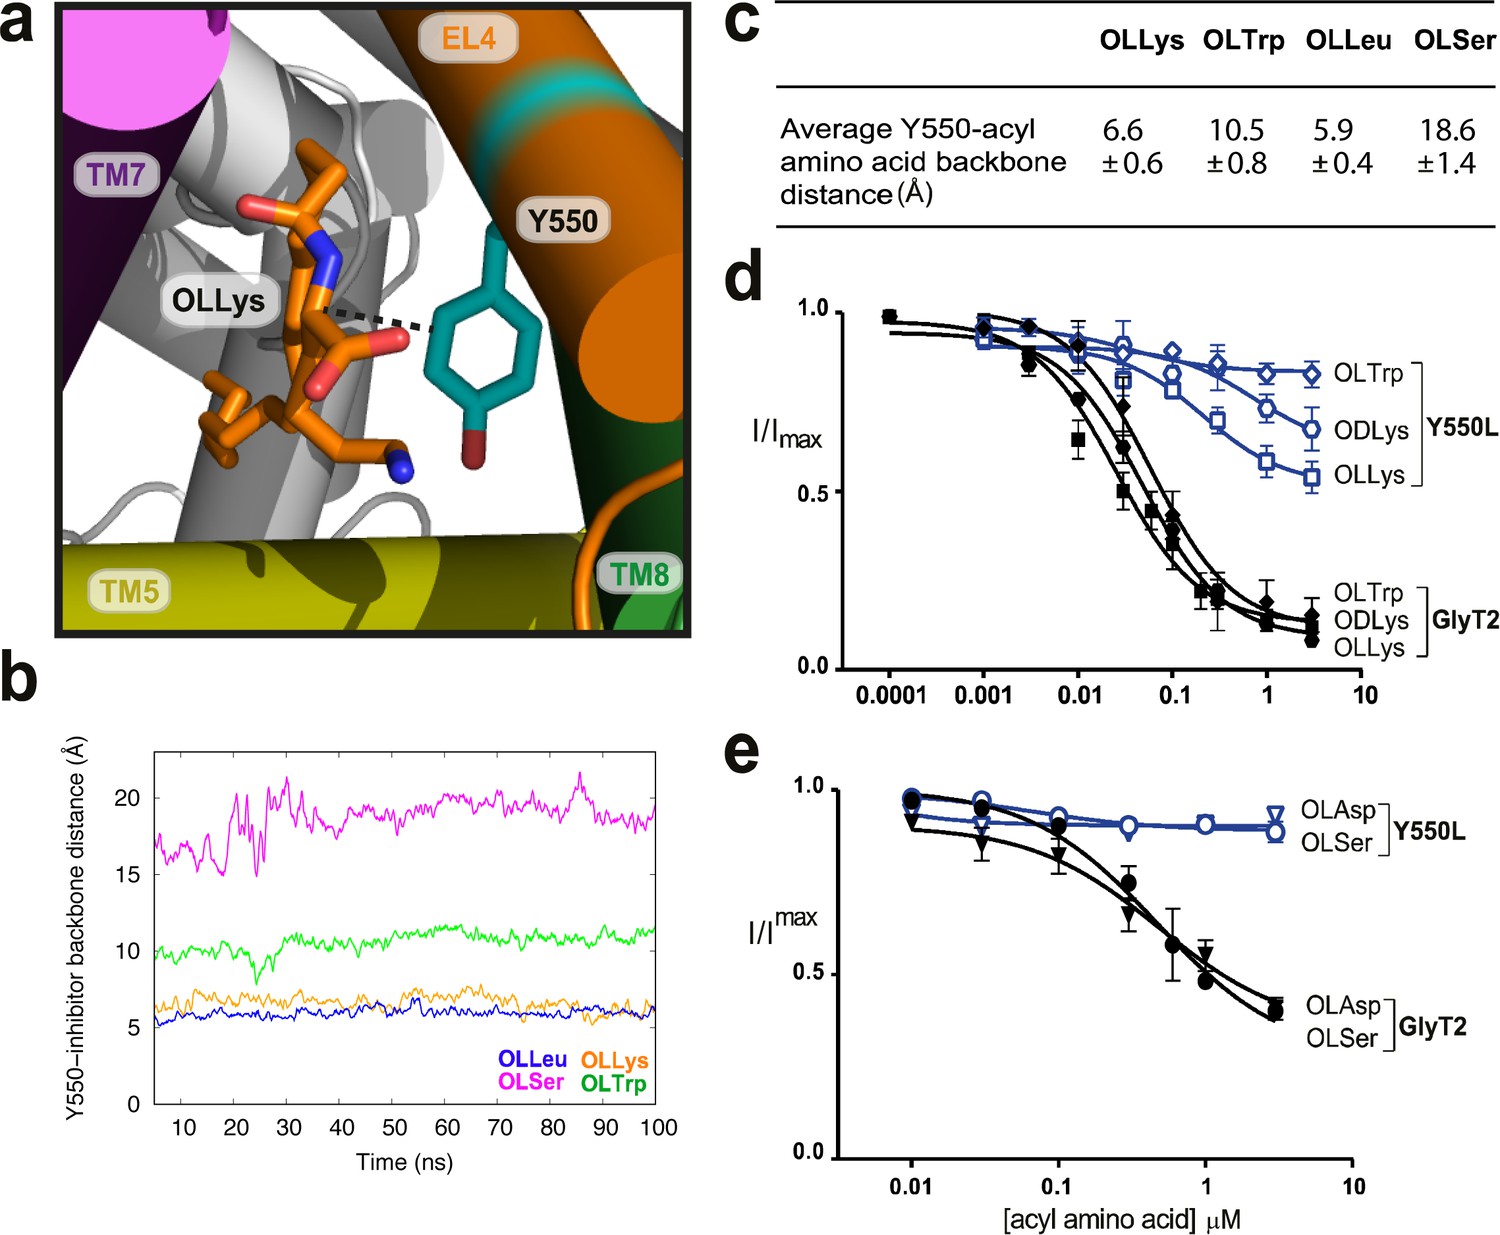
Y550 coordinates the amino acid head group.
(a) Snapshot showing how the distance between C3 on the acyl-amino acids (OLLys shown here, in orange sticks) and Cα on Y550 was calculated. (b) The OLLys/OLLeu C3 (orange and blue lines, respectively) were closer to the Y550 ring than OLTrp/OLSer C3 (green and magenta lines, respectively) during the simulations, with the average distance shown in (c). (d-e) Acyl amino acid inhibition of glycine transport currents of Y550L mutant transporters. Glycine transport currents were measured in the presence of lipids to generate concentration inhibition curves for (d) OLLys (□), ODLys ( ), OLTrp (◊), (e). OLSer (◯), and OLAsp (∇). GlyT2 WT is shown in black, Y550L is in blue.
Figure 4
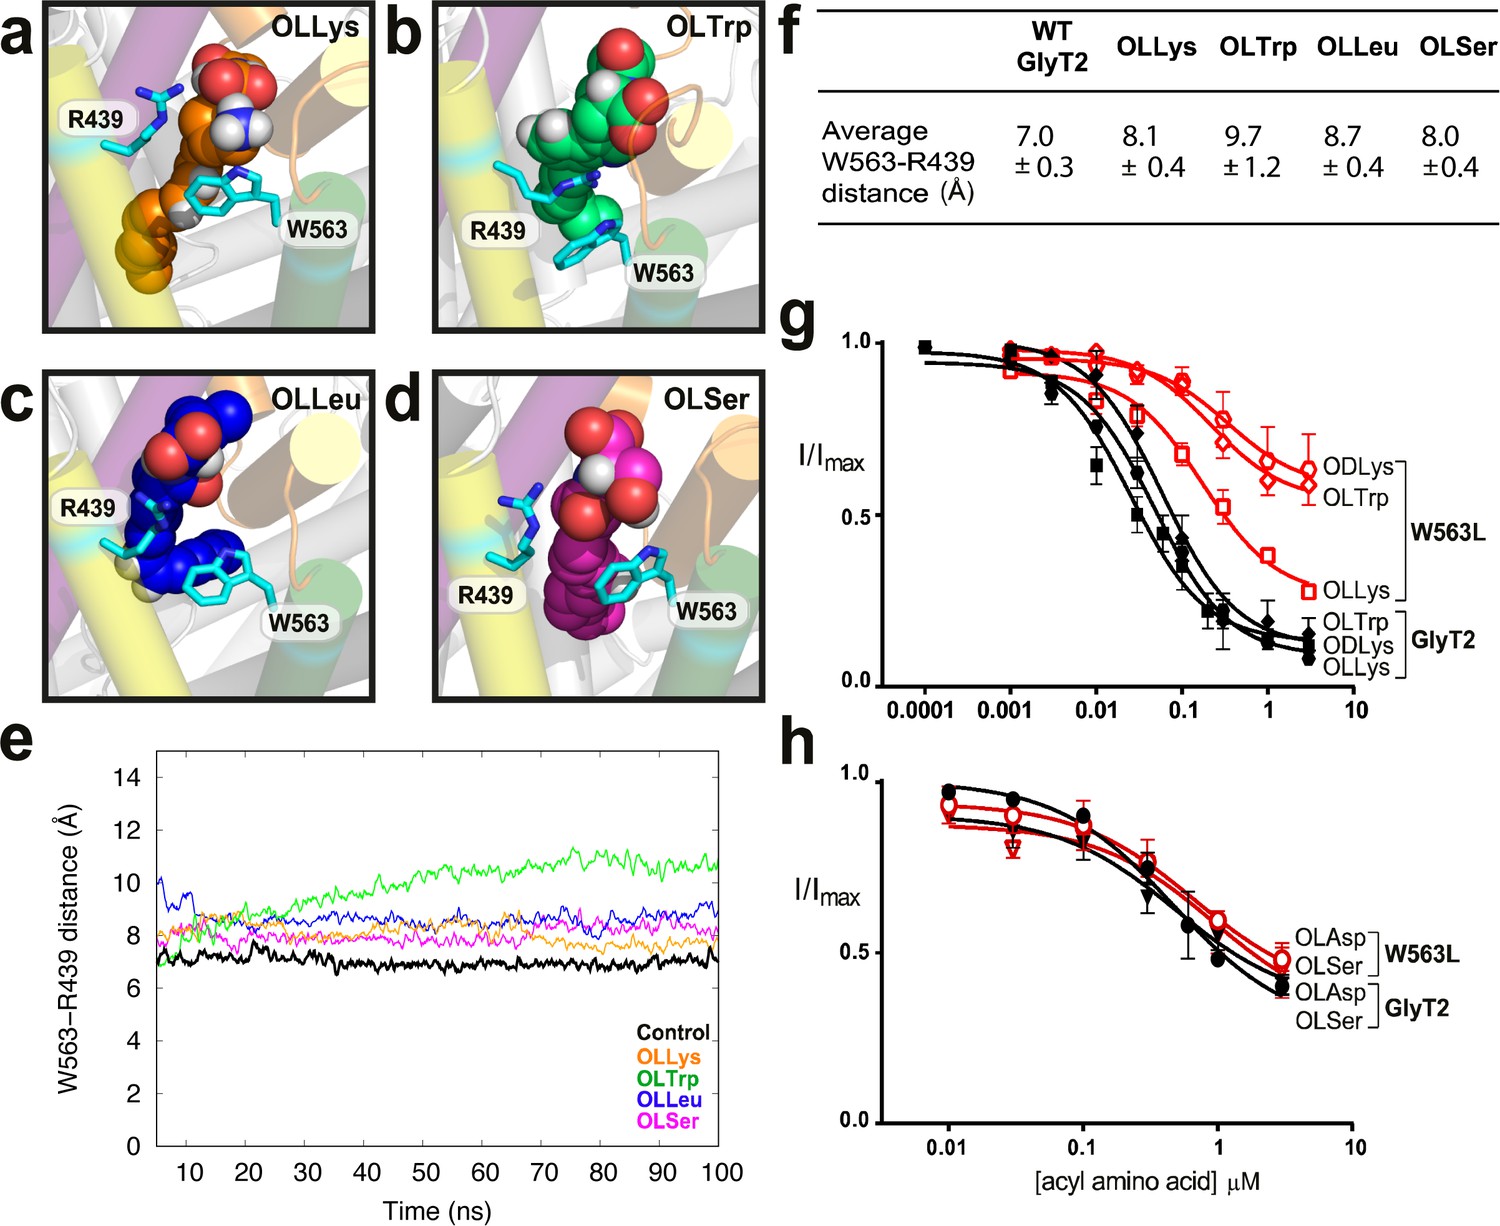
W563 and R439 act as ‘gates’ to stabilise the acyl amino acids in their binding cavity.
(a-d) Snapshots of interactions between bioactive lipids (spheres) and W563 and R439 (cyan sticks) during the simulation. GlyT2 helices are coloured EL4 (orange), TM5 (yellow), TM7 (purple), and TM8 (green). (e) The distance between the centre of mass of W563 and R439 over 100 ns when inhibitors were bound. The control (no inhibitor) is included in black. (f) Average distances throughout the simulations. (g–h). Acyl amino acid inhibition of glycine transport currents of W563L mutant transporters. Glycine transport currents were measured in the presence of lipids to generate concentration inhibition curves for (g) OLLys (□), ODLys ( ), OLTrp (◊), (h). OLSer (◯), and OLAsp (∇). GlyT2 WT is shown in black, W563L is in red.
Figure 5
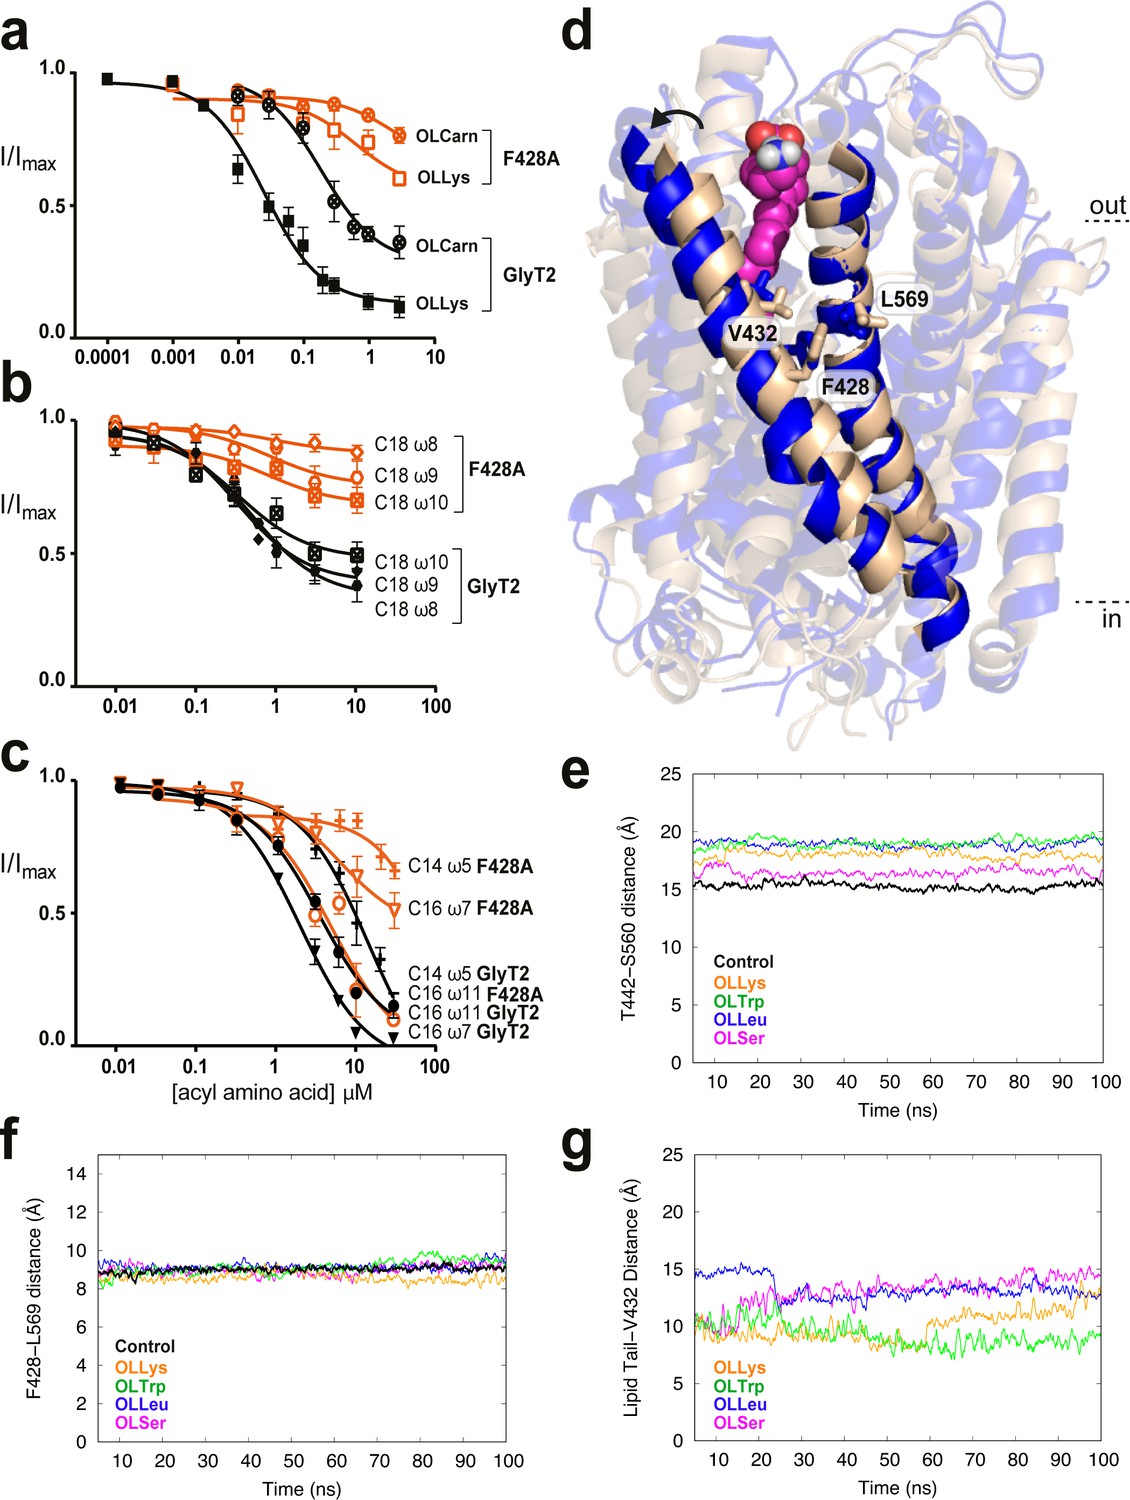
Residues in TM5 and TM8 mediate inter-helical contacts and shape the acyl tail binding cavity.
(a-c) Acyl amino acids inhibit glycine transport currents of F428A mutant GlyT2 transporters. Glycine transport currents were measured in the presence of lipids to generate concentration inhibition curves for (a). OLCarn (⊗),oleoyl l-Lys (□), (b) NOGly ( ), C18 ω8 Gly (◊), C18 ω10 Gly (⊠), (c) C16 ω7 Gly (∇), C16 ω11 Gly (◯) and C14 ω5 Gly (+). GlyT2 WT is shown in black and F428A is in orange. (d) Overlay of GlyT2 in the absence of inhibitor (wheat helices) with OLLys (magenta spheres) bound at 100 ns (blue helices). TM8 regions were aligned to show the relative movement of TM5. (e) Distances between the extracellular edges of TM5 (T442) and TM8 (S560) calculated from their Cα. (f) Distances between the middle of TM5 (F428) and TM8 (L569) calculated from their Cα. (g) Distances between the last carbon of the lipid inhibitor tail and the bottom of the extracellular allosteric pocket (Cα of V432).
Figure 6
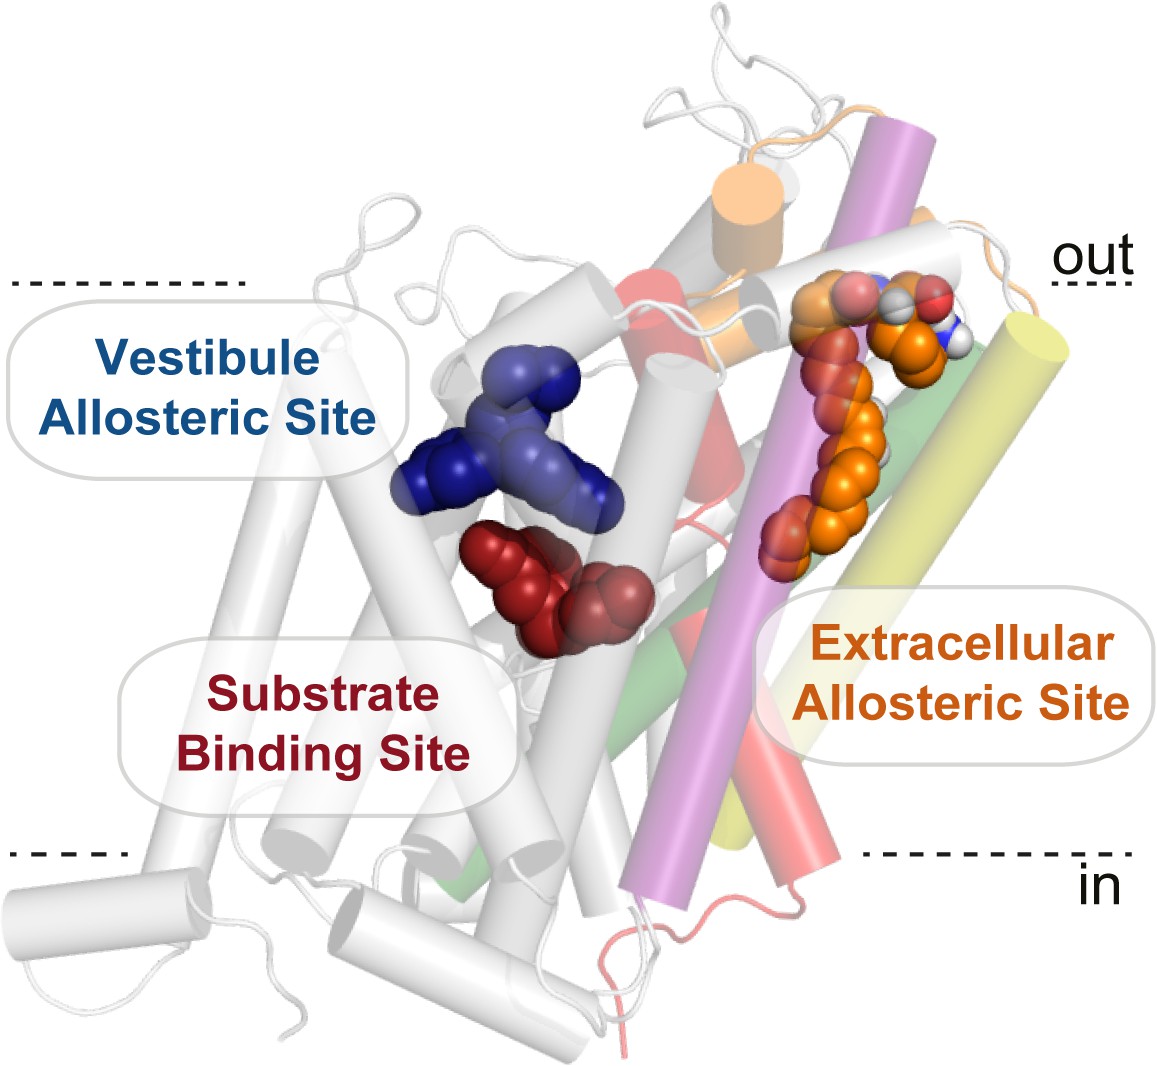
Bioactive lipid inhibitors bind to GlyT2 at an extracellular allosteric site, separate from the ‘classical’ central substrate and vestibule allosteric binding sites.
OLLys (orange spheres) is bound to GlyT2 (100 ns). The binding location of s-citalopram at the substrate (maroon spheres) and vestibule allosteric (blue spheres) sites is superimposed from the serotonin transporter structure (PDB: 5173). GlyT2 is shown as transparent cartoon, with selected regions coloured: TM1 (red), TM5 (yellow), TM7 (purple), TM8 (green), and EL4 (orange).
Videos
Video 1
OLSer binding to WT GlyT2.
https://doi.org/10.7554/eLife.47150.014
Video 2
OLSer binding to I545L GlyT2.
https://doi.org/10.7554/eLife.47150.015Tables
Key resources table
| Reagent type (species) or resource | Designation | Source or reference | Identifiers | Additional information |
|---|---|---|---|---|
| Gene (human) | GlyT2a WT | UniProtKB - Q9Y345 SLC6A5 | Morrow et al., 1998 | |
| Gene (human) | GlyT21b WT | UniProtKB - P48067 SLC6A9 | ||
| Biological sample (female Xenopus laevis) | Oocytes | Nasco, Wisconsin, USA | RRID:XEP_Xla100 | |
| Recombinant DNA reagent | pOTV | Krieg PA, Melton DA (1984) Functional messenger RNAs are produced by SP6 in vitro transcription of cloned cDNAs. Nucleic Acids Res 12:7057–7070 | ||
| Sequence-based reagent | Oligonucleotide primers | Sigma Aldrich (Sydney, Australia) | Primer designs were generated using https://nebasechanger.neb.com/ | |
| Commercial assay or kit | Q5 site-directed mutagenesis kit | New England Biolabs (Genesearch), Arundel, Australia | NEB.E0552S: | |
| Commercial assay or kit | mMessagemMachine T7 RNA polymerase | Ambion (Texas, USA) | AM1344 | |
| Commercial assay or kit | GeneJet Plasmid Mini Prep Kit | Thermo Fisher Scientific | K0503 | |
| Chemical compound, drug | N-arachidonyl glycine | Sapphire Biosciences | 90051 | |
| Chemical compound, drug | N-oleoyl glycine | Sapphire Biosciences | 90269 | |
| Chemical compounds, drugs | acyl-amino acids | Mostyn et al., 2019 | ||
| Chemical compound, drug | Oleoyl L-carnitine | Larodan | 17–1810 | |
| Chemical compound, drug | Colleganse A | Sigma Aldrich (Sydney, Australia) | 11088793001 | |
| Chemical compound, drug | Sodium bicarbonate | Sigma Aldrich (Sydney, Australia) | S5761-500G | |
| Chemical compound, drug | Tricaine | Sigma Aldrich (Sydney, Australia) | A5040-100G | |
| Chemical compound, drug | Sodium Pyruvate | Sigma Aldrich (Sydney, Australia) | P2256-25G | |
| Chemical compound, drug | Theophylline | Sigma Aldrich (Sydney, Australia) | T1633-50G | |
| Chemical compound, drug | Ampicillin | Astral Scientific | BIOAB0028-20g | |
| Chemical compound, drug | Gentamycin | Sigma Aldrich (Sydney, Australia) | G1272-10ML | |
| Chemical compound, drug | Tetracycline hydrochloride | Sigma Aldrich (Sydney, Australia) | T7660-25G | |
| Chemical compound, drug | Glycine | Sigma | 410225–50G | |
| Software, algorithm | Labchart | ADInstruments, Sydney, Australia | ||
| Software, algorithm | Pymol | Schrodinger LLC | ||
| Software, algorithm | GraphPad Prism 7 | GraphPad Software, San Diego, CA | ||
| Software, algorithm | Gromacs 2016.1 | DOI: 10.1016/j.softx.2015.06.001 | ||
| Software, algorithm | visual molecular dynamics | DOI: 10.1016/0263-7855(96)00018-5 | ||
| Software, algorithm | Autodock vina | DOI: 10.1002/jcc.21334 | ||
| Software, algorithm | gnuplot | DOI: 10.1002/jae.885 | ||
| Other | Drummond Nanoinject | Drummond Scientific Co., Broomall, PA, USA | ||
| Other | Powerlab 2/20 chart recorder | ADInstruments, Sydney, Australia | ||
| Other | Geneclamp 500 amplifier | Axon Instruments, Foster City, CA, USA |
Additional files
-
Supplementary file 1
IC50 values and % max. inhibition for mutant glycine transporters.
- https://doi.org/10.7554/eLife.47150.020
-
Supplementary file 2
Summary of acyl amino acids, their activity on WT transporters, and their effects in MD simulations and electrophysiological recordings of mutant transporters.
- https://doi.org/10.7554/eLife.47150.021
-
Supplementary file 3
EC50 values for glycine transport of WT and mutant GlyT2 and GlyT1 transporters.
- https://doi.org/10.7554/eLife.47150.022
-
Supplementary file 4
Percentage of the total simulation time in which residues are in contact with the lipid inhibitors.
- https://doi.org/10.7554/eLife.47150.023
-
Transparent reporting form
- https://doi.org/10.7554/eLife.47150.024
Download links
A two-part list of links to download the article, or parts of the article, in various formats.
Downloads (link to download the article as PDF)
Open citations (links to open the citations from this article in various online reference manager services)
Cite this article (links to download the citations from this article in formats compatible with various reference manager tools)
Identification of an allosteric binding site on the human glycine transporter, GlyT2, for bioactive lipid analgesics
eLife 8:e47150.
https://doi.org/10.7554/eLife.47150


