Cooperation between tropomyosin and α-actinin inhibits fimbrin association with actin filament networks in fission yeast
- The University of Chicago, United States
Figures
Figure 1 with 3 supplements

Fimbrin Fim1 and α-actinin Ain1 compete for association with the contractile ring.
(A) Fluorescence micrographs of fission yeast cells expressing Lifeact-GFP following treatment with DMSO (control, top) or 200 µM Arp2/3 complex inhibitor CK-666 (bottom). Scale bar, 5 μm. (B-D, top panels) Fluorescence micrographs of fission yeast cells expressing Fim1-GFP (B), Ain1-GFP (C), or Ain1-GFP in a fim1-1Δ background (D), following treatment with DMSO (left) or 200 µM CK-666 (right). Dotted lines outline cells. Yellow dotted line denotes representative region used to quantify fluorescence value in cells lacking a visible contractile ring. Scale bars, 5 μm. (B-D, bottom panels) Mean Fim1-GFP (B) or Ain1-GFP (C,D) fluorescence at the contractile ring normalized to whole cell fluorescence. Error bars = s.d. Filled circles indicate means of experimental replicates. n ≥ 18 cells from three independent experiments. Two-tailed t-tests for data sets with unequal variance yielded p-values *p=8.57×10⁻²⁰, **p=1.75×10⁻⁶, ***p=0.81.
Figure 1—figure supplement 1
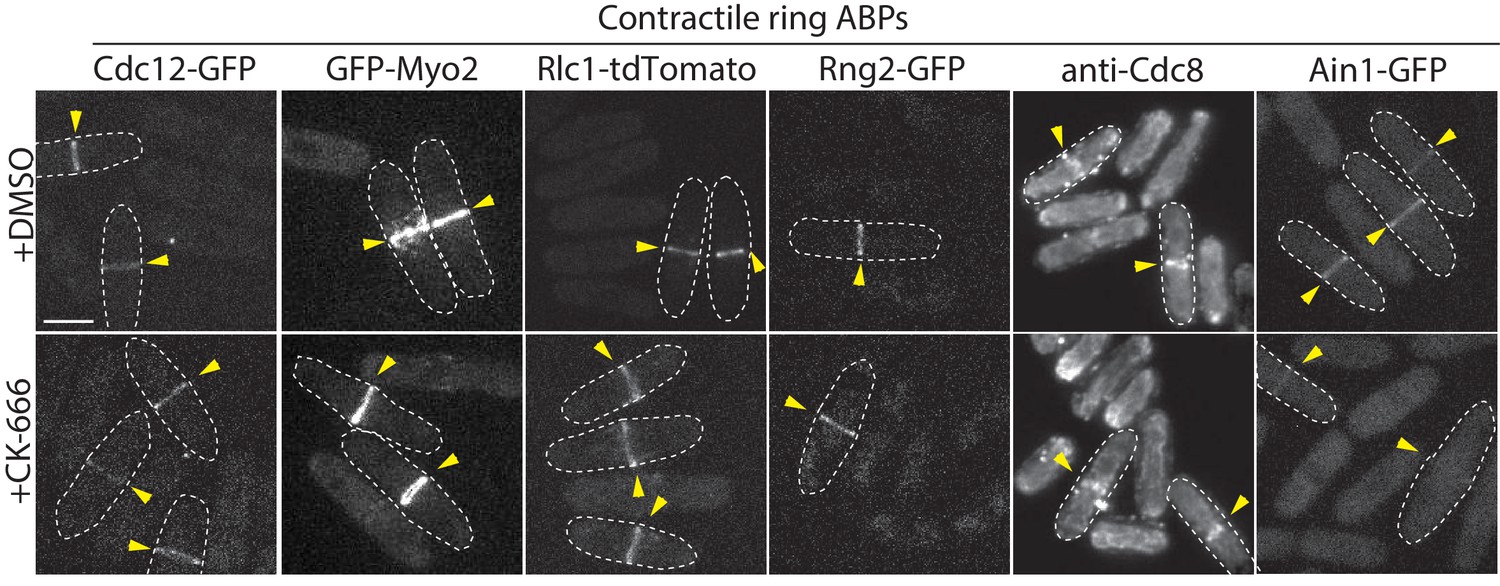
Contractile ring ABP localization following CK-666 treatment.
Fluorescent micrographs of fission yeast cells either immunostained (anti-Cdc8) or expressing the indicated fluorescently tagged contractile ring ABPs from their endogenous locus: formin Cdc12-GFP, type-II myosin motor GFP-Myo2, myosin regulatory light chain Rlc1-tdTomato, IQGAP Rng2-GFP, and α-actinin Ain1-GFP. Cells were treated with DMSO (control) or 200 µM Arp2/3 complex inhibitor CK-666. Yellow arrowheads denote contractile rings. Dotted lines outline individual cells for clarity. Scale bar, 5 μm.
Figure 1—figure supplement 2
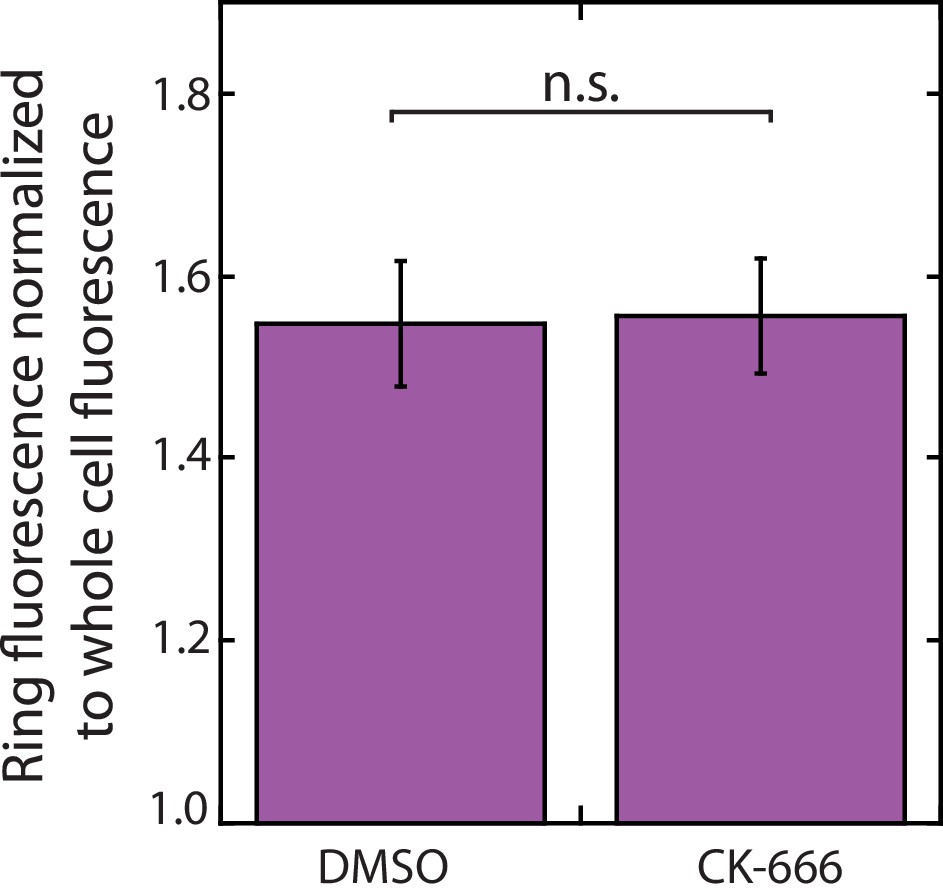
Tropomyosin Cdc8 does not leave the contractile ring following CK-666 treatment.
Mean anti-Cdc8 contractile ring fluorescence normalized to total cell fluorescence. Error bars = s.e. Two-tailed t-test for data sets with unequal variance yielded p-value=0.9338. n ≥ 10 cells.
Figure 1—figure supplement 3

Fimbrin Fim1 displaces α-actinin Ain1 from the contractile ring following CK-666 treatment.
(A-C, top) Fluorescent micrographs of fission yeast cells expressing spindle pole body marker Sad1-tdTomato and Fim1-GFP (A), Ain1-GFP (B), or Ain1-GFP in a fim1-1Δ background (C), following treatment with DMSO (control, top) or 200 µM Arp2/3 complex inhibitor CK-666 (bottom). Lines outline cells. Scale bar, 5 μm. (A-C, bottom) Mean Fim1-GFP (A) or Ain1-GFP (B–C) contractile ring fluorescence normalized to whole cell fluorescence for cells in stage 1 (contractile ring formation), stage 2 (contractile ring dwell), or stage 3 (contractile ring constriction) of cytokinesis following treatment with DMSO (control) or 200 µM CK-666. Error bars = s.d. Two-tailed t-test for data sets with unequal variance yielded p-values *p=0.024, **p=0.034, ***p=0.13, #p=0.38, ##p=0.094, ###p=0.061,+p = 0.53,++p = 0.87, and +++p = 0.55.
Figure 2 with 2 supplements

Fimbrin Fim1 and α-actinin Ain1 compete for association with actin patches.
(A–B) Time-lapse fluorescent micrographs of fission yeast cells expressing ArpC5-mCherry (bottom) and overexpressing GFP-tagged α-actinin Ain1 from the 41Xnmt promoter (top) for 20 hr in a wild-type (A) or fim1-1Δ background (B). Yellow box highlights Ain1-GFP localization at actin patches. Scale bars, 5 μm. Time in s. (C) Percentage of cells in which Ain1-GFP is observed in actin patches. Error bars = s.e. Two-tailed t-tests for data sets with unequal variance yielded p-values+p = 0.113,++p = 0.002,+++p = 0.012. n = 3 experimental replicates.
Figure 2—figure supplement 1
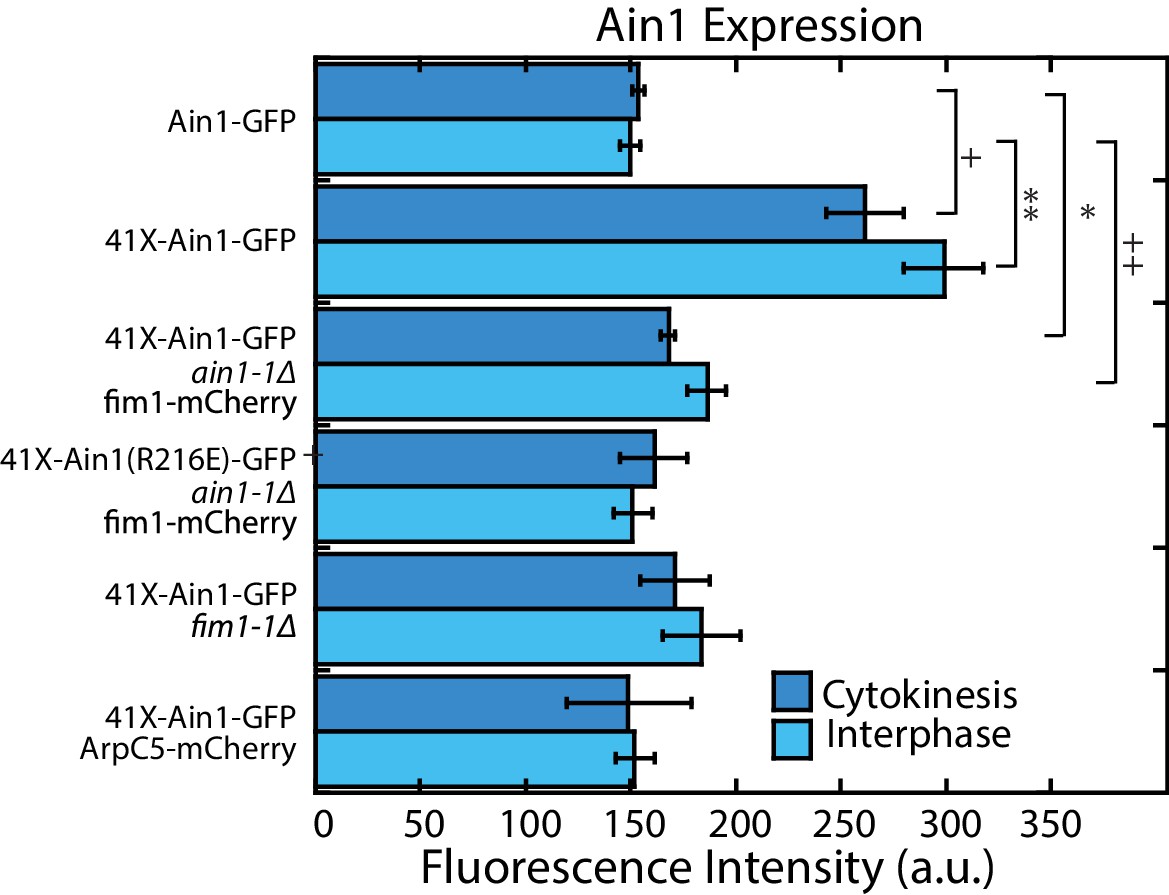
Cellular expression of GFP-tagged α-actinin Ain1 constructs.
Fluorescence intensity of GFP-tagged Ain1 constructs for cells in cytokinesis (with contractile ring) or interphase (no contractile ring). Error bars = s.e. A single factor ANOVA yielded p-values of. 0052 and 2.02 × 10⁻⁵ for cytokinesis and interphase, respectively. Pairwise two-tailed t-tests for data sets with unequal variance were conducted to determine which strain(s) contributed to the significant ANOVA results, where each strain was compared to the Ain1-GFP control. The two-tailed t-tests resulted in significant p-values of *p=0.029, **p=0.017,+p = 0.029, and ++p = 0.039. n = 3 experimental replicates of >50 cells each.
Figure 2—video 1
Overexpressed α-actinin Ain1-GFP localizes to actin patches in the absence of fimbrin, related to Figure 1.
Fission yeast cells expressing actin patch marker ArpC5-mCherry (right) with Ain1-GFP (left) at endogenous or overexpressed levels. (Top panels) Endogenous Ain1-GFP in a fim1-1Δ background. (Middle panels) Ain1-GFP overexpressed under the 41xnmt promoter in a fim1-1Δ background. (Bottom panels) Ain1-GFP overexpressed under the 41xnmt promoter in a wild-type background (bottom). Yellow arrowheads indicate cell ends with Ain1-GFP in actin patches. Scale bar, 5 μm. Time in s.
Figure 3
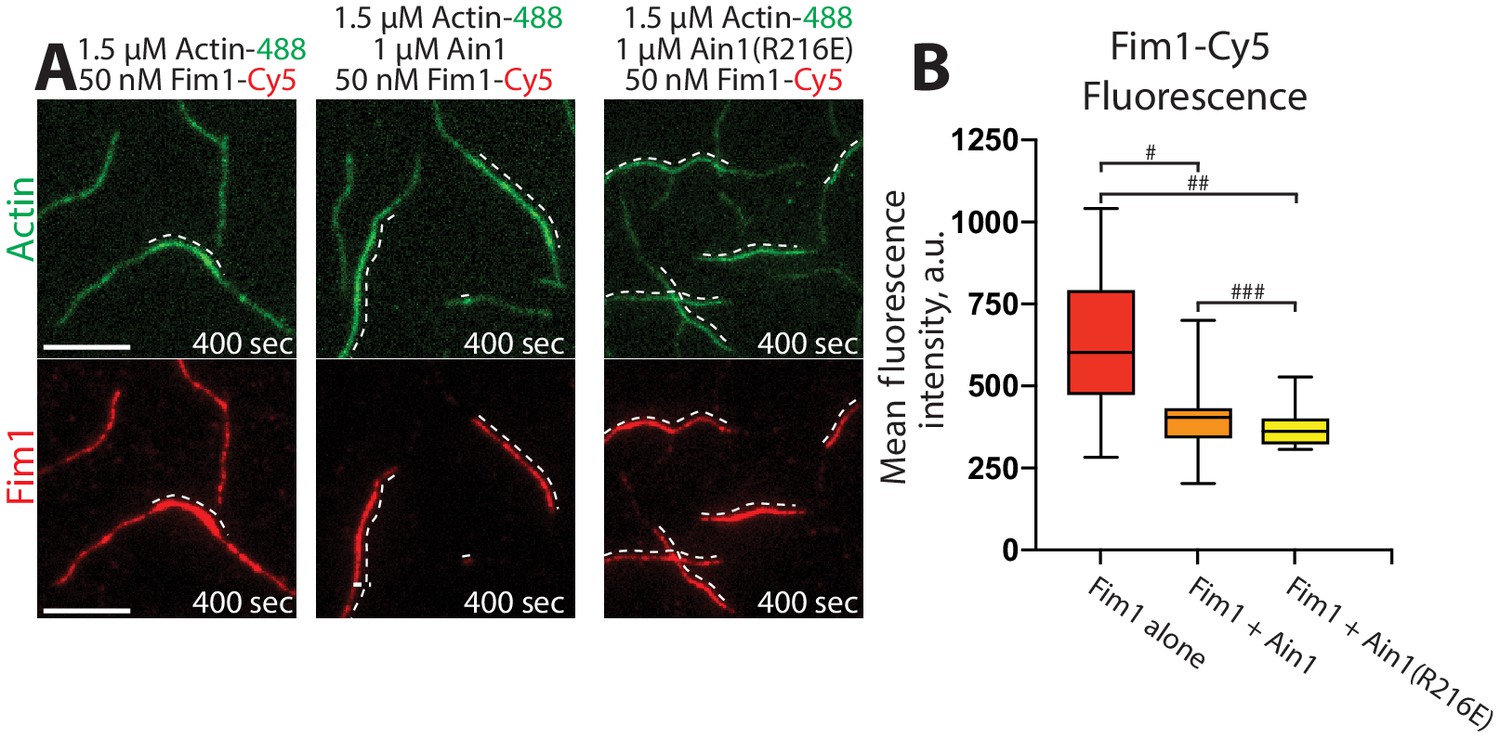
Fimbrin Fim1 and α-actinin Ain1 compete for F-actin binding F-actin in vitro.
(A–B) Two-color TIRFM of 1.5 μM Mg-ATP actin (15% Alexa 488-labeled) with 50 nM fimbrin Fim1 (Cy5-labeled) alone, or with either 1 μM wild-type α-actinin Ain1 or mutant Ain1(R216E). Scale bars, 5 μm. Dotted lines denote bundled regions. (B) Box plots of the amount of Fim1-Cy5 fluorescence on two-filament bundles in either the absence (red) or presence of Ain1 (orange) or Ain1(R216E) (yellow). Error bars = s.e. Two-tailed t-tests for data sets with unequal variance yielded p-values #p=3.90×10⁻⁴, ##p=1.97×10⁻⁵, and ###p=0.18. Two independent experiments were performed for each condition. In total, n ≥ 16 two-filament bundle measurements were taken for each condition.
Figure 4 with 1 supplement
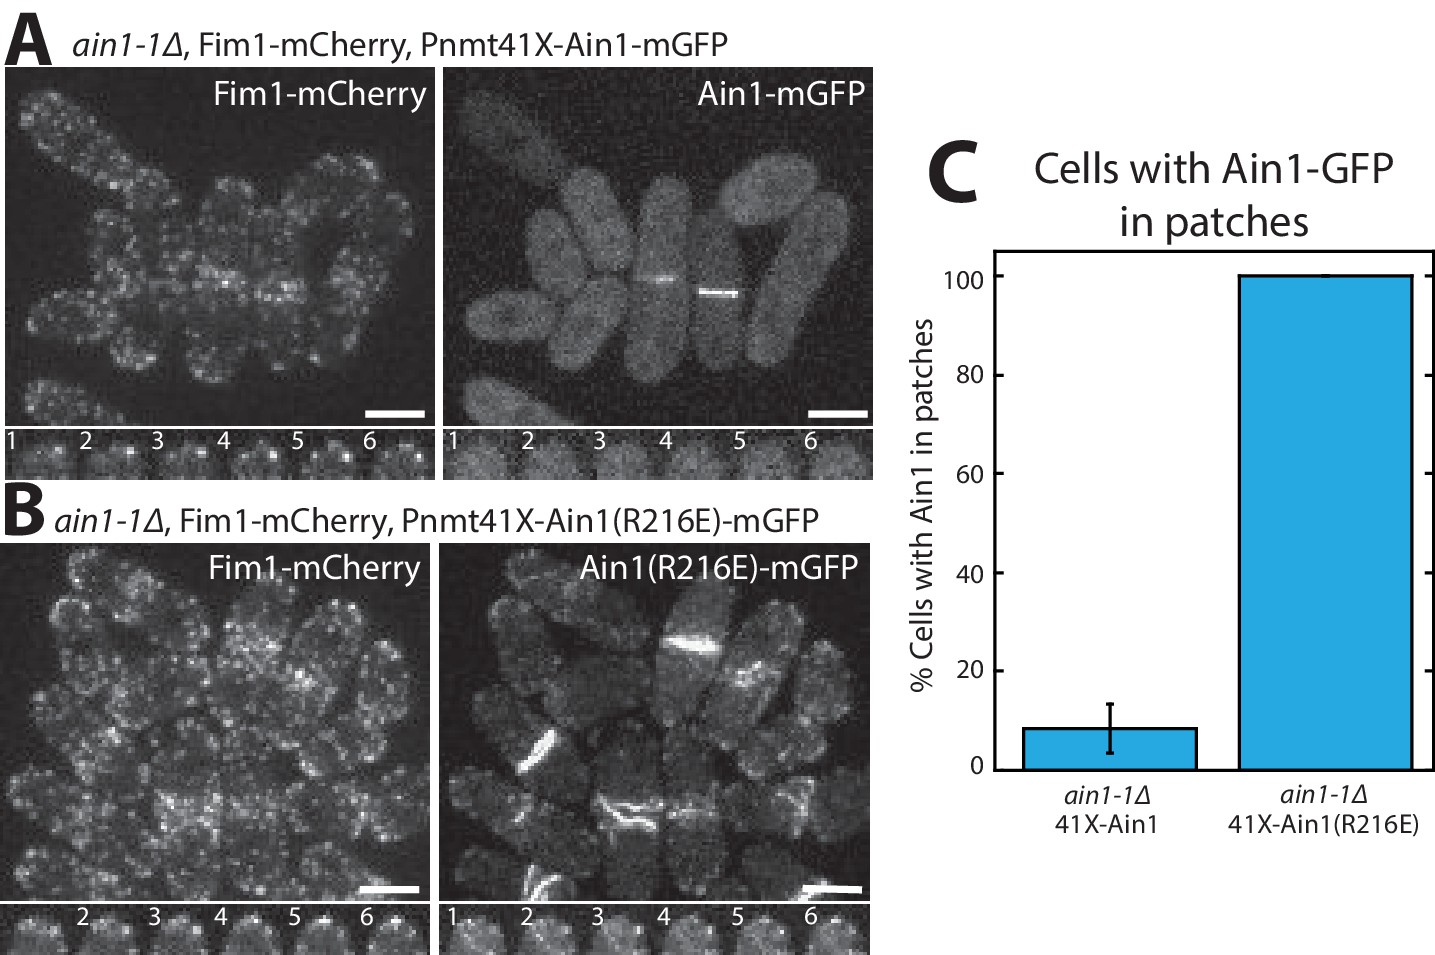
Fimbrin Fim1 and α-actinin Ain1 competition at actin patches is driven by their residence time on F-actin.
(A,B, top) Fluorescence micrographs of fission yeast in an ain1-1Δ background overexpressing GFP-tagged wild-type Ain1 (A) or mutant Ain1(R216E) (B) from the 41Xnmt1 promoter. Scale bars, 5 μm. (A,B, bottom) Timelapse (in s) of cell taken from a single Z-plane. (C) Percentage of cells in which Ain1-GFP is observed in actin patches. Error bar, s.e. Two-tailed t-test for data sets with unequal variance yielded p-value=0.0029.
Figure 4—video 1
Overexpressed mutant α-actinin Ain1(R216E)-GFP, but not Ain1-GFP, localizes to actin patches in the presence of fimbrin Fim1, related to Figure 4.
(Top) Fission yeast cells with Ain1-GFP overexpressed under the 41xnmt promoter (left) and expressing Fim1-mCherry at the endogenous locus (right). (Bottom) Fission yeast cells with Ain1(R216E)-GFP overexpressed under the 41xnmt promoter and expressing Fim1-mCherry at the endogenous locus. Scale bar, 5 μm. Time in s.
Figure 5 with 1 supplement
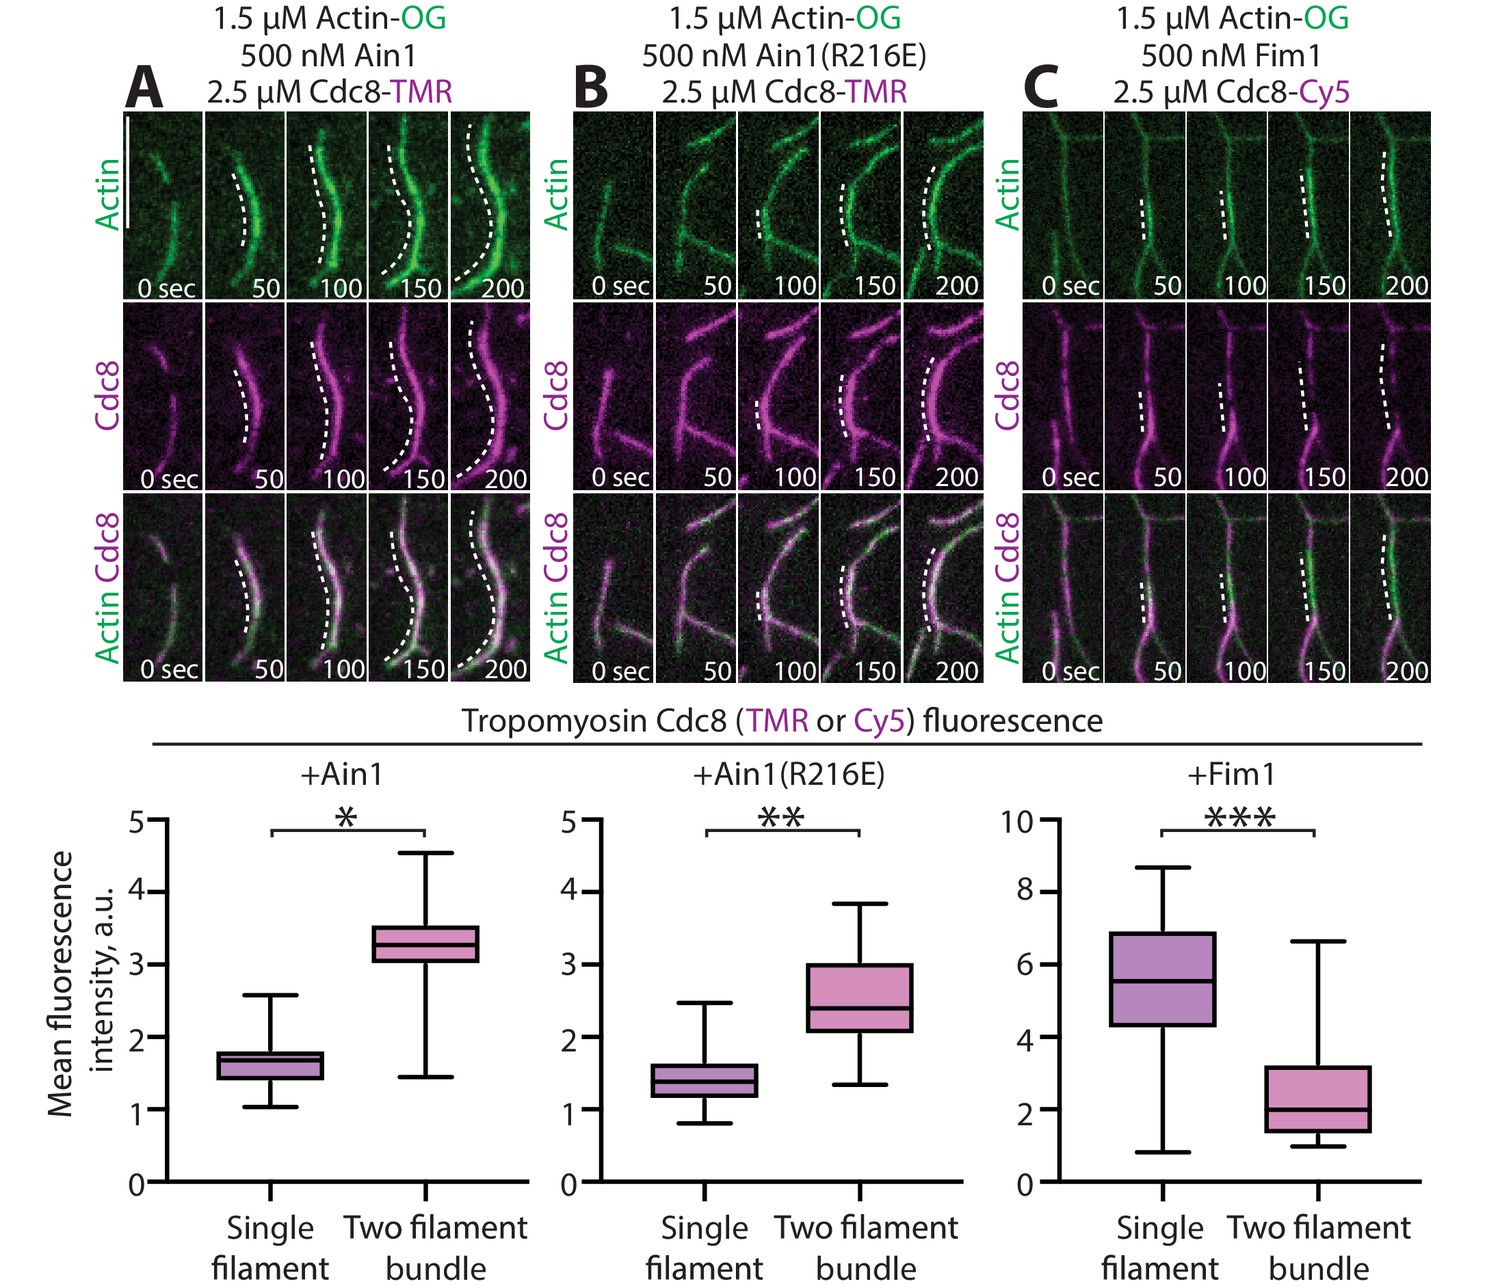
α-actinin Ain1 does not displace tropomyosin Cdc8 from F-actin bundles in vitro.
(A-C, top) Two-color TIRFM of 1.5 μM Mg-ATP actin (15% Alexa 488-labeled) with 2.5 µM tropomyosin Cdc8 (TMR-labeled) and unlabeled 500 nM (A) wild-type α-actinin Ain1, (B) mutant Ain1(R216E), or (C) fimbrin Fim1. Scale bar, 1 μm. Dotted lines denote bundled regions. (A-C, bottom) Dot plots of the amount of Cdc8-TMR or Cdc8-Cy5 fluorescence on single filaments or two-filament bundles in the presence of Ain1 (A), Ain1(R216E) (B) or Fim1 (C). Error bars = s.e. Two-tailed t-tests for data sets with unequal variance yielded p-values *p=8.24×10⁻¹⁸, **p=5.47×10⁻¹², ***p=5.72×10⁻¹¹.
Figure 5—video 1
α-actinin Ain1 does not displace tropomyosin Cdc8 from F-actin bundles, related to Figure 5.
TIRFM of 1.5 μM actin (Alexa-488 labeled) (left column) with 2.5 μM tropomyosin Cdc8 (TMR- or Cy5-labeled) (middle column) and 500 nM Ain1 (top row), 500 nM Ain1(R216E) (middle row), or 500 nM Fim1 (bottom row). Scale bar, 5 μm. Time in s.
Figure 6 with 1 supplement
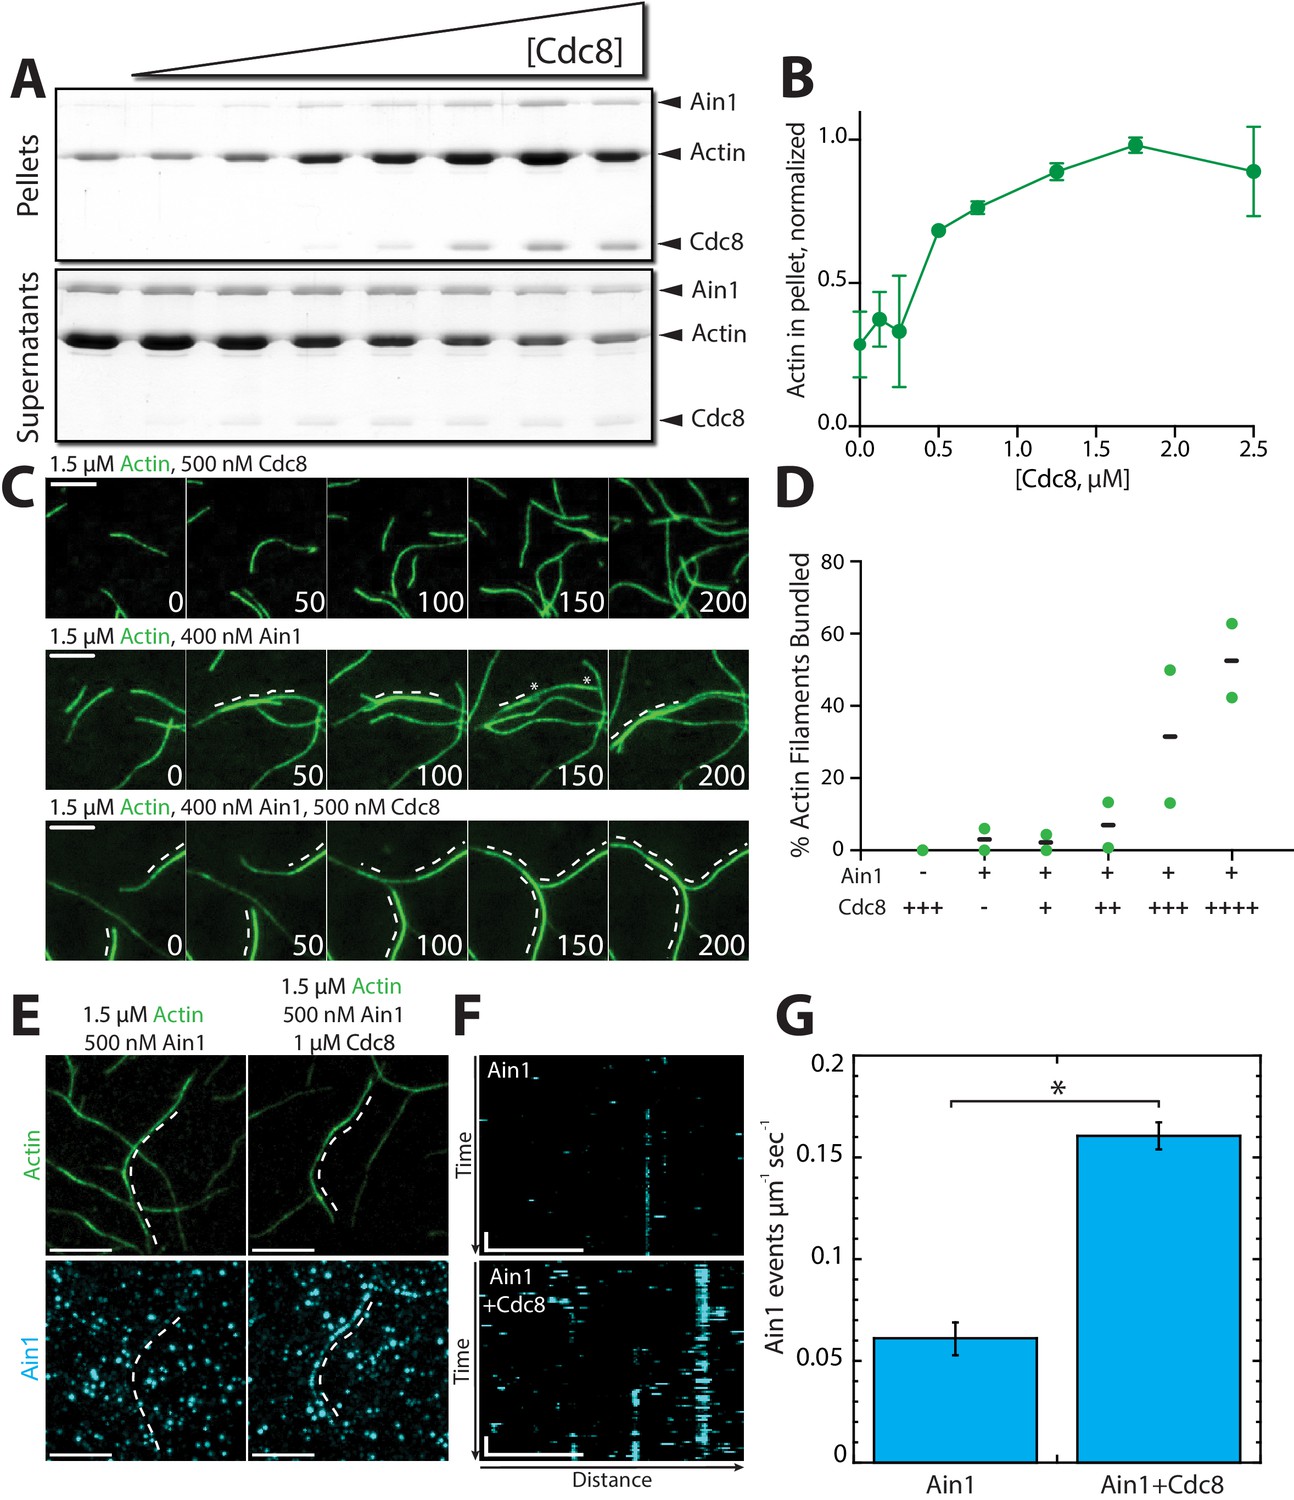
Tropomyosin Cdc8 enhances α-actinin Ain1-mediated F-actin bundling in vitro.
(A–B) Low-speed (10,000 x g) sedimentation assays of 5 µM Mg-ATP preassembled actin filaments, 500 nM Ain1, and increasing concentrations of Cdc8 (0–5 µM). (A) Coomassie blue-stained gel of pellets and supernatants from a representative experiment. (B) Quantification of actin extracted from the pellet as a function of Cdc8 concentration. Error bars = s.d, n = 2. (C-D) TIRFM of 1.5 μM Mg-ATP actin (15% Alexa 488-labeled) in the presence of 500 nM Cdc8 (C, top), 400 nM Ain1 (C, middle) or both (C, bottom). Dotted lines indicate the bundled region. Scale bars, 5 μm. (D) Quantification of the percent of bundled F-actin with 500 nM Cdc8 alone, 400 nM Ain1 alone, or 400 nM Ain1 with 50 nM, 125 nM, 250 nM or 500 nM Cdc8. Black lines indicate averages and green circles indicate values from independent TIRFM experiments. n = 2 independent experiments for each condition. (E-G) Spot density TIRFM experiments of 1.5 μM Mg-ATP actin (15% Alexa 488-labeled) and 500 nM Ain1 (0.5% TMR-labeled) alone or with 1 μM unlabeled Cdc8. (E, top) Representative images of Alexa-488-labeled F-actin bundles. (E, bottom) Representative max projection of all Ain1 spots on corresponding F-actin bundles. Scale bars, 5 μm. (F) Kymographs of the indicated bundle from (E) over time. Scale bar, 5 μm. Time bar, 11 s. (G) Ain1 spot density (Ain1 events/µm/s). Two-tailed t-tests for data sets with unequal variance yielded p-value *p=0.026. Error bars = s.e. n = 2 independent experiments.
Figure 6—video 1
Tropomyosin Cdc8 enhances α-actinin Ain1-mediated bundling, related to Figure 6.
TIRFM of 1.5 μM actin (Alexa-488 labeled) with the indicated varying concentrations of unlabeled Ain1 and Cdc8. Scale bar, 5 μm. Time in s.
Figure 7

α-actinin Ain1 facilitates the association of tropomyosin Cdc8 with bundled F-actin in the presence of fimbrin Fim1 in vitro.
(A,B) Low-speed sedimentation comparing Cdc8 in the pellet with F-actin bundled by Fim1 (left), Ain1 (middle), or both (right). (A) Coomassie blue-stained gel of representative triplicate samples of 3 µM Mg-ATP pre-assembled actin filaments incubated and centrifuged with fixed concentrations of Cdc8 (5 µM), Fim1 (0.5 µM), and Ain1 (5 µM). (B) Fold change of Cdc8 in the pellet from conditions presented in (A). Error bars = s.e, n = 3. Filled shapes indicate individual values from each of three replicates as seen in (A). Two-tailed t-tests for data sets with unequal variance yielded p-values *p=0.0450, **p=0.629, ***p=0.0348.
Figure 8 with 1 supplement
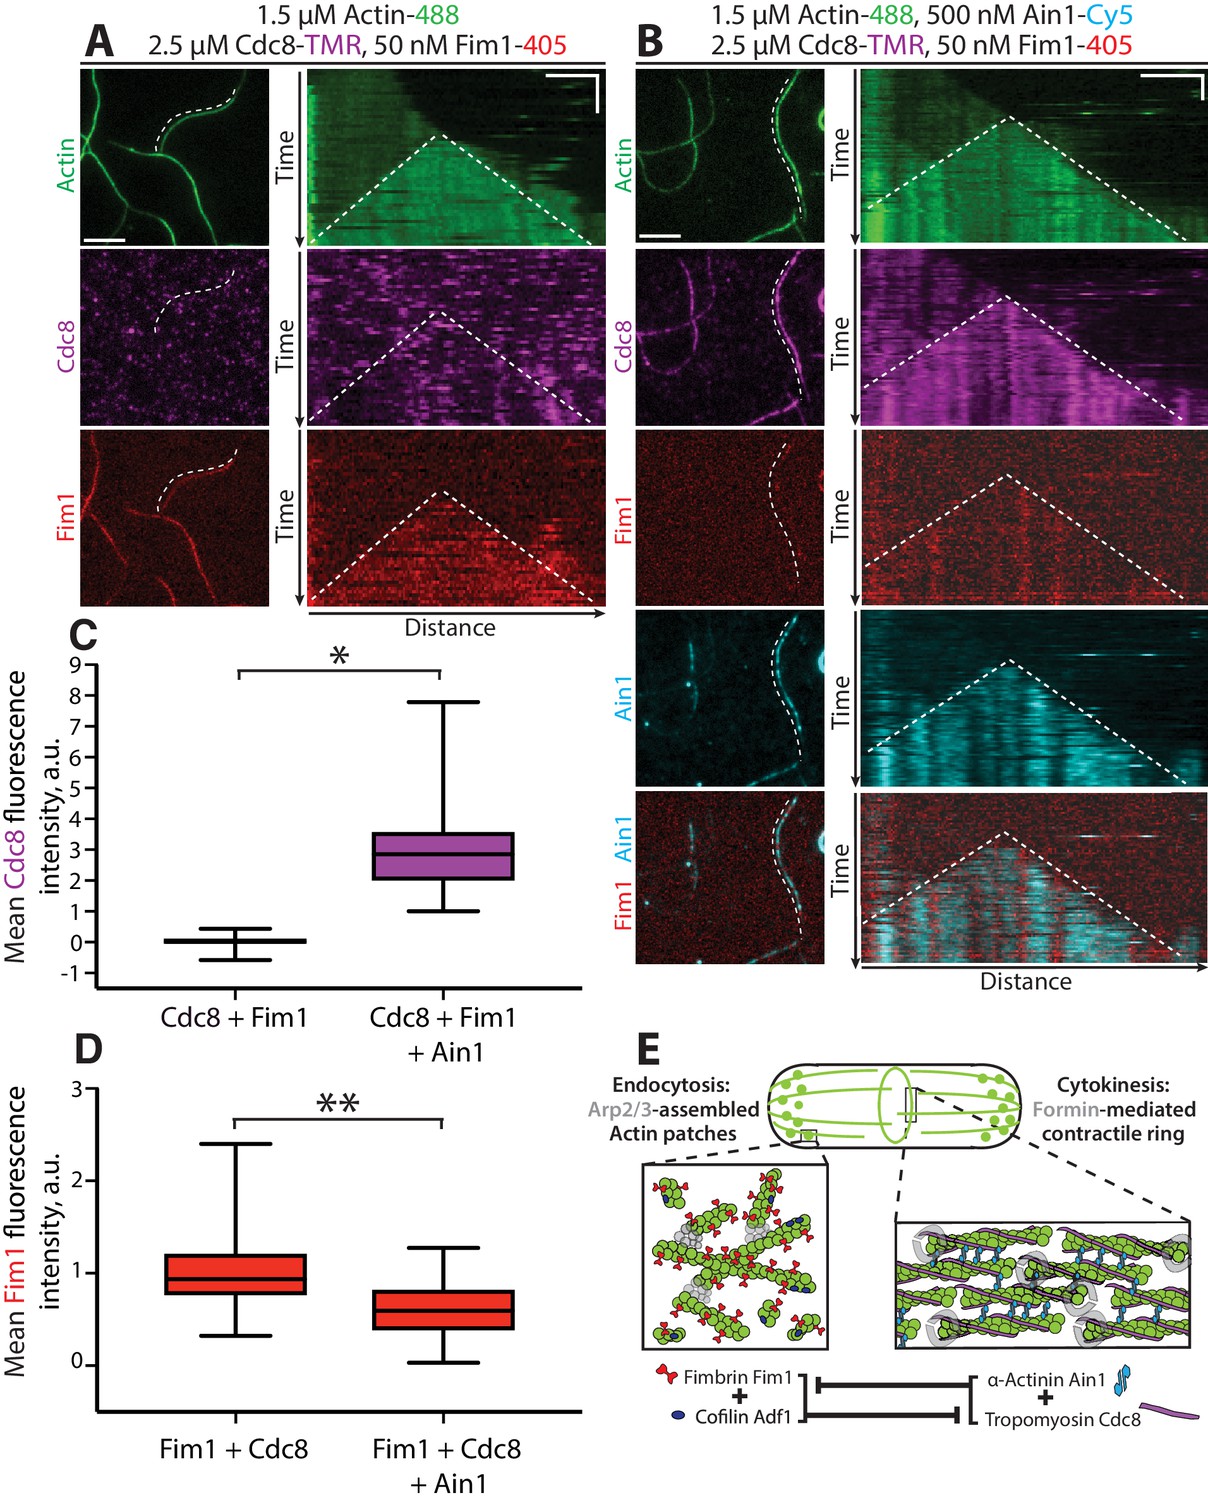
Tropomyosin Cdc8 and α-actinin Ain1 cooperate to compete with fimbrin Fim1 for association with F-actin in vitro.
(A–D) Four-color TIRFM of 1.5 μM Mg-ATP actin (15% Alexa 488-labeled) with 50 nM fimbrin Fim1 (Alexa 405-labeled) and 2.5 μM tropomyosin Cdc8 (TMR-labeled) in the (A) absence or (B) presence of 500 nM α-actinin Ain1 (Cy5-labeled). (A-B, left) Representative TIRF field. Dotted lines denote bundled regions. Scale bar, 5 μm. (A-B, right) Kymographs of actin, Fim1, and Cdc8 during bundle formation. Dotted lines denote bundled regions. Scale bars, 3 μm. Time bar, 1 min. (C–D) Box plots of the amount of Cdc8-TMR (C) or Fim1-Cy5 fluorescence (D) on two-filament bundles in experiments with Cdc8 and Fim1, or Cdc8, Fim1 and Ain1. Two-tailed t-tests for data sets with unequal variance yielded p-values *p=3.88×10⁻¹⁶ and **p=7.09×10⁻⁷. n ≥ 30 measurements from two independent experiments. (E) Model of the involvement of ABP competition in ABP sorting in the fission yeast cell. In endocytic actin patches, fimbrin Fim1 and cofilin Adf1 enhance each other’s activities, resulting in the displacement of tropomyosin Cdc8 from the F-actin network (Christensen et al., 2017). In the contractile ring, α-actinin Ain1 and tropomyosin Cdc8 work together to prevent fimbrin Fim1 association with the F-actin network.
Figure 8—video 1
Tropomyosin Cdc8 and α-actinin Ain1 cooperate to compete with fimbrin Fim1 for bundling F-actin, related to Figure 5.
Four-color TIRFM of 1.5 μM actin (Alexa-488 labeled), 2.5 μM tropomyosin Cdc8 (TMR-labeled) and 50 nM fimbrin Fim1 (Alexa 405-labeled) with (bottom) or without (top) 500 nM Ain1 (Cy5-labeled). Scale bars, 5 μm. Time in s.
Tables
Table 1
Fission yeast strains used in this study.
https://doi.org/10.7554/eLife.47279.018| Strain name | Genotype | Reference |
|---|---|---|
| KV91 | h+, kanMX6::myo2p::gfp-myo2p+, ade6-M210, leu1-32, ura4-D18 | Wu et al., 2003 |
| KV343 | h?, cdc12-mGFP::KanR | This study |
| KV459 | h+, rlc1-tdTomato-natMX6 ade6-M210 leu1-32 ura4-D18 | This study |
| KV579 | h-, ain1-GFP-KanMX6, URA+ | Wu et al., 2001 |
| KV588 | h+, pAct1 Lifeact-GFP::Leu+; ade6-m216; leu1-32; ura4-D18 | Huang et al., 2012 |
| Laporte et al., 2011 KV707 | h-, leu1-32, his3-D1, ura4-D18, ade6-M216, Pnmt41-SpAin1-mGFP::Leu+ | This study |
| KV804 | h?, fim1-mCherry-natMX6, ain1-Δ1:: kanMX6, Pnmt41-SpAin1-mGFP::Leu+ | This study |
| KV818 | h + kanMX6-Prng2-mEGFP-rng2 ade6-M210 leu1-32 ura4-D18 | Laporte et al., 2011 |
| KV856 | h?, ain1-Δ1:: kanMX6, Pnmt41-SpAin1(R216E)-mGFP::Leu+, fim1-mCherry-natMX6, ade6, leu1-32, ura4-D18 | This study |
| KV861 | h?, ain1-GFP-kanMX6, sad1-tdTomato-natMX6, ade6-m21?, leu1-32, ura4-D18 | This study |
| KV878 | h+, fim1-mGFP-kanMX6, sad1-tdTomato-natMX6 | This study |
| KV908 | h? fim1-1Δ-kanMX6, ain1-GFP-kanMX6, sad1-tdTomato::natMX6 | This study |
| KV963 | h?, fim1-1Δ::kanMX6, Pnmt41-SpAin1-mGFP::Leu+ | This study |
| KV968 | h? Pnmt41-SpAin1-mGFP::Leu+, ARPC5-mCherry-natMX6 | This study |
Additional files
-
Transparent reporting form
- https://doi.org/10.7554/eLife.47279.020
Download links
A two-part list of links to download the article, or parts of the article, in various formats.
Downloads (link to download the article as PDF)
Open citations (links to open the citations from this article in various online reference manager services)
Cite this article (links to download the citations from this article in formats compatible with various reference manager tools)
Cooperation between tropomyosin and α-actinin inhibits fimbrin association with actin filament networks in fission yeast
eLife 8:e47279.
https://doi.org/10.7554/eLife.47279


