Real time dynamics of Gating-Related conformational changes in CorA
- Weill Cornell Medical College, United States
- The University of Chicago, United States
Figures
Figure 1 with 1 supplement
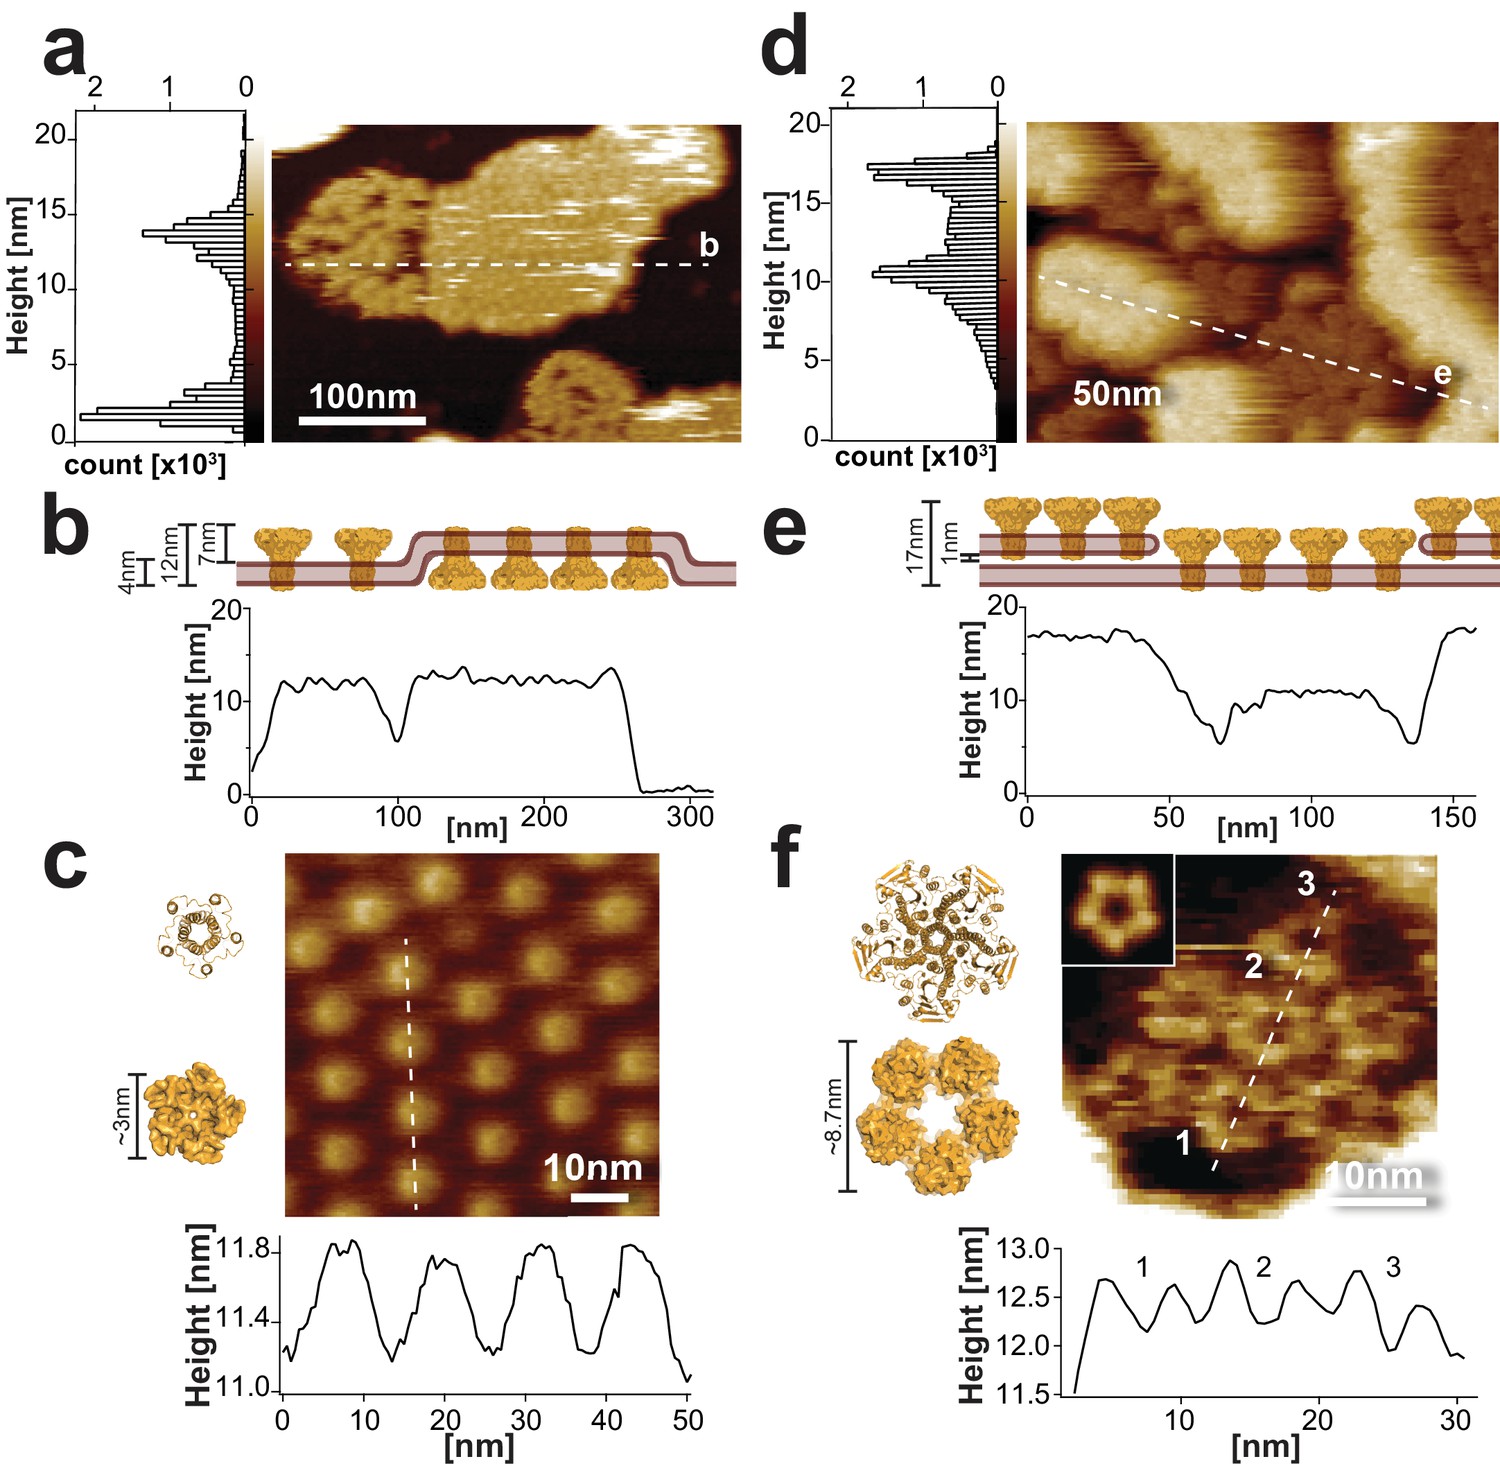
Sample morphology of CorA reconstitutions for HS-AFM.
(a) HS-AFM overview topograph of densely packed CorA in a POPC/POPG (3:1) lipid bilayer exposing the periplasmic side and a loosely packed protein area with diffusing molecules exposing the intracellular face (full color scale: 20 nm). Left: Height histogram of the HS-AFM image with two peaks representative of the mica and the CorA surface (∆Height (peak-peak): 12 nm (20,500 height values)). The dashed line indicates the position of the cross-section analysis shown in (b). (b) Profile of the membrane shown in a), including a cartoon (top) of the membrane in side view. The height profile (~12 nm) corresponds well to the all-image height analysis (a, left) and the CorA structure (Matthies et al., 2016). (c) High-resolution image (top) and cross-section analysis along dashed line (bottom) of the periplasmic face. The height and dimension of the periplasmic face is in good agreement with the structure (left), and the periodicity (~14 nm, n = 40) corresponds well with the diameter of the intracellular face spacing the molecules on the other side of the membrane (full color scale: 2 nm). (d) HS-AFM image of densely packed CorA embedded in a DOPC/DOPE/DOPS (4:5:1) membrane. This reconstitution resulted in two stacked membrane layers, both exposing the CorA intracellular face. The dashed line indicates the position of the cross-section analysis shown in (e). Left: Height histogram of the HS-AFM image with two peaks at ~12 nm and ~17 nm (32,500 height values), corresponding to the proteins in two stacked membranes (full color scale: 20 nm). (e) Section profile of the membrane shown in d), including a cartoon (top) of the membrane in side view. (f) High-resolution view and cross-section analysis along dashed line (bottom) of the CorA intracellular face revealing the individual subunits of the pentamers (full color scale: 3 nm). Inset: 5-fold symmetrized average of CorA. The dimensions of CorA observed with HS-AFM are in good agreement with the structure (left: PDB 3JCF). The structures in (c) and (f) are shown in ribbon (top) and surface (bottom) representations, respectively.
Figure 1—figure supplement 1
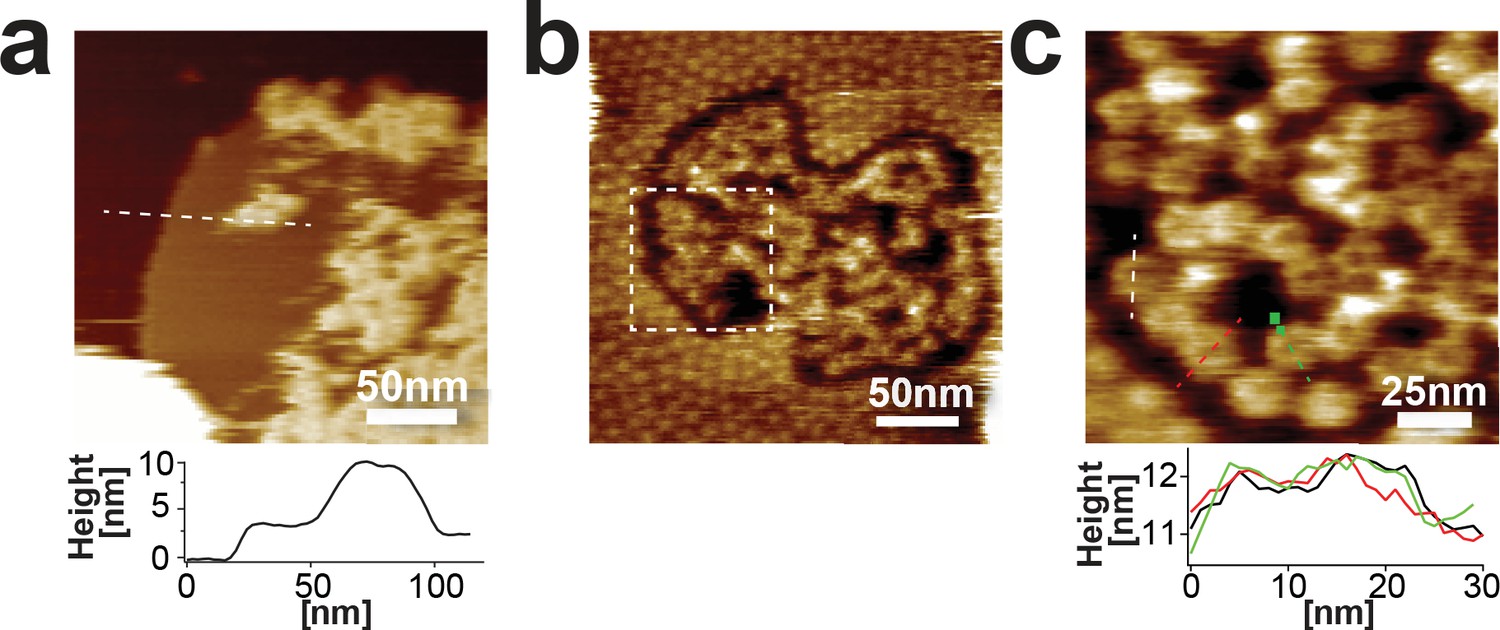
Characterization of CorA intracellular side reconstituted in POPC/POPG membranes.
(a) Overview of a membrane just after vesicle opening with fast diffusing CorA. The intracellular face protruded ~7 nm from the lipid bilayer as shown in the height section analysis (below) along the dashed line. (b) Overview image with dashed outline of the region of high magnification HS-AFM analysis. (c) Region outlined in (b): Although the molecules were moving fast in the membrane flower-shaped structures were observed. Below: cross-section along the lines allowing an estimation of an outer diameter of about 10 nm.
Figure 2 with 2 supplements

CorA in presence and absence of Mg2+.
(a) Molecular surface representations of CorA structures in the Mg2+-bound (closed) and Mg2+-free (open) states (PDB: 3JCF and 3JCH) (Matthies et al., 2016). Top: intracellular view. Bottom: side view. The Mg2+-free (open) structure protrudes further (Δh) from the membrane. (b) HS-AFM images of a membrane patch with densely packed CorA exposing the intracellular face with corresponding cross-section analyses in 10 mM Mg2+ (left) and after ~20 min in absence of Mg2+ (right). The cross-section profiles (bottom) along the dashed lines demonstrate the height increase of ~1.5 nm of the same molecules in absence of Mg2+ compared to the topography height in presence of Mg2+.
Figure 2—figure supplement 1
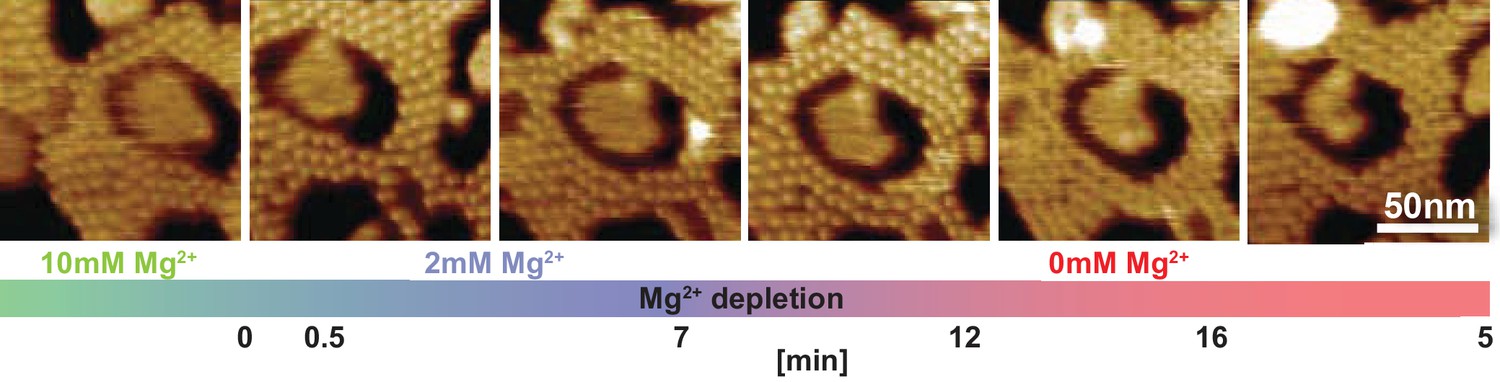
Monitoring the CorA periplasmic side upon Mg2+-depletion.
HS-AFM frames of a CorA membrane monitored over time at 10 mM, 2 mM, and 0 mM Mg2+-concentrations, indicated in green, blue and red, respectively (as in the main text) and approximated time points during the experiments. Mg2+-depletion was achieved by manual addition of EDTA into the measuring solution. No significant topographical changes were observed. Full color scale: 4 nm.
Figure 2—figure supplement 2
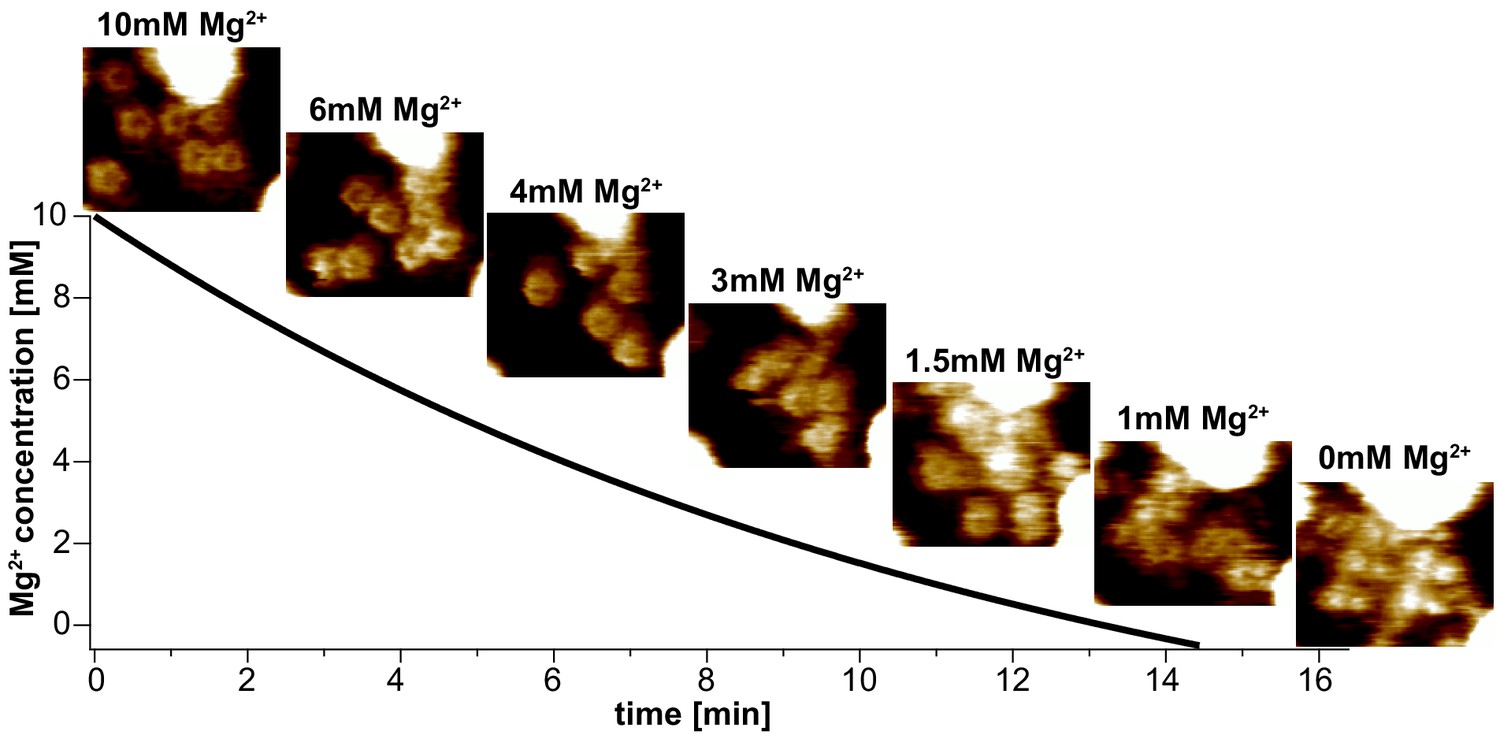
Controlled buffer exchange experiment confirming the intracellular CorA Mg2+-sensor domain affinity for Mg2+.
Using HS-AFM coupled to a constant-pressure and constant-flow pump (Miyagi et al., 2016) allowed a continuous buffer exchange of the initial buffer containing 10 mM Mg2+ to a Mg2+-free buffer containing additional 2 mM EDTA. At ~1.8 mM Mg2+ individual molecules start fluctuating between different protrusion heights. At 0 mM Mg2+-concentration all CorA molecules have lost their initial flower-shaped structure. Image size: 60 × 50 nm. Full color scale: 3 nm. Buffer exchange flow rate: 10 μL/min and total fluid chamber volume: 120 μL.
Figure 3
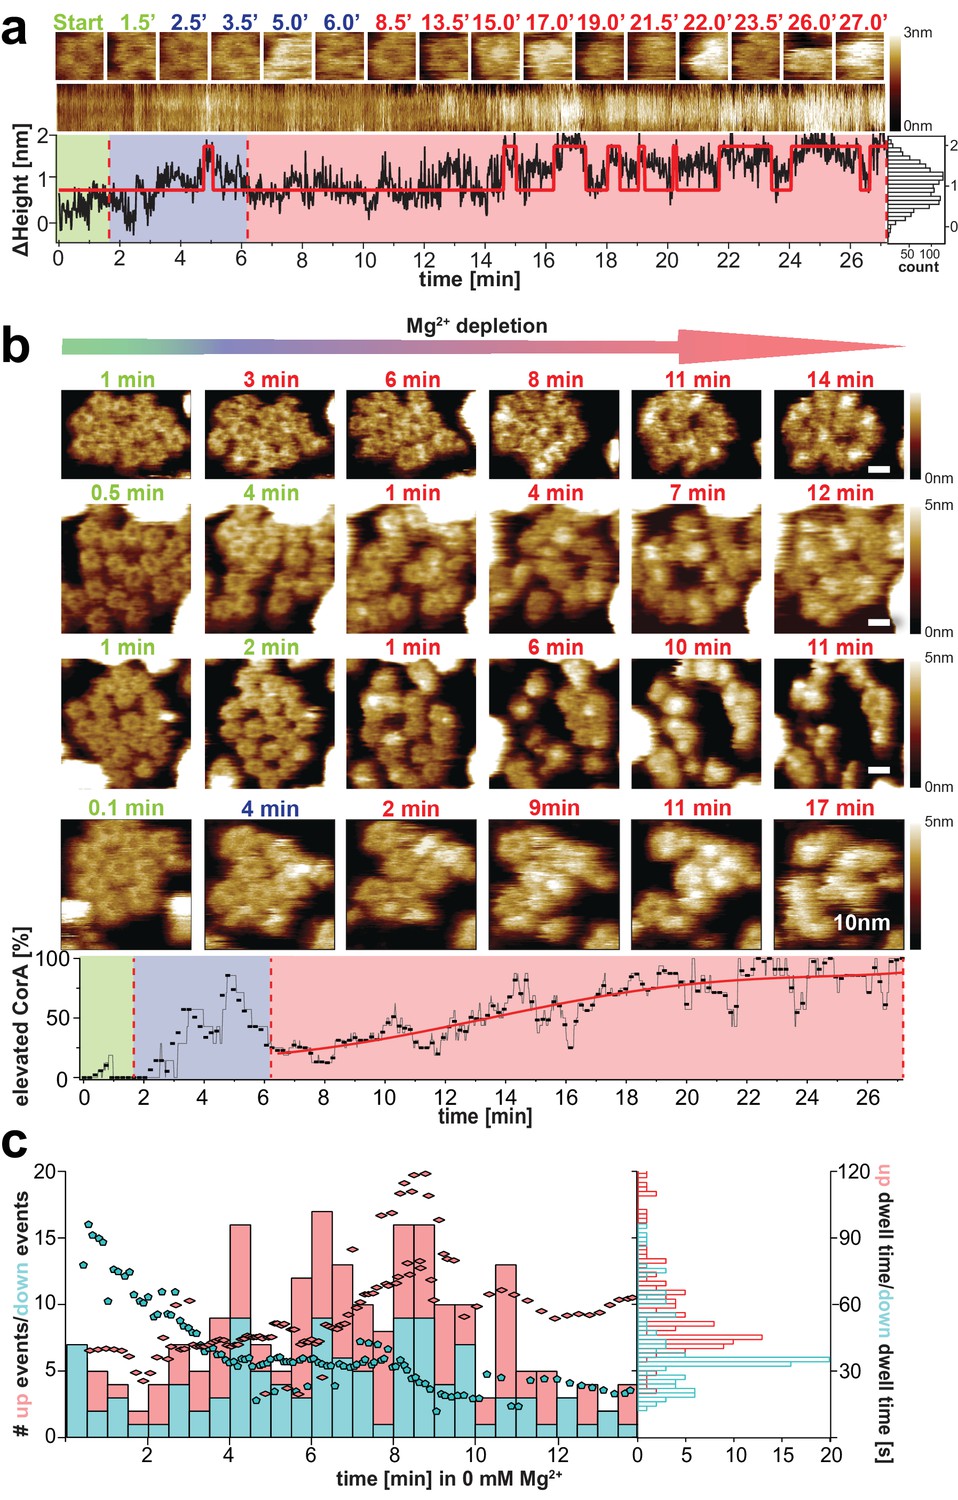
CorA conformational changes and dynamics upon Mg2+-depletion.
(a) Single CorA molecule at indicated time points during Mg2+-depletion. Below: Section kymograph of the molecule and corresponding ΔHeight/time trace derived from the center area of the imaged CorA channel. The red line is a fitted idealized trace with two distinct ΔHeight-states. Right: Height histogram of the ΔHeight/time trace. (b) Time-lapse HS-AFM of membrane patches with densely packed CorA channels that expose the intracellular face during Mg2+-depletion experiments. Direction of Mg2+-depletion and time points are indicated above frames. Scale bars: 10 nm. Below: Percentage of CorA molecules with increased height (putatively open states) as a function of time. (a) and (b): Frames acquired in saturating 10 mM Mg2+-concentrations are indicated in green, at ~2 mM Mg2+ in blue (only tested in (a) and the bottom panel of (b)) and at complete Mg2+-depletion (0 mM Mg2+) in red. Depletion of Mg2+ was achieved by manual addition of EDTA. (c) Number of Δheight-transitions and associated dwell-times following Mg2+-depletion. Bars indicate the number of high-to-low (‘down’, turquois) and low-to-high (‘up’, red) events binned over a time window of 30 s. Turquois pentagons and red diamonds indicate average closing and opening event time-points of corresponding average dwell-time (right axis), respectively. These averages were calculated over a sliding window of 20 events along the time axis. Analysis included molecules from 2 experiments at 0 mM Mg2+ (shown in (b) top and bottom) and 30,500 HS-AFM images thereof. Right: Histogram of average dwell-times in the ‘high’ (red) and ‘low’ (turquois) states (where the high state represents/comprises all conformational states with elevated subunits).
Figure 4
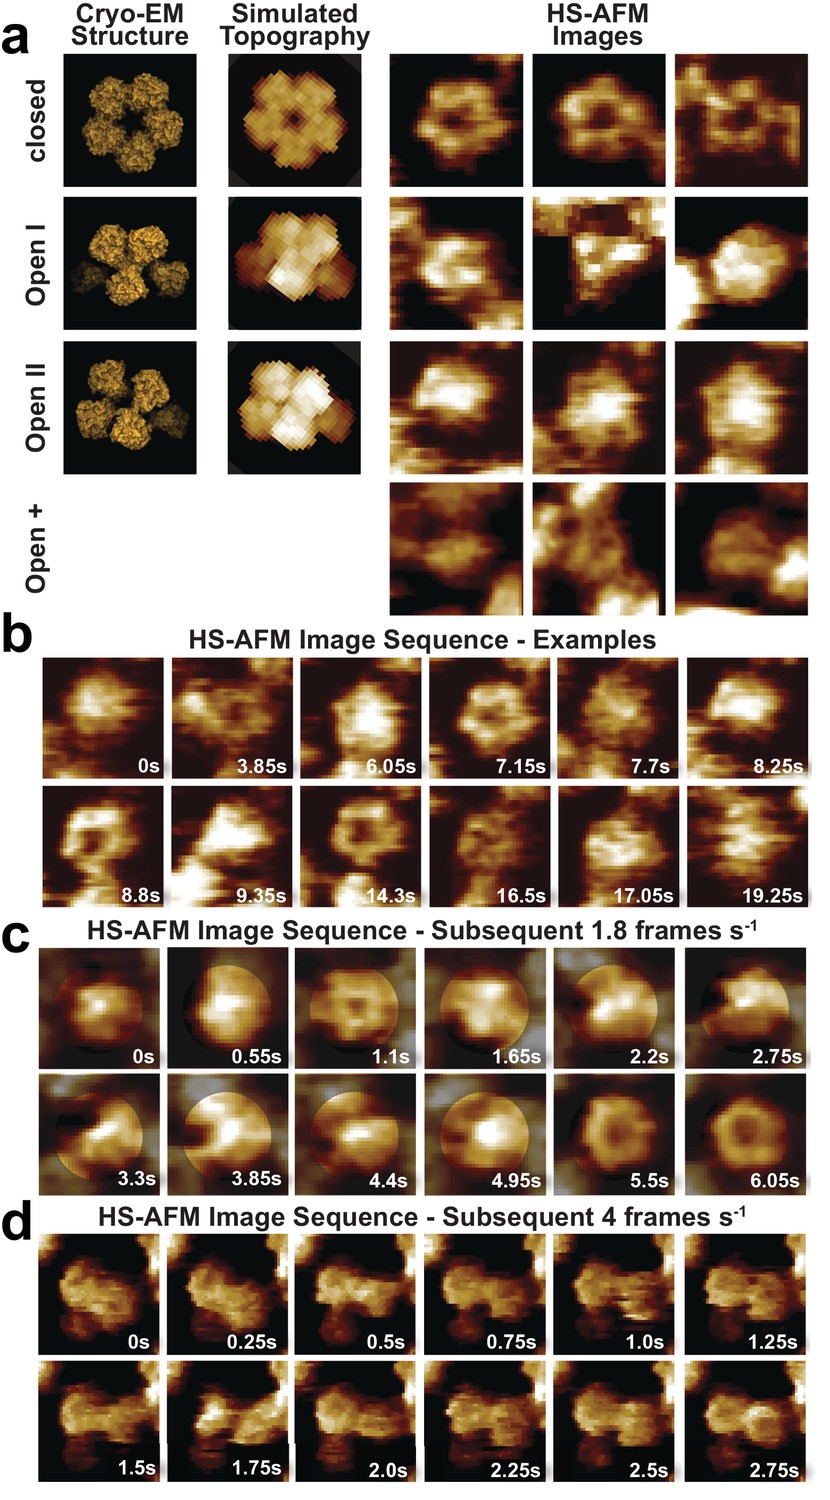
CorA adopts several highly dynamic conformations.
(a) Left: Surface representations of CorA cryo-EM structures in the high-resolution closed (PDB: 3JCF) and the two 7 Å resolution Mg2+-free open (PDBs 3JCH, 3JCG) conformations. Center: AFM topography simulations of the structures on the left. Right: Examples of HS-AFM frames of single CorA molecules in the symmetric closed (upper panel) and the asymmetric (putatively open) conformations (bottom panels). Full-frame size: 17.5 nm. Full z-scale: 2 nm. (b) High-resolution HS-AFM frames of an individual CorA channel upon Mg2+-depletion. The molecule fluctuates dynamically between several conformations. Time stamps are indicated. Full-frame size: 17.5 nm. Full z-scale: 2 nm. (c) HS-AFM image sequence of subsequent frames depicting CorA every 550 ms highlighting the structural flexibility of the molecule and the fast movements of the individual subunits. Full-frame size: 17.5 nm. Full z-scale: 2 nm. (d) HS-AFM image sequence depicting CorA every 250 ms. Full-frame size: 27 nm. Full z-scale: 2 nm.
Figure 5 with 1 supplement
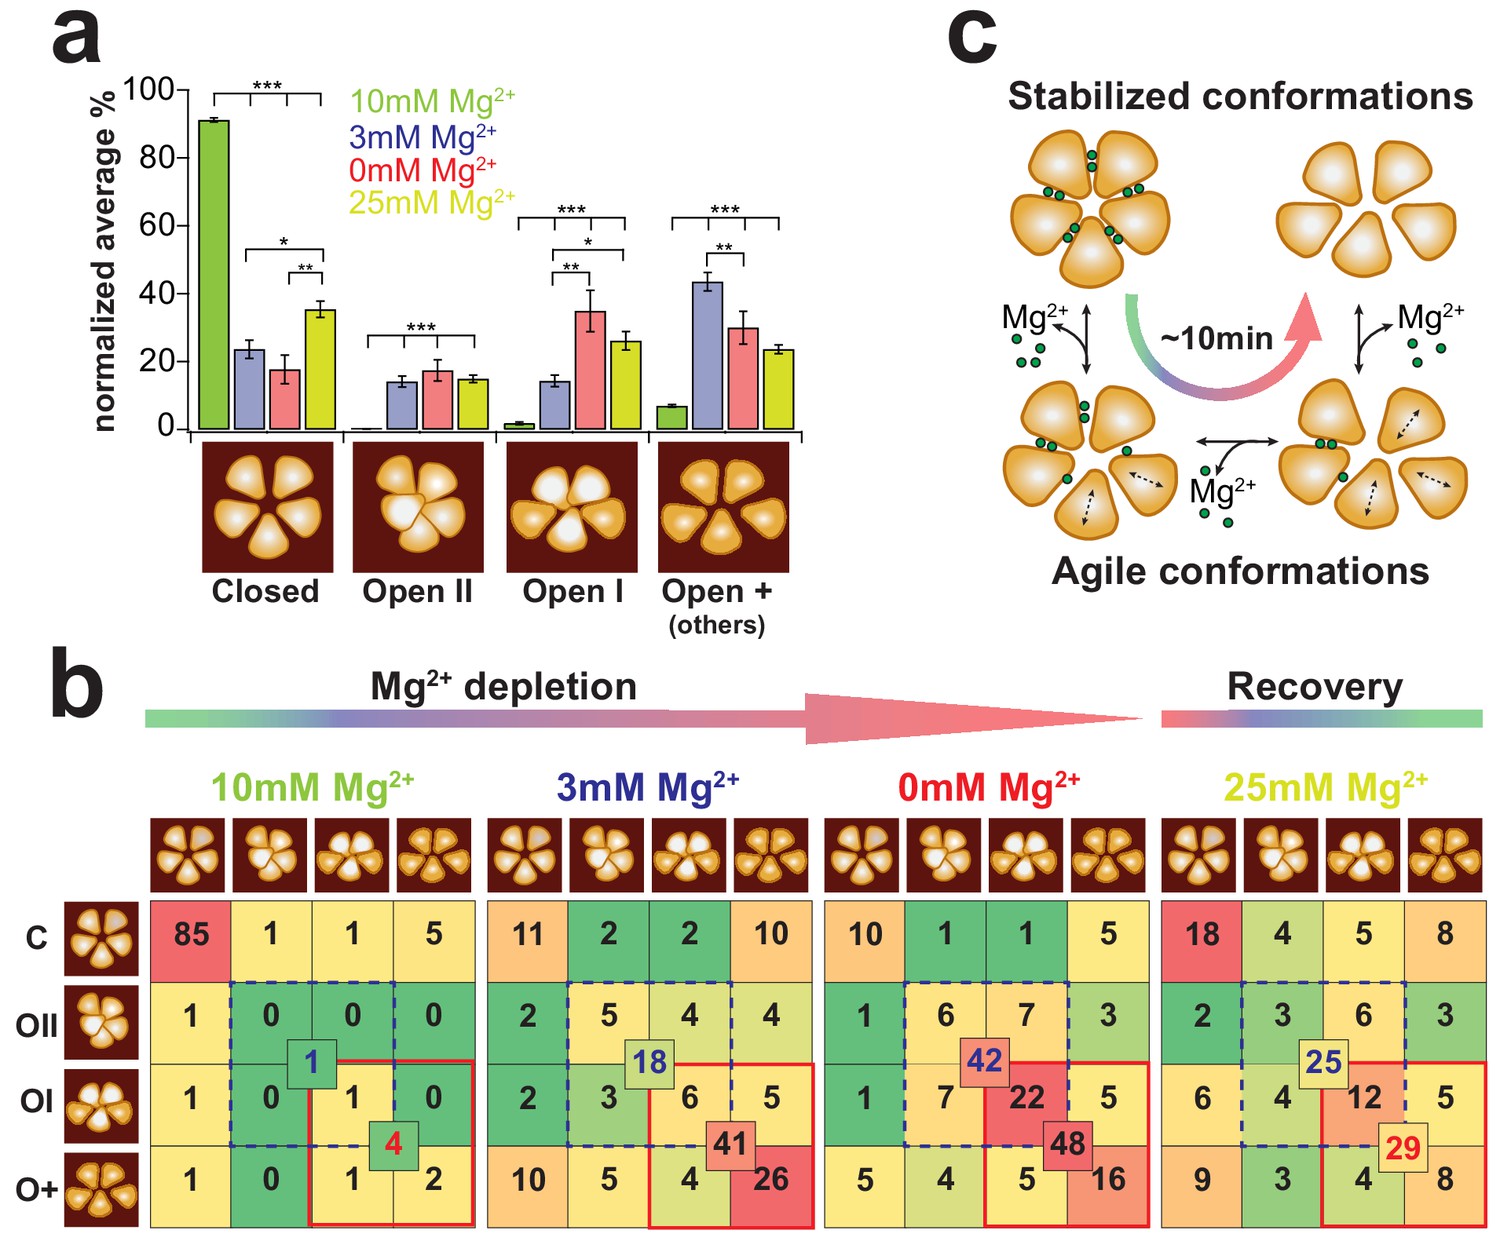
CorA state occupancy and transition dynamics.
(a) State occurrence of 5-fold symmetric (assigned to Closed), dome-shaped (assigned to Open-II), elevated bean-shaped (assigned to Open-I) and other asymmetric CorAs (unassigned, Open +) at different Mg2+-concentrations: 10 mM Mg2+: green, 3 mM Mg2+: blue, 0 mM Mg2+: red, and after re-addition of 25 mM Mg2+: yellow. Bars represent the normalized percentages of state assignments of ~20 CorA molecules in ~80–100 frames, ie up to ~2400 molecular representations, for each Mg2+-condition. Error bars are standard error of mean (s.e.m.). Below, schematic representations of the various conformations. (b) CorA state transition-maps at 10 mM, 3 mM, 0 mM, Mg2+ and after subsequent re-addition of Mg2+ to 25 mM (from left to right). The schematic molecule on the left (rows) is the state in frame(n) and the schematic molecule on the top (columns) is the state in frame(n+1). Numbers are normalized percentages of the state transitions of the same experimental data as in (a). Color scale was adapted for each condition separately with a gradient from green (lowest occurrence of transition) over yellow and orange to red (highest occurrence of transition). Numbers in the center of boxes of 4 state transitions represent the sum of transitions between states with elevated subunits (blue dashed square) and between transitions of strongly elongated structures (red square). (c) CorA conformational transition model based on the HS-AFM observations. Within ~10 min of Mg2+-depletion, the 5-fold symmetric, fully Mg2+-liganded CorA transit into dynamically fluctuating molecules with flexible subunits until their conformation stabilizes in a Mg2+-free highly asymmetric structure with increased membrane protrusion height. Figure 5 - Information Supplement 1: Estimation of thermally activated TM1 helix motions We estimated the theoretical range of helical motion by considering that TM1 behaves like a flexible rod undergoing thermally excited motions. The helix (rod) is characterized by a specific persistence length LP that is related to the bending stiffness KS through . The basic description for the change in curvature between two points on the rod is given by , with s being the arc length and a unit tangent vector at position (s). In an ideal system, the total elastic energy Eela of a particular conformation is given by the integral of the bending energies accumulated along a rod with contour length L: Assuming only circular curvatures along the rod, , where r is the radius of curvature. Using this basic description of an elastic polymer rod and considering the persistence length of protein α-helices Lp = 100 nm (as described in Choe and Sun, 2005) and a contour length L = 11 nm (length of TM1, see Supplementary Figure 4), we obtain This equation thus estimates that the radius of curvature r = ~23 nm at 1 kBT. Helix bending of that range would result in ~2 nm movements at its end.
Figure 5—figure supplement 1
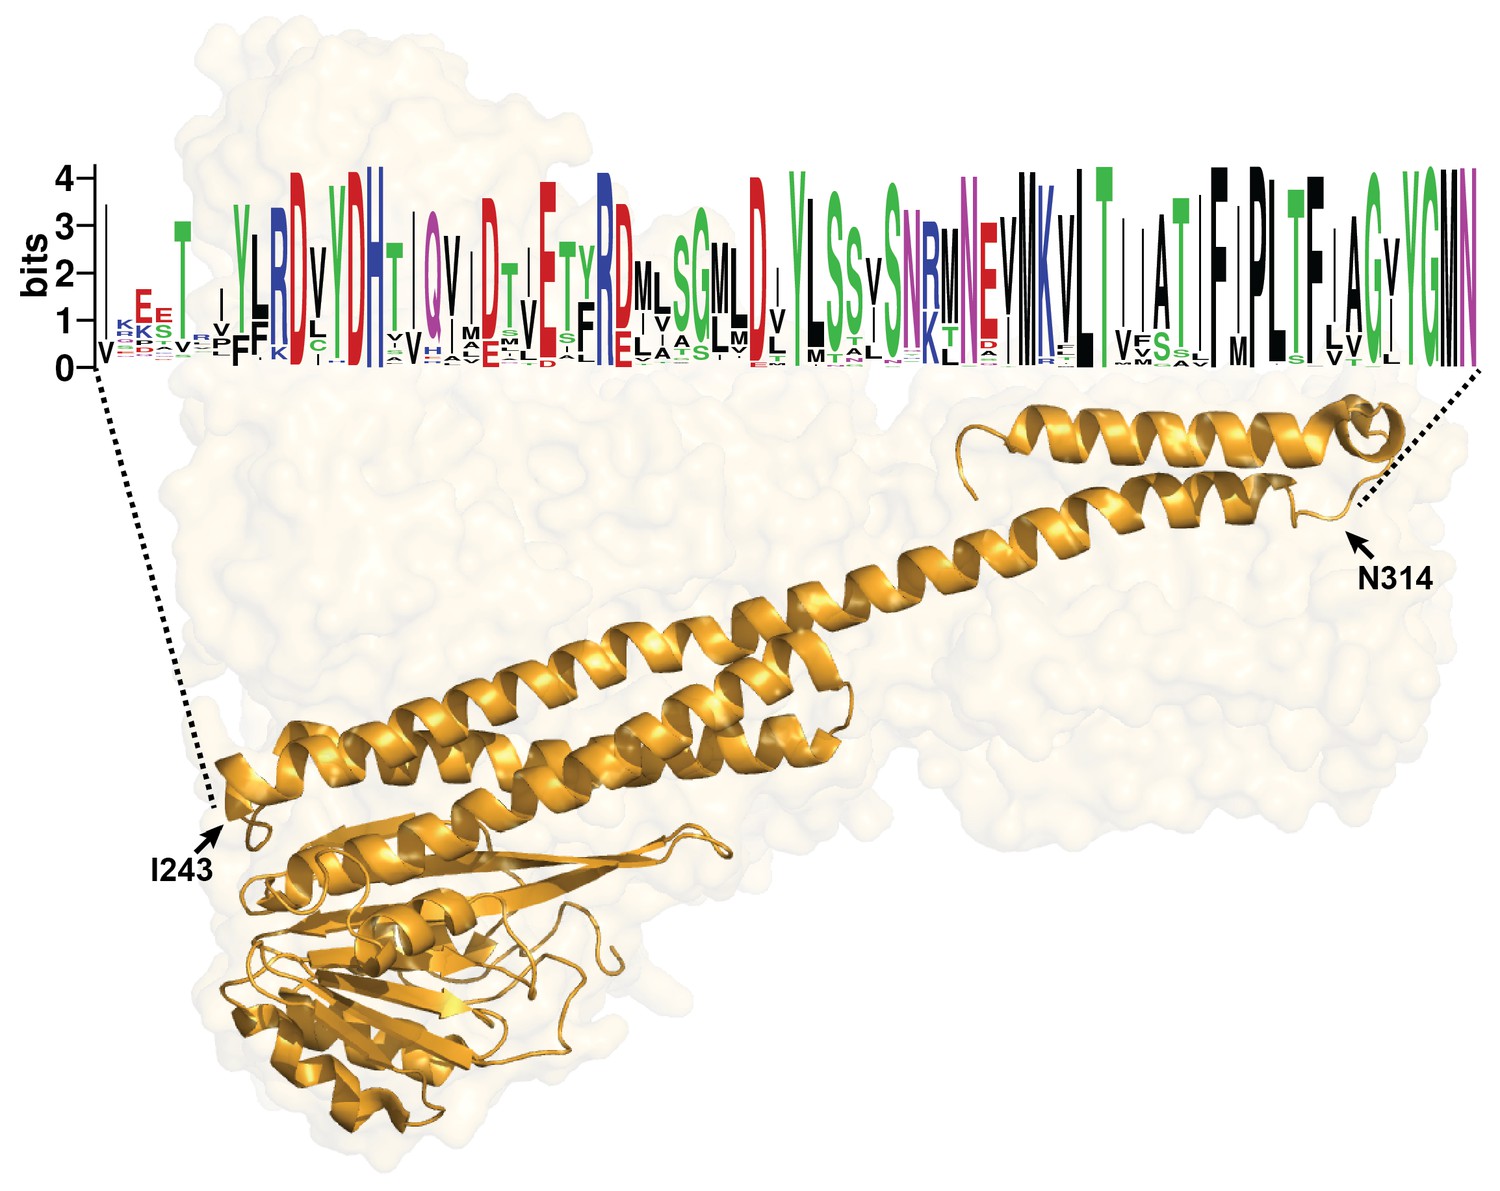
TM1 architecture and sequence conservation.
Top: TM1 consensus sequence generated by (i) extracting the Thermotoga maritima CorA TM1 sequence (from ILE243 to ASN314), (ii) searching related sequences using PSI-BLAST (avoiding redundancies) (https://blast.ncbi.nlm.nih.gov/Blast.cgi) and recovering the 500 closest sequences, (iii) precise sequence alignment using COBALT (https://www.ncbi.nlm.nih.gov/tools/cobalt/), and (iv) generation of a sequence logo of TM1 using WEBLOGO (https://weblogo.berkeley.edu/logo.cgi). Acidic amino acids (aa) D and E are in red, Q and N are in purple, positively charged aa are in blue, non-polar aa in black, and polar aa are in green. The size of the letters represents degree of conservation at a particular position. Bottom: Transparent surface representation of the CorA structure with one monomer highlighted focusing on the 11 nm long TM1 helix with positions ILE243 and ASN314 indicated.
Author response image 1
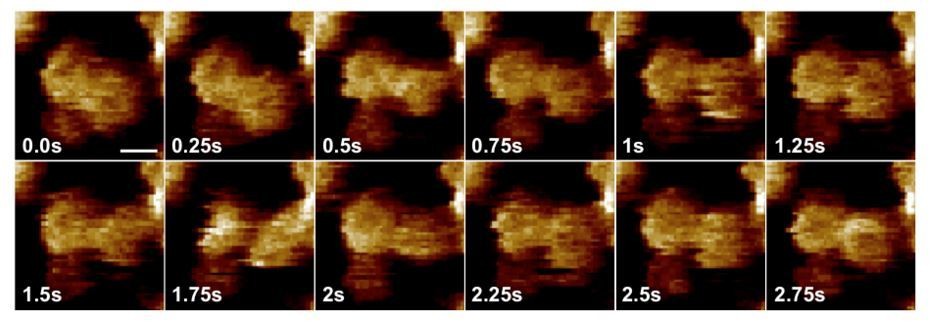
HS-AFM image sequence of depicting CorA every 250ms.
Videos
Video 1
CorA reconstituted in POPC/POPG liposomes.
In overview scans the proteoliposomes were opened by applying slightly increased loading forces, thereby revealing CorA membranes exposing both faces, the periplasmic face in crystalline packing and the intracellular side in crowded membrane areas. Video settings: Full scan size: 444 nm, 200 pixels, scan rate: 1 frame s−1, full color range: 20 nm.
Video 2
Four examples of high magnification movies of the intracellular side of CorA reconstituted in POPC/POPG.
Fast diffusing molecules with flower-shaped structures were observed. Video settings: Full scan sizes: 80–120 nm, 160–200 pixels, scan rates: 1–2 frame s−1, full color range: 5 nm.
Video 3
CorA reconstituted in DOPC/DOPE/DOPS 4:5:1.
The sample support was fully covered with CorA membranes exposing the intracellular face with areas of slowly moving molecules and membranes with densely packed channels stacked on top. Video settings: Full scan size: 200 nm, 200 pixels, scan rate: 1 frame s−1, full color range: 20 nm.
Video 4
CorA conformational changes upon Mg2+-depletion.
Within ~15 min most molecules transition from a 5-fold symmetric, Mg2+-bound, putatively closed, conformation to dynamically active, flexible structures that equilibrate into an asymmetric molecule of increased height, the putative ligand-free open state. Video settings: Full scan size: 60 × 40 nm, 0.4 nm/pixel, scan rate: 1.3 frame s−1, full color range: 5 nm.
Video 5
Monitoring the conformational changes upon Mg2+-depletion.
Within ~30 min, CorA molecules change from the stable 5-fold symmetric, putatively closed, conformation to a dynamic structure representing the apparent open conformation. Video settings: Full scan size: 100 nm, 200 pixels, scan rate: 1 frame s−1, full color range: 5 nm.
Video 6
High resolution HS-AFM movie of an individual CorA molecule switching between conformations in low Mg2+ concentration.
The molecule continuously switches between a subset of at least three states thought to represent conformations of the active CorA. Video settings: Full frame size: 17.5 nm, 35 pixels, scan rate: 2 frames s−1, full color range: 2 nm.
Video 7
CorA molecule cluster at saturating Mg2+ concentrations.
Molecules are found in the symmetric flower-shaped closed conformation more than 90% of the time. Video settings: Full frame size: 100 nm, 200 pixels, scan rate: 1.1 frames s−1, full color range: 5 nm.
Video 8
CorA molecules monitored just after complete Mg2+-depletion.
The majority of the molecules are in a highly dynamic state constantly switching between different structural states. Video settings: Full frame size: 100 nm, 200 pixels, scan rate: 1.8 frames s−1, full color range: 5 nm.
Additional files
Download links
A two-part list of links to download the article, or parts of the article, in various formats.
Downloads (link to download the article as PDF)
Open citations (links to open the citations from this article in various online reference manager services)
Cite this article (links to download the citations from this article in formats compatible with various reference manager tools)
Real time dynamics of Gating-Related conformational changes in CorA
eLife 8:e47322.
https://doi.org/10.7554/eLife.47322


