FAK activity sustains intrinsic and acquired ovarian cancer resistance to platinum chemotherapy
- Moores UCSD Cancer Center, United States
- Xiamen University, China
- University of Turku, Finland
- UCSD Center for Computational Biology & Bioinformatics, United States
- Verastem Oncology, United States
- Hungarian Academy of Sciences, Hungary
- Semmelweis University, Hungary
- Fox Chase Cancer Center, United States
Figures
Figure 1 with 2 supplements
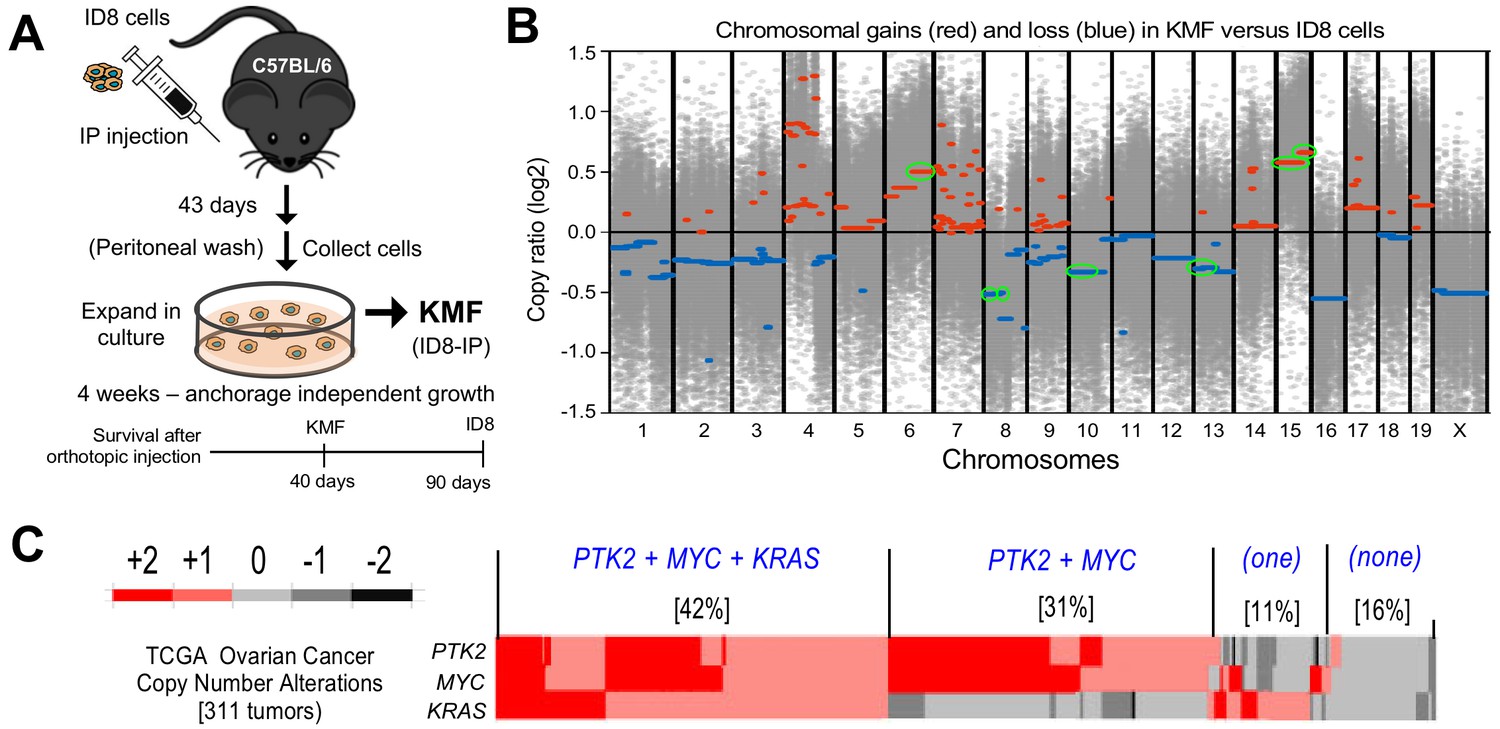
Spontaneous copy number gains in genes for Kras, Myc, and FAK (Ptk2) in a new murine model (KMF) of ovarian cancer.
(A) Schematic summary of KMF cell isolation by in vivo selection for aggressive ID8 growth in C57Bl/6 mice and expansion of cells as tumorspheres. (B) Whole-genome copy number ratio (log2) determined from ID8 and KMF exome sequencing. Gains (red) and losses (blue) are denoted across chromosomes. Circled regions (green) highlight shared genomic copy alterations between KMF and HGSOC (Table 1). (C) Heat map showing genomic copy number alterations encompassing KRAS, MYC, and PTK2 genes in HGSOC patients (TCGA, 311 tumors). Percentage of tumors with +1 or +2 copy number gains per group are indicated.
-
Figure 1—source data 1
ID8 and KMF copy number alterations determined from exome sequencing.
- https://doi.org/10.7554/eLife.47327.006
Figure 1—figure supplement 1
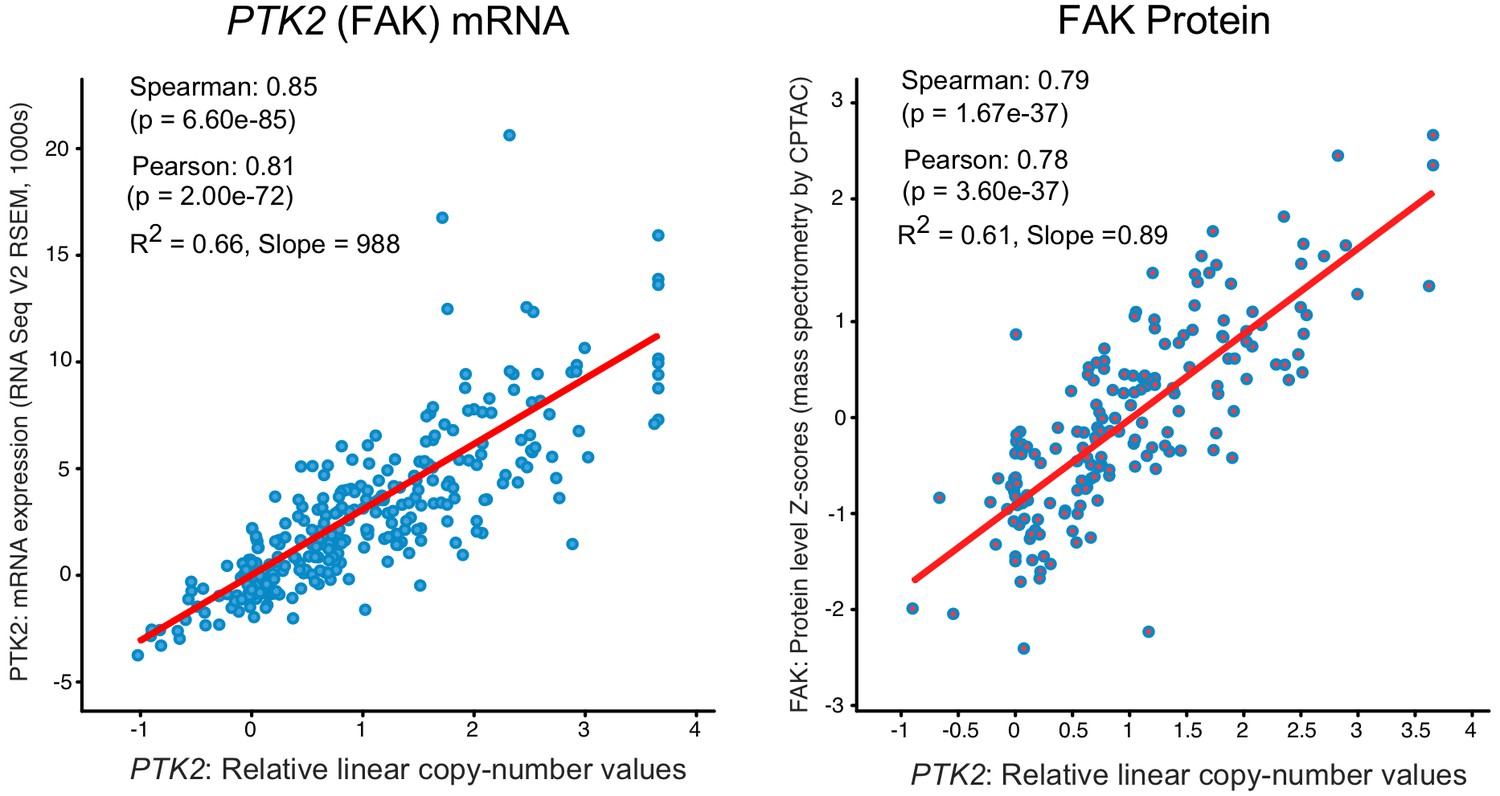
Analysis of PTK2 mRNA and FAK protein expression as a function of genomic copy number.
RNA (left) or FAK protein expression (right) from analyses of RNA sequencing or mass spectroscopy data are plotted against linear copy number values as archived in the ov_tcga dataset, respectively. Pearson correlation, Spearman correlation, and the slope of the derived line (R squared value) are shown to illustrate the linear relationships of the data. p-Values were determined by ANOVA. All data were accessed via cbioportal.org.
Figure 1—figure supplement 2
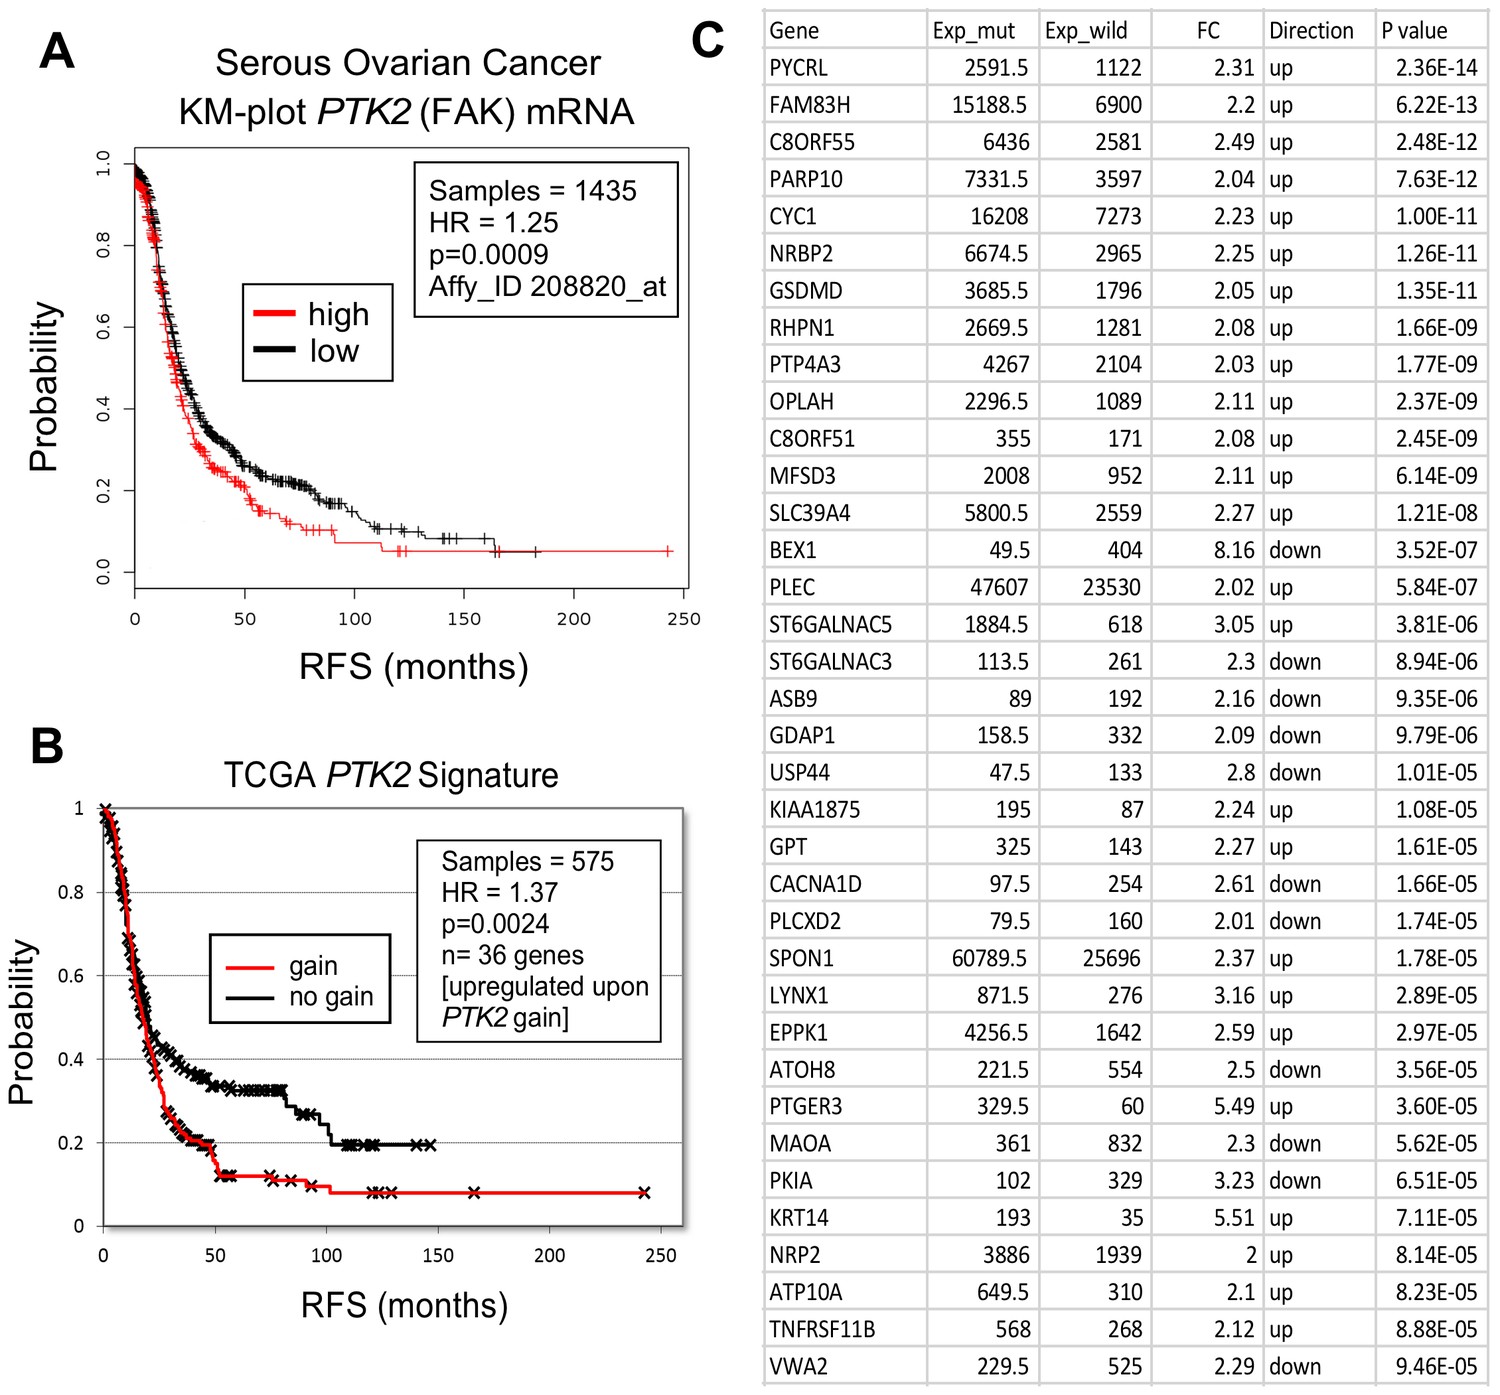
Elevated PTK2 mRNA is associated with a poor prognosis in ovarian cancer.
(A) Kaplan-Meier (KM) analysis of PTK2 mRNA (FAK) levels in 1435 patient samples. Plot shows probability of relapse-free survival (RFS) in months with tumors high (red) or low (black) for PTK2 mRNA (HR = 1.25, p=0.0009). (B) KM plot of PTK2 signature (red, Panel C) versus no gain (black) showing RFS (HR = 1.37, p=0.0024). (C) List of 36 genes (p<9.45E-05) that show copy number fold-change (FC) at least = 2 in HGSOC tumors with PTK2 gains. Direction: up is gain and down is loss.
Figure 2
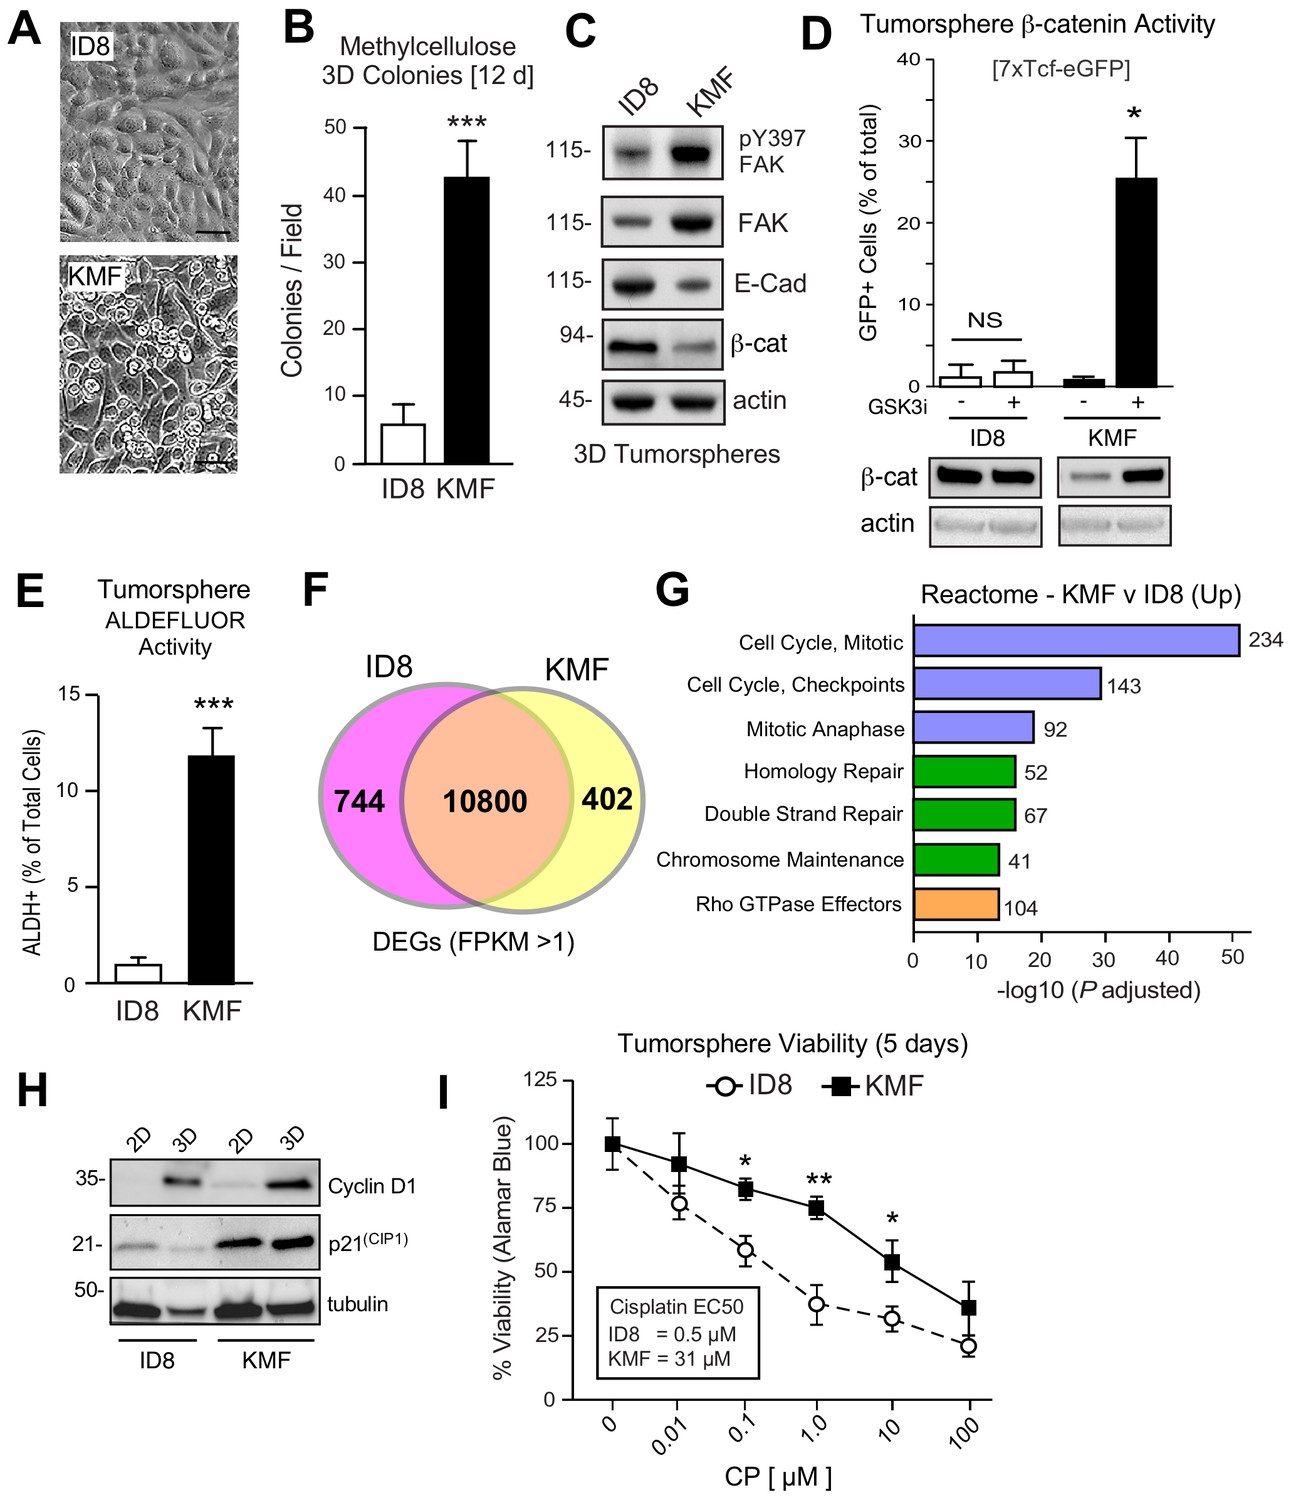
Acquired CSC phenotypes and greater intrinsic cisplatin resistance of KMF cells.
(A) ID8 or KMF cells at high densities in 2D culture by phase-contrast imaging. Scale is 25 µm. (B) Quantitation of ID8 and KMF colony formation in methylcellulose (21 days). Values are means (± SEM, ***p<0.001, unpaired T-test) from three independent experiments. (C) ID8 and KMF 3D protein lysates immunoblotted for pY397 FAK, total FAK, E-cadherin, β-catenin, and actin. (D) Lentiviral-delivered β-catenin transcriptional reporter activity (7X TCF-eGFP) in ID8 and KMF cells grown as tumorspheres + /- GSK3β inhibitor. Values are percent GFP+ cells by flow cytometry (NS, not significant, *p<0.05, unpaired T-test, two experiments). Lower, lysates of cells immunoblotted for β-catenin and actin. (E) Quantitation of ID8 and KMF tumorsphere ALDEFLUOR activity. Values are means expressed as fold-change to ID8 (± SD, ***p<0.001, unpaired T-test, three independent experiments). (F) RNA sequencing Venn plot: number of shared or different expressed genes (DEGs) from ID8 and KMF cells in 3D culture. DEGs from FPKM (Fragments Per Kilobase of transcript per Million mapped read) values greater than 1. (G) Partial list of Reactome (top 20) KMF UP DEGs. N is the number of target genes elevated in KMF versus ID8. X axis are -log10 adjusted pP values. (H) Immunoblotting for cyclin D1, p21(Cip1), and tubulin in lysates of ID8 or KMF cells grown in 2D [10% serum] or 3D [serum-free PromoCell, 5 days] conditions. (I) Tumorsphere cytotoxicity (Alamar Blue) with increasing CP (5 days) expressed as percent viability to DMSO control. Means (n = 2) from four independent experiments (± SEM, *p<0.05, **p<0.01 by two-way ANOVA with a Bonferroni’s multiple comparisons test). EC50 values independently determined.
-
Figure 2—source data 1
Annotated RNA sequencing results from ID8 and ID8-IP/KMF tumorsphere cell lysates.
- https://doi.org/10.7554/eLife.47327.009
Figure 3 with 2 supplements
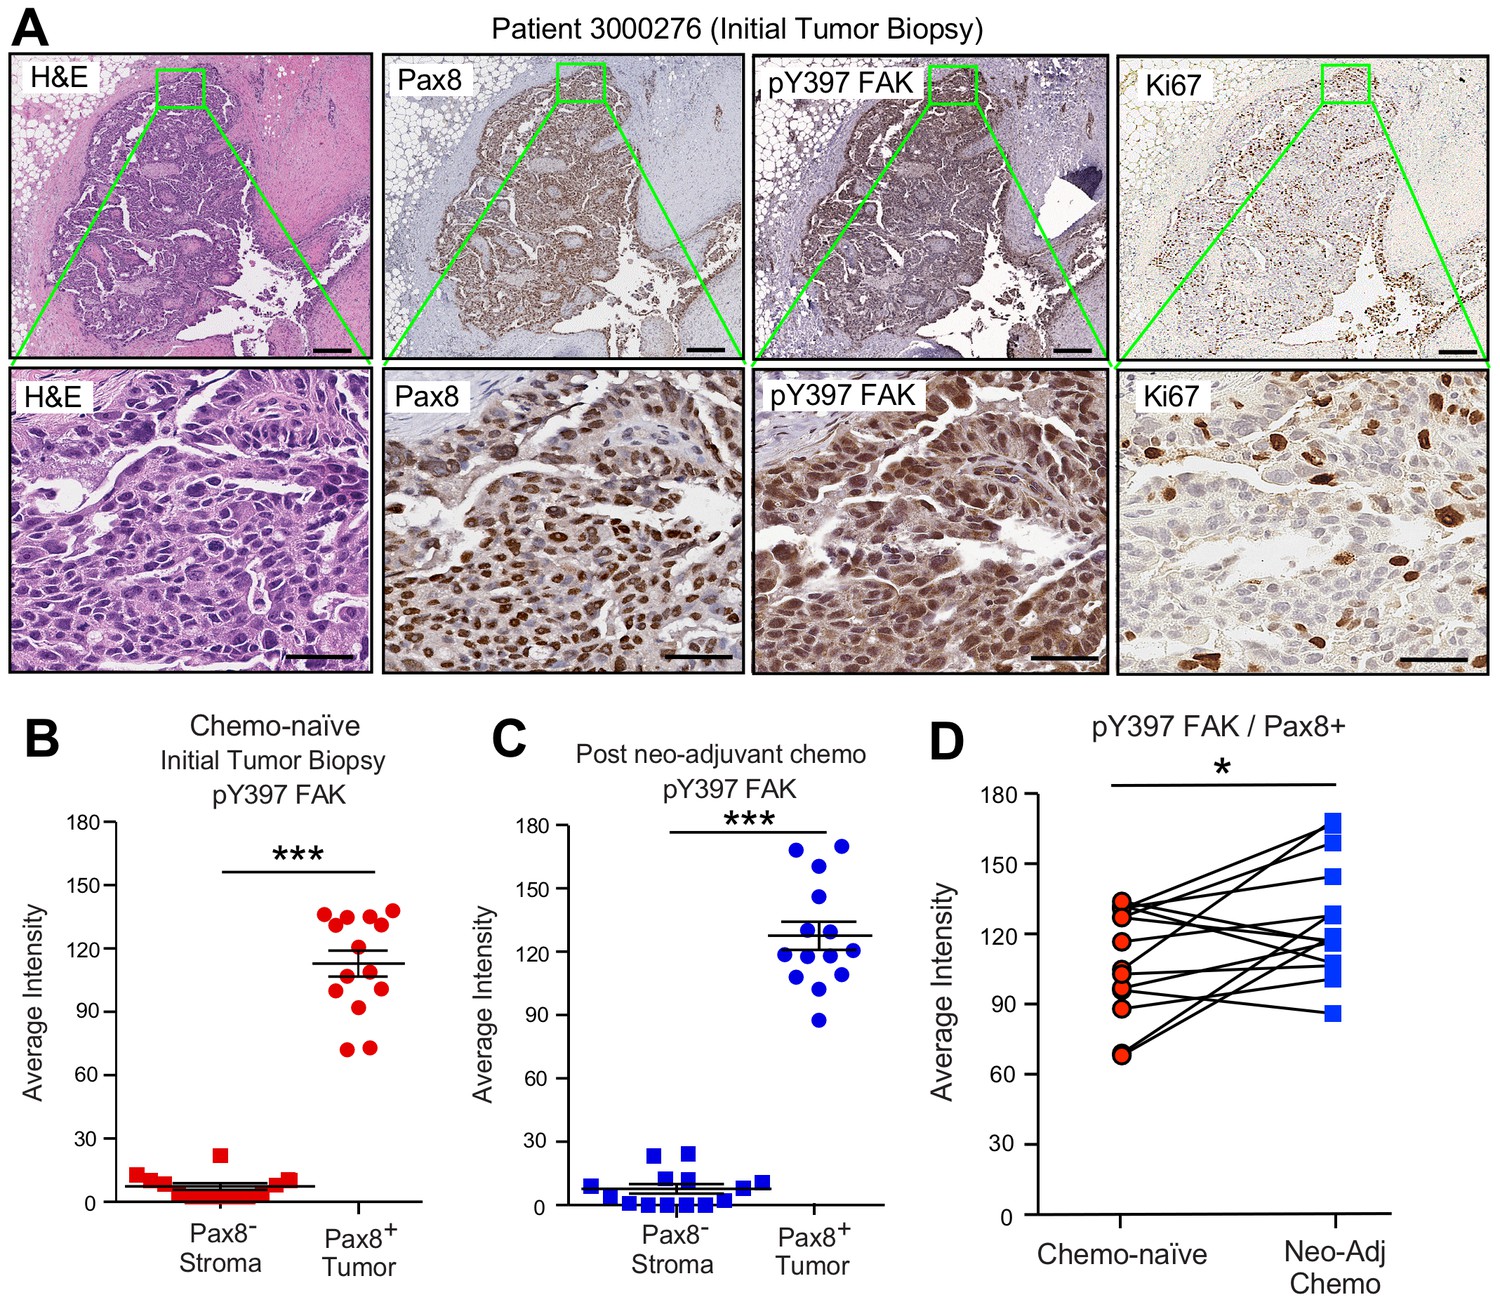
FAK Y397 phosphorylation (pY397) in HGSOC patient tumors surviving neoadjuvant chemotherapy.
(A) IHC staining of paraffin-embedded serial initial tumor biopsy sections (patient 3000276) with H and E, Pax8, pY397 FAK, and Ki67. Scale is 200 µm. Inset (green box) region is shown at 40X (below). Scale is 60 µm. (B and C) FAK pY397 staining intensity of paired patient ovarian tumor samples from initial biopsies (panel B) and after surgical removal following neoadjuvant chemotherapy (panel C) within Pax8-positive (tumor) and Pax8-negative (stroma) regions. Dot plots are quantified staining from 14 paired patient samples (Aperio software) and bars show mean ± SEM (analyzed 11 regions per sample, ***p<0.001, unpaired T-test). (D) Increased FAK pY397 staining within Pax8-positive regions post-chemotherapy (*p<0.05, paired T-test). Lines are connecting paired patient tumor samples collected prior to and after neoadjuvant chemotherapy.
Figure 3—figure supplement 1
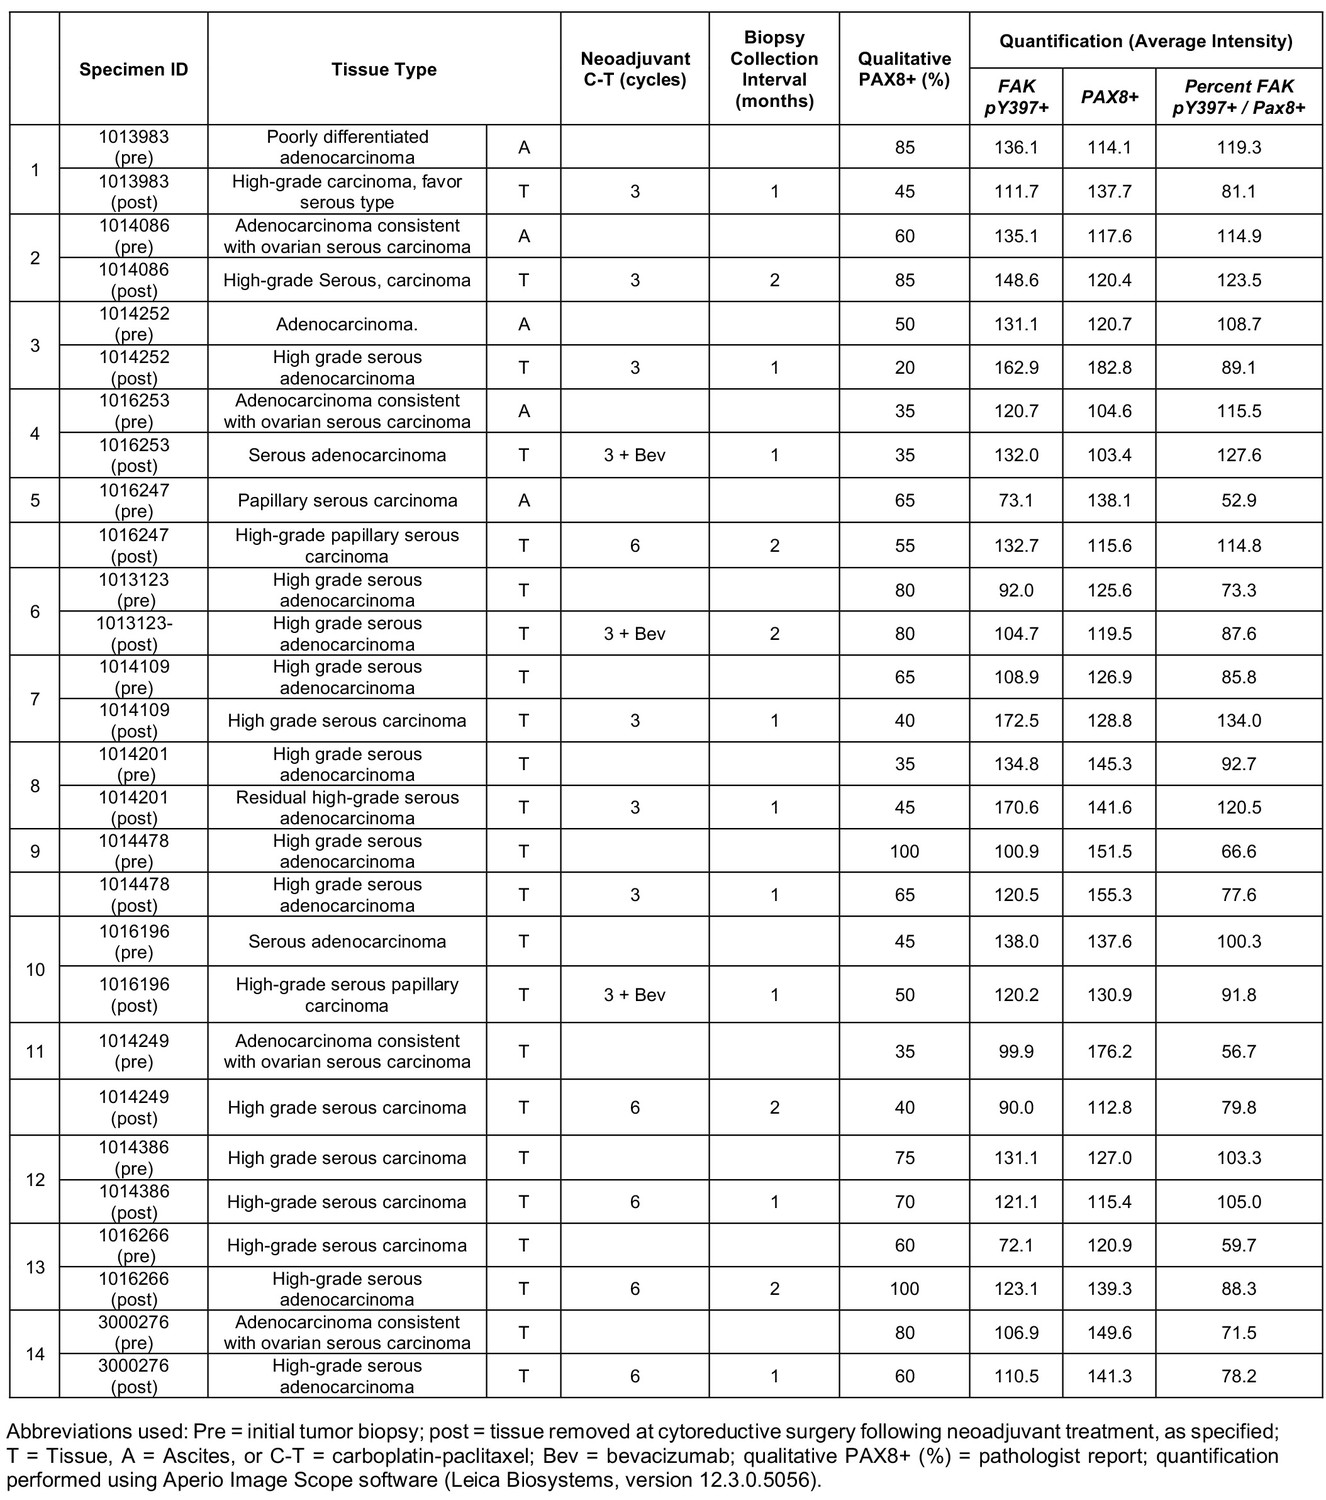
Patient tumor samples pre- and post-neoadjuvant chemotherapy, qualitative IHC score, and summary of quantitative image analyses.
https://doi.org/10.7554/eLife.47327.011
Figure 3—figure supplement 2
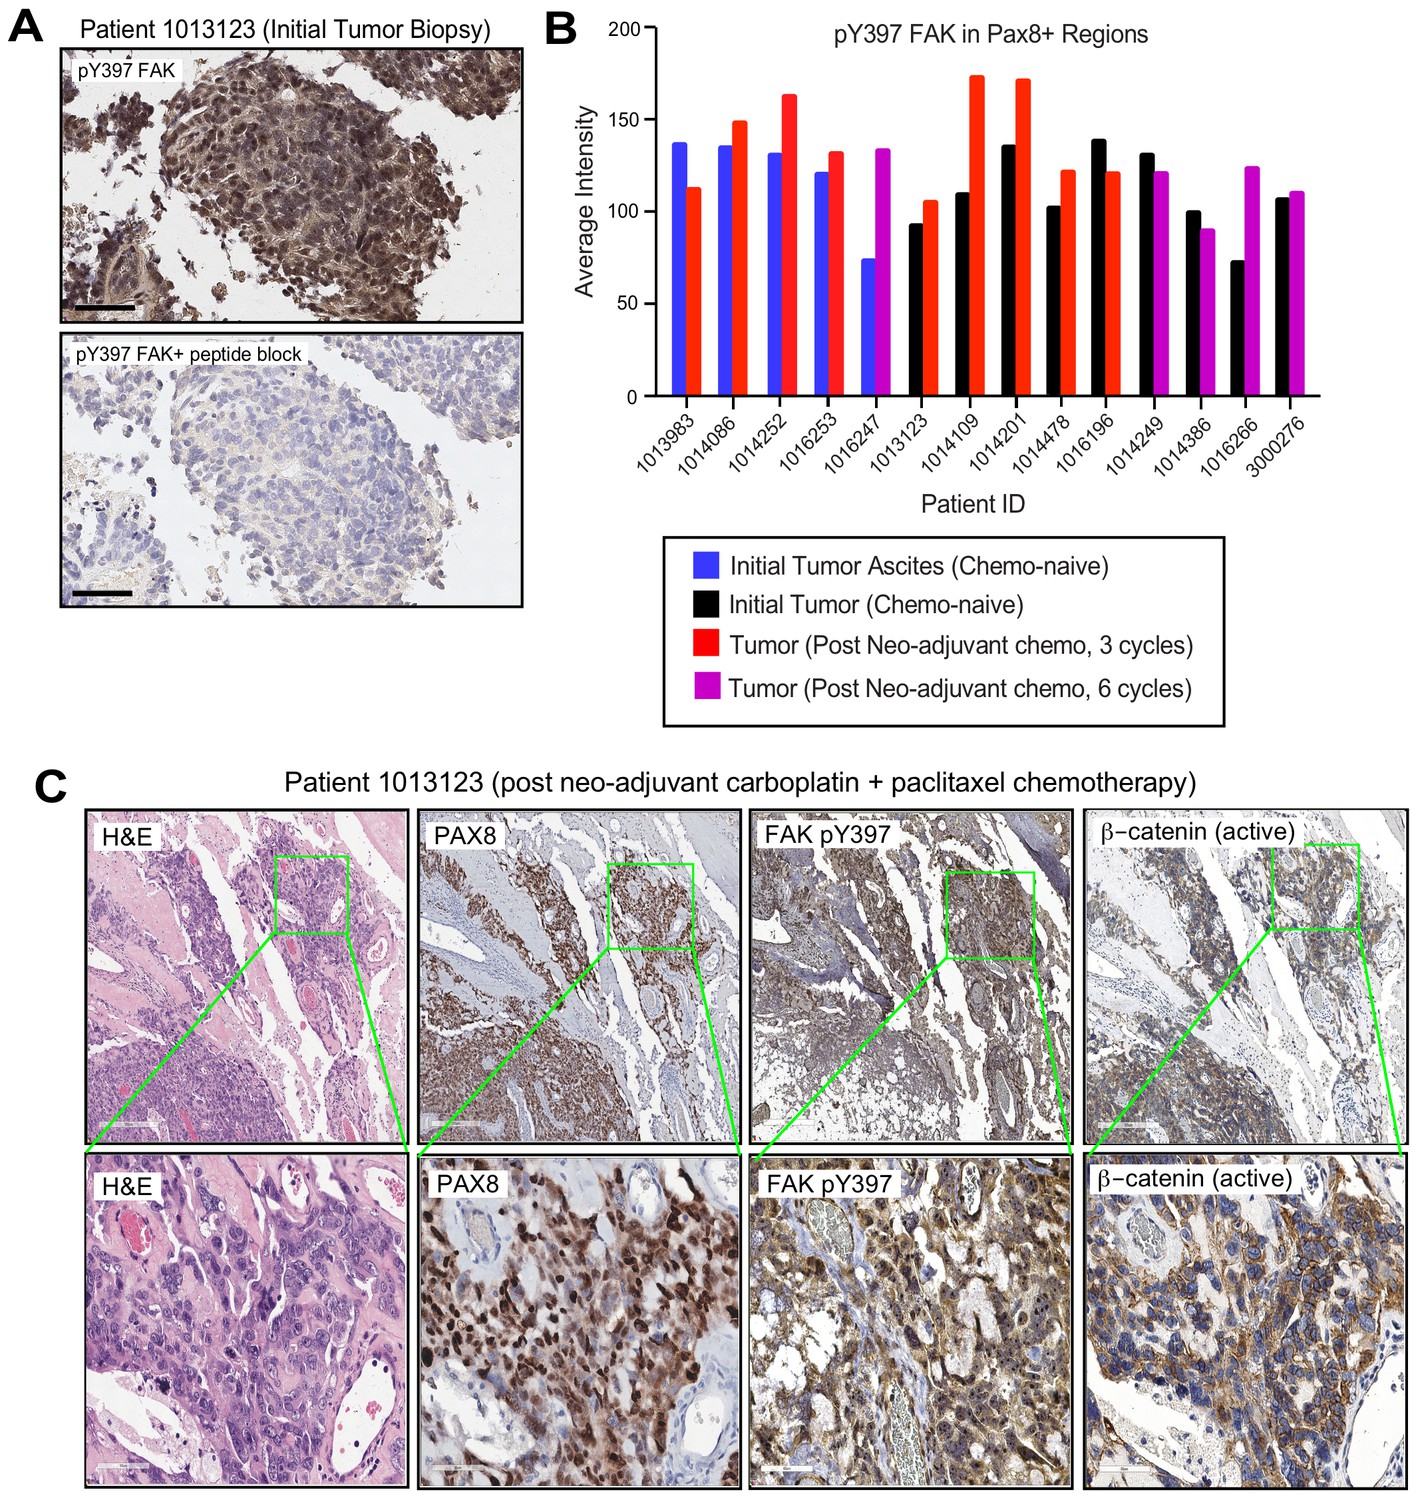
FAK pY397 phosphorylation is maintained in Pax8-positive HGSOC tumors after neo-adjuvant chemotherapy.
(A) pY397 FAK staining with hematoxylin of initial tumor biopsy (patient 1013123) with or without addition of a pY397 FAK phosphopeptide. Scale is 60 µm. (B) Comparison and quantitation of pY397 FAK staining (Aperio software) within Pax8-positive regions of initial (chemo-naive) and post-neoadjuvant chemotherapy tumor biopsies. Values are means, samples are denoted by patient ID from initial tumor biopsy (black bars for solid tumor and blue bars for tumor ascites) or after neo-adjuvant chemotherapy (red is three cycles and purple is six cycles of chemotherapy). 11 regions were analyzed per tumor section. Tumor and chemotherapy details in Figure 3—figure supplement 1. (C) Serial OC tumor sections obtained after neo-adjuvant chemotherapy (patient 1013123, six cycles) were stained with H and E, Pax8, pY397 FAK, and active β-catenin. Counter-stained with hematoxylin. Scale is 200 µm. Inset (green box) region is shown magnified (below, scale is 60 µm).
Figure 4
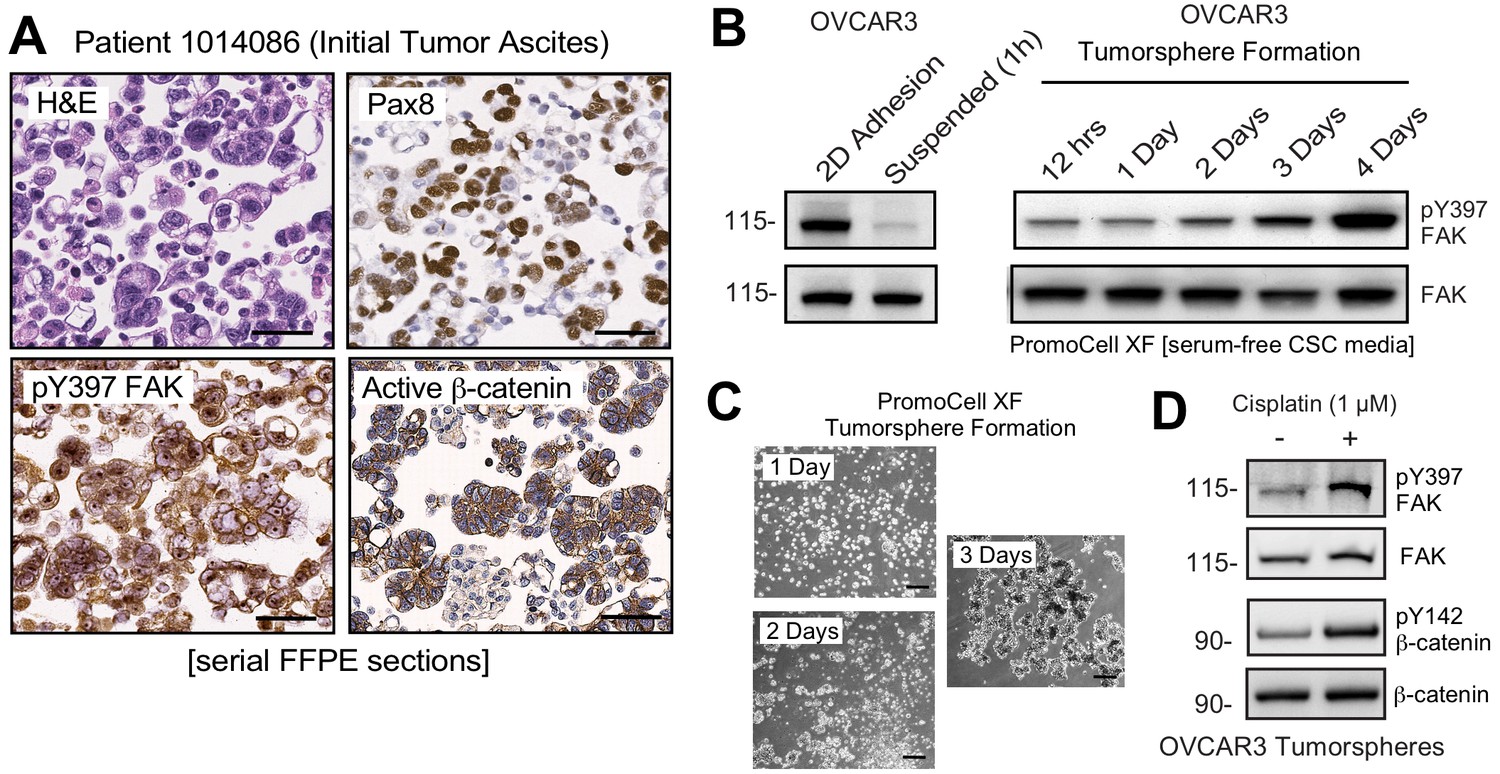
Non-canonical FAK Y397 phosphorylation in tumorspheres.
(A) Paraffin-embedded IHC serial section staining (H and E, Pax8, pY397 FAK, and active β-catenin) of peritoneal ascites cells (tumorspheres) from initial (patient 1014086) biopsy. (B) OVCAR3 lysates from 2D adherent, suspended (1 hr), and cells in anchorage-independent serum-free (PromoCell) conditions facilitating tumorsphere formation were analyzed by total FAK and pY397 FAK immunoblotting. (C) Representative images of OVCAR3 tumorsphere formation at Day 1, Day 2, and Day 3. Scale is 2 mm. (D) OVCAR3 cells as tumorspheres (Day 3) treated with DMSO or CP (1 µM) for 1 hr and protein lysates blotted for pY397 FAK, total FAK, pY142 β-catenin, and total β-catenin.
Figure 5 with 2 supplements
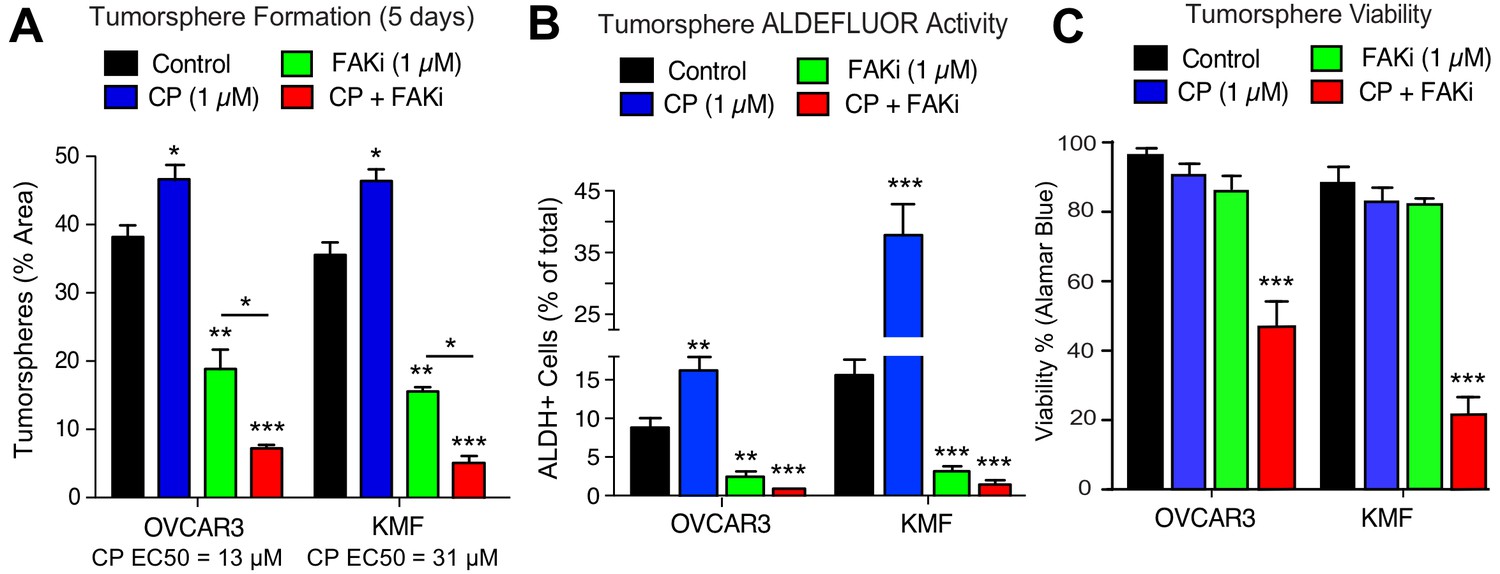
Prevention of CSC phenotypes in vitro by pharmacological FAK inhibition.
Quantification of OVCAR3 and KMF tumorsphere formation (panel A), ALDEFLUOR activity (panel B), and tumorsphere viability (panel C) in the presence of DMSO (control), CP (1 µM), FAKi (VS-4718, 1 µM) or CP plus FAKi for 5 days. Values are means (± SEM, *p<0.05, **p<0.01, ***p<0.001 unpaired T-test) of three independent experiments. Panel C, values are means (± SEM, ***p<0.001, one-way ANOVA) from three independent experiments.
Figure 5—figure supplement 1
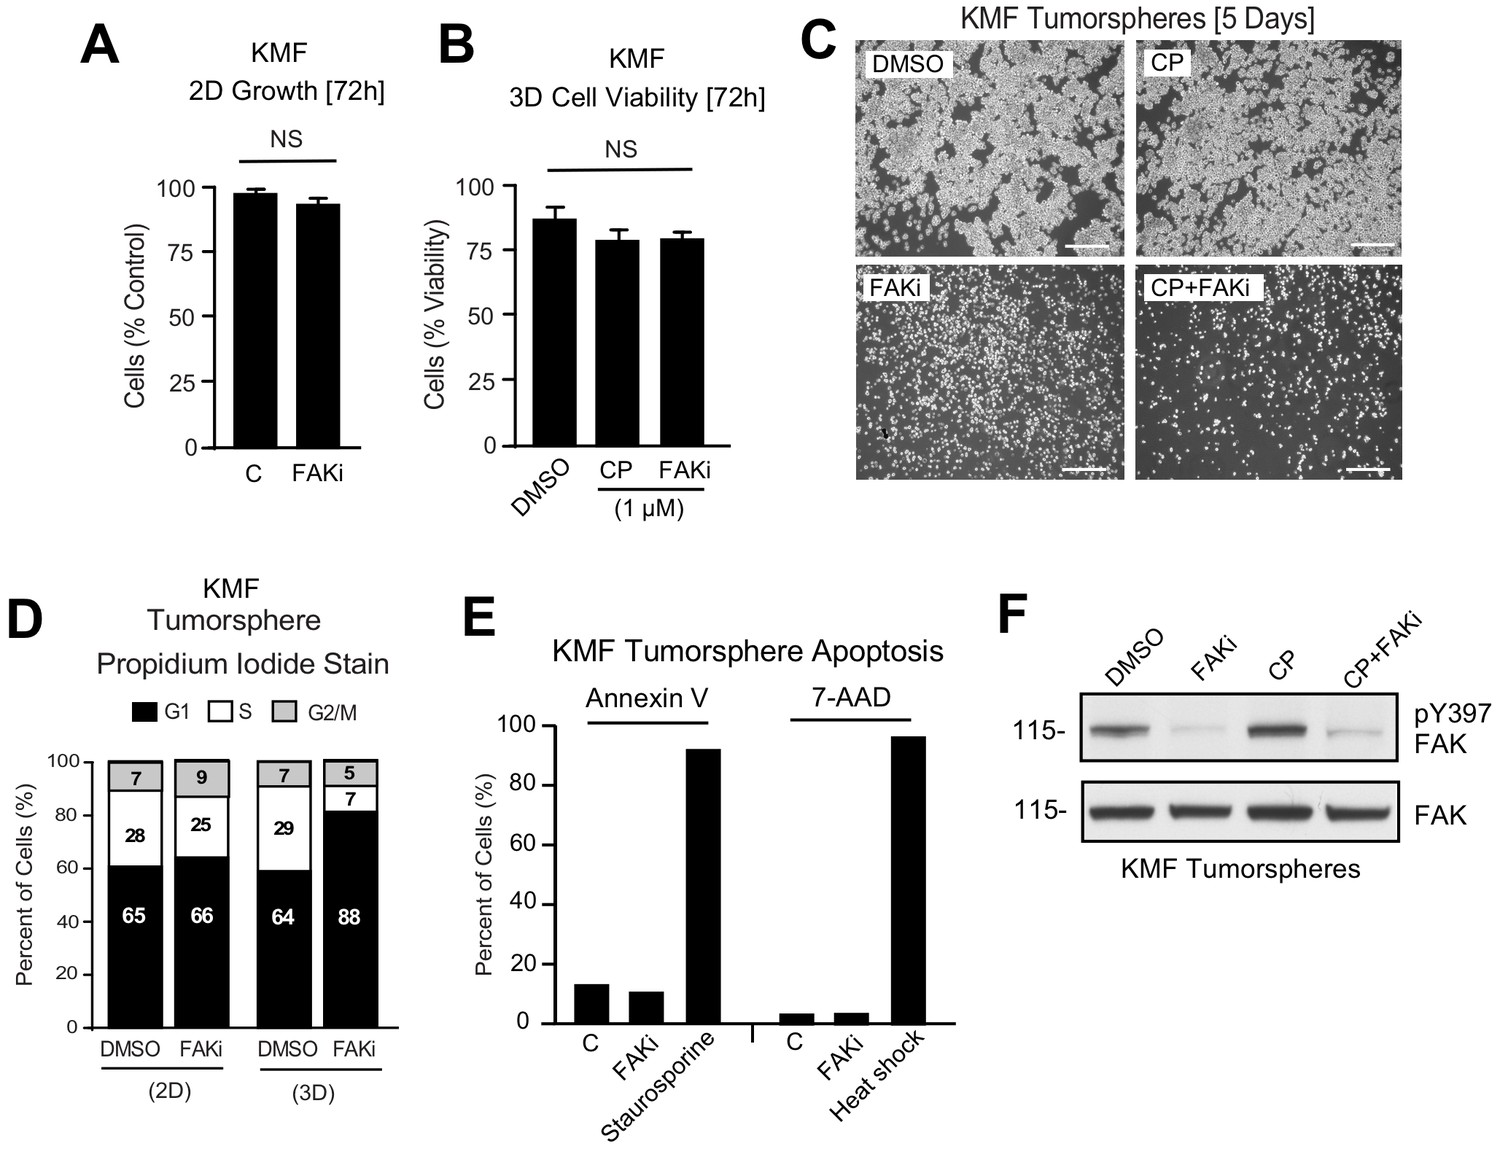
Small molecule FAK inhibition prevents KMF 3D tumorsphere proliferation with effects on cell cycle but not cell apoptosis.
(A) Growth of KMF cells in 2D culture + /- FAKi (VS-4718, 1 µM) over 72 hr. (B) Cell viability (trypan blue exclusion) of KMF cells grown in 3D (PromoCell) in the presence of DMSO, cisplatin (CP, 1 µM), or FAKi (1 µM). (A and B) Values are means + /- SD. NS, not significant. (C) Representative images of KMF cell tumorsphere formation (PromoCell, 5 days) in DMSO, cisplatin (CP, 1 µM), FAKi (1 µM), or CP plus FAKi (1 µM each). Scale is 1 mm. (D) KMF cells grown in 2D or 3D as tumorspheres for 3 days, treated with DMSO or FAKi (VS-4718, 1.0 µM), stained with propidium iodide, and analyzed by flow cytometry. Percentage of cells in G0, G0/G1, S, and G2/M phase of the cell cycle was determined using FlowJo. (E) Percent of KMF tumorsphere cell staining for annexin V or 7-AAD (7-aminoactinomycin D) treated with DMSO (control, (C), FAKi (VS-4718, 1 µM 24 hr), staurosporine (1 µM, 24 hr), or heat shock (100°C, 15 min) by flow cytometry. (D and E) Values are means from two independent experiments. (F) KMF cells grown as 3D tumorspheres for 3 days were treated with DMSO, FAKi (VS-4718, 1.0 µM), cisplatin (CP, 1 µM), or CP plus FAKi (1 µM each) for 2 hr and lysates evaluated by FAK and pY397 FAK immunoblotting.
Figure 5—figure supplement 2

Small molecule FAK inhibition selectively inhibits OVCAR3 3D tumorsphere proliferation with effects on cell cycle but not cell apoptosis.
(A) Growth of OVCAR3 cells in 2D culture + /- FAKi (VS-4718, 1 µM) over 72 hr. (B) Cell viability (trypan blue exclusion) of OVCAR3 cells grown in 3D (PromoCell) in the presence of DMSO, cisplatin (CP, 1 µM), or FAKi (1 µM). (A and B) Values are means + /- SD. NS, not significant. (C) Representative images of OVCAR3 tumorsphere formation (PromoCell, 5 days) in DMSO, cisplatin (CP, 1 µM), FAKi (1 µM), or CP plus FAKi (1 µM each). Scale is 1 mm. (D) OVCAR3 cells grown in 2D or 3D as tumorspheres for 3, treated with DMSO or FAKi (VS-4718, 1 µM), stained with propidium iodide, and analyzed by flow cytometry. Percentage of cells in G0, G0/G1, S, and G2/M phase of the cell cycle was determined using FlowJo. (E) Percent of OVCAR3 tumorsphere cell 7-AAD (7-aminoactinomycin D) staining when treated with DMSO (control, (C), FAKi (VS-4718, 1 µM 24 hr) or heat shock (100°C, 15 min) by flow cytometry. (D and E) Values are means from two independent experiments.
Figure 6 with 3 supplements
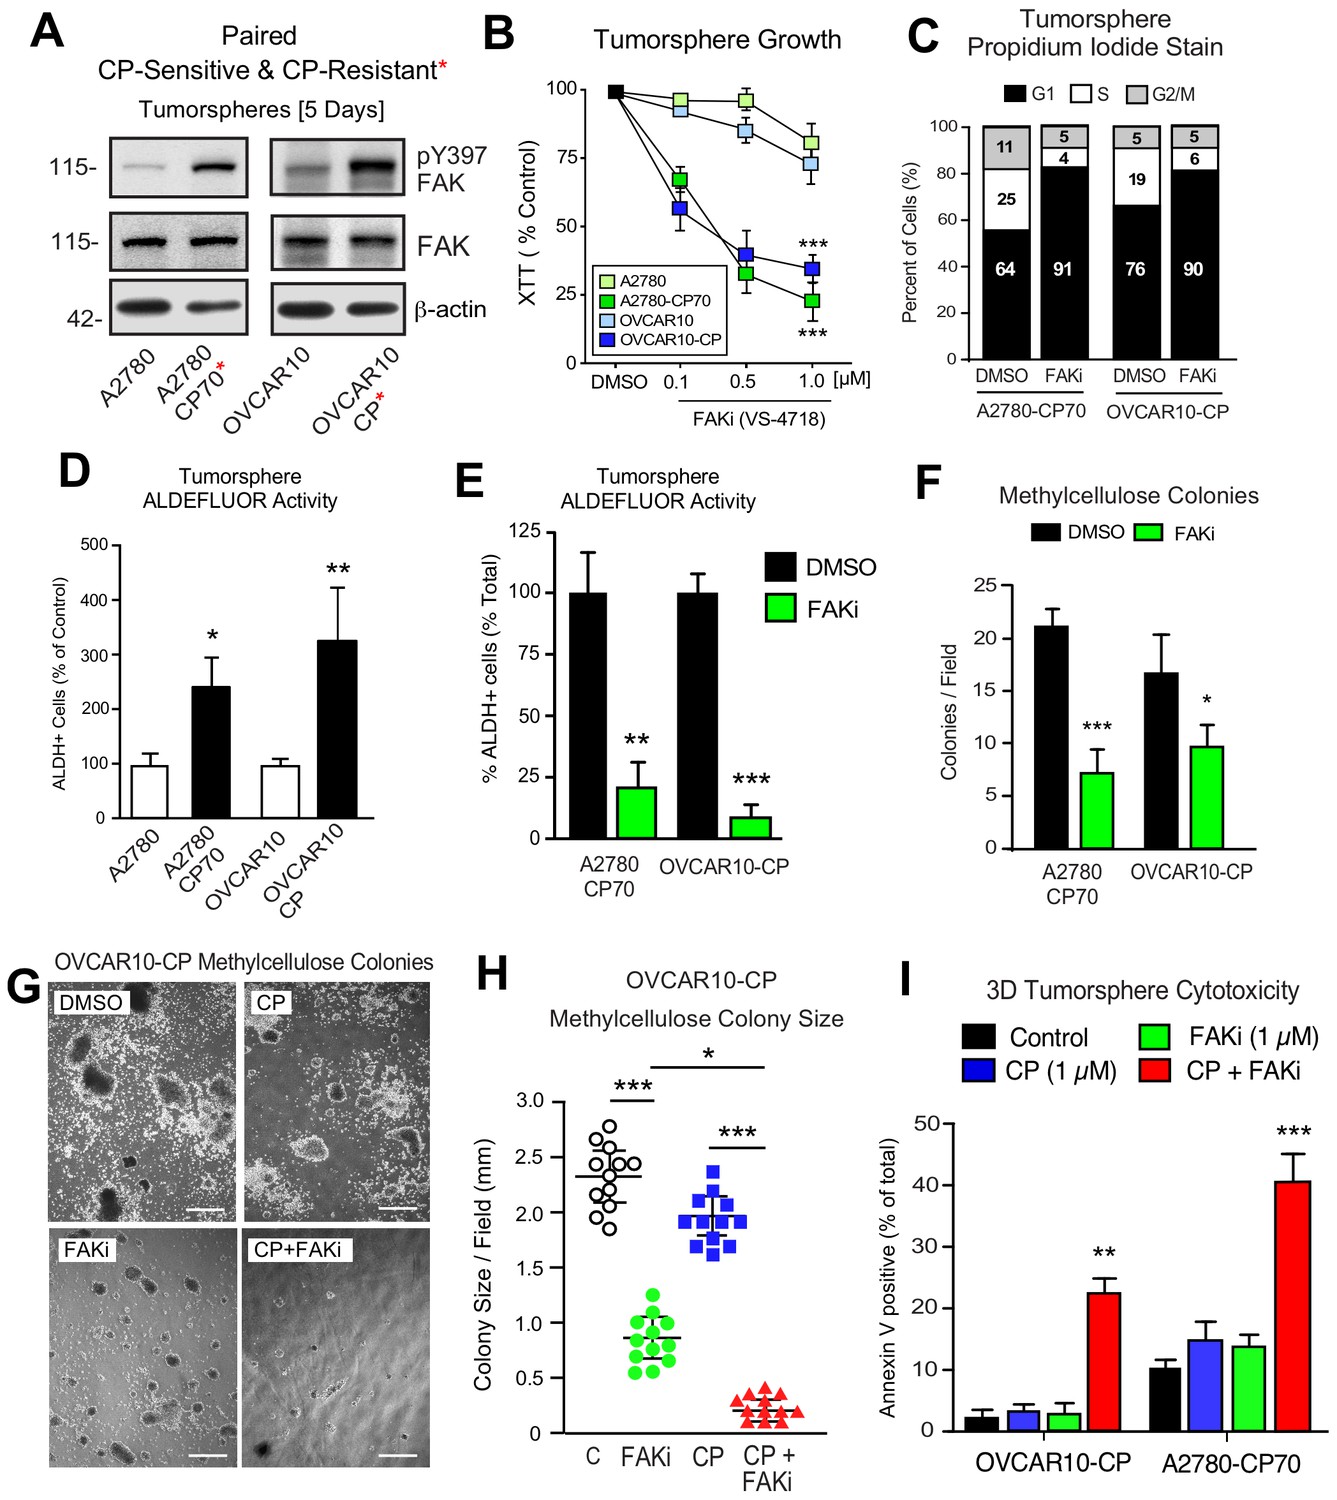
Acquired FAK dependence for CP-resistant tumorsphere growth.
(A) Human A2780, A2780-CP70, OVCAR10, and OVCAR10-CP tumorsphere lysates immunoblotted for FAK pY397, total FAK, and actin. (B) Growth of A2780, OVCAR10, A2780-CP70, or OVCAR10-CP cells as tumorspheres in the presence of FAKi (VS-4718, 0.1 to 1.0 µM) for 4 days. Values are means (± SEM, ***p<0.001, one-way ANOVA) from two independent experiments. (C) A2780-CP70 or OVCAR10-CP cells grown as tumorspheres (3 days) were treated with DMSO or FAKi (VS-4718, 1 µM) for 24 hr, stained with propidium iodide, and analyzed by flow cytometry. Shown is percent of cells in G0/G1, S, or G2/M phase of the cell cycle. (D) Quantitation of A2780-CP70 and OVCAR10-CP colony formation in methylcellulose (21 days) with DMSO (control) or FAKi (VS-4718, 1 µM). Values are means (± SEM, *p<0.05, ***p<0.001, unpaired T-test) from two independent experiments. (E) A2780-CP70 and OVCAR10-CP tumorsphere ALDEFLUOR activity treated with DMSO or FAKi (VS-4718, 1 µM) for 24 hr. Values are means (± SEM, **p<0.01, ***p<0.001, one-way ANOVA compared to DMSO) for three independent experiments. (F) Quantitation of A2780-CP70 and OVCAR10-CP methylcellulose colony formation (21 days). Values are means (± SEM, *p<0.05, ***p<0.001, unpaired T-test) from two independent experiments. (G and H) Representative OVCAR10-CP methylcellulose colony formation (21 days) (panel G) and colony size (panel H) in the presence of DMSO (control), CP (1 µM), FAKi (1 µM), or CP plus FAKi. Scale is 2.5 mm. Values are means (± SEM, *p<0.05, ***p<0.001, one-way ANOVA) from two independent experiments. (I) A2780-CP70 and OVCAR10-CP tumorsphere cytotoxicity (annexin V) in the presence of DMSO (control), CP (1 µM), FAKi (1 µM), or CP plus FAKi. Values are means (± SEM, **p<0.01, one-way ANOVA) from three independent experiments.
Figure 6—figure supplement 1
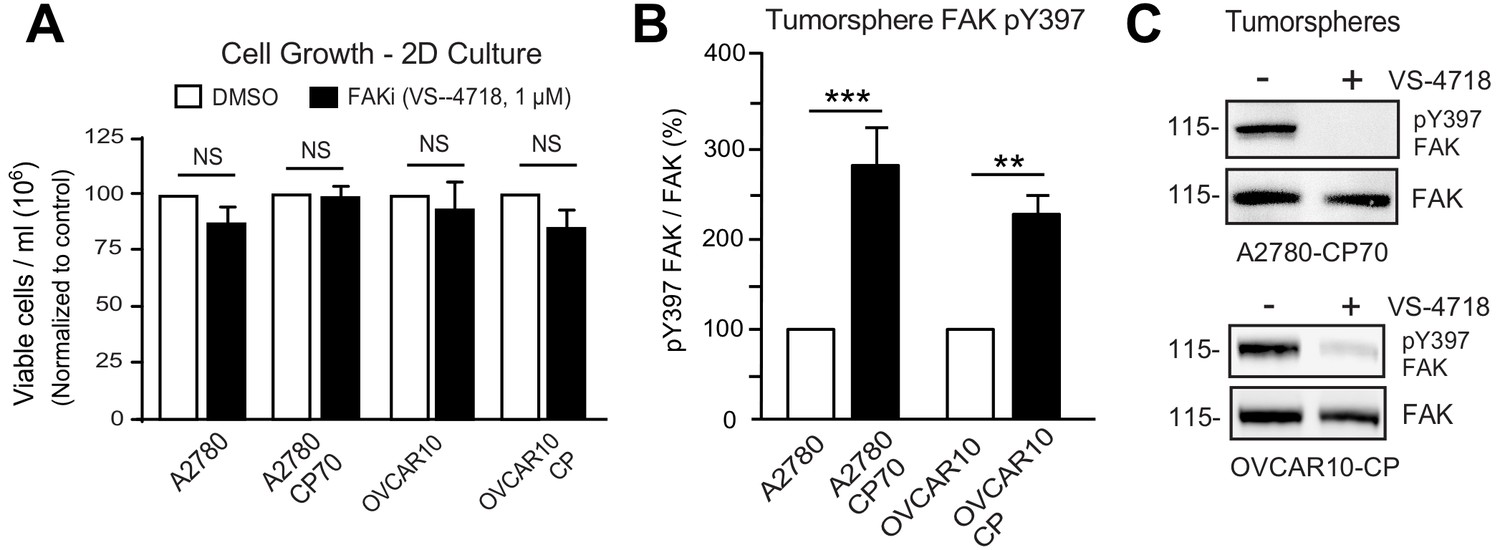
Constitutively elevated FAK Y397 phosphorylation in CP-resistant tumorspheres.
(A) Growth of CP-sensitive (A2780 and OVCAR10) or CP-resistant (A2780-CP70 and OVCAR10-CP) cells in 2D culture + /- FAKi (VS-4718, 1 µM) over 72 hr. Values are means + /- SD from two independent experiments. NS, not significant. (B) The indicated cells were grown as tumorspheres (5 days), protein lysates analyzed by total FAK and pY397 FAK immunoblotting. LiCor quantitation of pY397 FAK to total FAK values are means + /- SD from three independent experiments (**p<0.01 and ***p<0.001). (C) A2780-CP70 and OVCAR10-CP tumorspheres [5 days] were treated with DMSO or FAKi (VS-4718, 1 µM) for 1 hr and lysates analyzed by total FAK and pY397 FAK immunoblotting.
Figure 6—figure supplement 2

Platinum-resistant A2780-CP70 exhibit FAK-dependent growth.
(A) Representative images of A2780 and A2780-CP70 methylcellulose colony formation (21 days) + /- FAKi (1 µM VS-4718). Scale is 2 mm. (B) Quantitation of A2780 and A2780-CP70 colony formation from panel A. Values are means + /- SD from two independent experiments (NS, not significant and ***p<0.001). (C) A2780 and A2780-CP70 cells grown as 3D tumorspheres for 3 days, treated with DMSO or FAKi (VS-4718, 1 µM), stained with propidium iodide, and analyzed by flow cytometry. Percentage of cells in G0, G0/G1, S, and G2-M phase of the cell cycle was determined using FlowJo. (D) Quantitation of cyclin D1 protein levels by immunoblotting of cell lysates from tumorsphere experiment in panel F. Values are normalized to DMSO-treated control and are means + /- SD from three independent experiments (*p<0.05 and **p<0.01). (E) Representative flow cytometry histograms of A2780-CP70 spheroids treated with DMSO (gray) 1 µM VS-4718, 5 µM cisplatin, VS-4718 plus cisplatin, or 1 µM staurosporine for 18 hr (orange) and analyzed for annexin V binding.
Figure 6—figure supplement 3
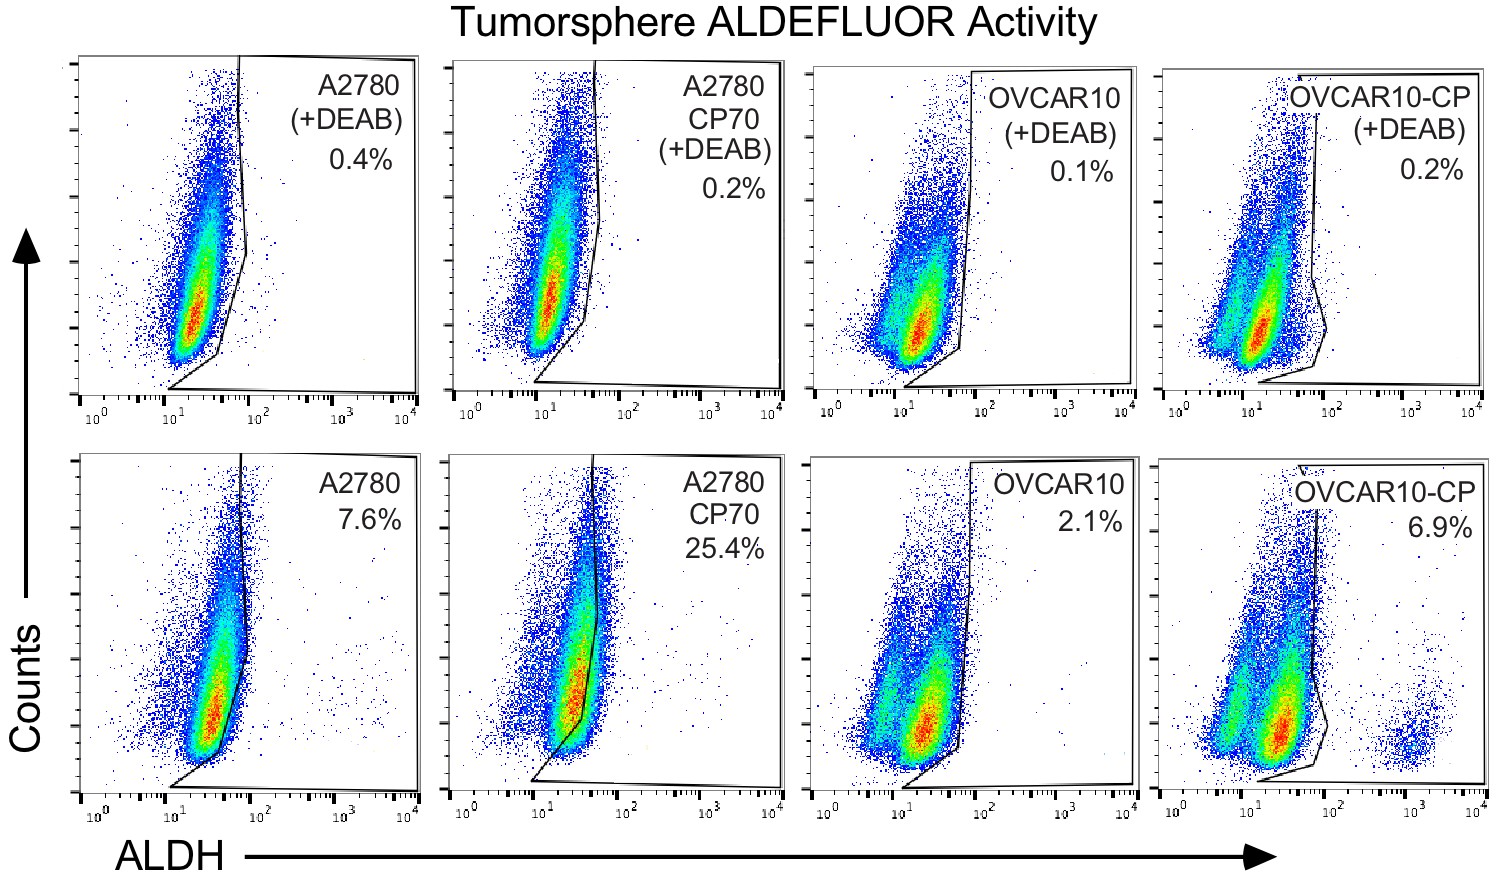
ALDEFLUOR assays.
Representative flow cytometry profiles of A2780, A2780-CP70, OVCAR10, and OVCAR10-CP cells grown as tumorspheres with or without N,N-diethylaminobenzaldehyde (DEAB) and analyzed by ALDEFLUOR assay to identify populations of ALDH-bright (ALDH+) cells. Percent of total ALDH+ cells for each is indicated.
Figure 7 with 2 supplements
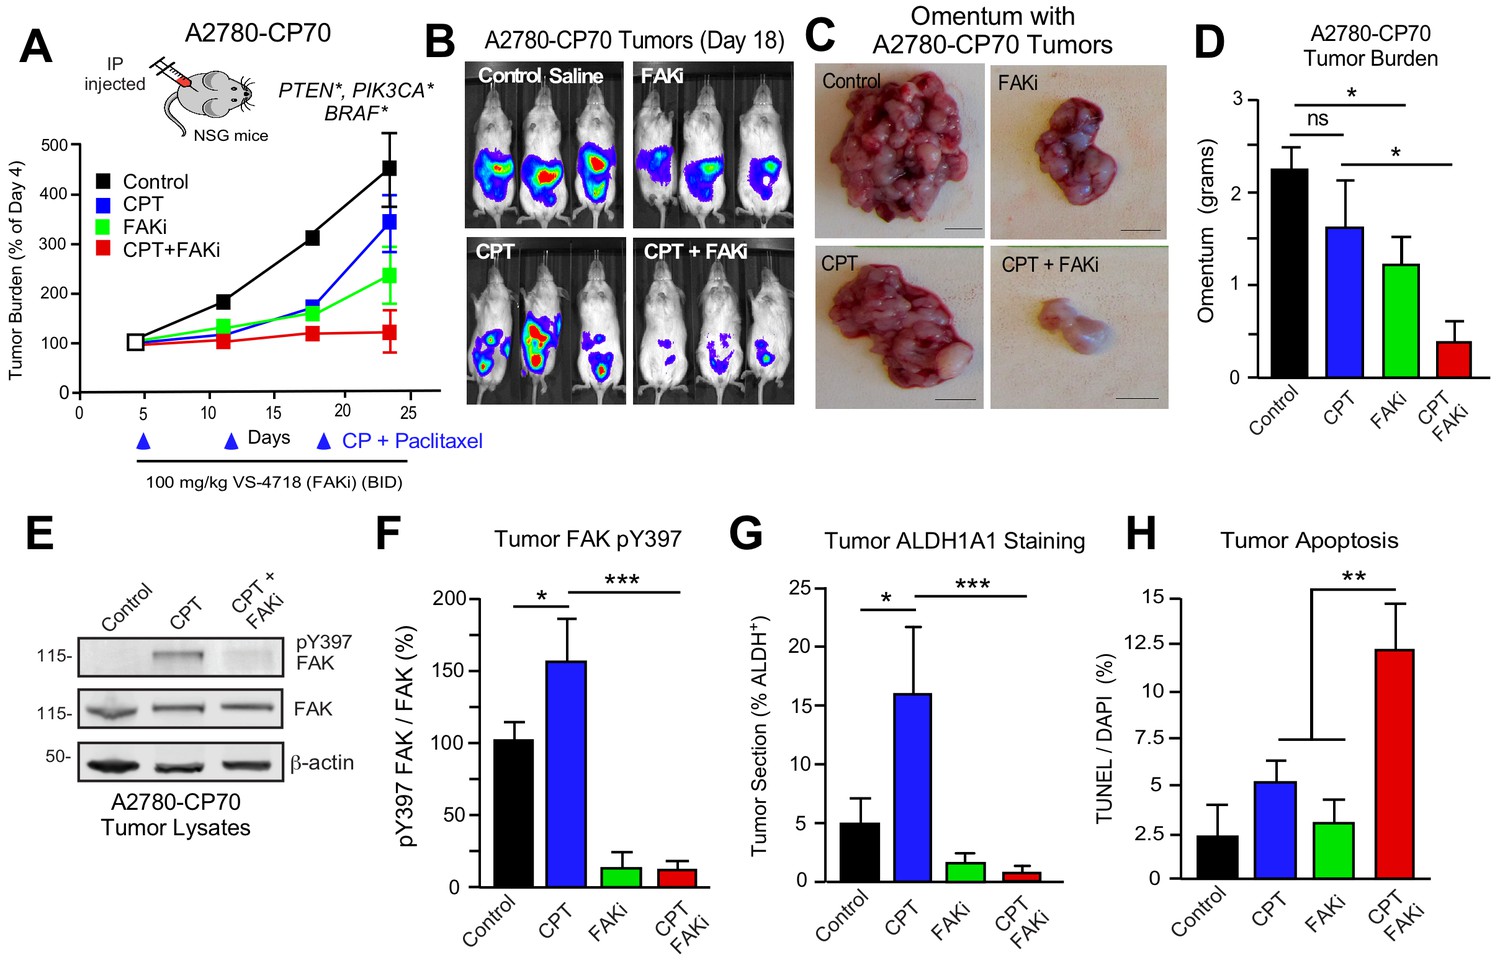
FAK inhibition sensitizes CP-resistant tumors chemotherapy-induced apoptosis.
(A) Experimental schematic and IVIS imaging of labeled A2780-CP70 cells IP injected into NSG mice (randomized at Day 5). Experimental groups: control saline (black) injection on Days 5, 12, and 19; VS-4718 by oral gavage (green, 100 mg/kg, BID); CPT chemotherapy injection (blue, 3 mg/kg cisplatin and 2 mg/kg paclitaxel) on Days 5, 12, and 19; and VS-4718 plus CPT combined administration (red). IVIS imaging was performed on Days 4, 11, 18, and 23. Tumor burden is expressed as percent of Day 4. (B) Representative IVIS images of A2780-CP70 tumor burden on Day 18. (C) Representative images of omentum with A2780-CP70 tumors at Day 24. Scale is 0.5 cm. (D) Omentum-associated A2780-CP70 tumor mass (n = 6,± SEM *p<0.05, one-way ANOVA) from each treatment group. (E) A2780-CP70 tumor lysates immunoblotted for FAK pY397, FAK, and actin. (F) Ratio of pY397 FAK to total FAK levels in tumor lysates by immunoblotting. Values are means (± SEM *p<0.05, ***p<0.001, one-way ANOVA) of three tumors per experimental group. Control set to 100. (Gand H) Percent ALDH-1A1-positive immunofluorescent A2780-CP70 tumor staining or apoptosis (TUNEL and Hoescht 33342 staining) in A2780-CP70 tumors. Values are means (± SEM, two independent tumors, five random fields per tumor at 20X, *p<0.05, **p<0.01, ***p<0.001 one-way ANOVA).
Figure 7—figure supplement 1
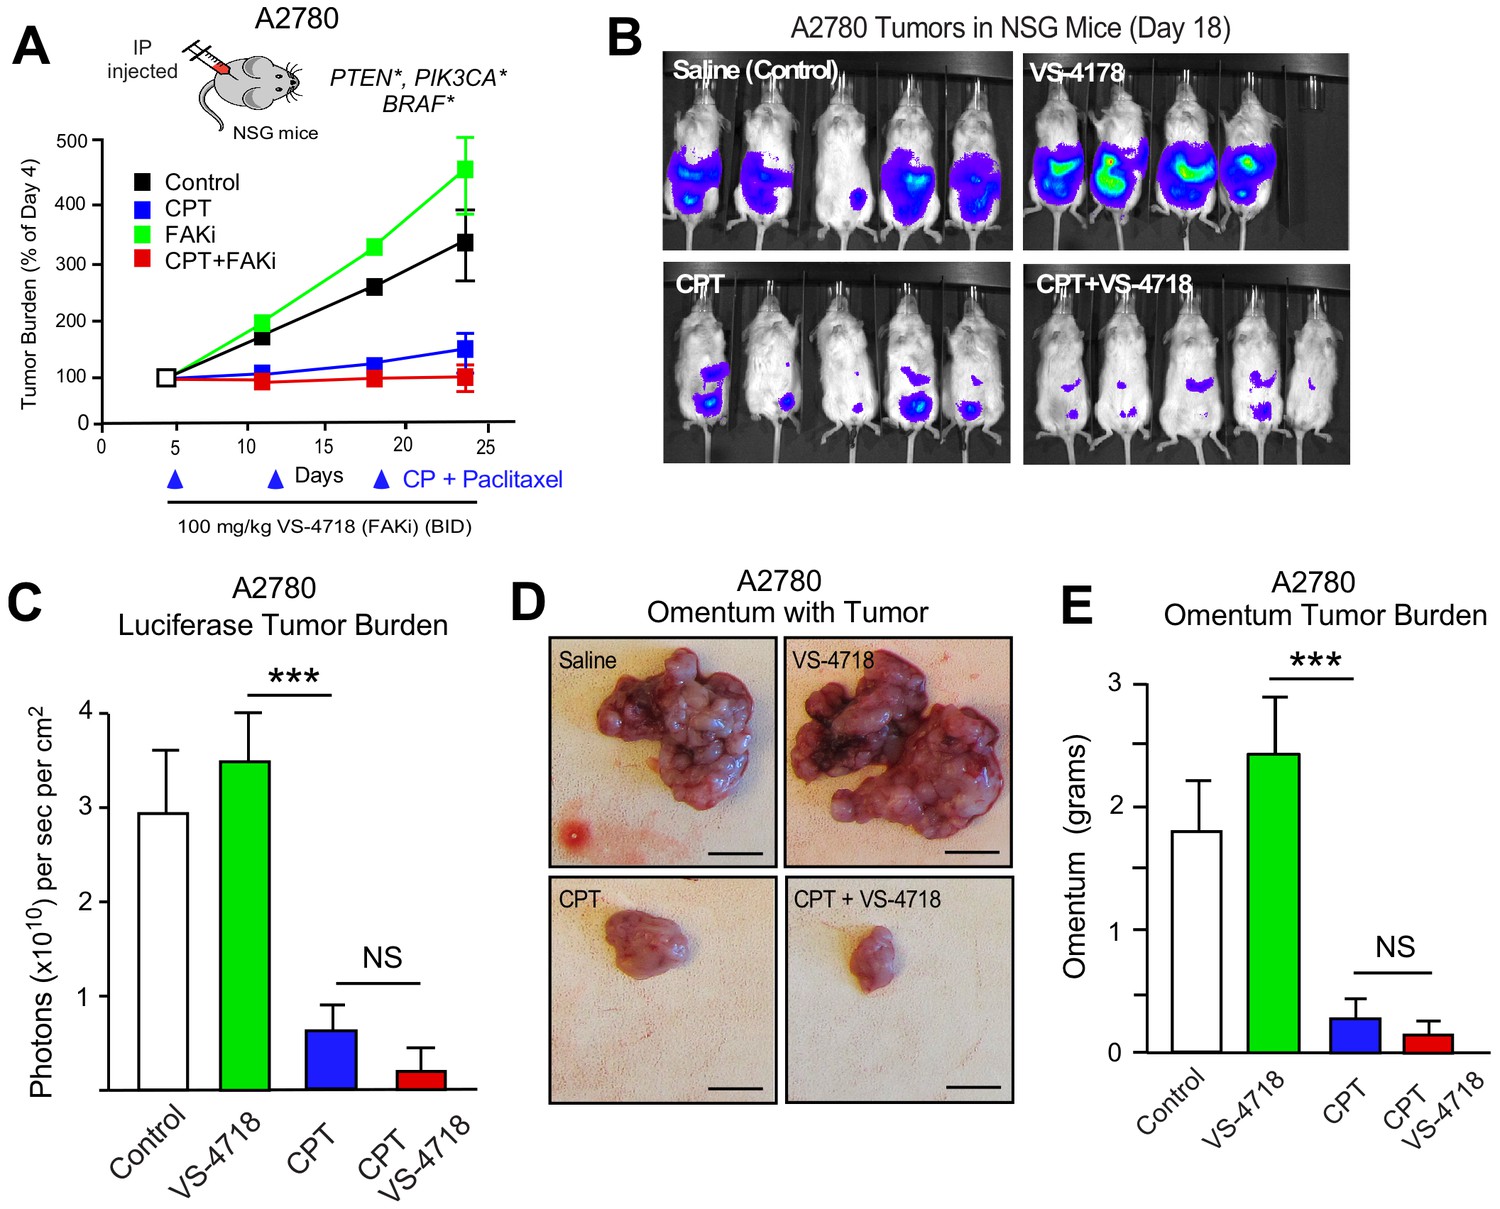
Inhibition of A2780 tumor growth by cisplatin-paclitaxel (CPT) chemotherapy.
(A) Experimental schematic: Luciferase- and dTomato-expressing A2780 (*containing mutations in PTEN, PI3KCA, and BRAF) cells were injected intraperitoneally into immune-deficient mice and randomized at Day 5. Experimental groups were as follows: saline injection on Days 5, 12, and 19; VS-4718 alone (100 mg/kg, BID, oral gavage); CPT chemotherapy injection alone (3 mg/kg cisplatin and 2 mg/kg paclitaxel) on Days 5, 12, and 19; and VS-4718 plus CPT. IVIS imaging was performed on experimental Days 4, 11, 18, and 23. Tumor burden is expressed as percent of Day 4. (B) Representative images of tumor burden visualized by luciferase activity on Day 18. (C) Quantitation of tumor burden as measured by luciferase activity at Day 18. (D) Representative images of omentum with tumor from each treatment group at Day 24. Scale is 0.5 cm. (E) Omentum-associated tumor mass. (C and E) Values are means ± SEM (n = 6, ***p<0.001) from each treatment group. NS, not significant.
Figure 7—figure supplement 2
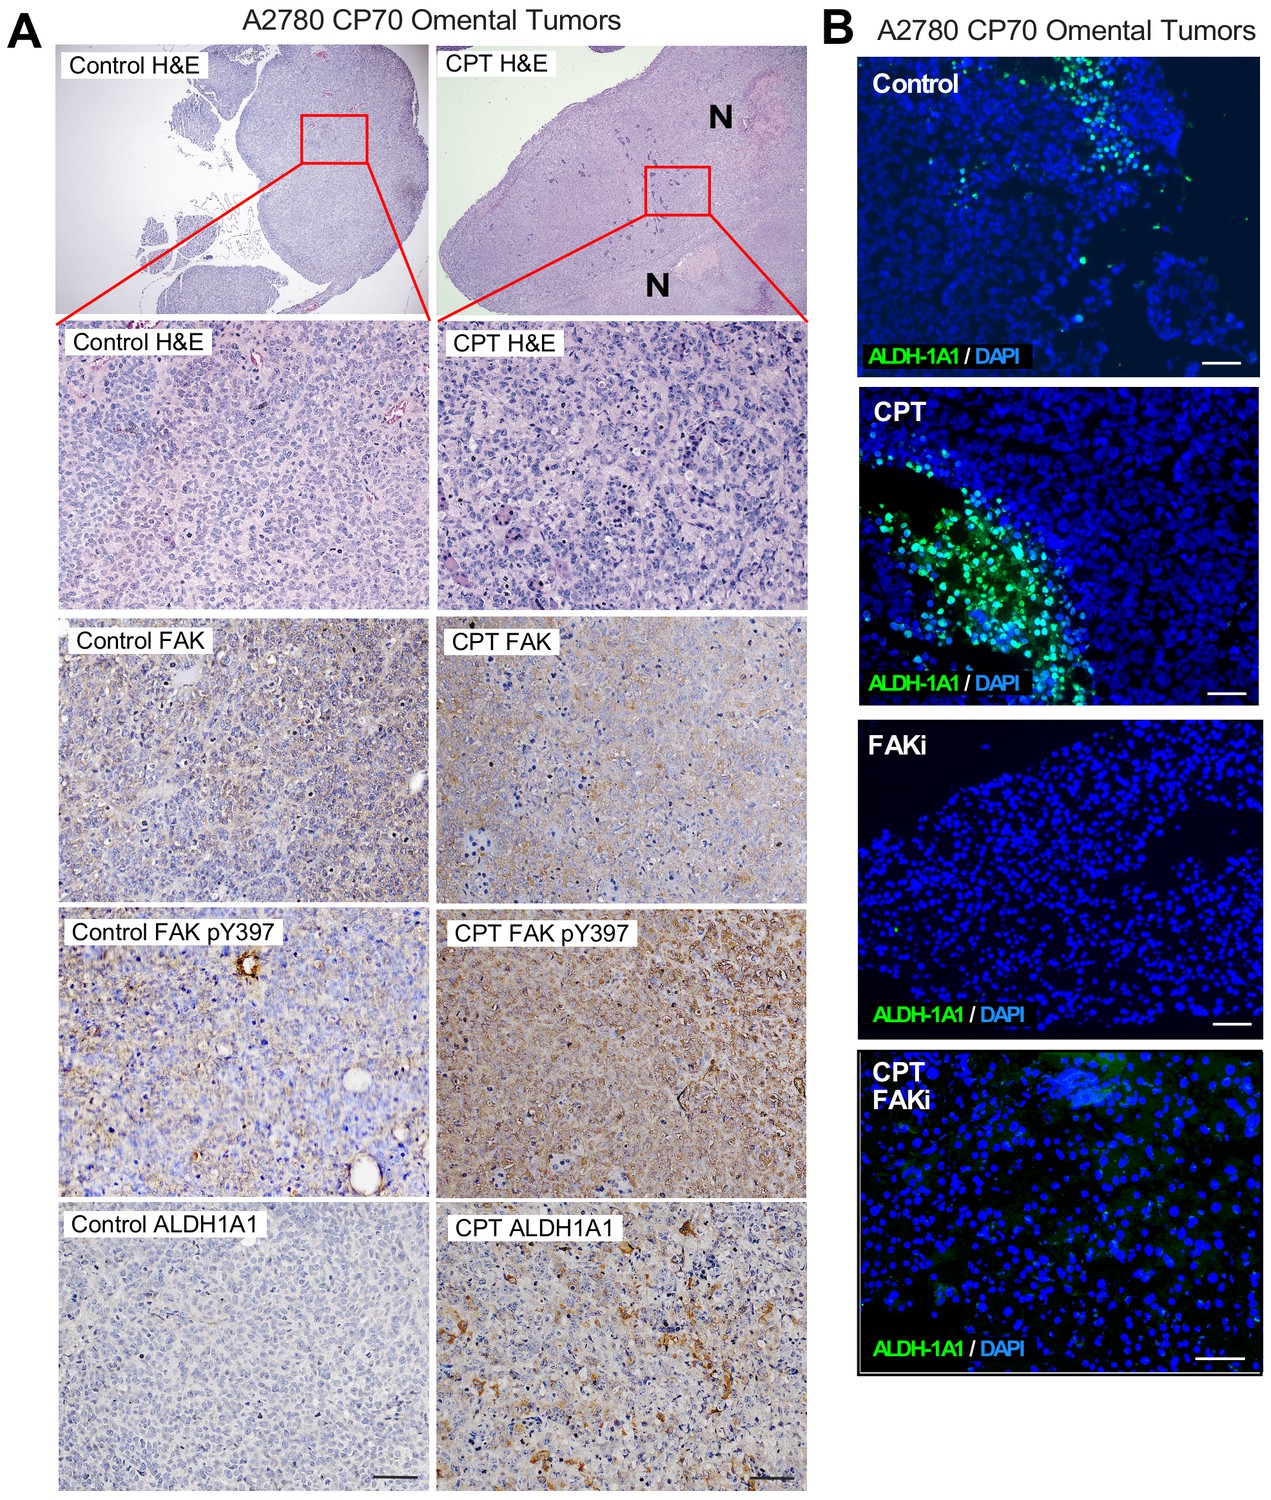
Elevated FAK Y397 phosphorylation and ALDH staining in non-necrotic regions of CPT-treated mice with A2780-CP70 tumors.
(A) Representative immunohistochemical staining of paraffin-embedded omental tumor sections from control or CPT-treated A2780-CP70 tumors. Shown is 4X H and E (top) with a 20X magnification of region denoted with red box. Serial sections representing this H and E stained region were analyzed for total FAK, FAK pY397, and ALDH-1A1 staining (brown) with hematoxylin (blue) counter stain. N = Necrotic. Scale is 100 µm. (B) Representative immunofluorescent staining with antibodies to ALDH-1A1 (green) and DAPI (blue) from control, CPT, FAKi, or CPT plus FAKi treated mice with A2780-CP70 tumors. Scale is 100 µm.
Figure 8 with 2 supplements
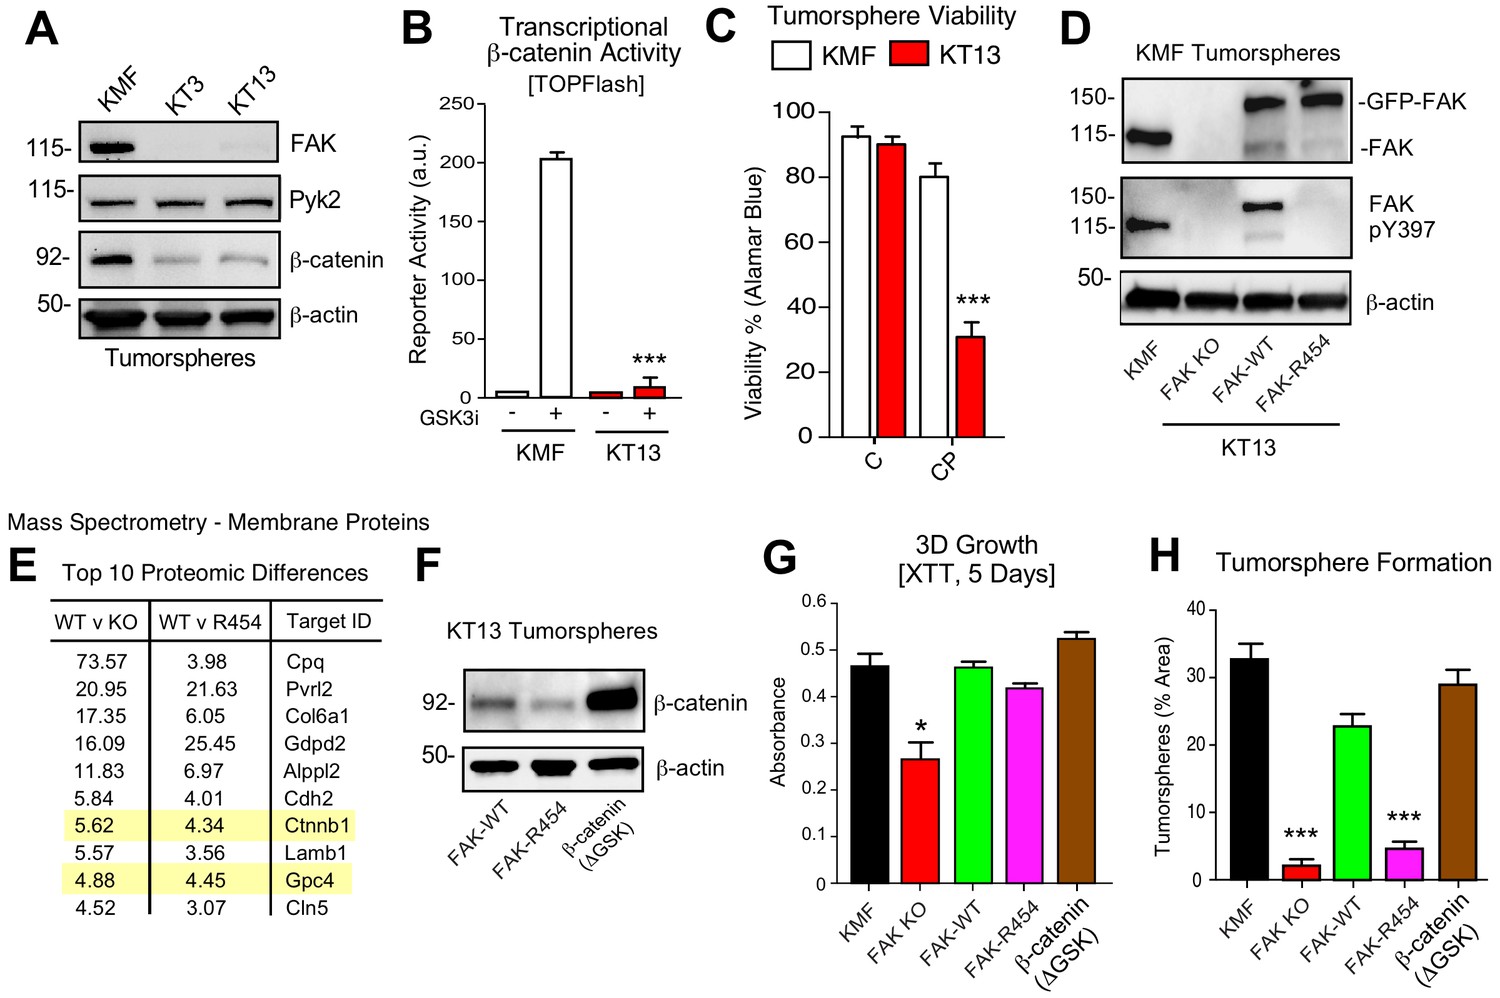
KMF FAK KO and re-expression link intrinsic FAK activity to β-catenin and tumorsphere formation.
(A) Immunoblotting of KMF and CRISPR-mediated FAK KO clones KT3 and KT13 cell lysates for FAK, Pyk2, β-catenin, and actin. (B) KMF and FAK KO KT13 cell viability treated with DMSO (control) or CP (1 µM) after 72 hr as measured by Alamar Blue. Values are means (± SEM, *p<0.05, **p<0.01, ***p<0.001, one-way ANOVA with Fisher’s LSD multiple comparison test) for three independent experiments. (C) β-catenin transcriptional reporter activity (TOPFlash) in transfected KMF and KT13 FAK KO cells + /- GSK3β inhibitor. Values are arbitrary units (***p<0.001, unpaired T-test, two independent experiments). (D) Immunoblotting for pY397 FAK, FAK, and actin in lysates of KMF, FAK KO, GFP-FAK-WT, and GFP-FAK-R454 re-expressing cells. (E) Top 10 proteomic differences (fold-change) detected by mass spectroscopy of membrane associated proteins in KT13 FAK KO, GFP-FAK-WT, and GFP-FAK R454 re-expressing cells. (F) Immunoblotting for β-catenin and actin in lysates of KT13 FAK KO cells stably expressing GFP-FAK-WT, GFP-FAK-R454, or β-catenin (ΔGSK). (Gand H) XTT metabolic activity (panel G) or tumorsphere formation (panel H) of KMF, KT13 FAK KO, or the indicated reconstituted cells in PromoCell after 5 days. Values are means (± SEM, *p<0.05, ***p<0.001, one-way ANOVA with a Tukey’s multiple comparisons test) from 2 (panel G) or 3 (panel H) independent experiments.
-
Figure 8—source data 1
KMF FAK KO clone KT13 exome sequencing variants.
- https://doi.org/10.7554/eLife.47327.027
-
Figure 8—source data 2
Summary of mass spectrometry-detected proteomic changes between KMF FAK KO, FAK-WT, and FAK kinase-inactive (K454R) re-expressing cells grown as tumorspheres.
- https://doi.org/10.7554/eLife.47327.028
Figure 8—figure supplement 1
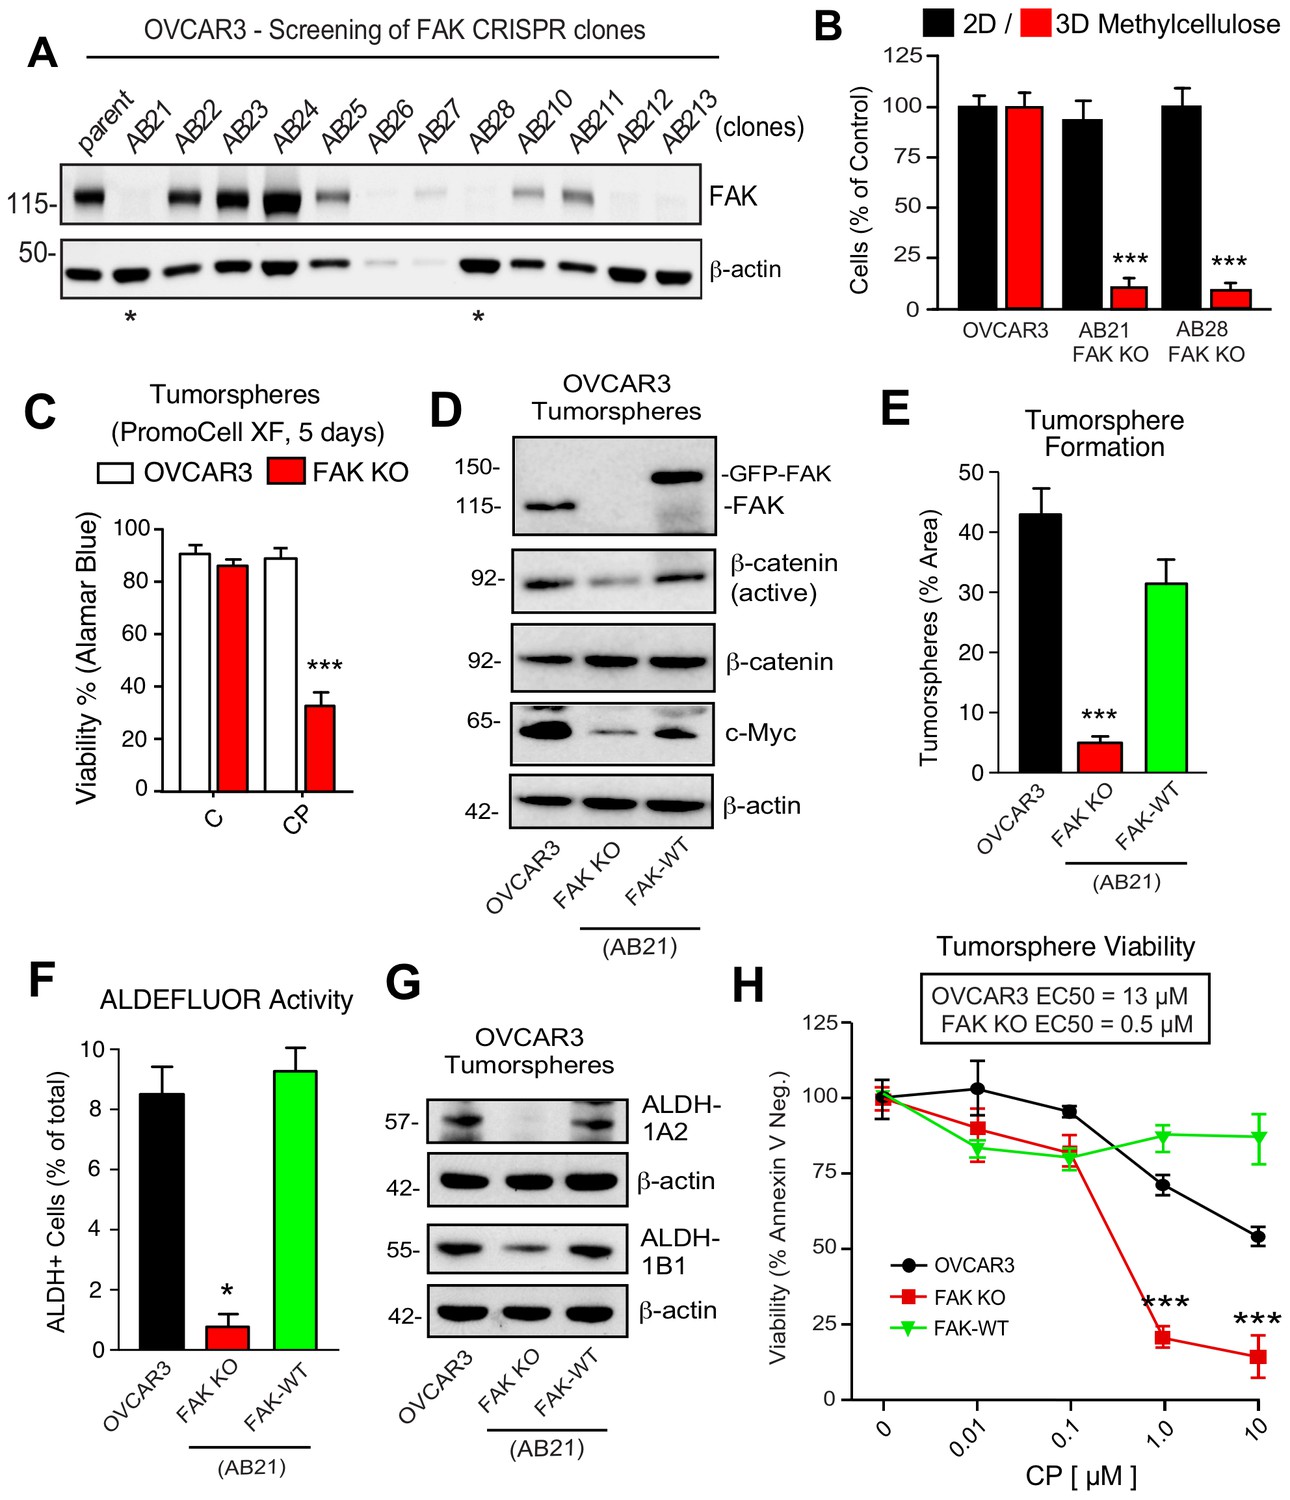
OVCAR3 CRISPR-mediated FAK KO and re-expression.
(A) Immunoblotting for FAK and actin in OVCAR3 lysates and identification of FAK KO clones (AB21 and AB28 are starred). (B) Growth of OVCAR3 parental, AB21, and AB28 cells in 2D culture (black bars) or enumeration of colonies in methylcellulose after 14 days (red bars). Values are means as percent of OVCAR3 control (± SEM, ***p<0.001, one-way ANOVA or NS, not significant) from two independent experiments. (C) Cell viability treated with DMSO (control) or CP (1 µM) after 72 hr as measured by AlamarBlue. Values are means (± SEM, *p<0.05, ***p<0.001) for three independent experiments. (D) Immunoblotting for FAK, active β-catenin, β-catenin, Myc, and actin in the indicated cell lysates from 3D conditions. (E) Tumorsphere formation (5 days). (F) ALDEFLUOR activity. (E and F) Values are means (± SEM, n = 2, *p<0.05, ***p<0.001, one-way ANOVA with a Tukey’s multiple comparisons test) from three (panel E) or four (panel F) independent experiments. (G) Immunoblotting for ALDH-1A2, ALDH-1B1, or actin in the indicated cell lysates. (H) Cytotoxicity (percent Annexin V negative) of OVCAR3 (black circles), OVCAR3 FAK KO (red squares), and OVCAR3 FAK KO + GFP-FAK-WT (green triangles) cells in PromoCell treated with increasing CP concentrations for 5 days. Values are means (± SEM, ***p<0.001, two-way ANOVA with a Bonferroni’s multiple comparisons test) from three independent experiments. EC50 values were determined independently and calculated using Prism (Graphpad).
Figure 8—figure supplement 2
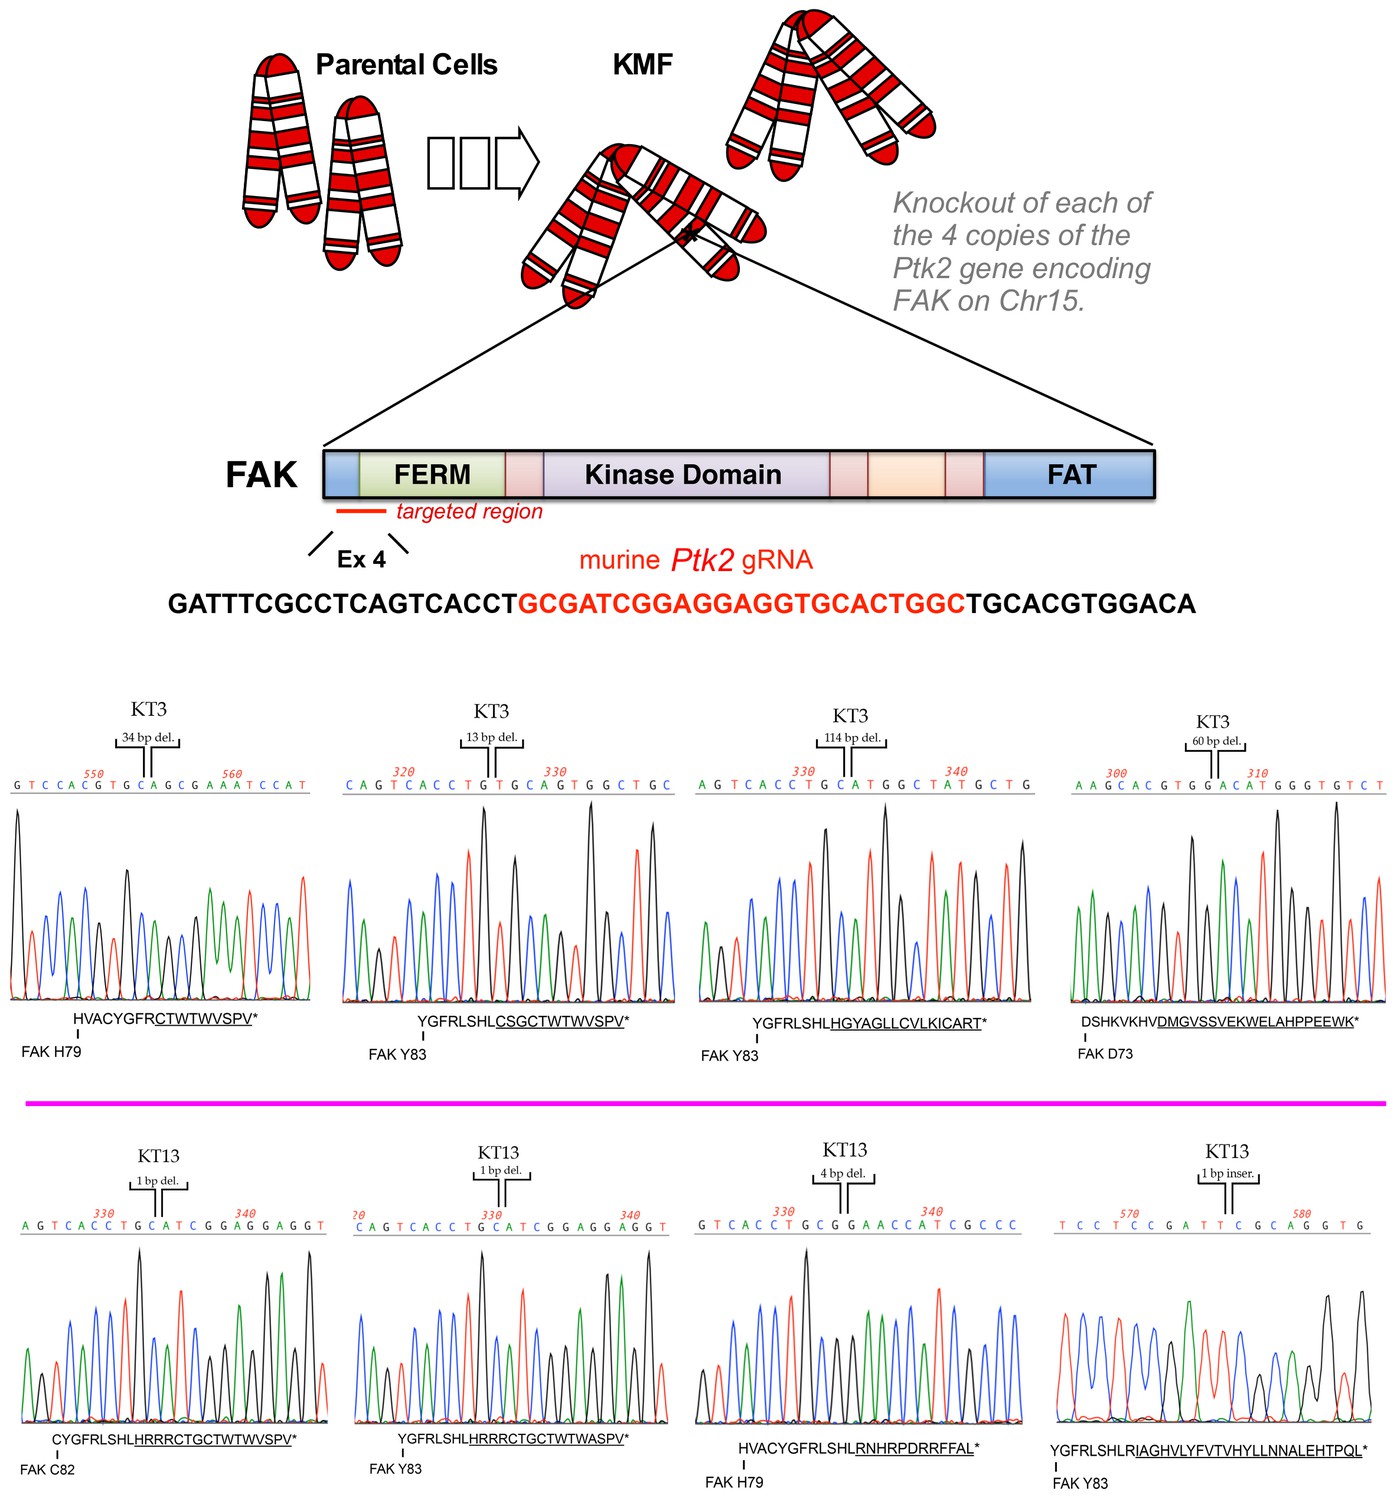
Sequencing validation of CRISPR/Cas9-mediated FAK KO in KMF cells.
CRISPR/Cas9 gRNA guide (nucleotide sequence listed) was designed to target murine Ptk2 exon four which encodes amino acids within the FAK N-terminal FERM (4.1 ezrin radixin moesin) domain. PCR DNA amplification, TOPO-TA sticky end cloning, and Sanger sequencing of CRISPR-targeted region of exon four within FAK KO clones KT3 and KT13. Shown are sequencing chromatograms for four independent deletions in KT3 and four independent deletions or insertion within KT13 resulting in codon frame-shift and predicted FAK translational termination. Alternative reading frames are underlined with position of stop codon (*) denoted (Uniprot protein P34152).
Figure 9 with 1 supplement
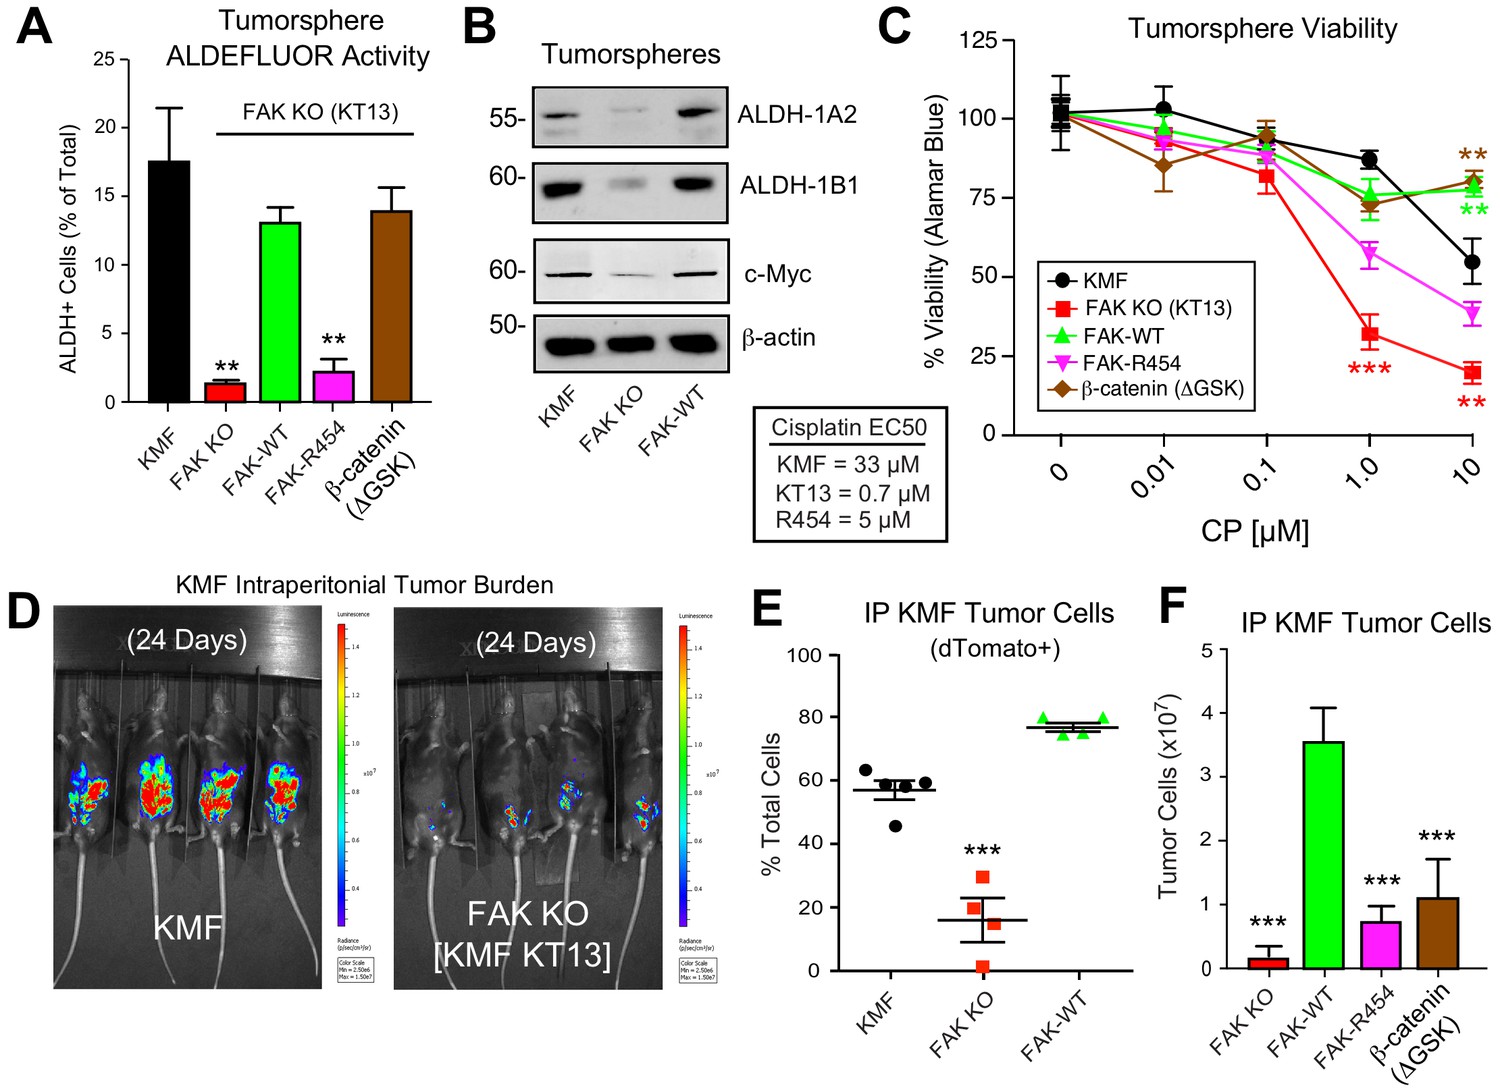
Intrinsic FAK activity supports ALDFLUOR activity, CP resistance, and is essential for KMF tumor growth.
(A) ALDEFLUOR activity of KMF, KT13 FAK KO, or the indicated reconstituted cells in PromoCell after 5 days. Values are means (± SEM **p<0.01, ***p<0.001, one-way ANOVA with a Tukey’s multiple comparisons test) of four independent experiments. (B) Immunoblotting for ALDH-1A2, ALDH-1B1, Myc, and actin in the indicated cell lysates. (C) Viability (Alamar Blue) of KMF (black circles), KT13 FAK KO (red squares), GFP-FAK WT (green triangle), GFP-FAK R454 (magenta triangle), and β-catenin ΔGSK (brown diamond) expressing cells treated with increasing CP concentrations for 5 days. Values are means (± SEM, **, p<0.01, ***p<0.001, two-way ANOVA with a Bonferroni’s multiple comparisons test) from three independent experiments. Lower, EC50 values were determined independently and using Prism. (D) IVIS imaging of C57Bl/6 mice with dTomato+ and luciferase-expressing KMF or KT13 FAK KO cells at experimental Day 24. (E) Flow cytometry analyses of peritoneal wash collected dTomato+ cells at Day 28 of mice bearing KMF (black), KT13 FAK KO (red), and FAK KO re-expressing FAK WT (green) cells. Values are means expressed as percent of total cells in peritoneal wash (± SEM, ***p<0.001, one-way ANOVA). (F) Intraperitoneal (IP) tumor growth of KT13 FAK KO (red), GFP-FAK-WT (green), GFP-FAK-R454 (magenta), or β-catenin ΔGSK (brown) expressing cells. Values are means of CD45-negative tumor cells determined by flow cytometry (± SD, ***p<0.001, one-way ANOVA).
Figure 9—figure supplement 1
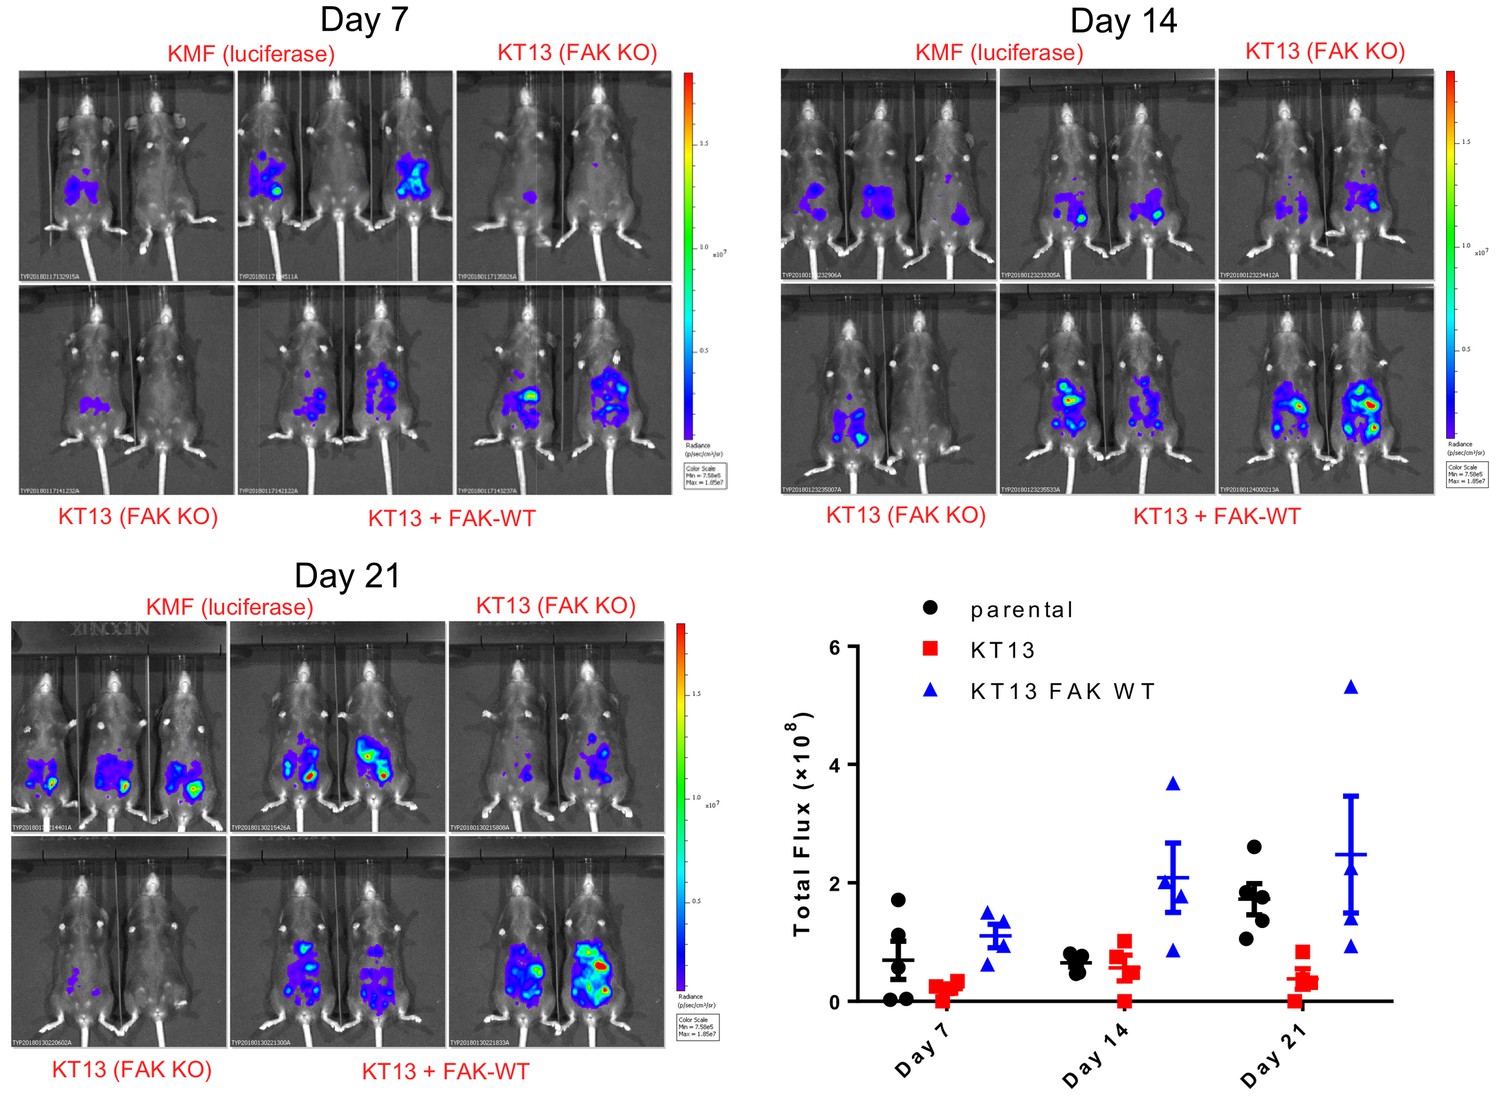
Comparison of KMF, KT13 FAK KO, and FAK KO re-expressing GFP-FAK-WT orthotopic growth in C57Bl/6 mice.
Representative IVIS imaging of C57Bl/6 mice with dTomato+ and luciferase-expressing KMF or KT13 KO cells at experimental Days 7, 14 and 21. Flow cytometry analyses of peritoneal wash collected dTomato+ cells at Day 28 of mice bearing KMF (black), KT13 FAK KO (red), and KT13 FAK KO re-expressing FAK WT (blue) cells. Values are means expressed as percent of total cells in peritoneal wash.
Figure 10
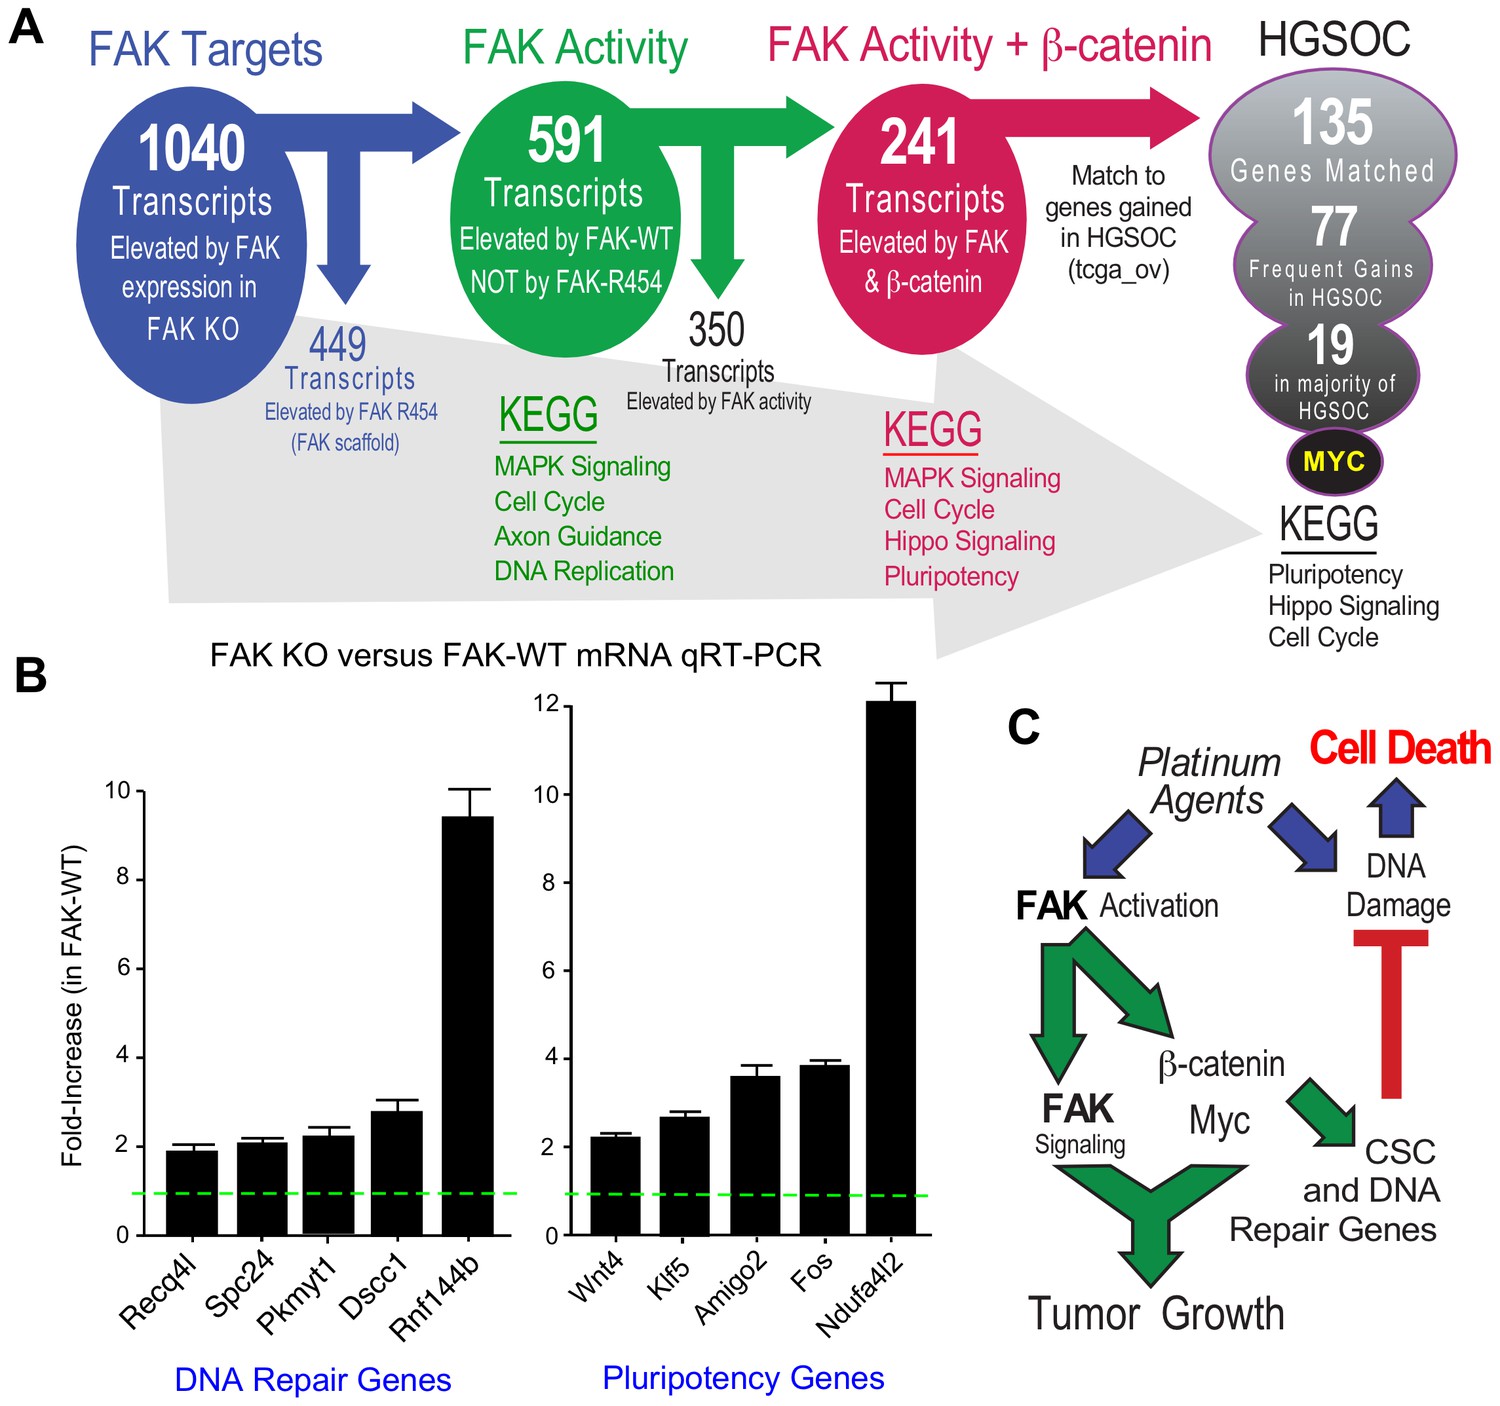
FAK activity and β-catenin promote a common gene signature elevated in HGSOC.
(A) Summary of KMF RNA sequencing and filtering of differential gene expression. 1040 mRNAs were elevated (greater than log2 and FPKM >1) in FAK-WT versus KT13 FAK KO cells. 449 mRNAs were elevated in FAK R454 versus KT13 FAK KO cells. This represents FAK scaffold or activity-independent group (blue). By subtraction of FAK-R454 from FAK-WT targets, 591 FAK activity-dependent targets were identified (green). 1739 mRNAs were elevated in β-catenin ΔGSK cells, and by filtering against FAK activity-induced mRNAs, 241 common FAK activity and β-catenin enhanced mRNA targets were identified (red). 135 of 241 murine KMF targets were matched to genes elevated in HGSOC. 77 targets were elevated in 20% of HGSOC patients and 19 targets were elevated in more than 50% of HGSOC patients. MYC exhibits the highest genetic gain frequency. Top Kyoto Encyclopedia of Genes and Genomes (KEGG) pathway enrichments are listed for filtered groups. (B) Real-time PCR quantitation (qRT-PCR) of the indicated DNA repair- or pluripotency-associated mRNAs from FAK KO and FAK-WT cells grown in PromoCell for 5 days. Values were normalized to ribosomal RPL19 and fold increase are means from two replicates (± SEM, *p<0.05, T test). (C) Signaling summary of death-inducing and paradoxical survival-sustaining FAK activation by platinum chemotherapy. FAK signaling to β-catenin support elevated levels of Myc and mRNA target supporting pluripotency and DNA repair genes hypothesized to support cellular resistance platinum DNA damage. Tumor cell intrinsic FAK kinase activity is essential for KMF tumor growth via context-dependent signaling as β-catenin activation was not sufficient to promote tumor growth in the absence of FAK.
-
Figure 10—source data 1
RNA sequencing annotated list of differentially expressed genes in KMF, KT13 FAK KO, FAK-WT, FAK-R454, and β-catenin ΔGSK cells grown as tumorspheres.
- https://doi.org/10.7554/eLife.47327.032
-
Figure 10—source data 2
List of 135 FAK-activity and β-catenin enhanced mRNAs in KMF matched to genes elevated in HGSOC (TCGA).
- https://doi.org/10.7554/eLife.47327.033
Tables
Table 1
Shared copy number alterations between KMF and the top 20 most significant gene gains and losses in HGSOC.
https://doi.org/10.7554/eLife.47327.007| Murine Cytoband | Human Cytoband | Gain/ Loss | Genes in common murine-human loci | Pathway/Role |
|---|---|---|---|---|
| 6qD1-G3 | 12p12.1 | Gain | KRAS | Proliferation |
| 15qA1-D3 | 8q24.21, 8q24.3 | Gain | MYC, PTK2 | Stem Cell, Adhesion |
| 15qD3-F3 | 8q24.3 | Gain | RECQL4 | DNA Repair |
| 8qA1.1–1.3 | 8p23.3 | Loss | TUSC3 | Tumor Suppressor |
| 8qB1.1–1.2 | 4q34.3 | Loss | IRF2 | Interferon Response |
| 10qA1-D1 | 19p13.3 | Loss | TJP3 | Tight Junction |
| 13qB3-D2.3 | 5q11.2, 5q13.1 | Loss | MAP3K1, FOXD1, PIK3R1 | MAPK, Cell Cycle P85-PI3-kinase |
Key resources table
| Reagent type (species) or resource | Designation | Source or reference | Identifiers | Additional information |
|---|---|---|---|---|
| Antibody | anti-FAK (mouse monoclonal) | Millipore Sigma | clone 4.47; Cat# 05–537; RRID:AB_2173817 | WB (1:1000) |
| Antibody | anti-FAK (rabbit polyclonal) | Millipore Sigma | Cat# 06–543; RRID:AB_310162 | WB (1:1000) |
| Antibody | anti-phospho-FAK (Tyr397) (rabbit monoclonal) | Thermo Fischer Scientific | clone 141–9; Cat# 44–625G; RRID:AB_2533702 | WB (1:1000) |
| Antibody | anti-phospho-FAK (Tyr397) (rabbit monoclonal) | Thermo Fischer Scientific | clone 31H5L17; Cat# 700255; RRID:AB_2532307 | WB (1:1000) |
| Antibody | anti-phospho-FAK (Tyr397) (rabbit monoclonal) | Abcam | clone EP2160Y; Cat# ab81298; RRID:AB_1640500 | WB (1:1000) |
| Antibody | anti-E-cadherin (mouse monoclonal) | Cell Signaling Technology | clone 4A2; Cat# 14472; RRID:AB_2728770 | WB (1:1000) |
| Antibody | anti-β-actin (mouse monoclonal) | Millipore Sigma | clone AC-74; RRID:AB_476697 | WB (1:1000) |
| Antibody | anti-β-actin (mouse monoclonal) | Proteintech Group | Cat# 60008–1; RRID:AB_2289225 | WB (1:1000) |
| Antibody | anti-β-cateninXP (rabbit monoclonal) | Cell Signaling Technology | clone D10A8; Cat# 8480; RRID:AB_11127855 | WB (1:1000) |
| Antibody | anti-non-phospho (Active) β-Catenin (Ser33/37/Thr41) (rabbit monoclonal) | Cell Signaling Technology | clone D13A1; Cat# 8814; RRID:AB_11127203 | WB (1:1000) |
| Antibody | anti-β-Catenin (phospho Y142) (rabbit polyclonal) | Abcam | ab27798; RRID:AB_725969 | WB (1:1000) |
| Antibody | anti-c-Myc XP (rabbit monoclonal) | Cell Signaling Technology | clone D84C12; Cat# 5605; RRID:AB_1903938 | WB (1:1000) |
| Antibody | anti-Pyk2 (mouse monoclonal) | Cell Signaling Technology | clone 5E2; Cat# 3480; RRID:AB_2174093 | WB (1:1000) |
| Antibody | anti-p21 (mouse monoclonal) | Santa Cruz Biotechnology | clone F5; Cat# sc-6246; RRID:AB_628073 | WB (1:250) |
| Antibody | anti-GFP (mouse monoclonal) | Santa Cruz Biotechnology | clone B2; Cat# sc-9996; RRID:AB_627695 | WB (1:1000) |
| Antibody | anti-p53 (Pab 240) (mouse monoclonal) | Santa Cruz Biotechnology | Cat# sc-99, RRID:AB_628086 | WB (1:250) |
| Antibody | Anti-α-Tubulin (mouse monoclonal) | Millipore Sigma | Cat# T6199; RRID:AB_477583 | WB (1:1000) |
| Antibody | anti-ALDH1A1 (rabbit polyclonal) | Abcam | Cat# ab23375; RRID:AB_2224009 | WB (1:1000) |
| Antibody | anti-ALDH1A2 (rabbit polyclonal) | Proteintech Group | Cat# 13951–1-AP, RRID:AB_2224033 | WB (1:1000) |
| Antibody | anti-ALDH1B1 (rabbit polyclonal) | Proteintech Group | Cat# 15560–1-AP, RRID:AB_2224162 | WB (1:1000) |
| Antibody | anti-ALDH3B1 (rabbit polyclonal) | Proteintech Group | Cat# 19446–1-AP | WB (1:1000) |
| Antibody | anti-Ki67 (rabbit polyclonal) | Abcam | Cat# ab15580; RRID:AB_443209 | WB (1:1000) |
| Antibody | anti-Pax8 (rabbit polyclonal) | Proteintech Group | Cat# 10336–1-AP; RRID:AB_2236705 | WB (1:1000) |
| Antibody | anti-p53 (mouse monoclonal) | Abcam | clone PAb 240; RRID:AB_303198 | WB (1:250) |
| Antibody | anti-Cyclin D1 (rabbit polyclonal) | Cell Signaling Technology | Cat# 2922; RRID:AB_2228523 | WB (1:1000) |
| Antibody | Alexa Fluor 700 Rat Anti-Mouse CD45 | Thermo Fisher Scientific | clone 30-F11; Cat# 45-0451-80; RRID: AB_891454 | 1 ul per test |
| Strain, strain background (Escherichia coli) | Stellar Competent Cells, E. coli HST08 strain | Takara | Cat# 636763 | Chemically competent cells |
| Strain, strain background (Escherichia coli) | One Shot Stbl3 Chemically Competent E. coli | Life Technologies | Cat# C737303 | Chemically competent cells |
| Chemical compound, drug | Jet PRIME | Polyplus-transfection | Cat#114–15 | |
| Chemical compound, drug | FuGENE HD Transfection Reagent | Promega | Cat# E2311 | |
| Chemical compound, drug | Halt Protease Inhibitor Cocktail (100X) | Thermo Fischer Scientific | Cat# 87786 | |
| Chemical compound, drug | staurosporine | Cell Signaling Technology | Cat# 9953S | |
| Chemical compound, drug | cisplatin | Enzo Life Sciences | Cat# 89150–634 | |
| Chemical compound, drug | GSK inhibitor CHIR99021 | Millipore Sigma | Cat# SML1046 | |
| Chemical compound, drug | Propidium iodide | BioLegend | Cat# 421301 | |
| Chemical compound, drug | DTT | Bio Basic | Cat# DB0058-5 | |
| Peptide, recombinant protein | Mouse FAK (phospho Y397) peptide | Abcam | Cat# ab40145 | |
| Commercial assay, kit | PureLink RNA Mini Kit | Thermo Fisher Scientific | Cat# 12183020 | |
| Commercial assay, kit | Ambion Homogenizer | Thermo Fisher Scientific | Cat# 12183026 | |
| Commercial assay, kit | XTT Cell Proliferation Assay Kit | ATCC | Cat# 30–1011K | |
| Commercial assay, kit | Dual-Luciferase Reporter Assay System | Promega | Cat# E1910 | |
| Commercial assay, kit | PE Annexin V Apoptosis Detection Kit I | BD Biosciences | Cat# 559763 | |
| Commercial assay, kit | AlamarBlue Cell Viability Reagent | Thermo Fischer Scientific | Cat# DAL1025 | |
| Commercial assay, kit | iTaq Universal SYBR Green Supermix | Biorad | Cat# 1725121 | |
| Commercial assay, kit | High-Capacity cDNA Reverse Transcription Kit | Thermo Fisher Scientific | Cat# 4368814 | |
| Commercial assay, kit | AldeRed ALDH Detection Assay | Millipore Sigma | Cat# SCR150 | |
| Cell line (Homo-sapiens) | OVCAR3 | NCI Tumor Repository | RRID:CVCL_0465 | |
| Cell line (Homo-sapiens) | OVCAR10 | Denise Connolly (Fox Chase Cancer Center) | RRID:CVCL_4377 | |
| Cell line (Homo-sapiens) | OVCAR10-CP | this paper | Schlaepfer Lab | |
| Cell line (Homo-sapiens) | A2780 | Denise Connolly (Fox Chase Cancer Center) | RRID:CVCL_0134 | |
| Cell line (Homo-sapiens) | A2780-CP70 | Denise Connolly (Fox Chase Cancer Center) | RRID:CVCL_0135 | |
| Cell line (Mus-musculus) | ID8 | Katherine Roby (University of Kansas Medical Center) | RRID:CVCL_IU14 | |
| Cell line (Mus-musculus) | KMF (ID8-IP) | PMID: 23275034 | Schlaepfer Lab | KMF cells were isolated from peritoneal ascites of ID8-injected C57Bl6 tumor-bearing mice as described (PMID: 23275034) |
| Recombinant DNA reagent | pUltra-Chili-Luc | Addgene | Plasmid # 48688 | |
| Recombinant DNA reagent | MSCV-beta-catenin-IRES-GFP | Addgene | Plasmid # 14717 | |
| Recombinant DNA reagent | pSpCas9n(BB)−2A-Puro (PX462) | Addgene | Plasmid # 48141 | |
| Recombinant DNA reagent | M50 Super 8x TOPFlash | Addgene | Plasmid #12456 | |
| Recombinant DNA reagent | pCDH-CMV-MCS-EF1α-Puro Cloning and Expression Lentivector | System Biosciences | Cat# CD510B-1 | |
| Recombinant DNA reagent | 7TGP | Addgene | Plasmid # 24305 | |
| Recombinant DNA reagent | psPAX2 | Addgene | Plasmid #12260 | |
| Recombinant DNA reagent | pMD2.G | Addgene | Plasmid #12259 |
Table 2
Primers used for qRT-PCR.
https://doi.org/10.7554/eLife.47327.034| Gene | Sequence |
|---|---|
| musRecql4F | CACCTGAGTCGAGCTGCA A |
| musRecql4R | AGCCTCTTCCCATAGTCTTGT |
| musSpc24F | AGGCTACGTCAGCTCATCAC |
| musSpc24R | ATCATCCCTGGCTCGCATTC |
| musPkmyt1F | TACCTAGGGATGCCCTGGAC |
| musPkmyt1R | CAGGCTGAGGAGGTTCCTTG |
| musDscc1F | AAGTGTGGCAGCAGAGTGTT |
| musDscc1R | TCTCTCCGCACAAATCTTGGA |
| musRnf144bF | GCAAGAACTGCAAGCACACA |
| musRnf144bF | CCCACTACCTGTGTTCGGTT |
| musWnt4 F | TGCGAGGTAAAGACGTGCTG |
| musWnt4 R | CTTGAACTGTGCATTCCGAGG |
| musKlf5F | CCGGAGACGATCTGAAACACG |
| musKlf5R | GTTGATGCTGTAAGGTATGCCT |
| musAmigo2F | GGAGGTTCAAGCTGGCTGAT |
| musAmigo2R | GATGCCTCTCAGCTGTCTCC |
| musFos F | CGGCATCATCTAGGCCCAG |
| musFos R | TCTGCTGCATAGAAGGAACCG |
| musNdufa4l2F | AAAGACACCCTGGGCTCATC |
| musNdufa4l2R | TGTAGTCGGTTGAAACGGCA |
| musRPL191F | TGATCTGCTGACGGAGTTG |
| musRPL191R | GGAAAAGAAGGTCTGGTTGGA |
Additional files
-
Transparent reporting form
- https://doi.org/10.7554/eLife.47327.035
Download links
A two-part list of links to download the article, or parts of the article, in various formats.
Downloads (link to download the article as PDF)
Open citations (links to open the citations from this article in various online reference manager services)
Cite this article (links to download the citations from this article in formats compatible with various reference manager tools)
FAK activity sustains intrinsic and acquired ovarian cancer resistance to platinum chemotherapy
eLife 8:e47327.
https://doi.org/10.7554/eLife.47327


