B cells suppress medullary granulopoiesis by an extracellular glycosylation-dependent mechanism
- Roswell Park Comprehensive Cancer Center, United States
- Blood Research Institute Versiti, United States
- University at Buffalo, United States
Figures
Figure 1
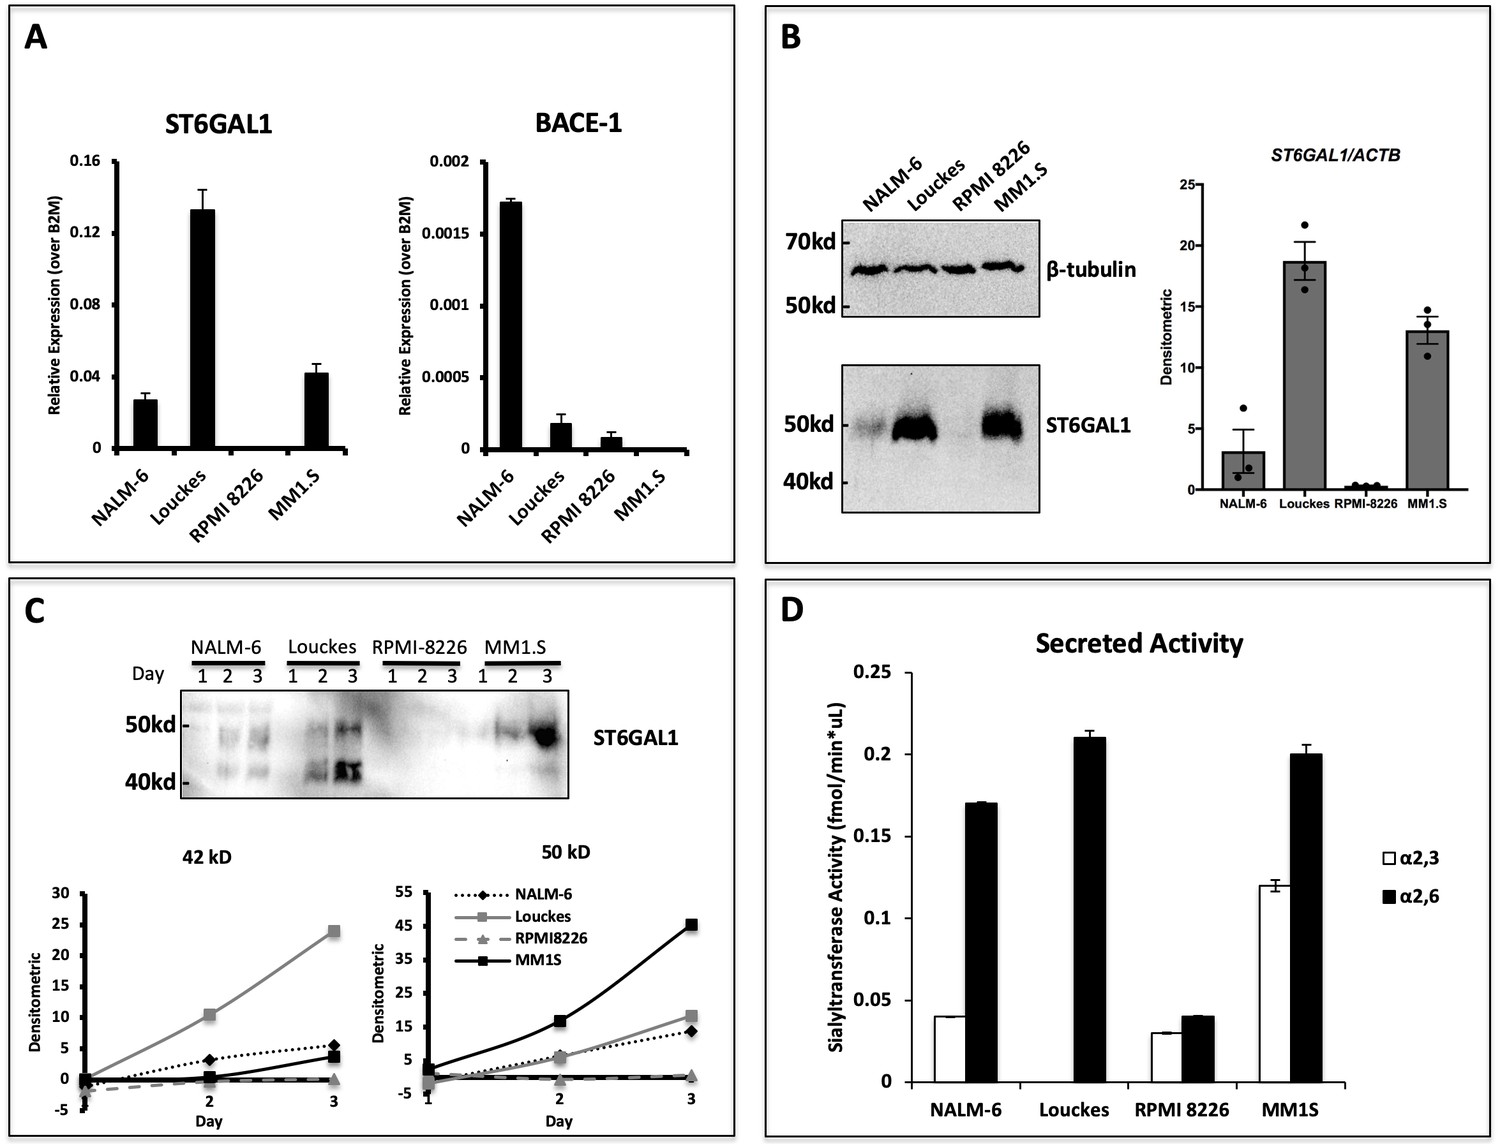
Human B lymphoblastoid cells secrete ST6GAL1.
Human lymphoblastoid cell lines derived from the pre-B (NALM-6), germinal center (Louckes) and plasma cell (RPMI 8226 and MM1.S) stages were profiled for ST6GAL1 expression and secretion. (A) RT-qPCR analysis of ST6GAL1 and beta-secretase BACE1 mRNA (n = 3 replicates) (B) Total ST6GAL1 protein analyzed by western blot (left) and quantified (right, n = 3). (C) Protein levels of ST6GAL1 in the serum-free conditioned medium of cell cultures 1–3 days after plating 10^6 cells/ml, analyzed by western blot (top) and quantified for 50 kD and 42 kD sizes (bottom). (D) Sialyltransferase activity in conditioned medium, relative to media only control, was determined by incorporation of [3H]NeuAc onto Gal(β4)GlcNAc-O-Bn acceptor substrate. [3H]-Labeled products were separated by SNA-agarose chromatography into [3H]NeuAc-α2,6-Gal(β4)GlcNAc-O-Bn α2,6- (SNA binding) and [3H]NeuAc-α2,3-Gal(β4)GlcNAc-O-Bn (SNA non-binding) fractions. The data shown are representative of multiple experiments with similar results.
Figure 2
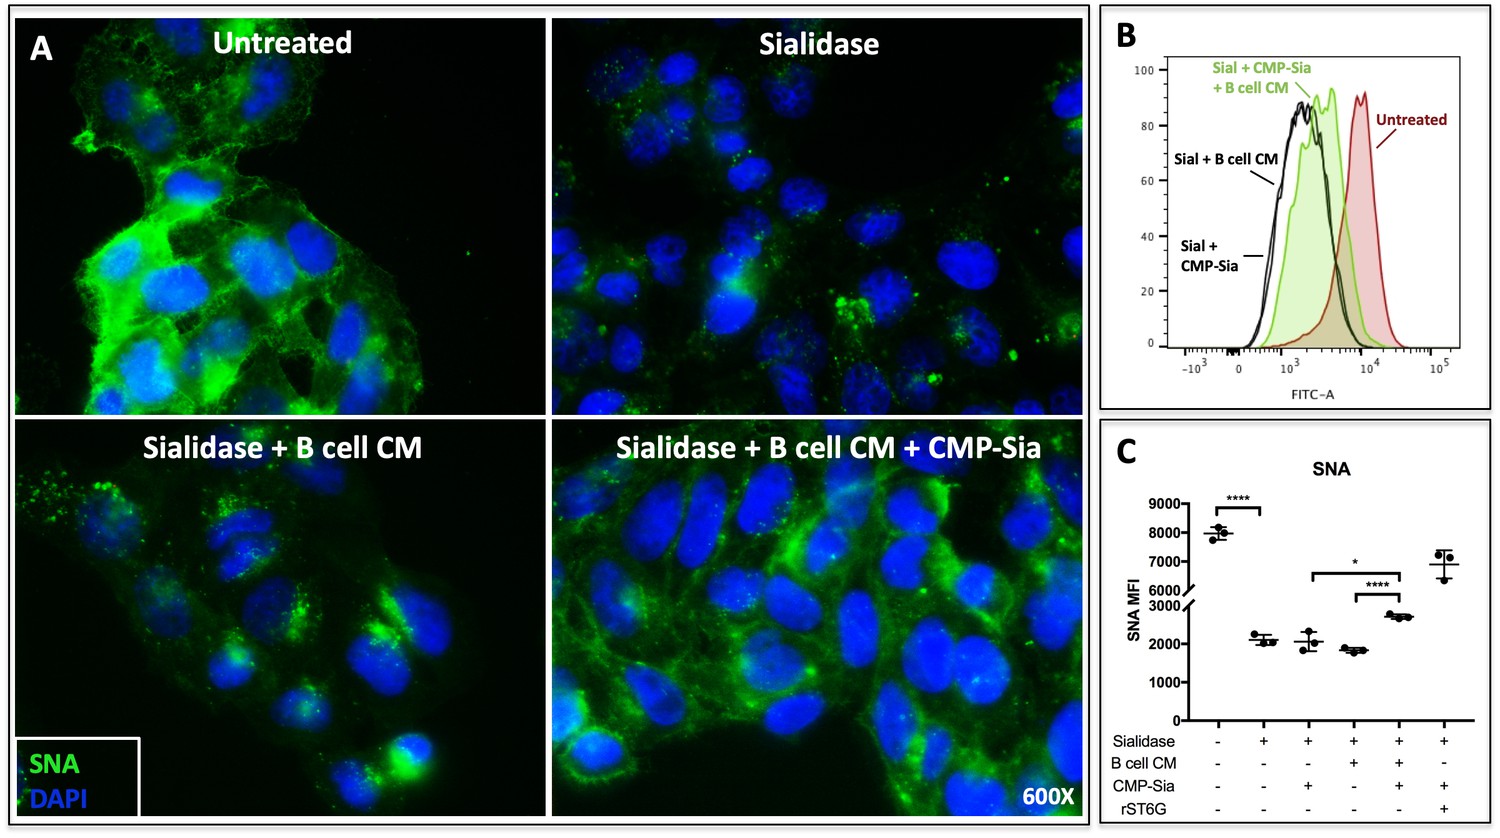
B cell conditioned medium extrinsically restores SNA reactivity of target cells.
(A) HepG2 human liver cells were grown on glass cover slides and fixed (10 min in 5% formalin) to disable endogenous metabolism. Cells were treated with C. perfringens sialidase C (Roche) for 1 hr at 37C to remove cell surface sialic acid, then incubated with concentrated (~20X) B cell conditioned medium (CM) from Louckes grown in serum-free medium, in the presence or absence of 0.05 mM CMP-sialic acid. Representative images of cell surface sialylation, as indicated by SNA lectin stain, are shown. HepG2 cells in suspension were subjected to the same treatments and analyzed by flow cytometry for SNA reactivity. SNA reactivity of nucleated cells is shown (B) by representative histogram and (C) as average mean fluorescence intensity of biological replicates.
Figure 3 with 1 supplement
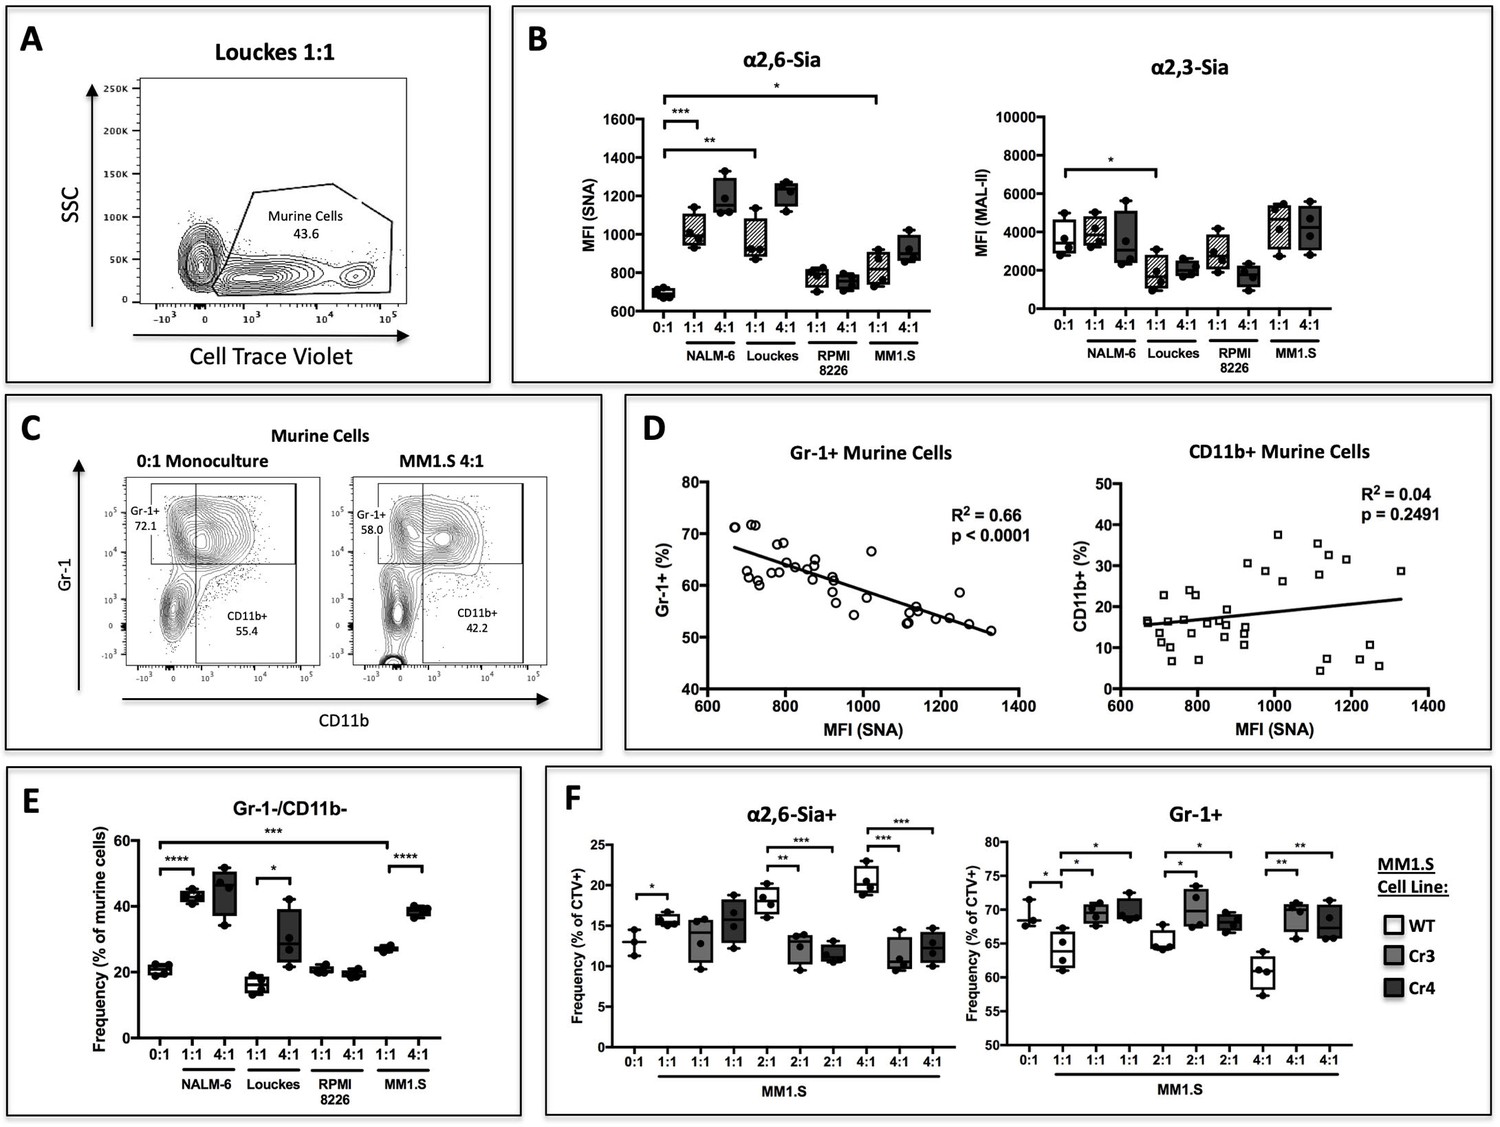
B cells modify HSPC SNA reactivity and Gr-1 expression in co-culture.
Human B lymphoblastoid cell lines were co-cultured with CellTrace Violet-labeled murine St6gal1KO c-kit+ bone marrow cells for 3 days with SCF, IL-3, G-CSF, TPO, and Flt-3 at indicated ratios of 1:1, 2:1, or 4:1. (A) Resolution of B cells and murine HSPCs by flow cytometry, with HSPCs staining positive for CellTrace Violet. (B) Levels of SNA and MAL-II reactivity on the HSPCs in monoculture or co-culture with indicated B cells. (C) Flow cytometric separation of CD11b+ and Gr1+ cells from murine HSPCs, after 3 days of monoculture (left) or co-culture (right) with MM1.S myeloma cells at 4:1 ratio. (D) Correlation between murine cell SNA reactivity and frequency of Gr-1+ or CD11b+ cells (expressed as % of total CellTrace Violet+ cells). (E) Frequency of CD11b-/Gr-1- undifferentiated murine cells after co-culture. (F) Frequency of SNA+ and Gr-1+ murine cells after co-culture with genetically modified MM1.S cell lines (Cr3 and Cr4) with targeted ST6GAL1 knockout by CRISPR/Cas9. Data are from a single experiment representative of three individual experiments, with n = 4 technical replicates per condition *p<0.05, **p<0.01, ***p<0.001 by student’s T-test.
Figure 3—figure supplement 1
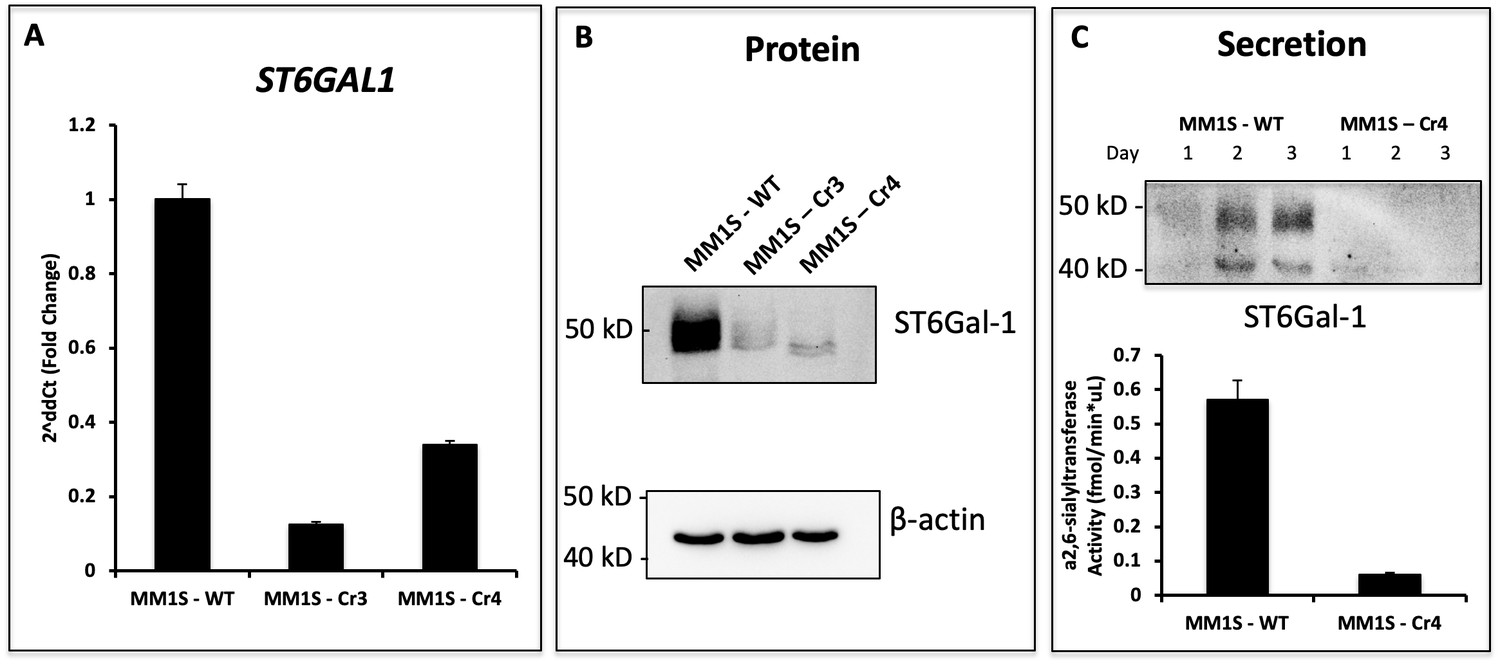
Genetic Modification of ST6GAL1 in Multiple Myeloma Cell Lines.
MM1.S cells were subjected to CRISPR/Cas9 knockout for ST6GAL1 using two sgRNA sequences (Cr3, Cr4). Recovered cells were sorted for low SNA reactivity to enrich for cells with successful ablation of ST6GAL1. (A) RT-qPCR of human and rat ST6GAL1 expression in wild-type and modified cell lines. (B) Western blot analysis of total proteins in Cr4. (C) Genetic manipulations modified secretion of ST6GAL1 protein, as well as α2,6-sialyltransferase activity in conditioned medium.
Figure 4 with 1 supplement
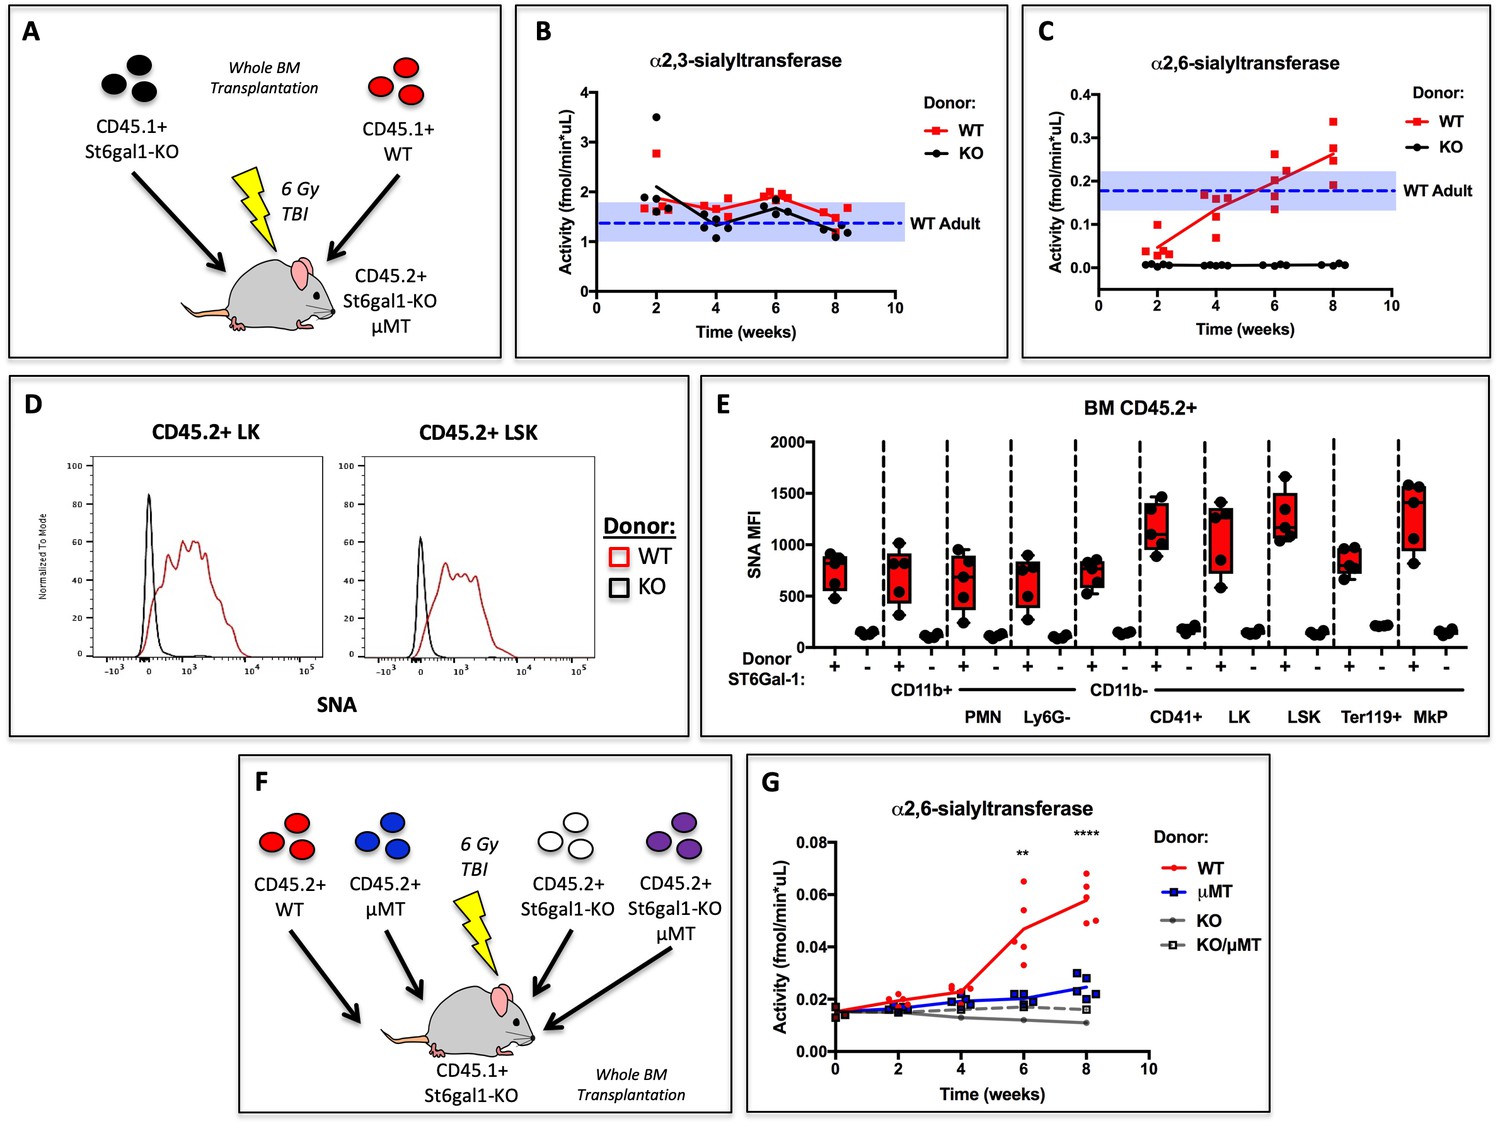
Hematopoietic Cells Supply Extracellular ST6GAL1 for Extrinsic Sialylation in vivo.
(A) CD45.1 + St6gal1 sufficient (WT) or deficient (KO) whole bone marrow was used to reconstitute irradiated CD45.2+/St6gal1KO/μMT mice. (B) α2,3 and (C) α2,6-sialyltransferase activity was quantified in serum of bone marrow chimeras at indicated time points. (D) Representative histograms of SNA-reactivity are shown for Lin-/c-kit+/Sca-1- (LK) and Lin-/c-kit+/Sca-1+ (LSK) progenitor compartments in the bone marrow, 8 weeks post-transplant. (E) Mean fluorescence intensity of SNA in CD45.2+ recipient bone marrow cell subsets was quantified by flow cytometry (n = 5). All cell types were significantly (p<0.01) different between WT and KO donor chimeras by student’s T-test. (F) CD45.2+ WT, μMT, St6gal1KO, or St6gal1KO/μMT bone marrow was used to reconstitute irradiated CD45.1+ St6gal1KO recipients. (G) α2,6-sialyltransferase activity was quantified in serum of bone marrow chimeras at indicated time points. Statistical significance is indicated in comparisons of WT and μMT cohorts for student’s T-test (**p<0.01, ****p<0.0001).
Figure 4—figure supplement 1

Chimerism of Analyzed CD45.2+ Host cells.
Frequency of analyzed CD45.2+ residual recipient cells as a proportion of total BM cells is shown, with relevant cell subsets shown.
Figure 5
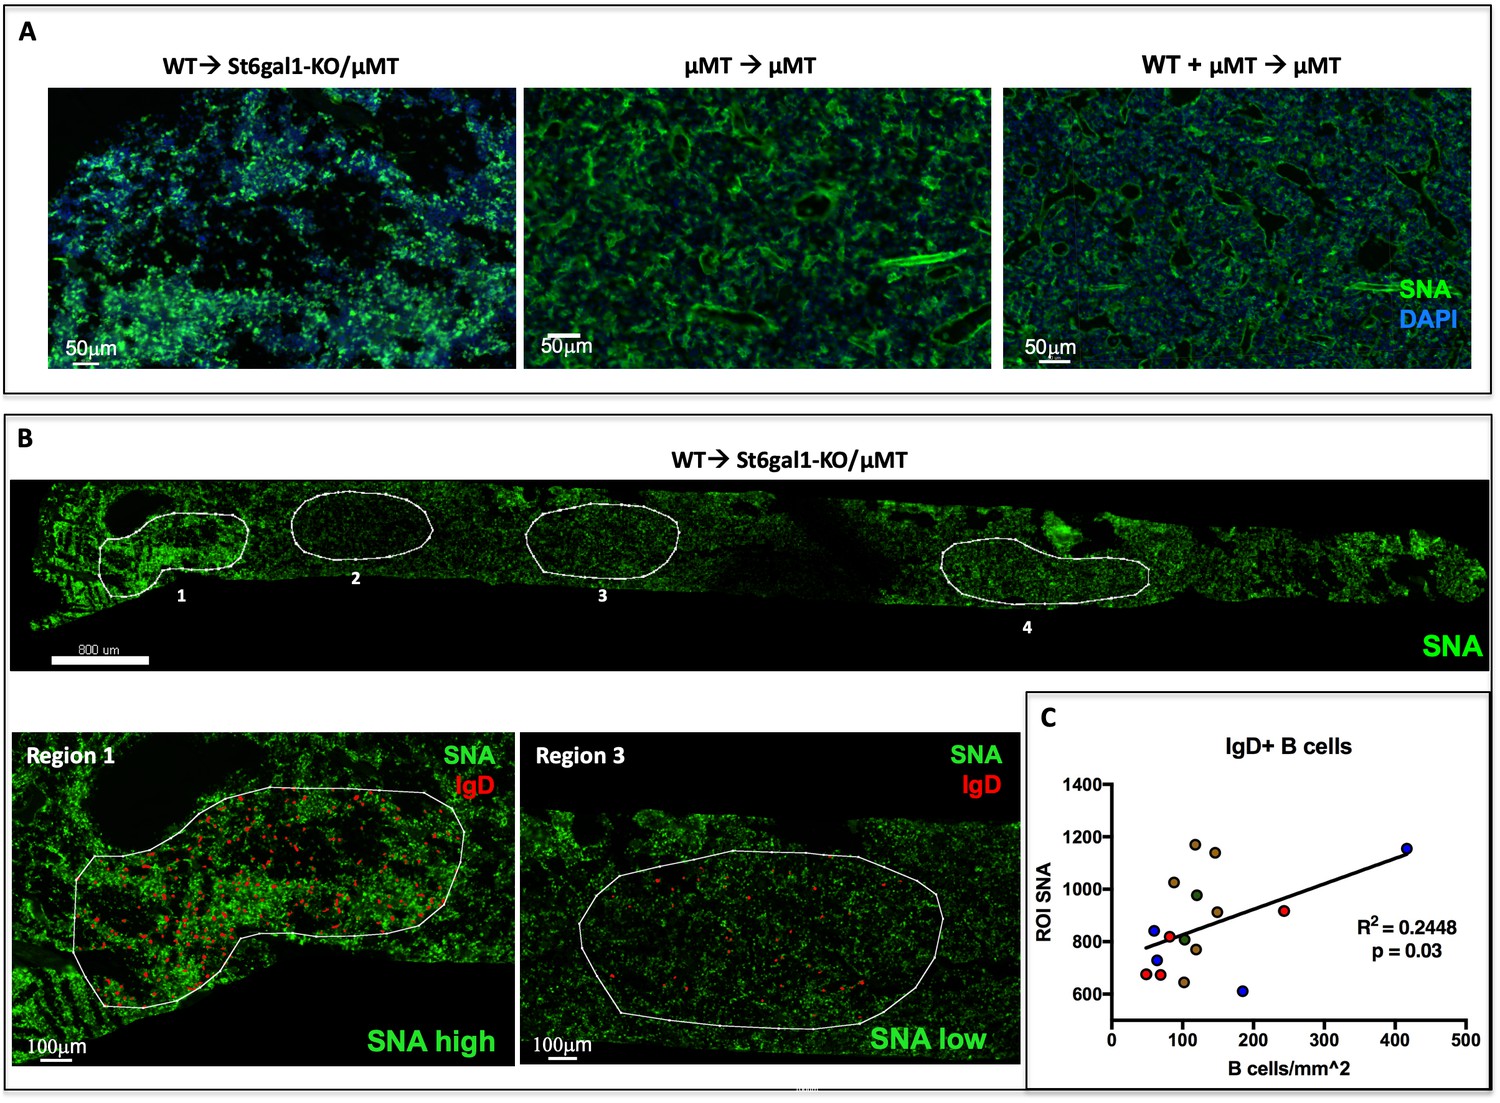
IgD+ B cells are Enriched in Regions of High α2,6-Sialylation within the Bone Marrow.
(A) Wild-type or μMT bone marrow was allowed to reconstitute irradiated μMT or St6gal1KO/ μMT mice for 8 weeks. Upon sacrifice, whole femurs were fixed, frozen, and sectioned for immunofluorescence staining. (B) Heterogeneous SNA reactivity was observed and indicated regions of interest (ROI) were created with differing SNA reactivity (top). Mature B cells (IgD+) were identified within ROIs (bottom panels). (C) Correlation of overall SNA reactivity with abundance of IgD+ B cells in ROIs from chimeras. Data are derived from four biological replicates.
Figure 6 with 1 supplement
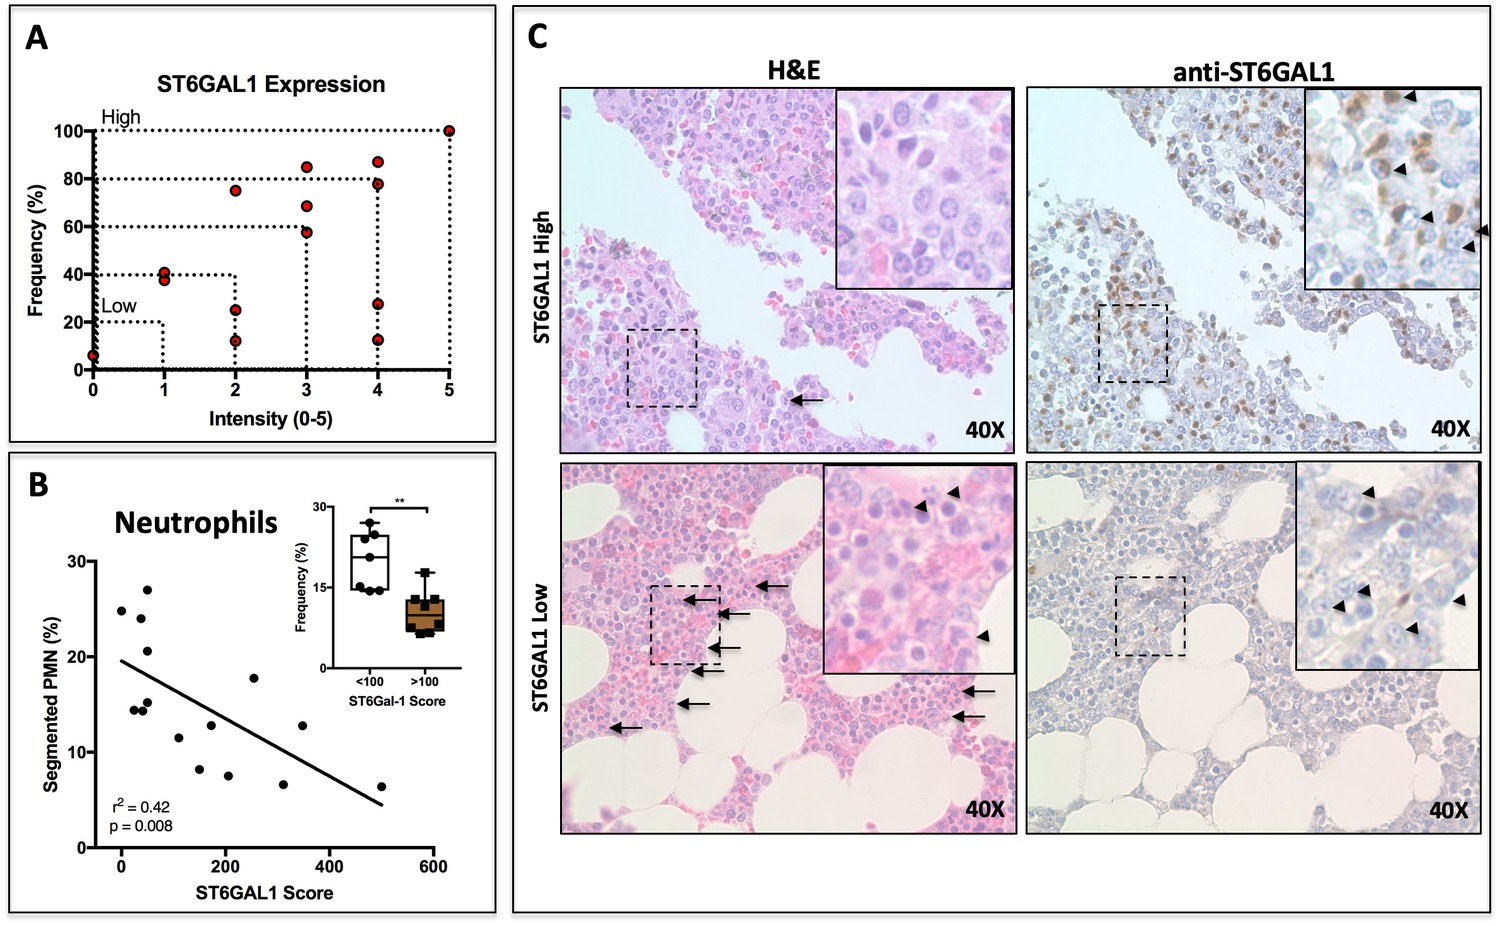
ST6GAL1 Expression in Human Multiple Myeloma Cells Correlates Negatively with Bone Marrow Neutrophil Abundance.
(A) Quantification of ST6GAL1 expression in bone marrow histological specimens from treatment-naive multiple myeloma patients (n = 15). (B) Negative correlation between ST6GAL1 expression and frequency of bands and segmented PMNs (p<0.01). Stratification of patients into low and high ST6GAL1 expression was predictive of abundance of segmented neutrophils (**p<0.01, student’s T-test). (C) Representative data from one patient with high and one patient with low myeloma ST6GAL1 expression, showing H and E with neutrophils indicated (left, arrows or arrowheads), and ST6GAL1 stain with myeloma cells indicated (right, arrowheads).
Figure 6—figure supplement 1
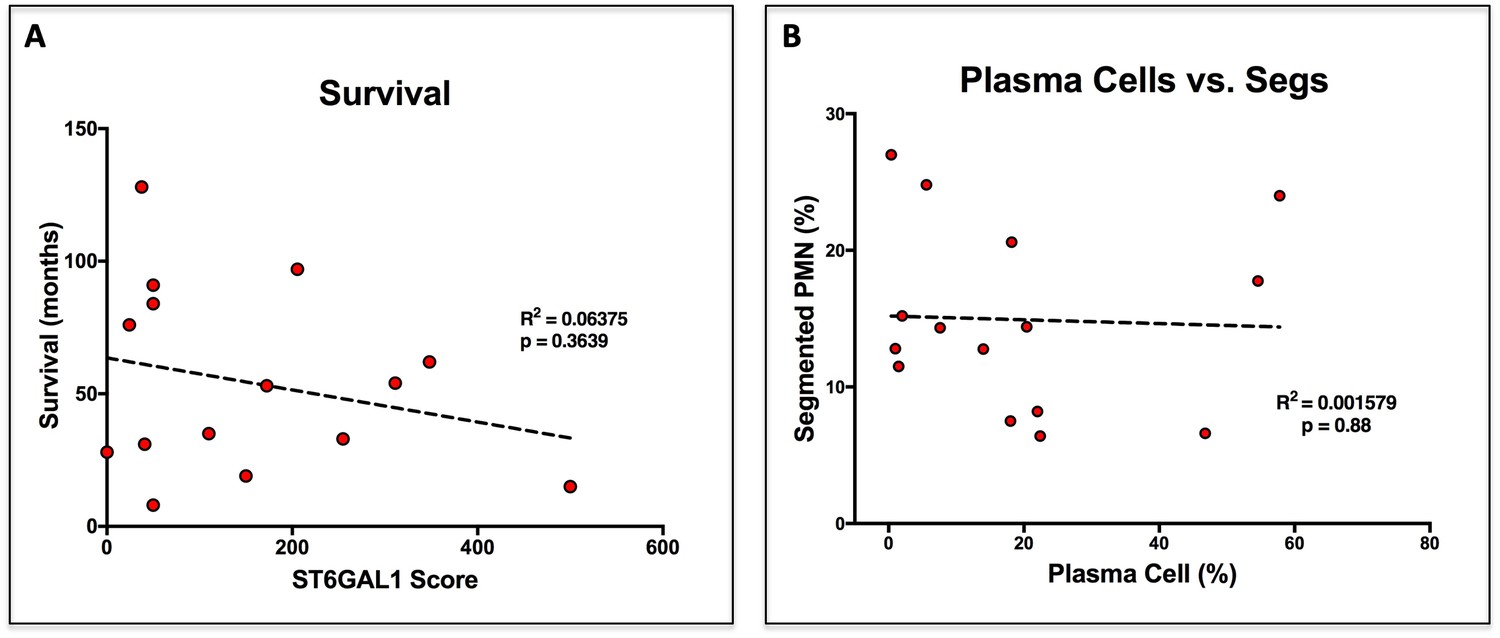
Survival and Plasma Cell Abundance are not altered by ST6GAL1 Expression.
(A) Correlation between ST6GAL1 score and patient survival in months. (B) Correlation between disease burden, enumerated as frequency of plasma cells in the bone marrow, and frequency of neutrophils.
Additional files
-
Transparent reporting form
- https://doi.org/10.7554/eLife.47328.011
Download links
A two-part list of links to download the article, or parts of the article, in various formats.
Downloads (link to download the article as PDF)
Open citations (links to open the citations from this article in various online reference manager services)
Cite this article (links to download the citations from this article in formats compatible with various reference manager tools)
B cells suppress medullary granulopoiesis by an extracellular glycosylation-dependent mechanism
eLife 8:e47328.
https://doi.org/10.7554/eLife.47328


