A circuit-dependent ROS feedback loop mediates glutamate excitotoxicity to sculpt the Drosophila motor system
- Academia Sinica, Taiwan, Republic of China
- National Taiwan University, Taiwan, Republic of China
Figures
Figure 1 with 3 supplements
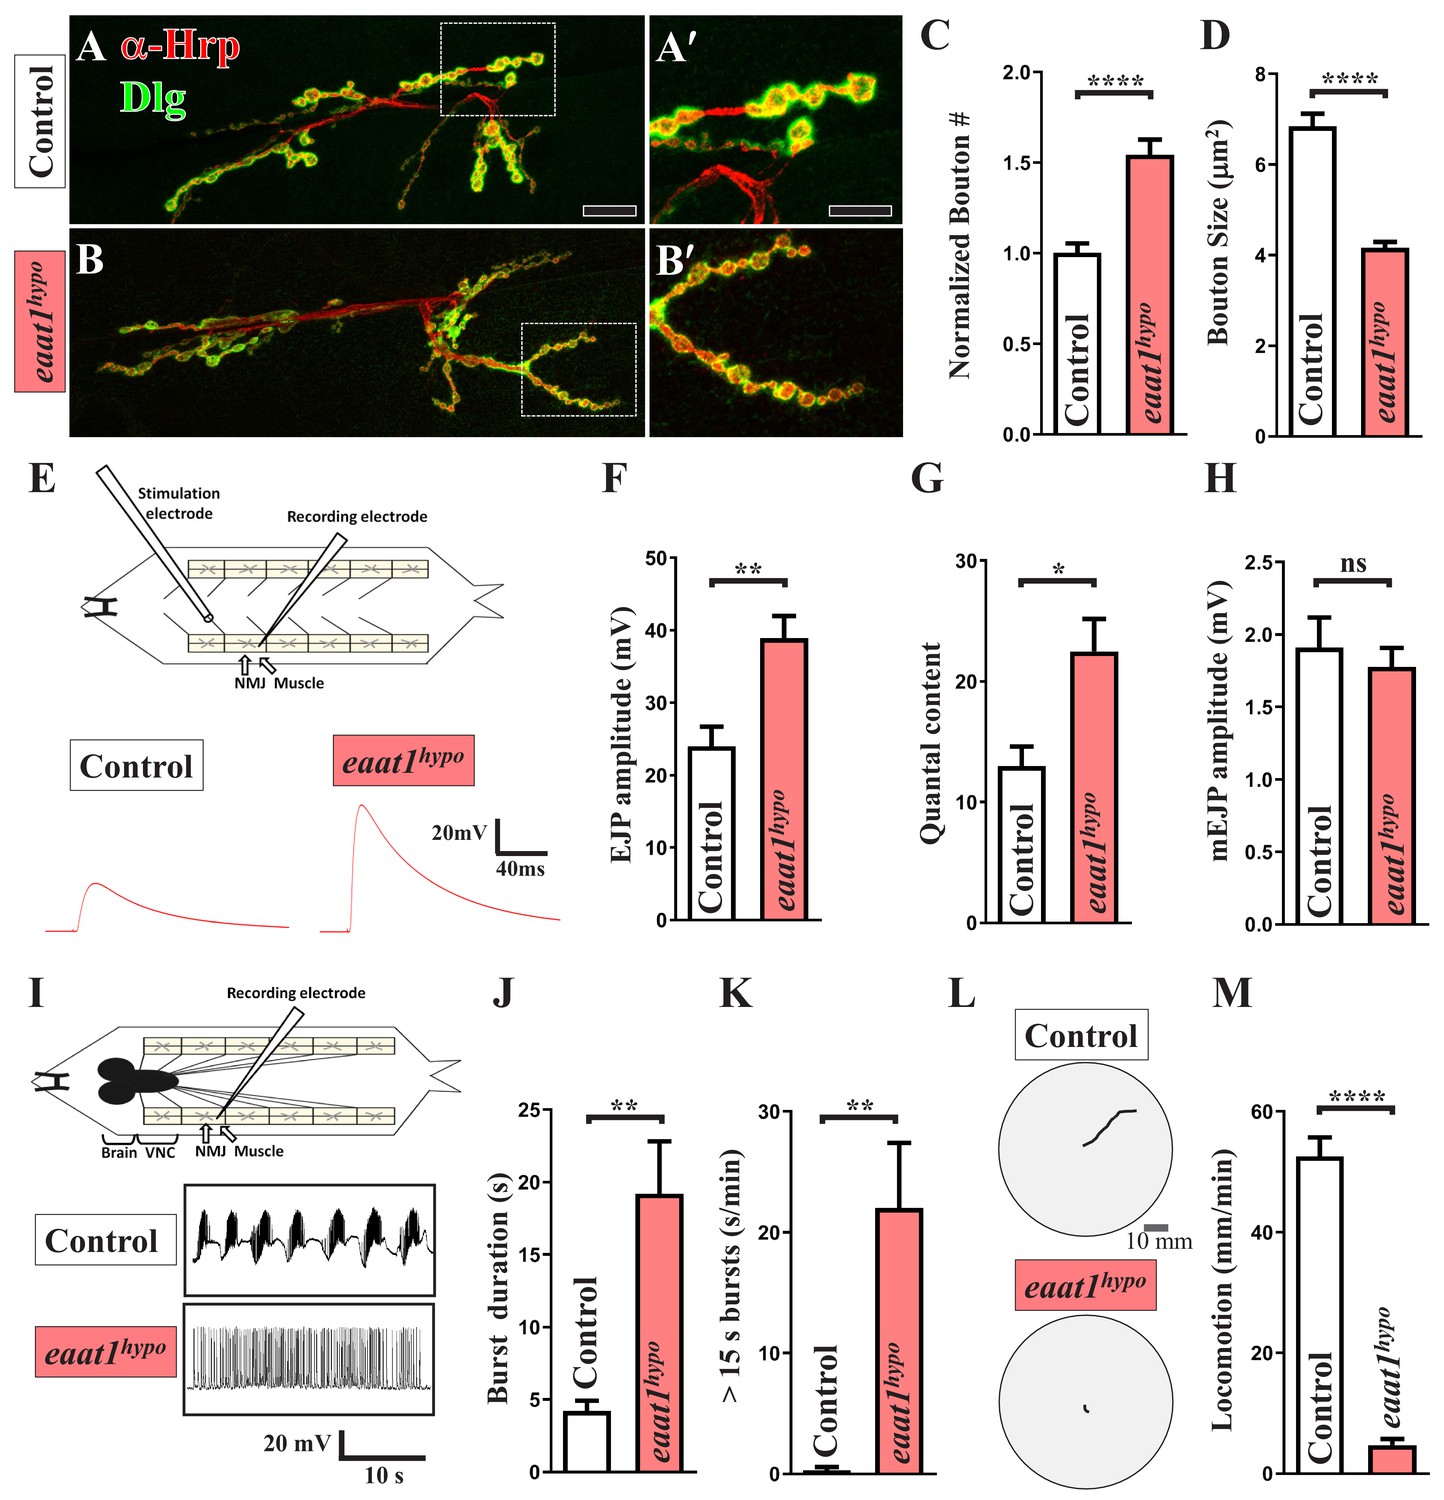
eaat1 mutants exhibit NMJ bouton abnormalities, motor neuron overexcitation, and motor deficits.
(A–D) Loss of eaat1 increases NMJ bouton number and reduces bouton size. (A–B) Confocal images of NMJs co-stained with α-HRP (red) and α-Dlg (green) from controls (w1118) and eaat1hypo/hypo mutants. The NMJ boutons outlined in panels (A,B) are shown in panels (A',B'). Scale bars: 20 µm in (A,B), 10 µm in (A',B'). (C) The number of NMJ boutons per muscle area was counted and normalized to the value of controls (n ≥ 15 NMJs derived from A2 muscles 6 and 7 for each genotype). (D) The sizes of type Ib boutons were calculated on the basis of the immunostaining of Cysteine string protein, a synaptic vesicle-associated protein (n ≥ 433 type Ib boutons from NMJs (n ≥ 8) of A2 muscles 6 and 7 for each genotype). (E–H) Evoked presynaptic responses are increased upon loss of eaat1. (E) Top panel: schematic of the recording setting for larval fillets in which brain and ventral nerve cord (VNC) had been removed. Bottom panel: representative EJP traces evoked from A3 muscle 6 with 0.2 Hz electric stimulation in 0.5 mM Ca2+-containing HL3 solution. (F–H) Quantification data for EJP amplitude, quantal content (QC), and miniature EJP amplitude (n ≥ 6 animals). Miniature EJPs were recorded in HL3 solution containing 0.5 mM Ca2+ and 5 μM tetrodotoxin (TTX). (I–K) eaat1hypo mutants receive excess premotor excitation. (I) Top panel: schematic of the recording setting for larval fillets in which the brain and VNC remain intact. Bottom panel: representative EJP traces evoked by spontaneous motor CPG activity during fictive locomotion. Recordings were obtained from A3 muscle 6 in HL3 solution containing 1 mM Ca2+. (J–K) Quantification data for burst duration and overall firing time (from bursts of >15 s) per recording minute (n ≥ 6 animals). (L–M) eaat1hypo mutants display compromised locomotion. (L) Representative locomotion tracks of third instar larvae. (M) Quantification data for larval locomotion (n ≥ 16 animals). P values: ns, no significance; *, p<0.05; **, p<0.01; ****, p<0.0001. n: replicate number. Error bars indicate the standard errors of the means (SEM). Statistics: Student's t-test.
-
Figure 1—source data 1
Source data for Figure 1.
- https://doi.org/10.7554/eLife.47372.009
Figure 1—figure supplement 1
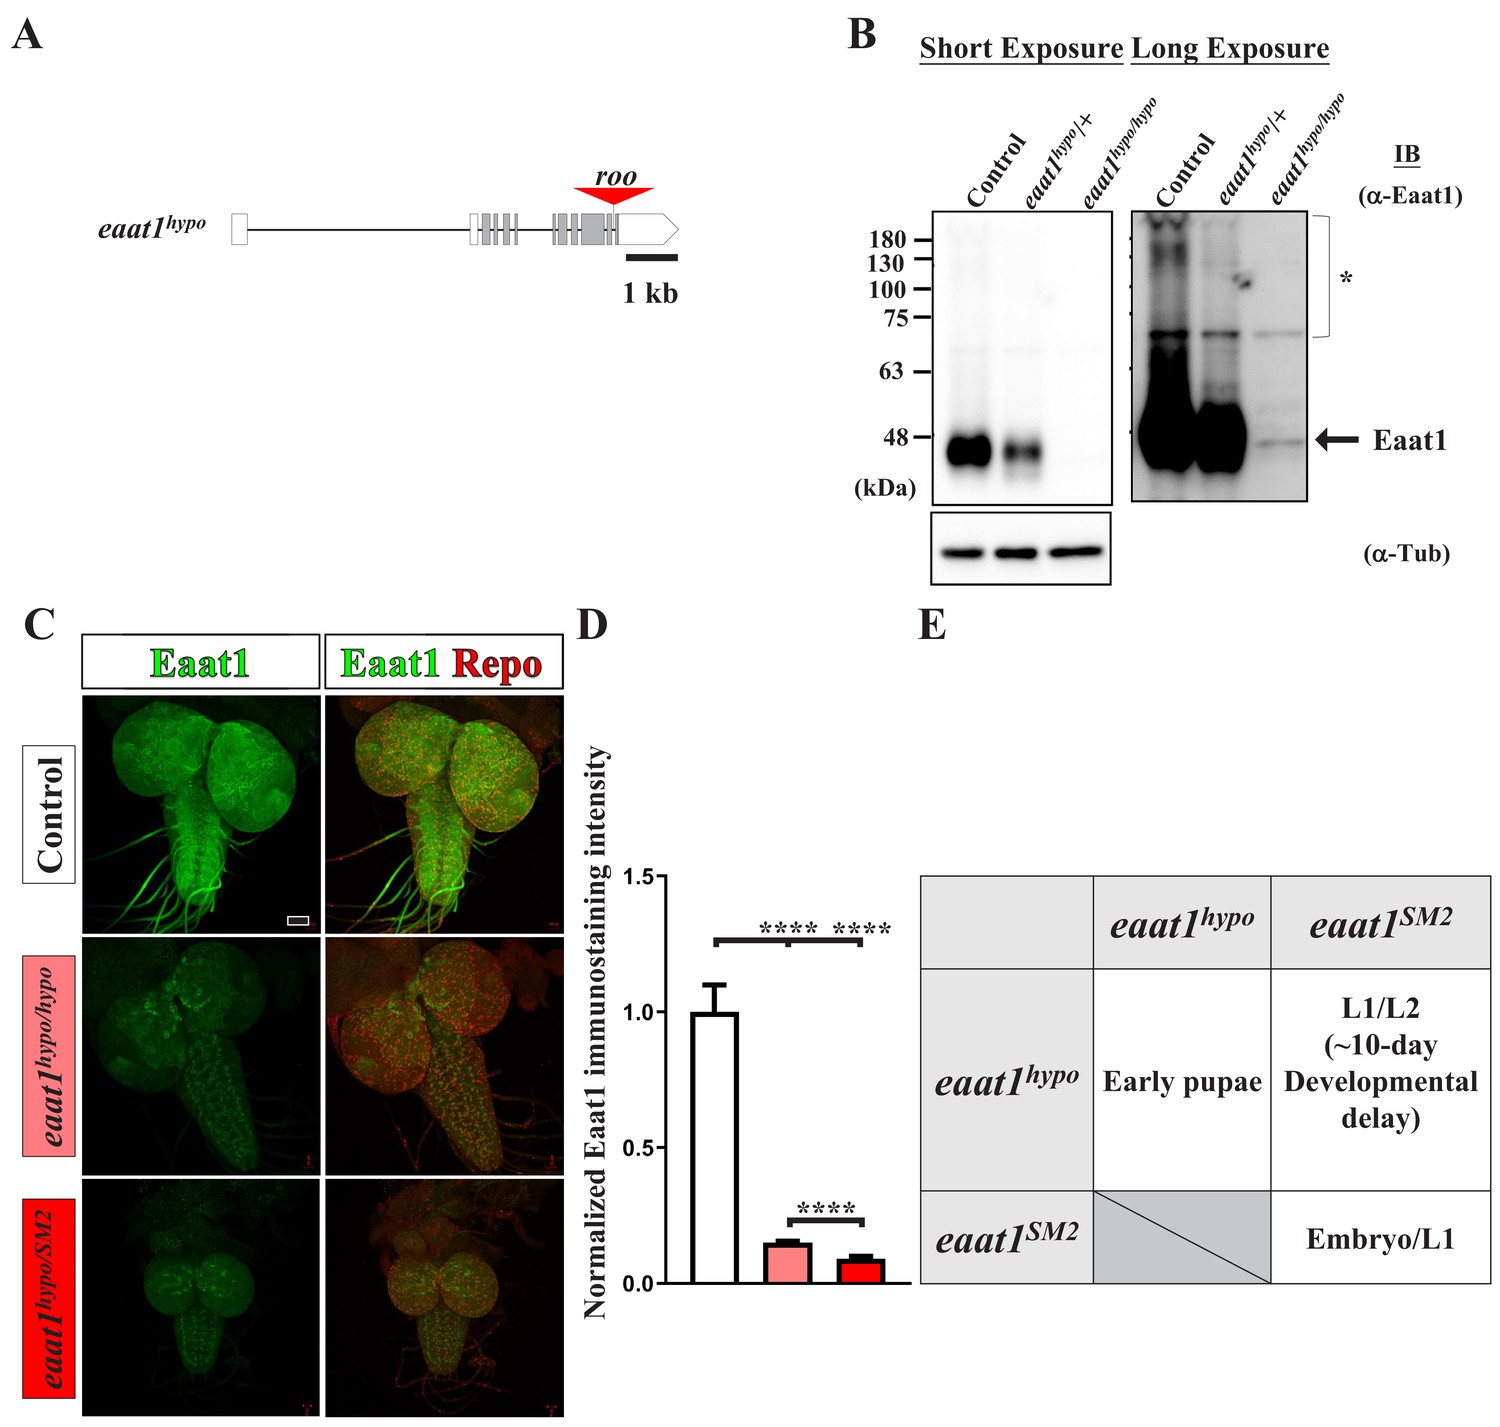
Characterization of the eaat1hypo mutant allele.
(A) The eaat1 locus comprises twelve exons, including 5' and 3' UTRs (white boxes) and coding regions (gray boxes). A roo transposon element is translocated into the last intron of eaat1 in the eaat1hypo allele. (B) Western blotting of α-Eaat1 indicates a severe reduction in Eaat1 protein from the eaat1hypo allele in lysates of larval brain and VNC. The VNCs of third instar larvae of controls (w1118), eaat1hypo/+, and eaat1hypo/hypo mutants were used. α-Tubulin level served as a loading control. * indicates potential posttranslational modifications and dimerization of the Eaat1 protein. (C,D) Eaat1 is largely absent from eaat1 mutants. (C) Representative confocal images of larval brain and VNC co-stained with α-Eaat1 (green) and α-Repo (red) obtained from controls (w1118), eaat1hypo/hypo mutants, and eaat1hypo/SM2 mutants. Scale bar: 20 μm. (D) Quantification data for the immunostaining signal intensity of Eaat1, normalized to the value of the controls. (E) Loss of eaat1 compromises animal development and viability. ~20% of eaat1hypo/hypo mutants survive until the early pupal stage. However, eaat1SM2/SM2 mutants die as embryos or as first instar larvae (L1). eaat1hypo/SM2 mutants exhibit significant developmental delay (~10 days) and mostly died as first instar larvae (L1) and second instar larvae (L2). ~1% of eaat1hypo/SM2 larvae survived to the third instar larval stage. P values: ****, p<0.0001. n: replicate number. Error bars indicate SEM. Statistics: one-way ANOVA with Tukey’s post hoc test.
-
Figure 1—figure supplement 1—source data 1
Source data for Figure 1—figure supplement 1.
- https://doi.org/10.7554/eLife.47372.004
Figure 1—figure supplement 2
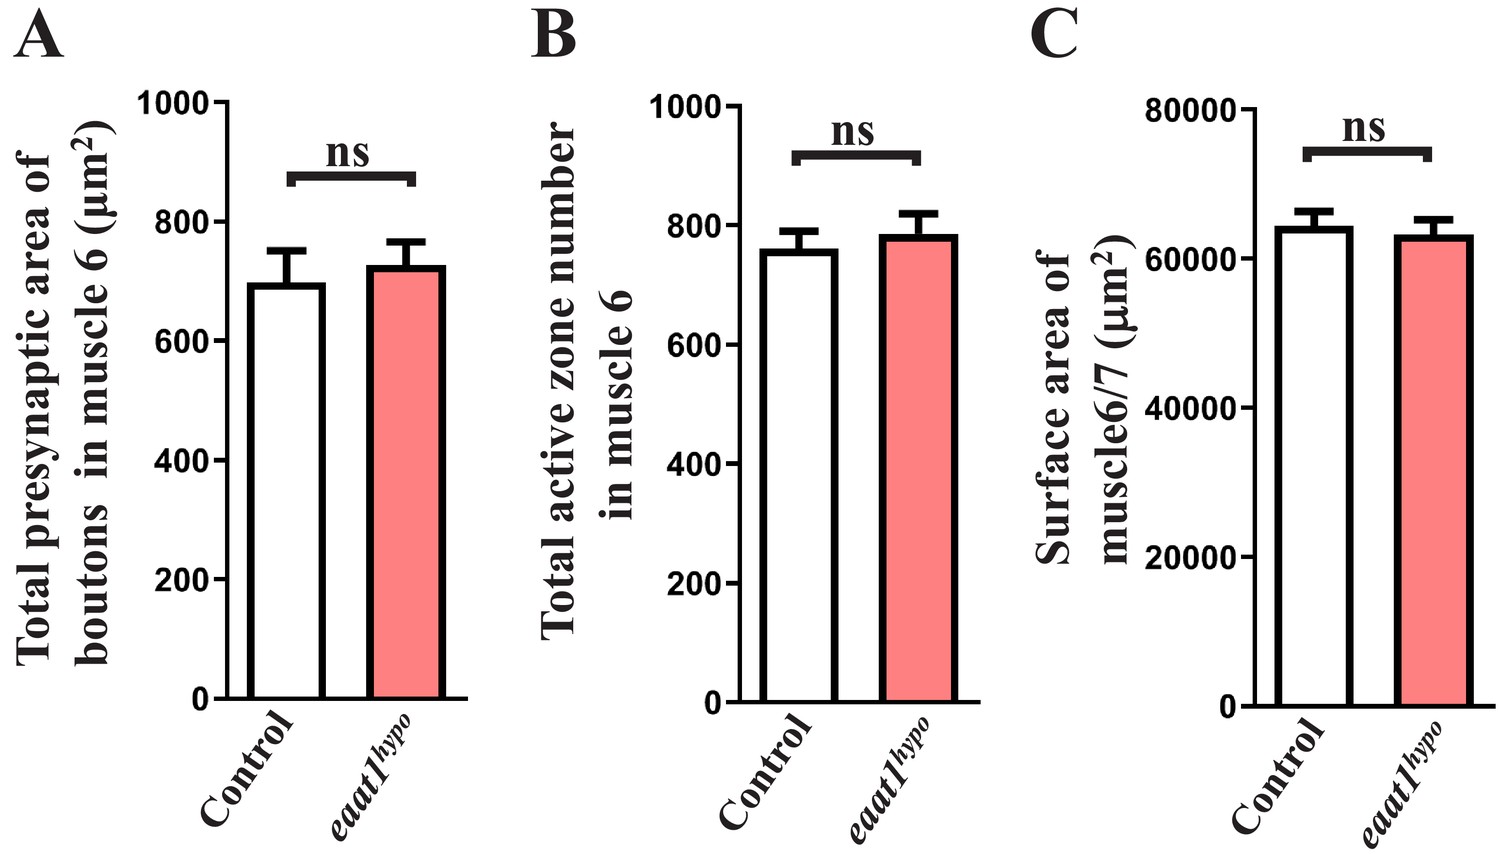
Morphological analysis of eaat1hypo mutant NMJ boutons and muscles.
(A,B) Quantification data for the total presynaptic area of NMJ boutons and total number of active zones in A2 muscle 6 of third instar larvae from controls (w1118) and eaat1hypo/hypo mutants (n ≥ 8 NMJs derived from n ≥ 5 animals for each genotype). Active zones were marked by α-Brp (nc82) immunostaining. (C) Quantification data for A2 muscle 6 and 7 surface area (n = 36). P value: ns, no significance. n: replicate number. Error bars indicate SEM. Statistics: Student's t-test.
-
Figure 1—figure supplement 2—source data 1
Source data for Figure 1—figure supplement 2.
- https://doi.org/10.7554/eLife.47372.006
Figure 1—figure supplement 3
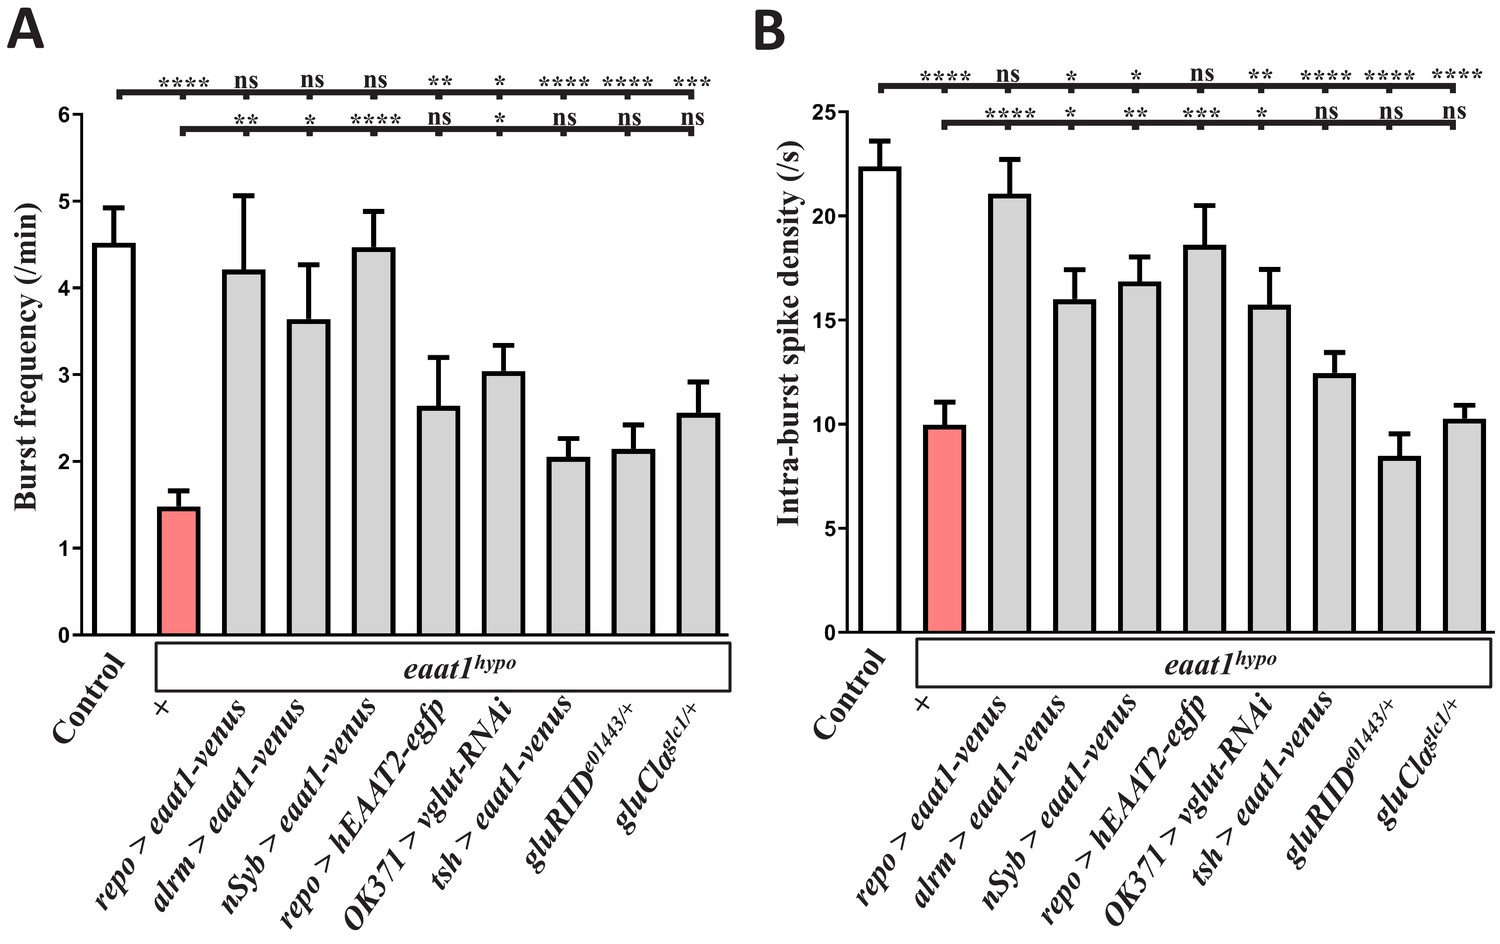
Analysis of the properties of the locomotor CPG output.
Quantification data for (A) burst duration and (B) intra-burst spike density of the motor CPG output. Larval genotypes and controls (w1118) are indicated (n ≥ 7 animals for each genotype). P values: ns, no significance; *, p<0.05; **, p<0.01; ***, p<0.001; ****, p<0.0001. n: replicate number. Error bars indicate SEM. Statistics: one-way ANOVA with Tukey’s post hoc test.
-
Figure 1—figure supplement 3—source data 1
Source data for Figure 1—figure supplement 3.
- https://doi.org/10.7554/eLife.47372.008
Figure 2 with 3 supplements
Eaat1 expressed in astrocyte-like glia plays a conserved role in maintaining motor system integrity.
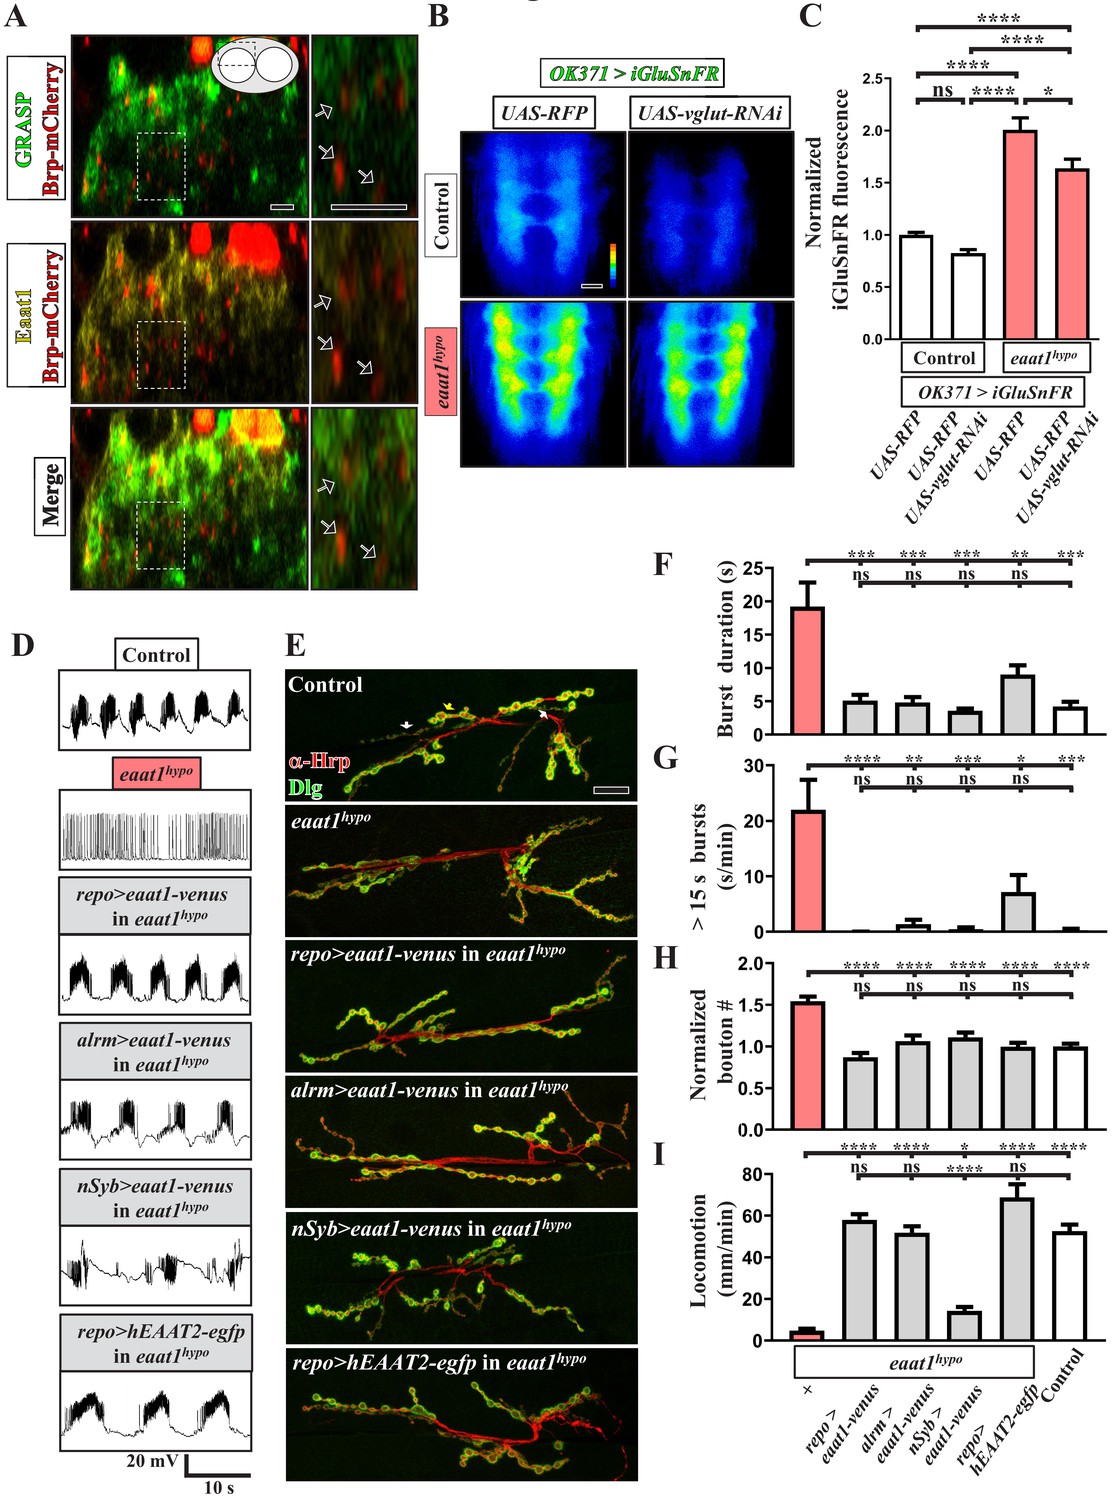
(A) GRASP assay showing a close association between astrocyte-like glia and motor neurons. Confocal cross-section images captured from the dorsal sector of the VNC of third instar larvae (repo-LexA/LexAOP-CD4::spGFP11/OK371-GAL4/UAS-CD4::spGFP1-10/UAS-brp-mCherry). Among the different types of glia, astrocyte-like glia predominantly extend their cellular processes into neuropils of the VNC. Arrows indicate clustered Brp-mCherry-labeled presynaptic compartments of glutamatergic interneurons, which are closely surrounded by GRASP signals (green) and Eaat1 proteins (yellow). Higher magnifications of the outlined regions are shown in the panels on the right. (B,C) Loss of eaat1 elevates perisynaptic glutamate. (B) Pseudocolored images of the VNC-expressing iGluSnFR obtained from third instar larvae of the indicated genotypes. UAS-RFP was used as the control UAS transgene. Representative images were captured in zero calcium HL3 solution. (C) Quantification data for iGluSnFR signal intensity, normalized to the value of control (OK371 >iGluSnFR + RFP) (n ≥ 9 VNCs for each genotype). (D–I) Glial or astrocytic expression of the eaat1-venus transgene or of the human EAAT2-egfp transgene fully rescues the motor system defects in eaat1hypo mutants. Neuronal expression of the eaat1-venus transgene in eaat1 mutants can restore premotor circuit activity and NMJ bouton growth but not locomotion. (D) Representative traces of EJPs evoked by spontaneous motor CPG activity during fictive locomotion obtained from third instar larvae of controls (w1118) and the indicated genotypes. Recordings were obtained from A3 muscle 6 in HL3 solution containing 1 mM Ca2+. Quantification data for burst duration and overall firing time (for bursts of >15 s) for each recording minute are shown in panels (F,G) (n ≥ 6 animals for each genotype). (E) Confocal images of NMJs co-stained with α-HRP (red) and α-Dlg (green) obtained from third instar larvae of controls (w1118) and the indicated genotypes. Quantification data for NMJ bouton number for each muscle area, normalized to the value of controls, are shown in panel (H) (n ≥ 9 NMJs derived from A2 muscles 6 and 7 for each genotype). (I) Quantification data for the locomotion of third instar larvae of controls (w1118) and the indicated genotypes (n ≥ 10 animals for each genotype). P values: ns, no significance; *, p<0.05; **, p<0.01; ***, p<0.001; ****, p<0.0001. n: replicate number. Error bars indicate SEM. Statistics: one-way ANOVA with Tukey’s post hoc test. Scale bars: 5 μm in (A), 20 µm in (B), 20 µm in (E).
-
Figure 2—source data 1
Source data for Figure 2.
- https://doi.org/10.7554/eLife.47372.015
Figure 2—figure supplement 1
Expression pattern of Eaat1 in the larval VNC.
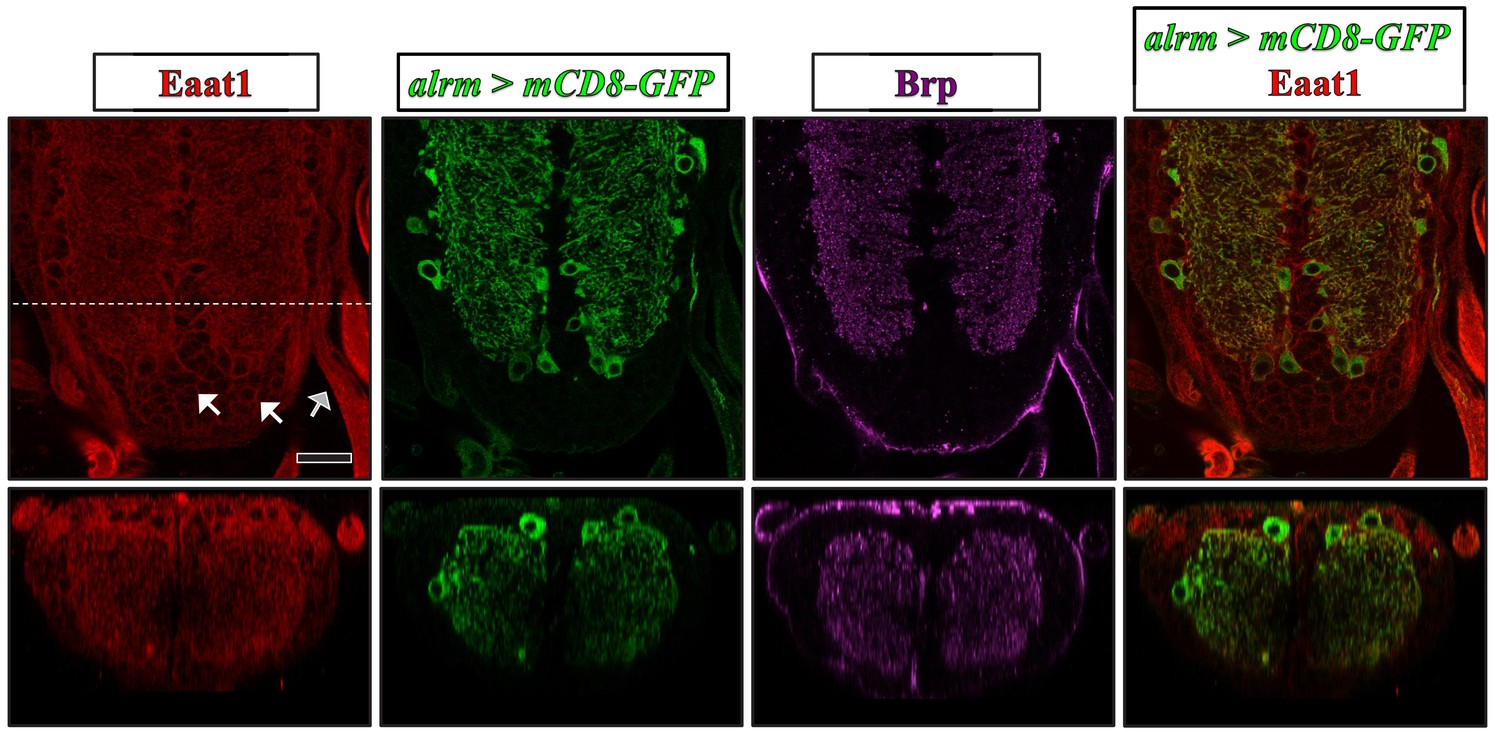
Representative confocal images of third instar larval VNCs expressing UAS-mCD8-GFP driven with alrm-GAL4 (an astrocyte-like glia-specific GAL4) and co-stained with α-Eaat1 (red), α-GFP (green), and α-Brp (nc82, magenta). Astrocyte-like glia are enriched for Eaat1 expression. Moreover, Eaat1 was found in cortex glia (white arrows) and in ensheathing glia (gray arrows). Bottom panels show cross-sectional images reflecting the dotted white line. Scale bar: 20 μm.
Figure 2—figure supplement 2

GRASP assay for the physical contact between astrocyte-like glia and glutamatergic neurons.
Confocal z-projection images of the VNCs of third instar larvae of the indicated genotypes. GRASP signals (green) are enriched in neuropils (bottom panel), which do not appear in either control, OK371-GAL4/UAS-CD4::spGFP1-10 or repo-LexA/LexAOP2-CD4::spGFP11 (top and middle panels). The VNCs were co-stained with α-HRP (red). Scale bar is 20 μm.
Figure 2—figure supplement 3
Phenotypic characterization of eaat1hypo/SM2 mutants.
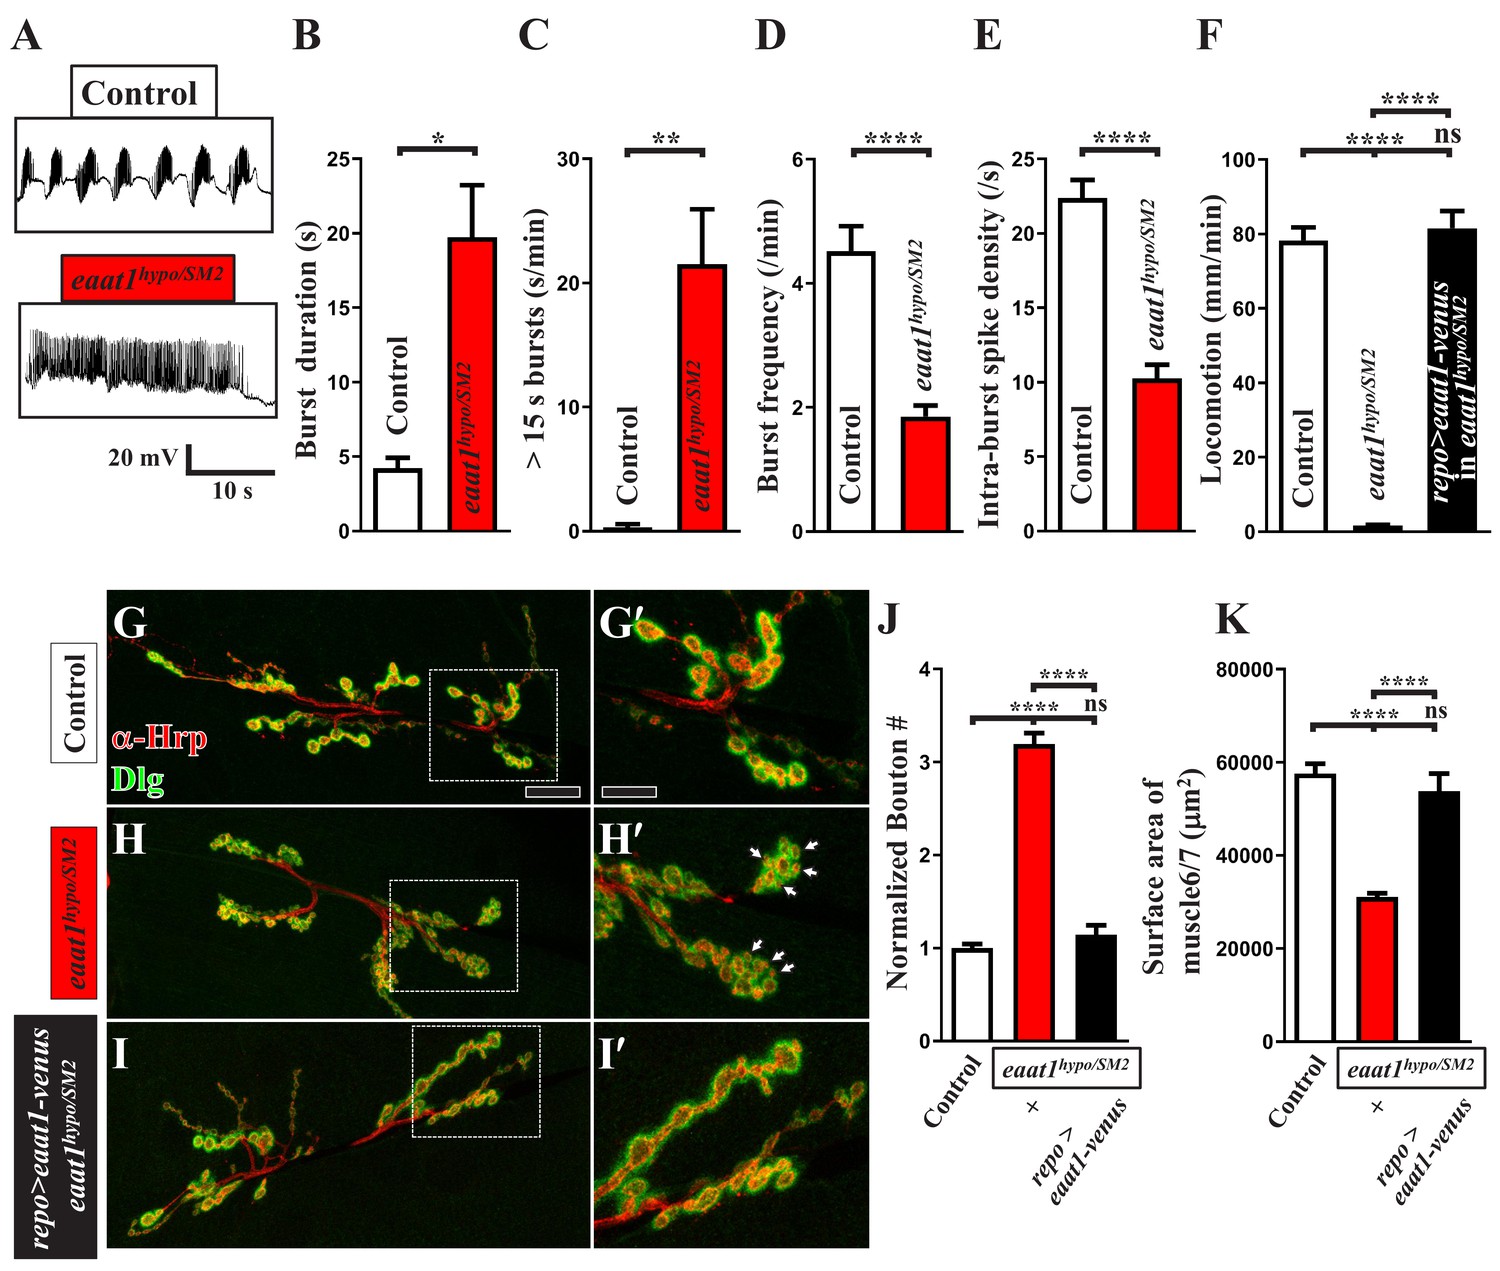
(A–F) eaat1hypo/SM2 mutants display prolonged premotor inputs. (A) Representative EJP traces evoked by spontaneous motor CPG activity during fictive locomotion. w1118 animals were used as controls. Recordings were obtained from A3 muscle 6 in HL3 solution containing 1 mM Ca2+. (B–E) Quantification data for burst duration, overall firing time (from bursts of >15 s), burst frequency, and intra-burst spike density per recording minute (n ≥ 6 animals). (F) eaat1hypo/SM2 mutants show a severe locomotion defect. Glial expression of eaat1-venus using repo-GAL4 rescued the compromised locomotion of eaat1hypo/SM2 mutants. Quantification data for larval locomotion (n ≥ 13 animals). (G–J) eaat1hypo/SM2 third instar larvae have increased bouton number and small bouton size. (G–I) Confocal images of NMJs co-stained with α-HRP (red) and α-Dlg (green) from controls (w1118), eaat1hypo/SM2 mutants, and eaat1hypo/SM2 mutants rescued with glial expression of eaat1-venus (using repo-GAL4). Higher magnifications of the NMJ boutons outlined in panels (G–I) are shown in panels (G'-I'). Scale bar: 20 µm in (A,B), 10 µm in (A'-B'). (J) The number of NMJ boutons per muscle area was counted and normalized to the value of controls (n ≥ 15 NMJs derived from A2 muscles 6 and 7 for each genotype). (K) Quantification data for A2 muscle 6 and 7 surface area (n ≥ 12). P values: ns, no significance; *, p<0.05; **, p<0.01; ****, p<0.0001. n: replicate number. Error bars indicate SEM. Statistics: Student's t-test and one-way ANOVA with Tukey’s post hoc test.
-
Figure 2—figure supplement 3—source data 1
Source data for Figure 2—figure supplement 3.
- https://doi.org/10.7554/eLife.47372.014
Figure 3 with 1 supplement
Glutamate-mediated excitotoxicity dysregulates premotor circuit activity in eaat1 mutants.
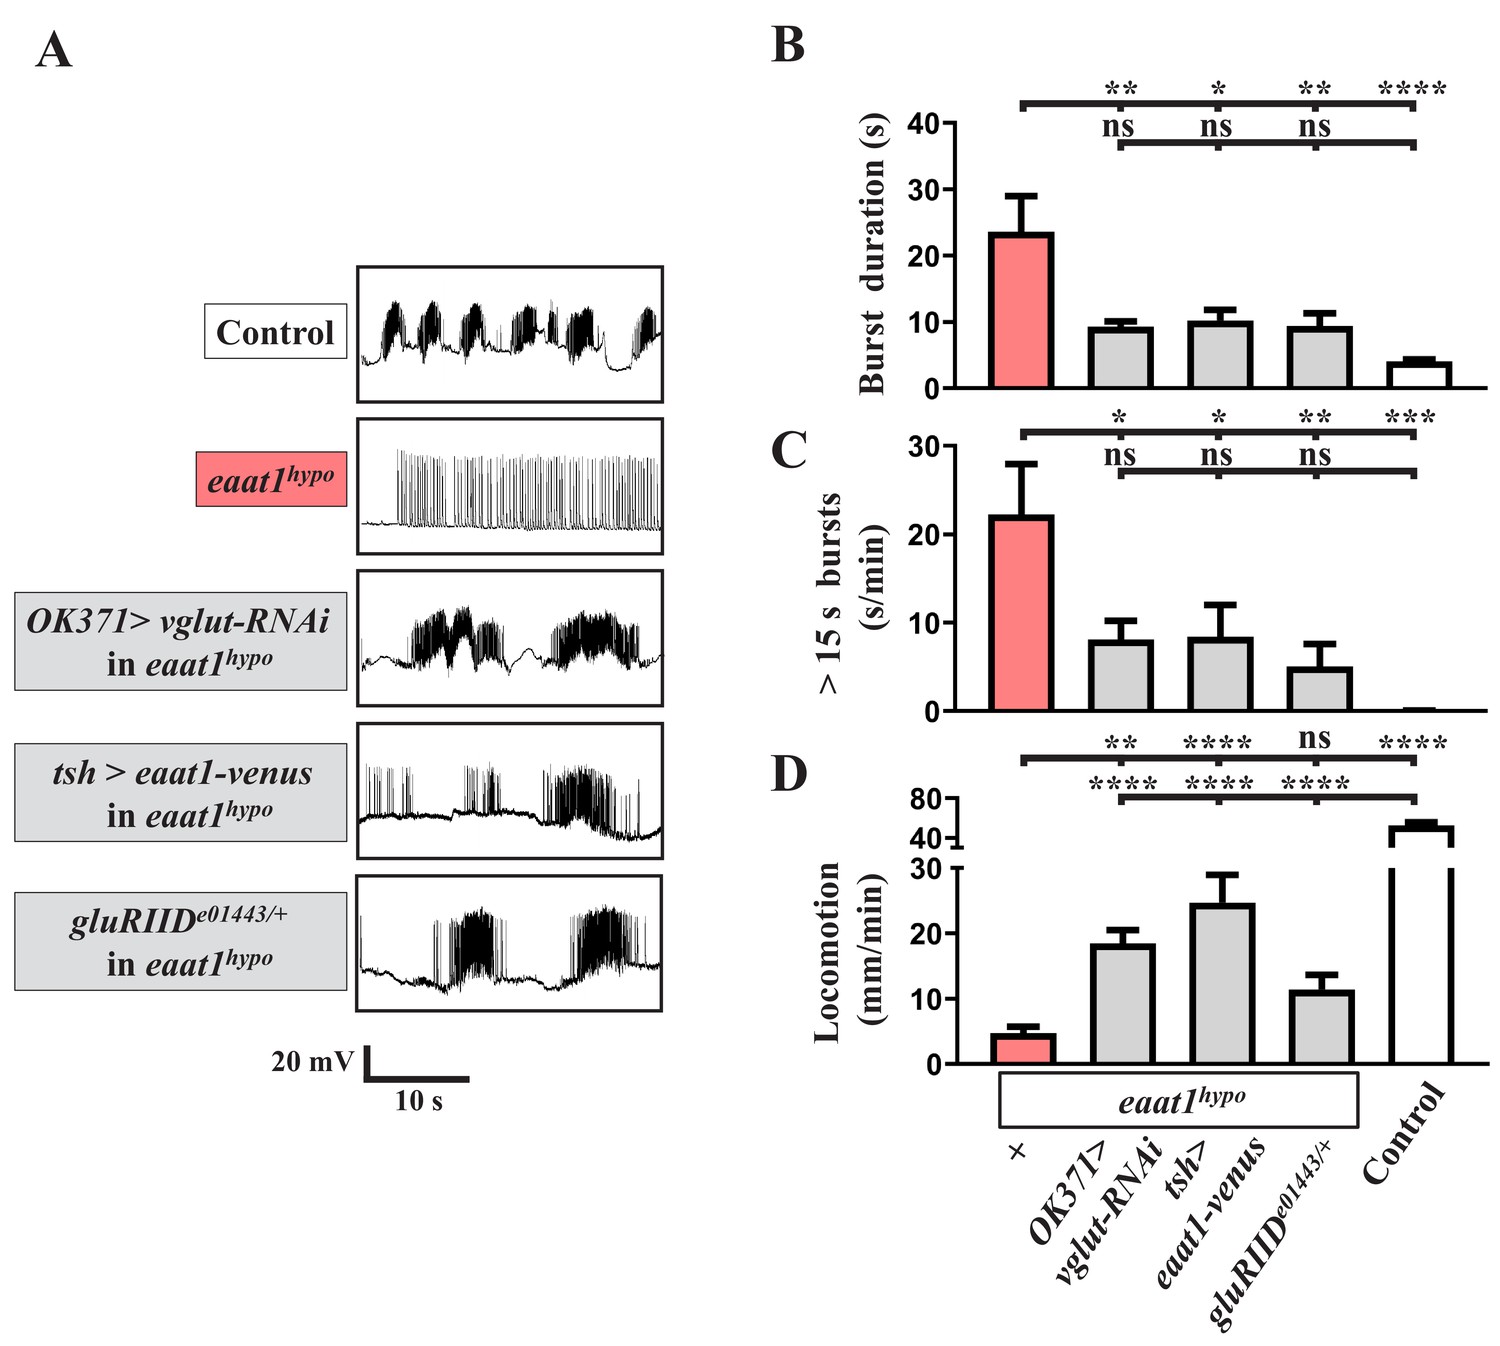
(A–D) Reducing glutamate release or inhibiting the postsynaptic glutamate receptor reverses prolonged burst duration in eaat1hypo mutants. (A) Representative traces of EJPs evoked by spontaneous motor CPG activity during fictive locomotion obtained from third instar larvae of controls (w1118) and the indicated genotypes. Quantification data for burst duration and overall firing time (for bursts of >15 s) per recording minute are shown in panels (B,C) (n ≥ 6 animals for each genotype). (D) Quantification data for locomotion of third instar larvae of controls (w1118) and the indicated genotypes (n ≥ 11 animals for each genotype). P values: ns, no significance; *, p<0.05; **, p<0.01; ***, p<0.001; ****, p<0.0001. n: replicate number. Error bars indicate SEM. Statistics: one-way ANOVA with Tukey’s post hoc test.
-
Figure 3—source data 1
Source data for Figure 3.
- https://doi.org/10.7554/eLife.47372.019
Figure 3—figure supplement 1

Removal of one copy of gluClα does not affect the motor-system deficits caused by eaat1 depletion.
(A) Representative traces of EJPs evoked by spontaneous motor CPG activity during fictive locomotion obtained from third instar larvae of controls (w1118) and the indicated genotypes. (B,C) Quantification data for (B) burst duration and (C) overall firing time (for bursts of >15 s) per recording minute (n ≥ 8 animals for each genotype). (D) Quantification data for locomotion of third instar larvae (n ≥ 16 animals for each genotype). P values: ns, no significance; *, p<0.05; **, p<0.01; ****, p<0.0001. n: replicate number. Error bars indicate SEM. Statistics: one-way ANOVA with Tukey’s post hoc test.
-
Figure 3—figure supplement 1—source data 1
Source data for Figure 3—figure supplement 1.
- https://doi.org/10.7554/eLife.47372.018
Figure 4
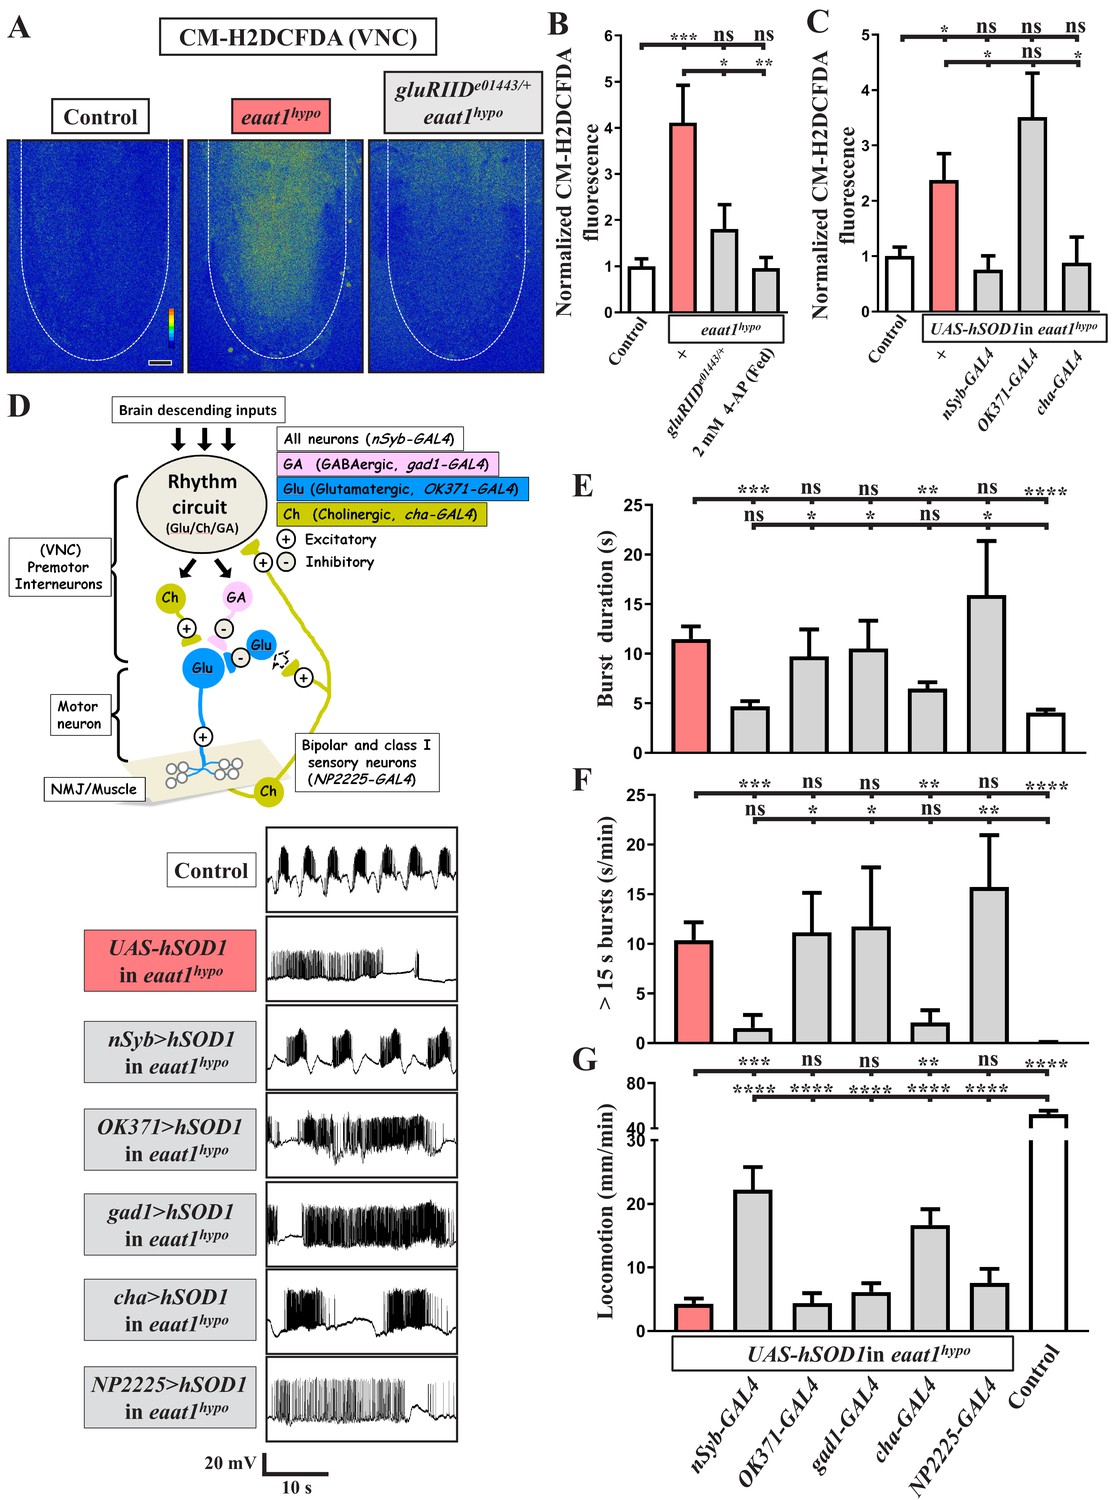
Loss of eaat1 elevates oxidative stress in cholinergic interneurons, leading to premotor circuit dysfunction.
(A–C) Loss of eaat1 elevates ROS in the VNC through excess activation of glutamate receptors. (A) Pseudocolored confocal images of the VNCs (outlined with white dotted lines) stained with CM-H2DCFDA obtained from third instar larvae of controls (w1118) and the indicated genotypes. Scale bar: 20 μm. (B) Averaged CM-H2DCFDA fluorescence intensity in VNCs was normalized to the value of controls (n ≥ 6 VNCs for each genotype). (C) Averaged CM-H2DCFDA fluorescence intensity in VNCs of third instar larvae of controls (w1118) and the indicated genotypes, normalized to the value of controls (n ≥ 5 VNCs for each genotype). (D–G) Increased oxidative stress in cholinergic interneurons contributes to dysregulated premotor circuit activity. Schematic of neuronal type and connectivity in the Drosophila larval locomotor circuit (top panel). Corresponding neurons expressing specific GAL4 drivers are indicated. Representative traces (bottom panel) of EJPs evoked by spontaneous motor CPG activity during fictive locomotion; these traces were obtained from third instar larvae of controls (w1118) and the indicated genotypes. (E–F) Quantification data for burst duration and overall firing time (for bursts > 15 s) per recording minute (n ≥ 6 animals for each genotype). (G) Quantification data for the locomotion of the third instar larvae of controls (w1118) and the indicated genotypes (n ≥ 10 animals for each genotype). P values: ns, no significance; *, p<0.05; **, p<0.01; ***, p<0.001; ****, p<0.0001. n: replicate number. Error bars indicate SEM. Statistics: one-way ANOVA with Tukey’s post hoc test.
-
Figure 4—source data 1
Source data for Figure 4.
- https://doi.org/10.7554/eLife.47372.021
Figure 5 with 1 supplement
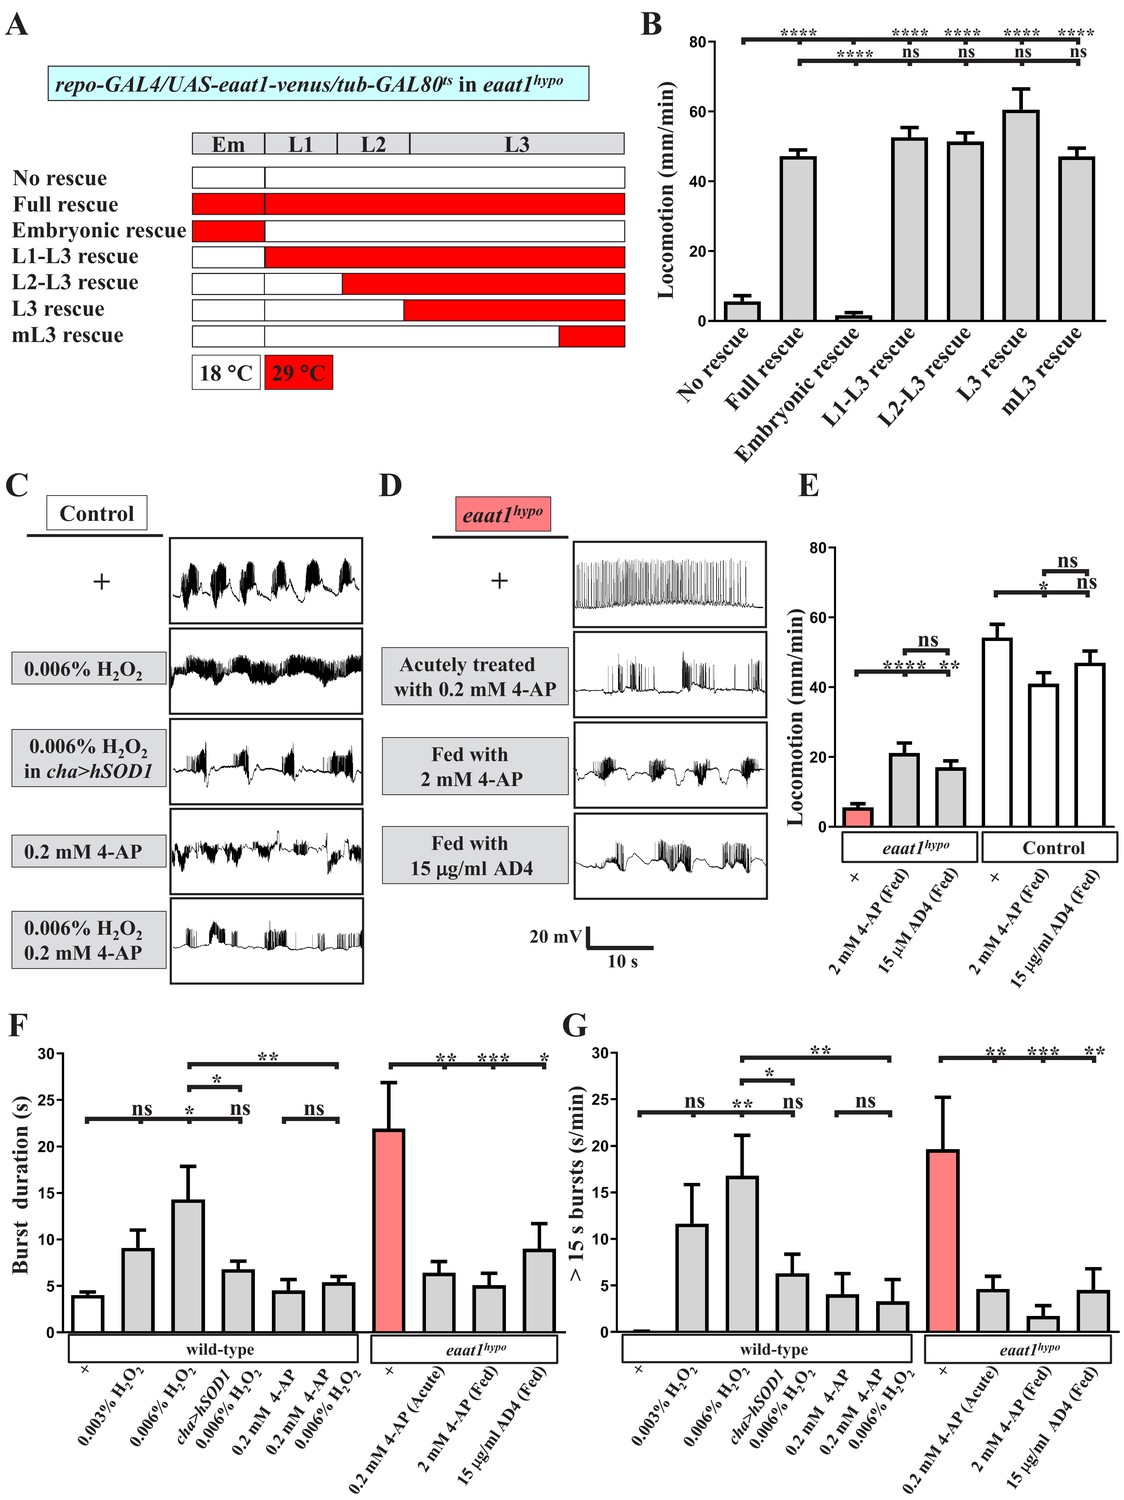
Increased excitotoxicity-induced ROS hampers the excitability of cholinergic interneurons.
(A–B) The locomotion defect caused by loss of eaat1 is rescued by expressing eaat1-venus at the late larval stage. (A) Schematic of the temporal expression of UAS-eaat1-venus controlled by the GAL80ts/GAL4 system during embryonic and larval stages. Animal genotypes are indicated. Developmental timescale of larvae at 18°C and 29°C: Em (embryo stage, 0–48 hr after egg laying (18°C) and 0–12 hr after egg laying (29°C)); L1 (first instar larvae, 0–48 hr after embryo hatching (18°C) and 0–12 hr after embryo hatching (29°C)); L2 (second instar larvae, 48–96 hr after embryo hatching (18°C) and 12–24 hr after embryo hatching (29°C)); and L3 (third instar larvae, 96–240 hr after embryo hatching (18°C) and 24–60 hr after embryo hatching (29°C)). Expression of eaat1-venus was restricted at 18°C (white boxes), but was switched on at 29°C (red boxes). (B) Quantification data for locomotion of third instar larvae (n ≥ 8 third instar larvae for each genotype). (C) Acute exposure of H2O2 phenocopies the prolonged burst duration of the motor CPG, which is reversed by expression of hSOD1 in cholinergic interneurons or by 0.2 mM 4-AP treatment. The representative traces show EJPs evoked by spontaneous motor CPG activity during fictive locomotion obtained from third instar wild-type controls (w1118) and third instar wild-type controls expressing hSOD1 with cha-GAL4. Larval fillets were acutely exposed to 0.006% H2O2-containing HL3 solution for 3 min, followed by 10 min recordings in the same solution. For 4-AP treatment, larval fillets were bathed in 0.2 mM 4-AP-containing HL3 solution for 5 min and then bathed in 0.2 mM 4-AP/0.006% H2O2-containing HL3 solution for 3 min, followed by 10 min recordings in the same solution. Quantification data for burst duration and overall firing time (for bursts of >15 s) per recording minute are shown in panels (F,G) (n ≥ 8 animals for each genotype). (D) Prolonged burst duration caused by loss of eaat1 can be rescued by acute treatment of 0.2 mM 4-AP or by long-term feeding of 2 mM 4-AP or 15 μg/ml AD4. Representative EJP traces evoked by spontaneous motor CPG activity during fictive locomotion obtained from third instar eaat1hypo/hypo mutants. Larval fillets were bathed in 0.2 mM 4-AP-containing HL3 solution for 5 min, followed by 10 min recordings in the same solution. For long-term drug treatment, eaat1hypo mutants were fed with 2 mM 4-AP or 15 μg/ml AD4 throughout the larval stage. Larval fillets were subjected to recordings in HL3 solution. Quantification data for burst duration and overall firing time (for bursts of >15 s) per recording minute are shown in panels (F,G) (n ≥ 7 animals for each genotype). (E) Long-term feeding of 2 mM 4-AP or 15 μg/ml AD4 improves locomotion of eaat1hypo mutants. 2 mM 4-AP but not 15 μg/ml AD4 slightly reduced locomotion of control (w1118) larvae. Locomotion of treated larvae was measured and quantified (n ≥ 17 animals for each genotype). P values: ns, no significance; *, p<0.05; **, p<0.01; ***, p<0.001; ****, p<0.0001. n: replicate number. Error bars indicate SEM. Statistics: one-way ANOVA with Tukey’s post hoc test.
-
Figure 5—source data 1
Source data for Figure 5.
- https://doi.org/10.7554/eLife.47372.025
Figure 5—figure supplement 1

No overt change in the structural integrity of the larval VNC upon loss of eaat1.
(A, C, F) Representative confocal images of VNCs stained with α-Elav (A, F) or α-GFP (C, F) obtained from third instar larvae of the indicated genotypes. Expression of UAS-mCD8-GFP driven by alrm-GAL4 and R49G06-GAL4 labels astrocyte-like glia and subsets of motor neurons, respectively. (B, D, E, G) Quantification data for the number of Elav-positive neurons per VNC area (B), the number of astrocytes per VNC area (D), averaged GFP staining intensity of astrocyte processes (normalized to the value of controls) (E), and averaged GFP staining intensity of the dendritic field of motor neurons (normalized to the value of controls) (G) (n ≥ 5 VNCs for each genotype). P value: ns, no significance. n: replicate number. Error bars indicate SEM. Scale bar: 20 μm. Statistics: Student's t-test.
-
Figure 5—figure supplement 1—source data 1
Source data for Figure 5—figure supplement 1.
- https://doi.org/10.7554/eLife.47372.024
Figure 6 with 1 supplement
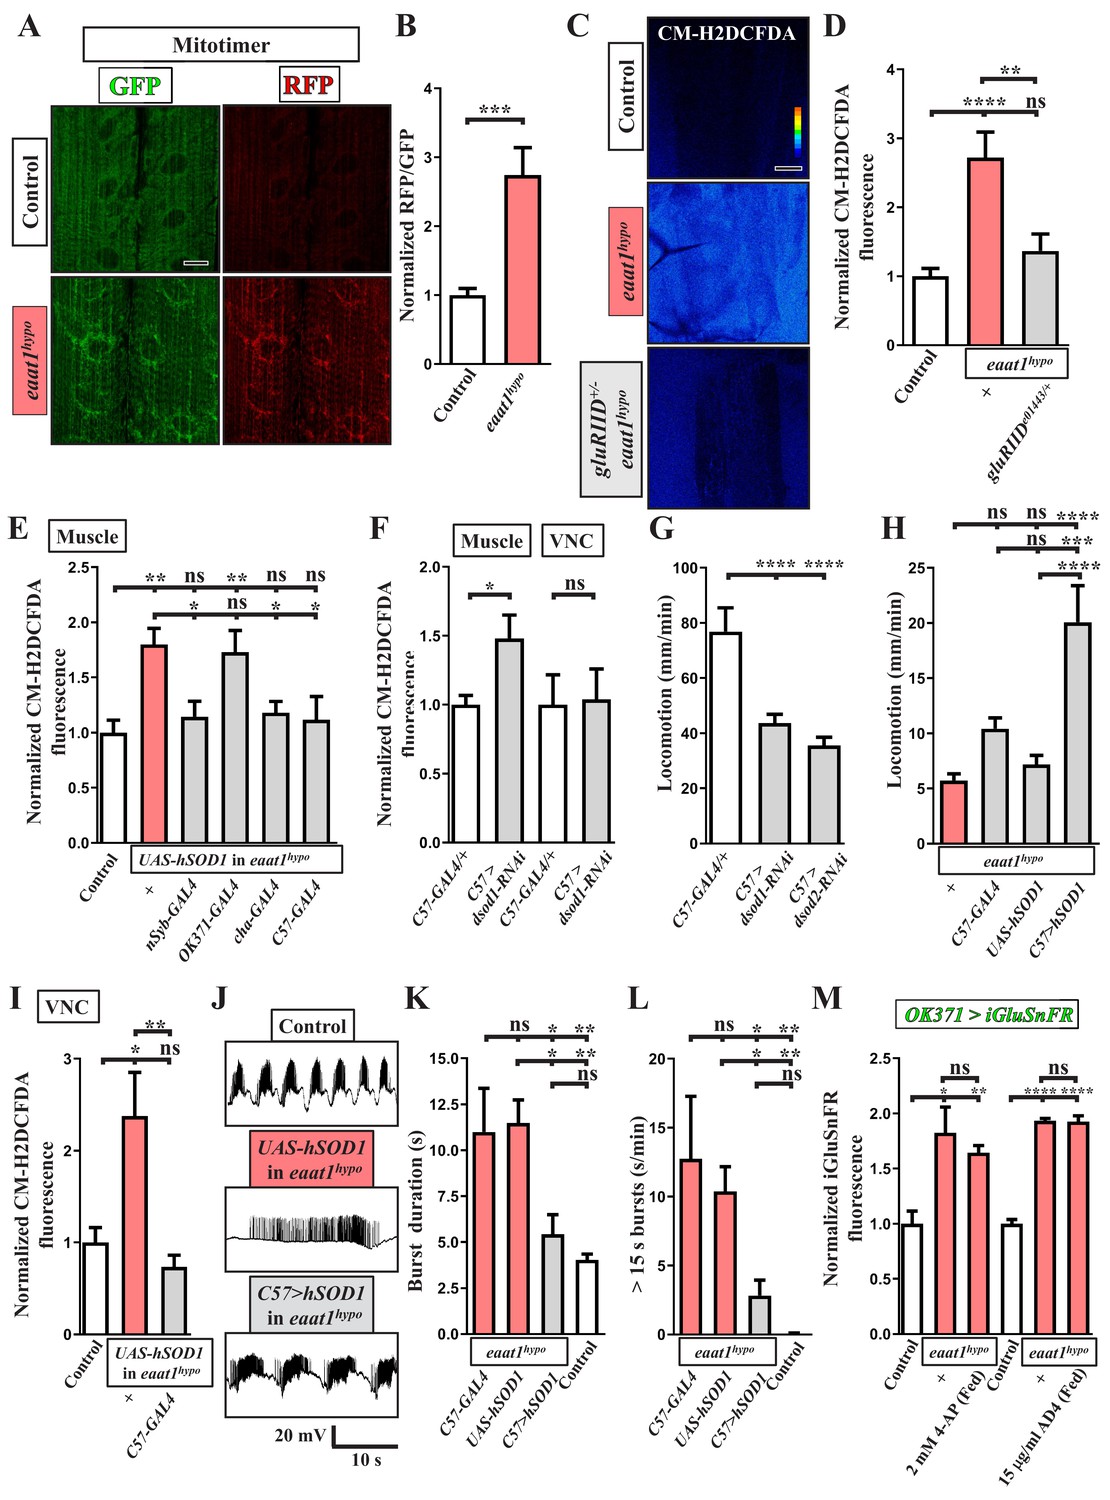
ROS-induced muscle weakness feedback maintains the increased premotor oxidative stress to exacerbate circuit dysfunction.
(A,B) Loss of eaat1 induces mitochondrial oxidative stress in muscles. (A) Confocal images of muscles 6 and 7 of third instar larvae expressing mitotimer using C57-GAL4 obtained from wild-type controls (w1118) and eaat1hypo/hypo mutants. Scale bar: 20 µm. (B) The RFP/GFP ratio of mitotimer is assessed and normalized to the value of controls (n ≥ 6 animals for each genotype). (C,D) Reducing gluRIID can normalize the increased oxidative stress resulting from loss of eaat1. (C) Pseudocolored confocal images of muscles 6 and 7 of the third instar larvae of controls (w1118) and the indicated genotypes stained with CM-H2DCFDA. Scale bar: 20 μm. (D) Averaged CM-H2DCFDA fluorescence intensity was quantified and normalized to the value of controls (n ≥ 13 A3 muscles 6 and 7 from (n ≥ 7) animals for each genotype). (E) Expression of hSOD1 using nSyb-GAL4, cha-GAL4 or C57-GAL4 but not OK371-GAL4 relieves the muscular oxidative stress of eaat1hypo mutants. CM-H2DCFDA fluorescence intensity of muscles 6 and 7 from the third instar larvae of controls (w1118) and the indicated genotypes is quantified and normalized to the value of controls (n ≥ 12 A3 muscles 6 and 7 from (n ≥ 7) animals for each genotype). (F) Muscular expression of dsod1-RNAi using C57-GAL4 promotes ROS production in muscles but not in VNCs. Quantification data for CM-H2DCFDA fluorescence are shown. (n ≥ 7 animals for each genotype.) (G) Muscular knockdown of dsod1 or dsod2 impairs larval locomotion. UAS-dsod1-RNAi or UAS-dsod2-RNAi is expressed by using C57-GAL4, and larval locomotion was quantified (n ≥ 21 animals for each genotype). (H) Expression of hSOD1 using C57-GAL4 improves eaat1hypo mutant locomotion. Locomotion of third instar larvae of the indicated genotypes is quantified (n ≥ 23 animals for each genotype). (I–L) Expression of hSOD1 using C57-GAL4 relieves premotor oxidative stress of eaat1hypo mutants and reverses premotor circuit dysregulation. (I) The CM-H2DCFDA fluorescence intensity of VNCs of thethird instar larvae of controls (w1118) and the indicated genotypes was quantified and normalized to the value of controls (n ≥ 6 animals for each genotype). (J) Representative traces of EJPs evoked by spontaneous motor CPG activity during fictive locomotion obtained from the third instar larvae of controls (w1118) and the indicated genotypes. (K–L) Quantification data for burst duration and overall firing time (for bursts of >15 s) per recording minute (n ≥ 7 animals for each genotype). (M) Either neuronal inactivation or relieving oxidative stress does not affect the levels of perisynaptic glutamate of glutamatergic interneurons in eaat1 mutants. Perisynaptic glutamate was detected by expression of the iGluSnFR reporter driven by OK371-GAL4. Averaged iGluSnFR fluorescence intensity was quantified and normalized to the value of controls (n ≥ 4 VNC for each genotype). P values: ns, no significance; *, p<0.05; **, p<0.01; ***, p<0.001; ****, p<0.0001. n: replicate number. Error bars indicate SEM. Statistics: one-way ANOVA with Tukey’s post hoc test.
-
Figure 6—source data 1
Source data for Figure 6.
- https://doi.org/10.7554/eLife.47372.029
Figure 6—figure supplement 1

Phenotypic characterization of dsod1 knockdown larvae.
(A–B) Expression of dsod1-RNAi in muscles using C57-GAL4 impairs muscle contractility. (A) Video snapshots of third instar larval fillets of indicated genotypes during fictive locomotion. A2 segmental muscles are outlined by dotted lines. Scale bars: 0.1 cm. (B) Overall muscle surface area in relaxed or contracted state during fictive locomotion. Reduced muscle surface area upon contraction is divided by the surface area of relaxed muscles to indicate muscle contractility (n ≥ 10 animals for each genotype). (C–I) Muscular knockdown of dsod1 does not affect neurotransmitter release and locomotor CPG output activity. P values: ns, no significance; **, p<0.01. n: replicate number. Error bars indicate SEM. Statistics: Student's t-test.
-
Figure 6—figure supplement 1—source data 1
Source data for Figure 6—figure supplement 1.
- https://doi.org/10.7554/eLife.47372.028
Figure 7
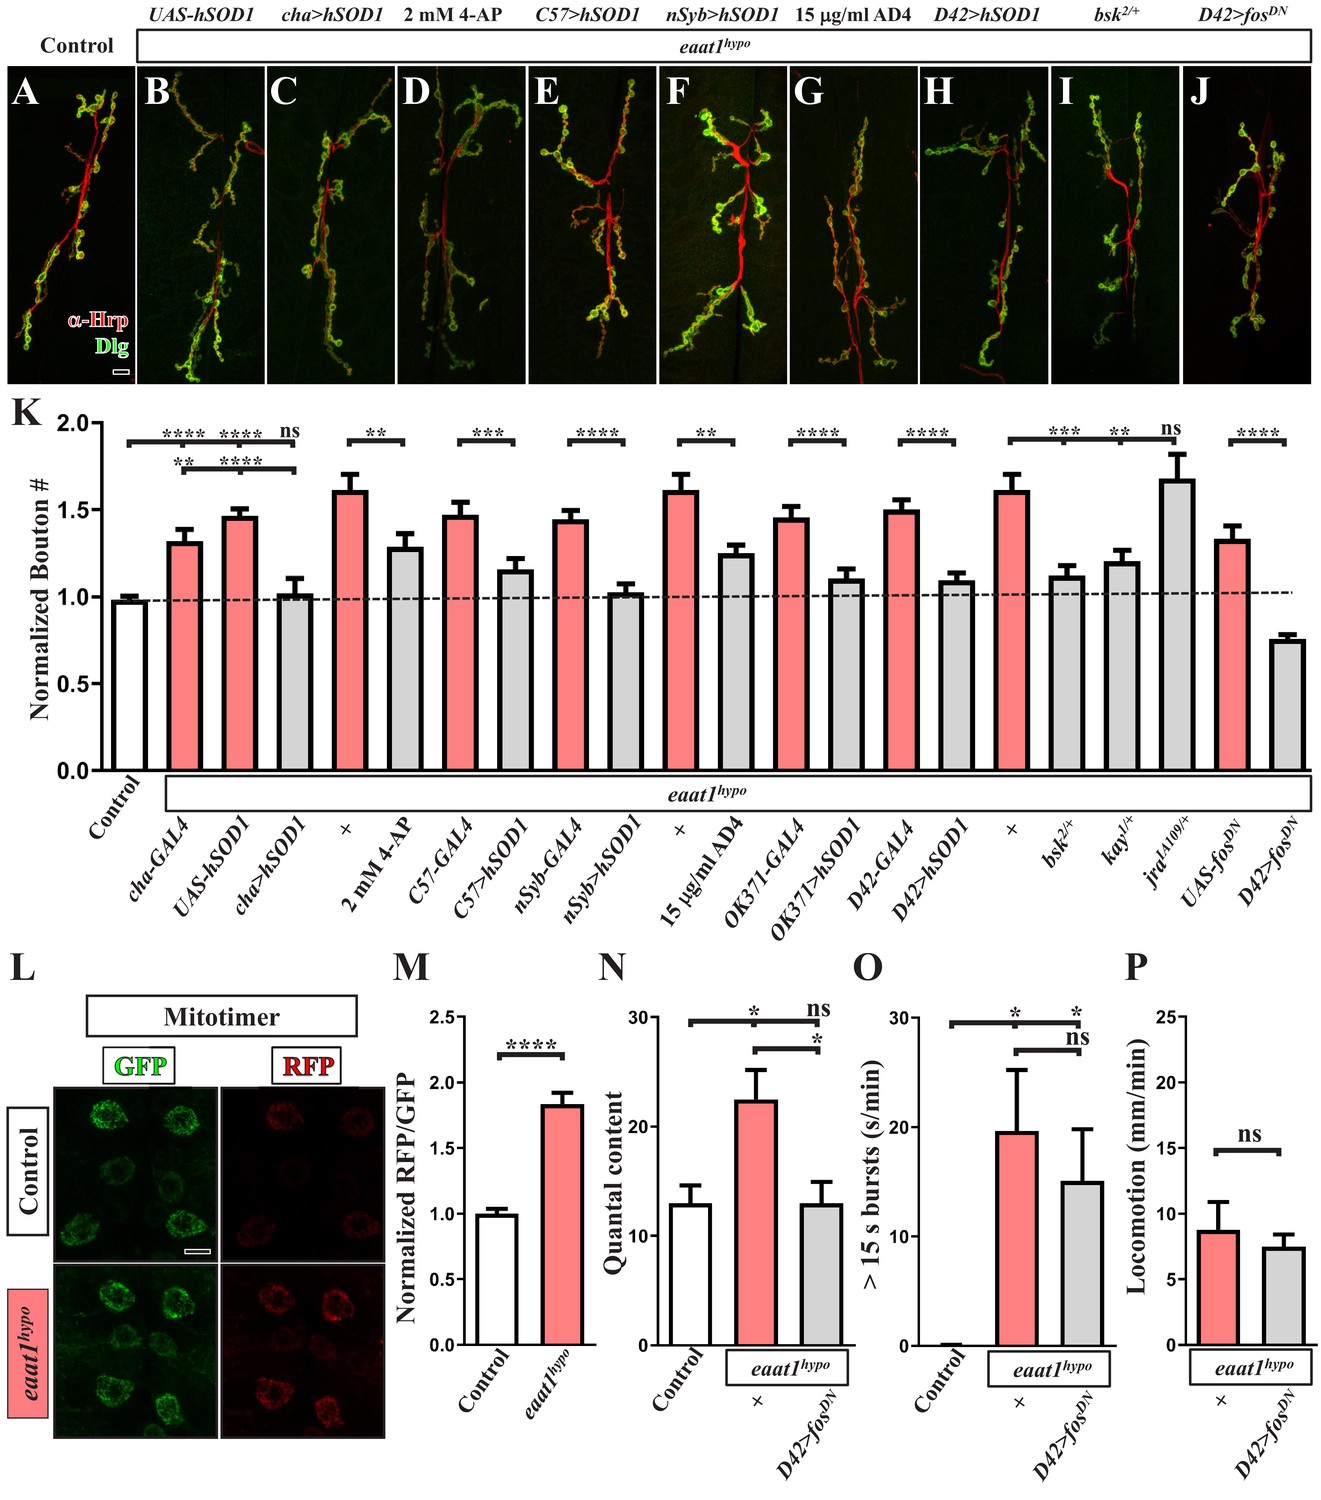
Premotor circuit dysfunction causes altered NMJ bouton architecture via ROS-dependent activation of the JNK signaling pathway upon loss of eaat1.
(A–J) Representative confocal images of NMJs co-stained with α-HRP (red) and α-Dlg (green) obtained from third instar larvae of controls (w1118) and the indicated genotypes. Scale bar: 10 µm. (K) Quantification data for the number of NMJ boutons per muscle area normalized to the value of controls (n ≥ 7 NMJs of A2 muscles 6 and 7 derived from n ≥ 7 animals for each genotype). (L–M) Loss of eaat1 increases mitochondrial ROS in motor neurons. (L) Representative confocal images of motor neurons of third instar larvae expressing mitotimer using D42-GAL4 obtained from controls (w1118) and eaat1hypo/hypo mutants. Scale bar: 5 µm. (M) The RFP/GFP ratio of mitotimer was quantified and normalized to the value of controls (n ≥ 10 animals for each genotype). (N,O) Expression of fosDN in motor neurons rescues the NMJ bouton phenotype based on normalized quantal content, but does not affect premotor circuit dysregulation in eaat1hypo mutants. (N) Quantification data for quantal content recorded from A3 muscle 6 of third instar larvae of controls (w1118) and the indicated genotypes with 0.2 Hz electric stimulation in 0.5 mM Ca2+-containing HL3 solution (n ≥ 6 animals for each genotype). (O) Quantification data for overall firing time (for bursts of >15 s) per recording minute (n ≥ 8 animals for each genotype). (P) Quantification data for larval locomotion of eaat1hypo mutants and eaat1hypo mutants who express fosDN in motor neurons (n ≥ 20 animals for each genotype). P values: ns, not significant; *, p<0.05; **, p<0.01; ***, p<0.001; ****, p<0.0001. n: replicate number. Error bars indicate SEM. Statistics: Student's t-test or one-way ANOVA with Tukey’s post hoc test.
-
Figure 7—source data 1
Source data for Figure 7.
- https://doi.org/10.7554/eLife.47372.031
Figure 8

A schematic model of a circuit-dependent ROS feedback loop under glutamate excitotoxicity induced by loss of eaat1.
The details are presented in the discussion section.
Additional files
-
Transparent reporting form
- https://doi.org/10.7554/eLife.47372.033
Download links
A two-part list of links to download the article, or parts of the article, in various formats.
Downloads (link to download the article as PDF)
Open citations (links to open the citations from this article in various online reference manager services)
Cite this article (links to download the citations from this article in formats compatible with various reference manager tools)
A circuit-dependent ROS feedback loop mediates glutamate excitotoxicity to sculpt the Drosophila motor system
eLife 8:e47372.
https://doi.org/10.7554/eLife.47372


