Ctf4 organizes sister replisomes and Pol α into a replication factory
- Van Andel Institute, United States
- Howard Hughes Medical Institute, United States
- The Rockefeller University, United States
Figures
Figure 1
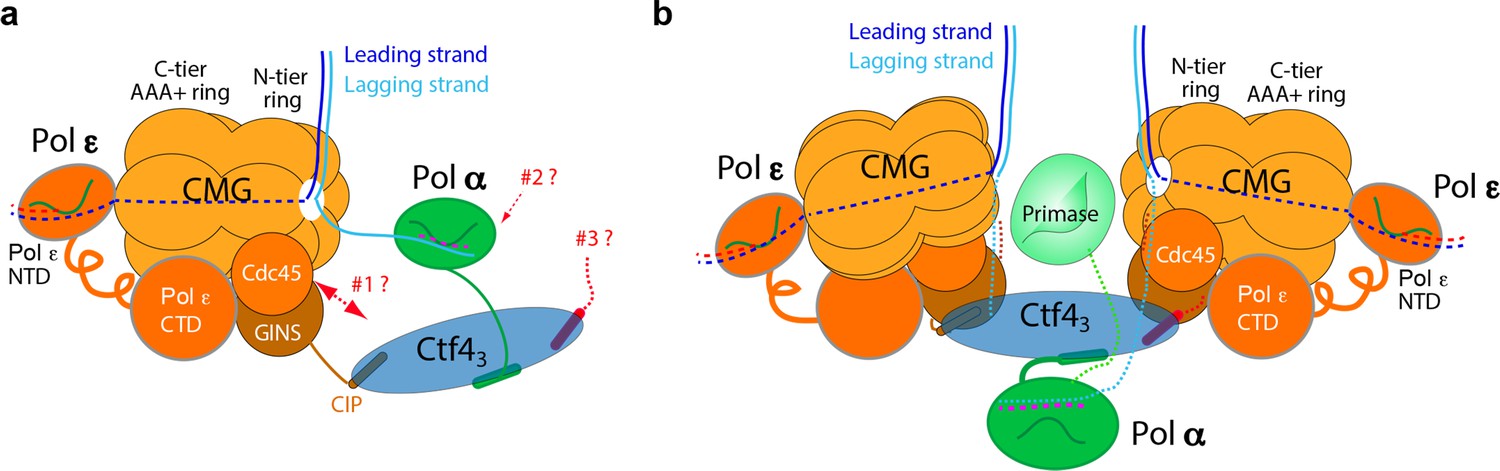
Comparison of individual replisomes and the coupled sister replisomes.
(a) Individual replisome: Ctf43 connects CMG to Pol α-primase, and Pol ε binds the C-face of CMG. Three unanswered questions are represented by the three question marks: 1. What components in CMG, in addition to the CIP peptide of Sld5, interact with Ctf43 to maintain their stable association? 2. How does Pol α-primase interact with Ctf43 – on the top N-face or the bottom C-face of the Ctf4 disk? 3. Can a second Pol α-primase also occupy the third CIP-site of Ctf43? (b). Factory core model of two replisomes inferred from cryo-EM structures of the current report. Two CMGs bind tightly to two subunits of the Ctf4 trimer by an extensive interface formed with the Psf2 and Cdc45 subunits of CMG. One Pol α-primase occupies the third Ctf4 subunit. The single Pol α-primase connects to the C-face of Ctf4 near the split points of DNA entering the N-faces of the two CMGs. The two leading Pol ε complexes bind the C-face of CMG on the outside perimeter of the factory. See text for details.
Figure 2 with 1 supplement
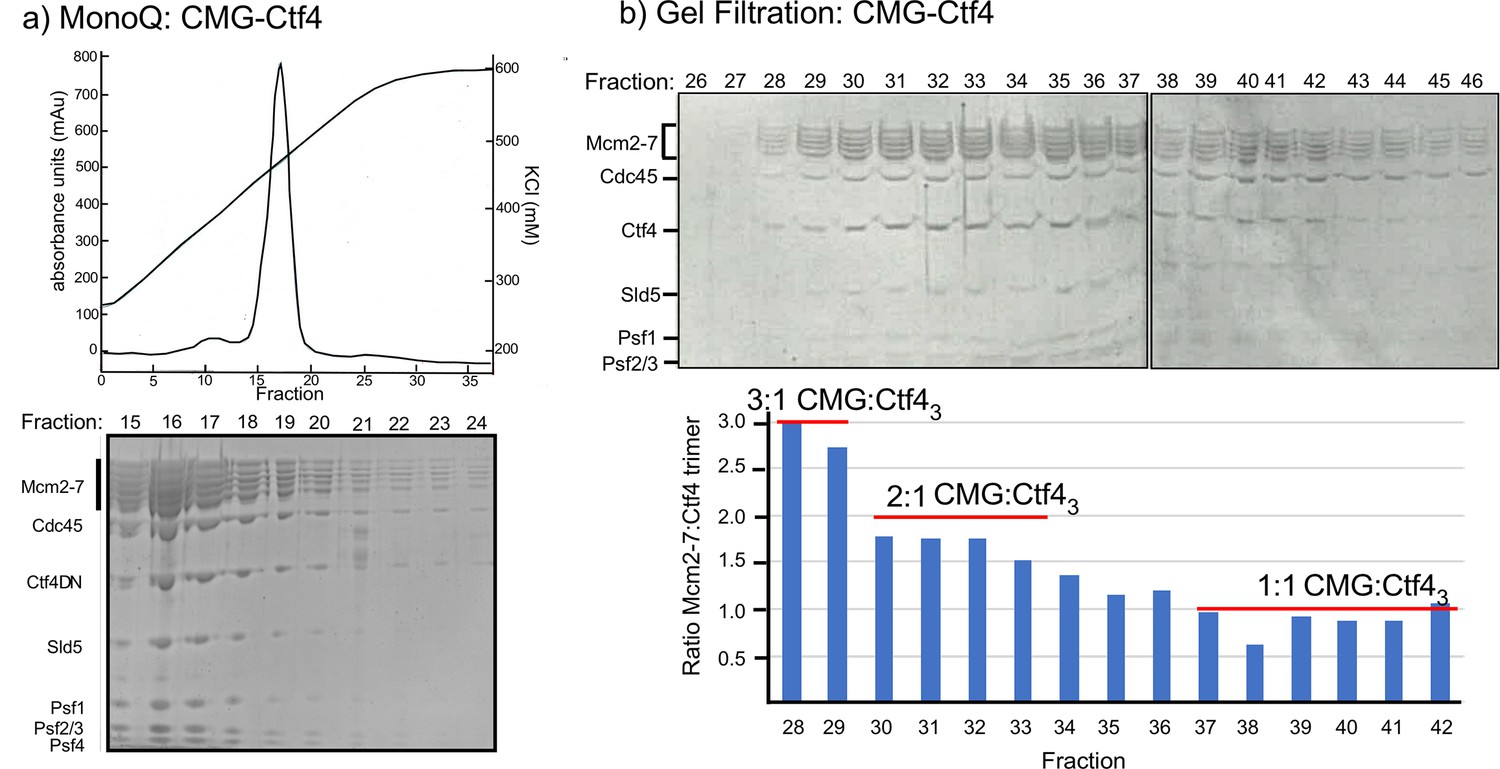
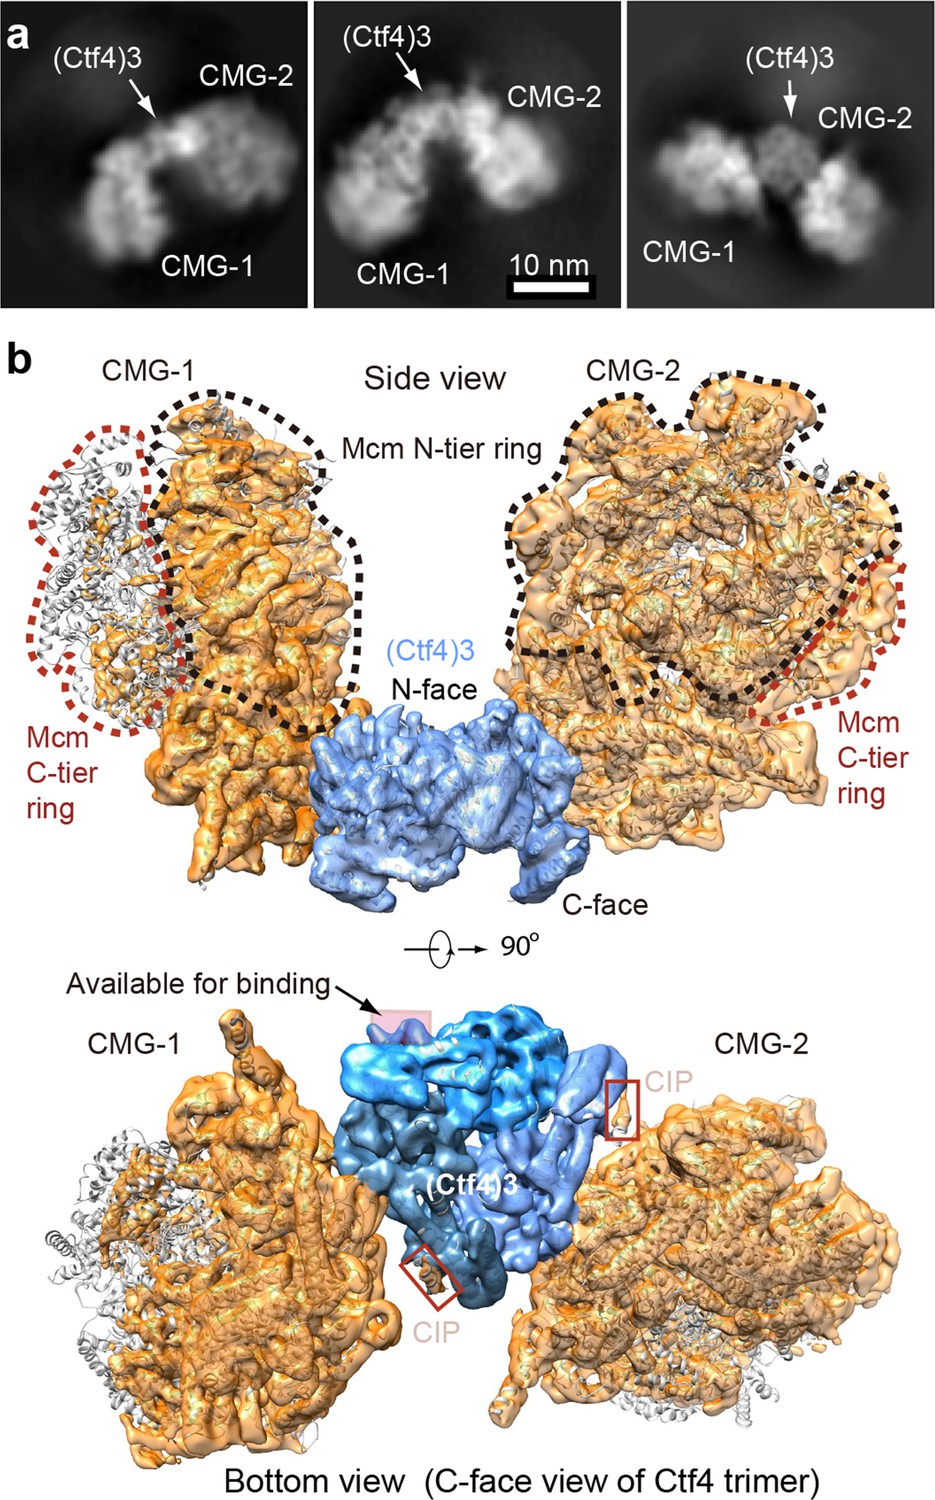
Multiple CMGs form a stable complex with the Ctf4 trimer.
(a) A mixture of CMG and Ctf43 were applied to ion-exchange chromatography on a MonoQ column. The top panel shows the elution profile of the CMG−Ctf43 complex(s) which elute at approximately 450 mM NaCl. (b) The SDS-PAGE of gel filtration fractions from the MonoQ elution shows the CMG−Ctf4 complex(s) are stable during these chromatography steps. Ratios of CMG:Ctf43 as estimated by the gel density scans are indicated in the histogram. Glycerol gradient centrifugations also reveal a complex of CMG to Ctf43, as well as other complexes (Figure 2—figure supplement 1).
Figure 2—figure supplement 1
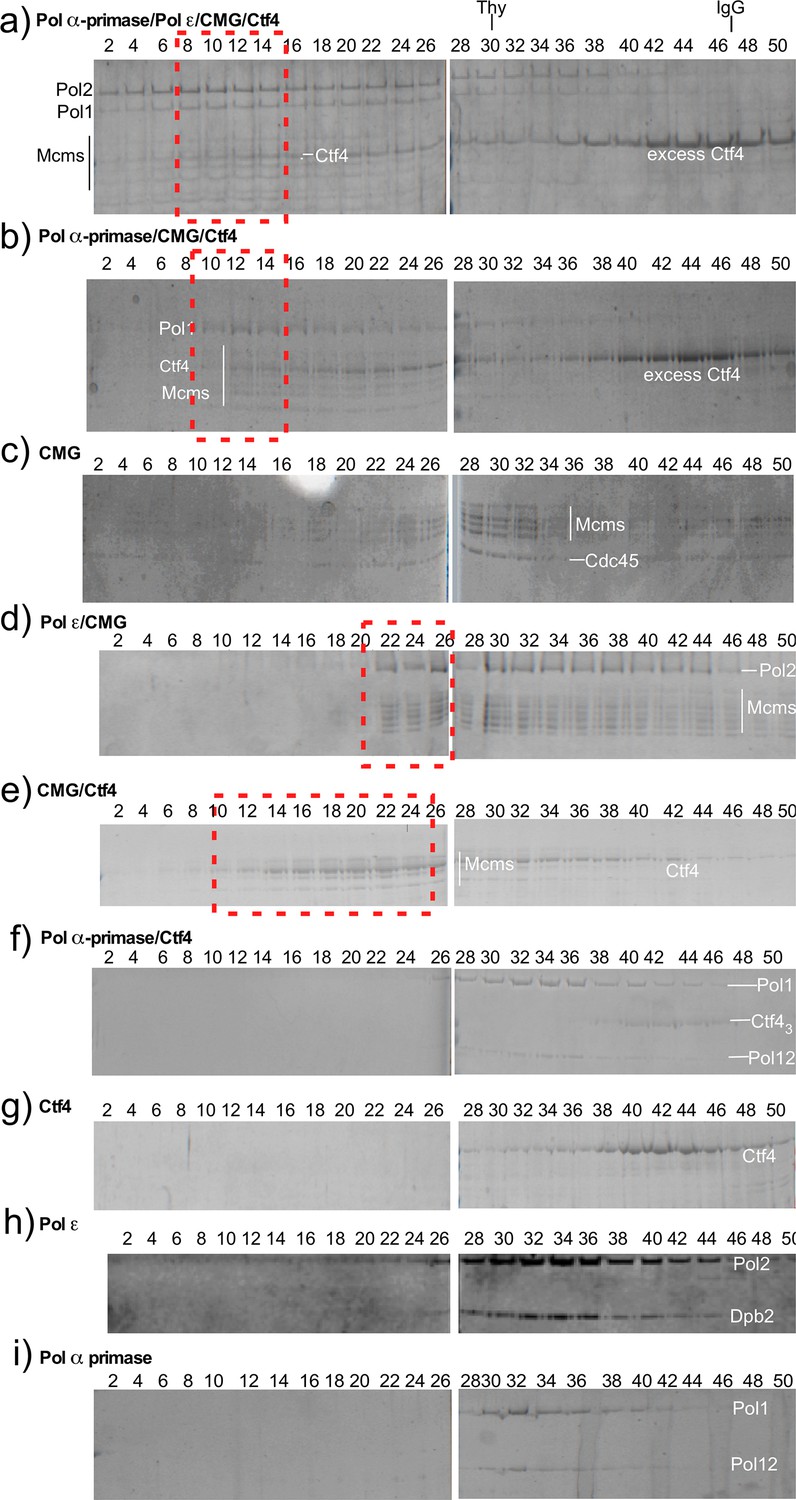
Reconstitution of replisome complexes.
Glycerol gradient sedimentation of different protein mixtures. Panels a and b (red boxes), compared to panels c-i, indicate that Ctf4 promotes large super-complexes containing CMG and DNA polymerases. Pol ε binds CMG in the absence of Ctf43 (red box, panel d), and Ctf43 binds CMG (red box, panel e) as noted by the significant shift to a higher mw complex. Migration of protein standards, Thyroglobulin (Thy) and IgG, are shown at the top.
Figure 3 with 2 supplements
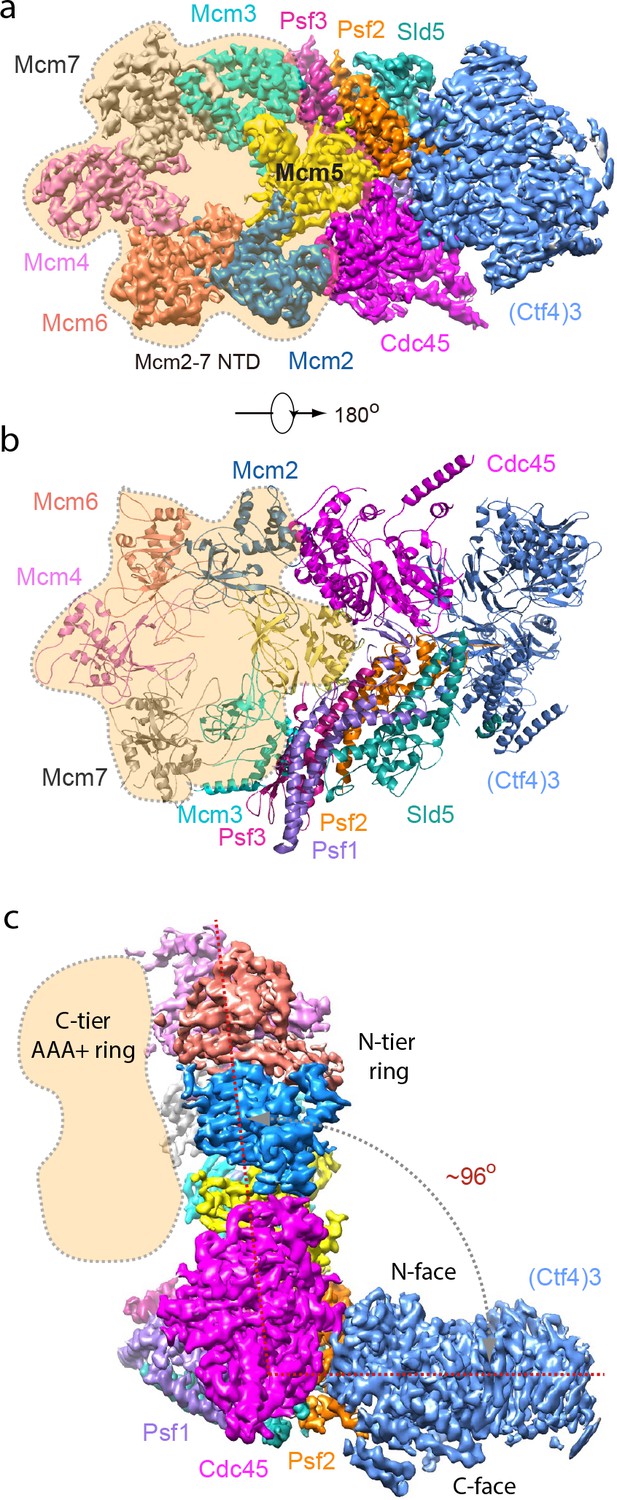
Cryo-EM structure of 1CMG–Ctf43.
Cryo-EM density map of the 1CMG−Ctf43 complex in: (a) top view looking down the N-tier view of Mcm2-7. (b) Cartoon representation of the atomic model of 1CMG−Ctf43 in the C-tier AAA+ ring view. (c) Side view. Each subunit is colored differently. The Mcm2-7 AAA+ motor ring is flexible, and thus removed for higher resolution, but its position is shaded in beige. The resolution of this complex was facilitated by focused 3D refinement omitting the AAA+ C-tier of the Mcms in CMG (Figure 3—figure supplements 1 and 2).
Figure 3—figure supplement 1
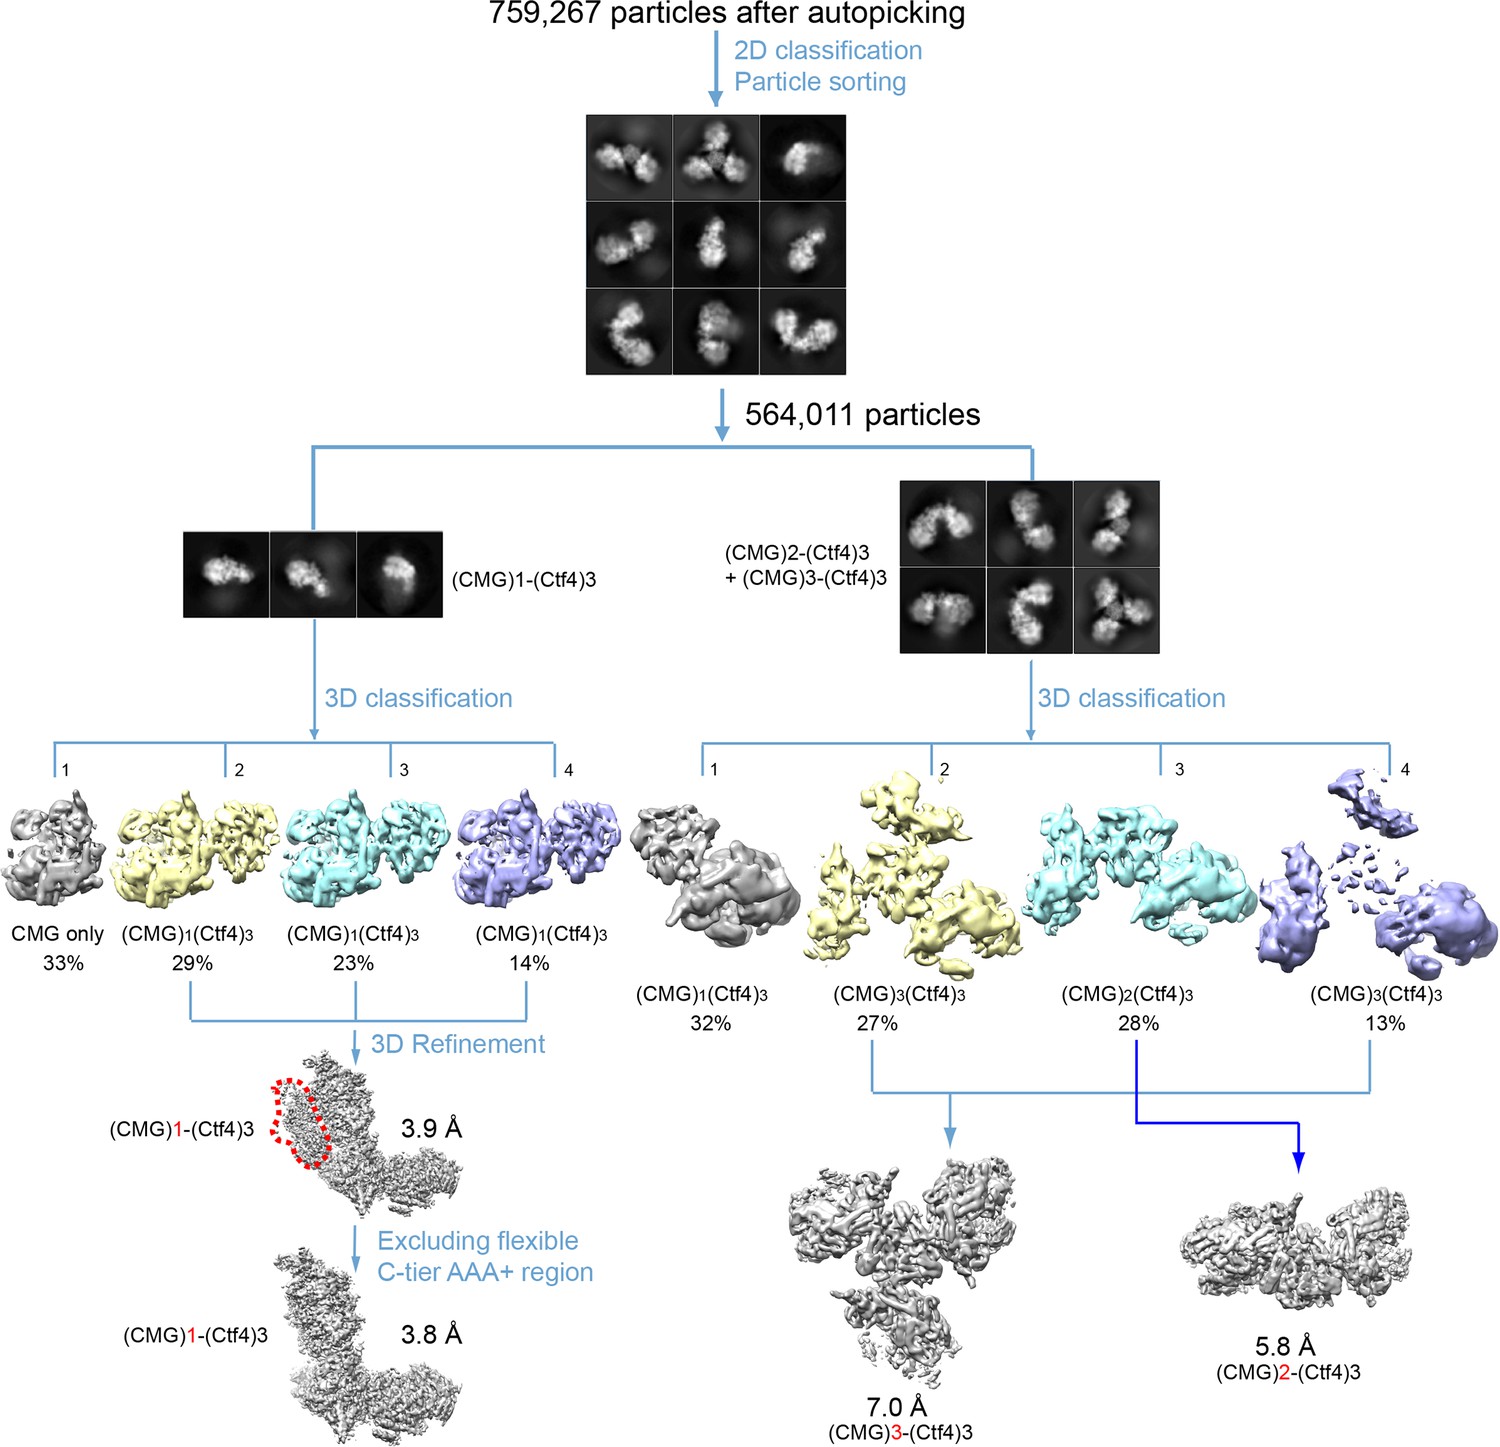
Image processing and 3D reconstruction scheme.
Extensive 2D and 3D classifications led to reconstruction of 3D maps of the 1CMG–Ctf43 complex1 at 3.8 Å resolution, the 2CMG−Ctf43 complex at 5.8 Å resolution, and the3CMG–Ctf43 complex at 7.0 Å resolution.
Figure 3—figure supplement 2

Image processing and resolution estimation of the 3D map of the 1CMG–Ctf43 complex.
(a) A typical raw micrograph. (b) 2D classification reveals the presence of 1, 2 or 3 copies of CMG helicase in complex with Ctf43. (c) Color-coded surface rendering of the 3D map (left panel) and the gold-standard Fourier shell correlation curve (right panel) of the 1CMG–Ctf43 complex masking out the flexible C-tier motor ring of the Mcm2-7. (d) Gold-standard Fourier shell correlation of the atomic model versus the 3d map. (e) Euler angle distribution of the raw particles used in 3D reconstruction.
Figure 4 with 3 supplements
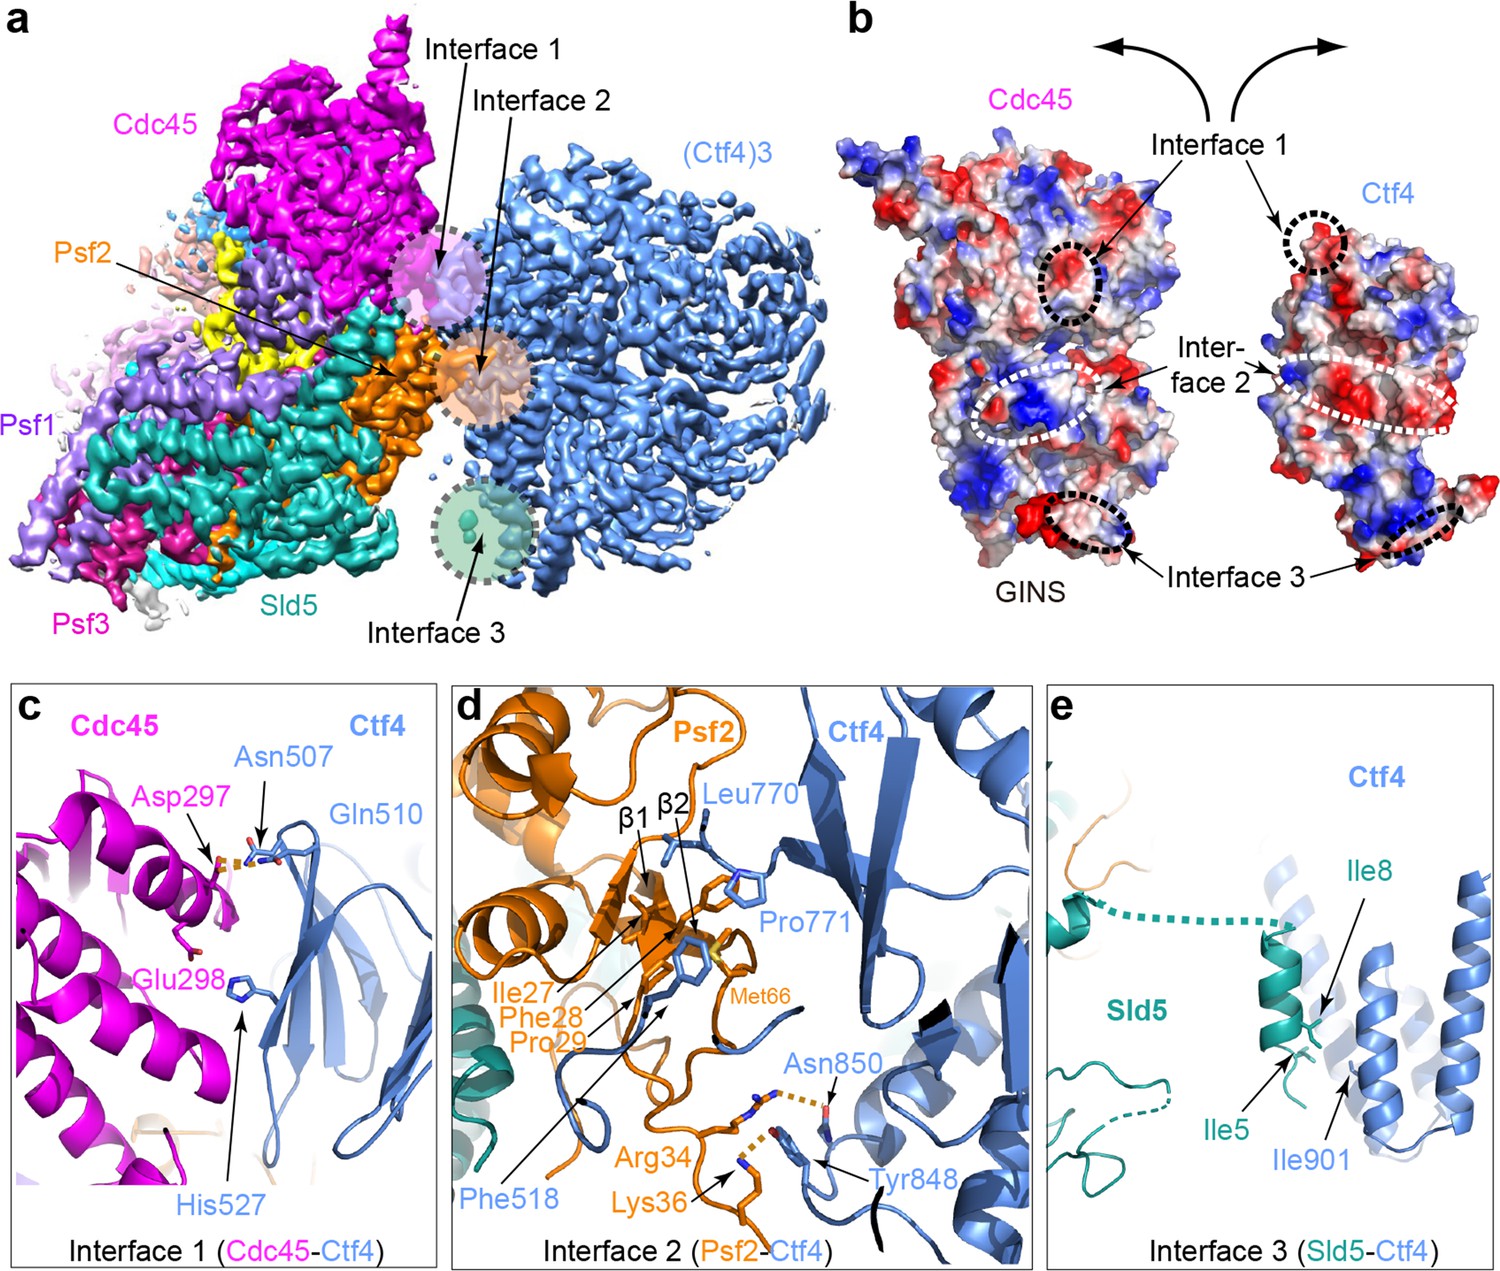
Molecular interface between Ctf43 and CMG.
(a) 3D map showing the interacting Cdc45–GINS and Ctf43. Different subunits are in different colors as labeled, and the three interacting regions are labeled Interfaces 1 through 3. (b) An open-book view of the interface between Cdc45–GINS and Ctf43, shown in the electrostatic surface view. The three contacting regions between Cdc45−GINS and Ctf4 are marked by three pairs of dashed ellipses. (c–e) Interface one between Cdc45 and Ctf4 (c), interface two between Psf2 and Ctf4 (d), and interface three between Sld5 and Ctf4 (e), shown in cartoon view with several interacting residues shown in sticks. A close-up view of the interfaces is shown in Figure 4—figure supplements 1 and 2. Conservation in the interface region is shown in Figure 4—figure supplement 3.
Figure 4—figure supplement 1
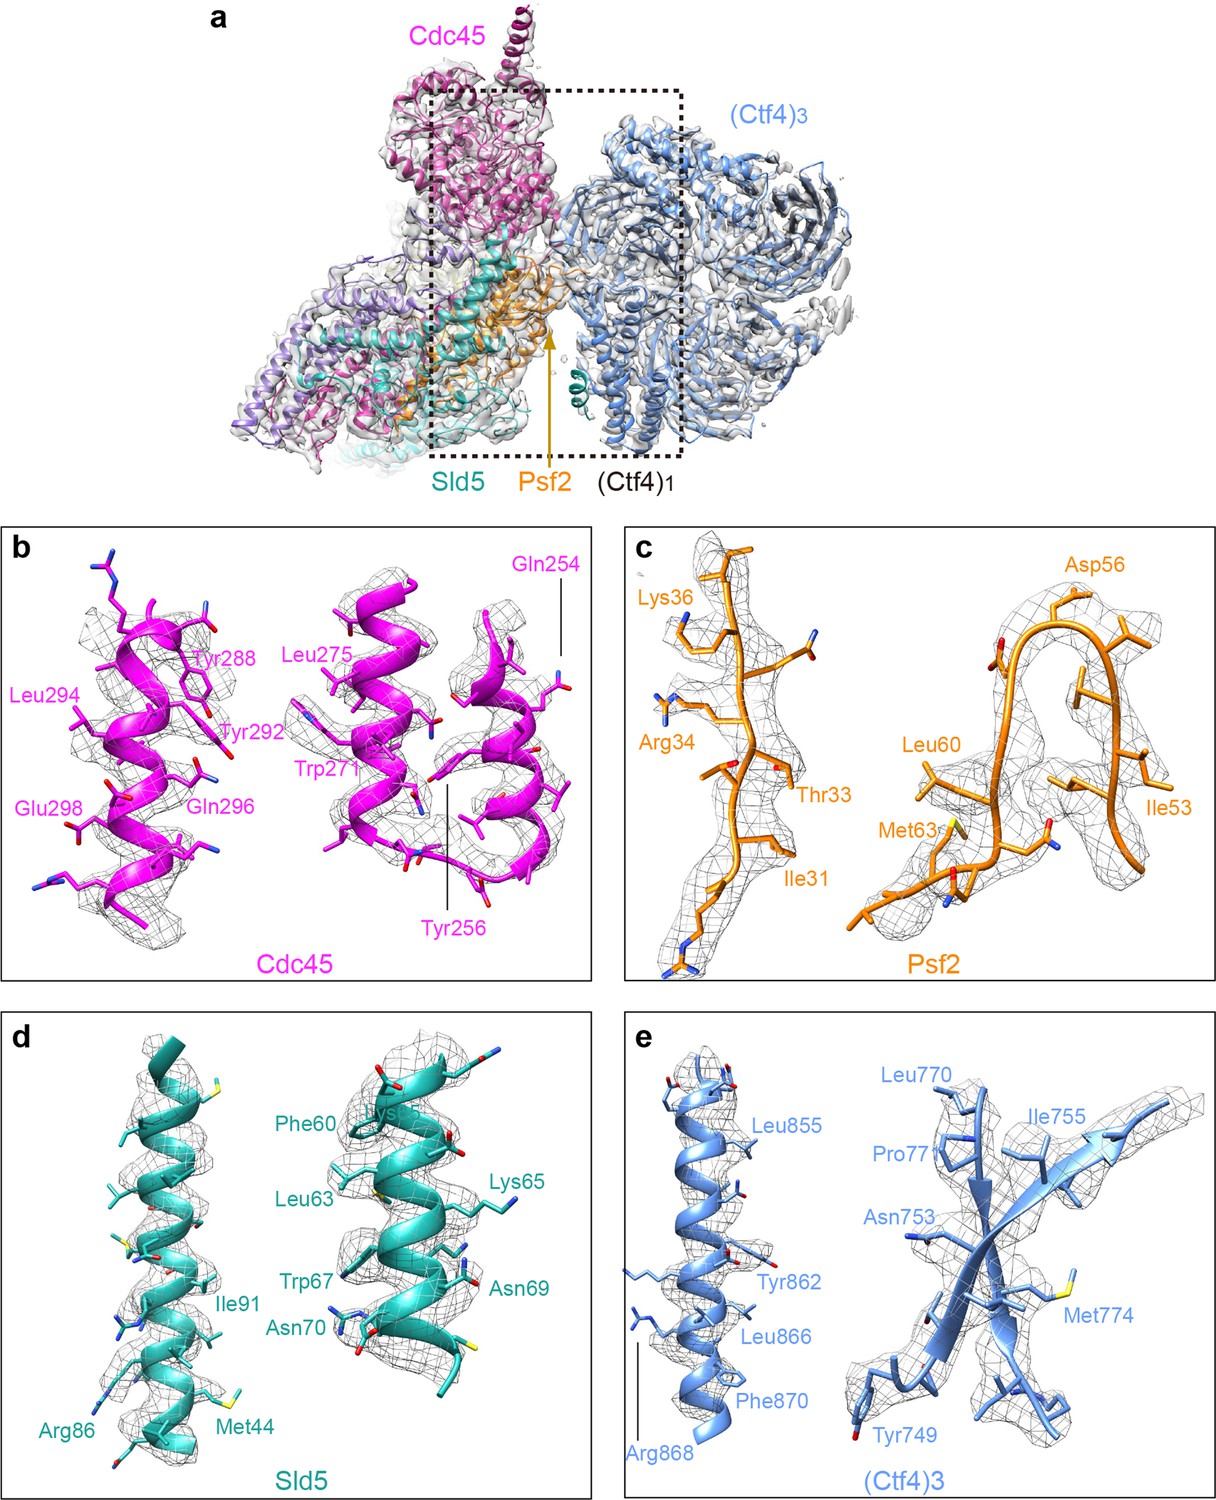
Detailed densities at selected regions in the 3D map of Ctf43−CMG1 complex.
(a) 3D density showing the Ctf43−−Cdc45−GINS, by omitting the Mcm2-7 density in the 3d map, superimposed with the atomic model. Each subunit is colored differently and as labeled. (b–e) Two example regions in Cdc45 (b), Psf2 (c), Sld5 (d), and Ctf4 (e) with several side chains shown as sticks.
Figure 4—figure supplement 2
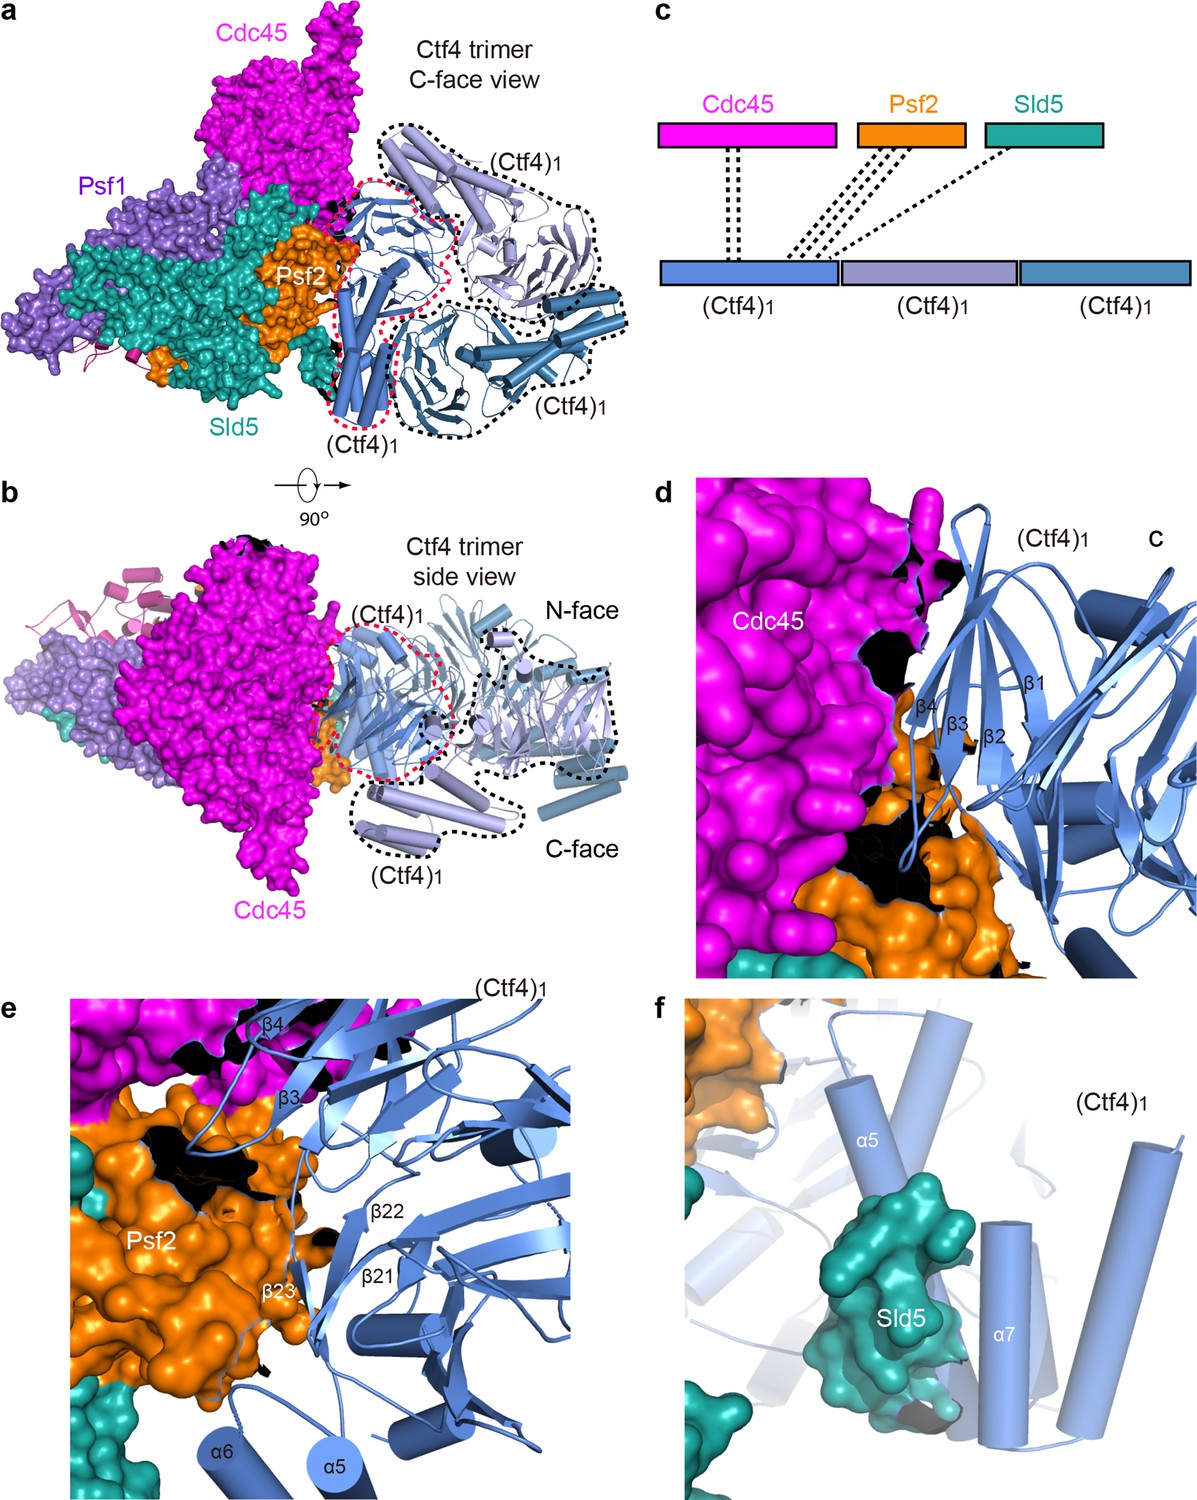
Only one Ctf4 subunit engages with Cdc45 and GINS of one CMG helicase.
The 1CMG−Ctf43 structure viewed from the C-face (a) and side (b) of the Ctf43 disk. Cdc45 and GINS are shown in surface and the Ctf43 in cartoon. The interacting Ctf4 monomer is demarcated by a dashed red curve, and the remaining two non-interacting monomers by dashed black curves. (c) A sketch showing Cdc45 and GINS interact with only one Ctf4 monomer. (d–f) Interfaces between the interacting Ctf4 monomer and Cdc45 (d), Psf2 (e), and Sld5 (f).
Figure 4—figure supplement 3
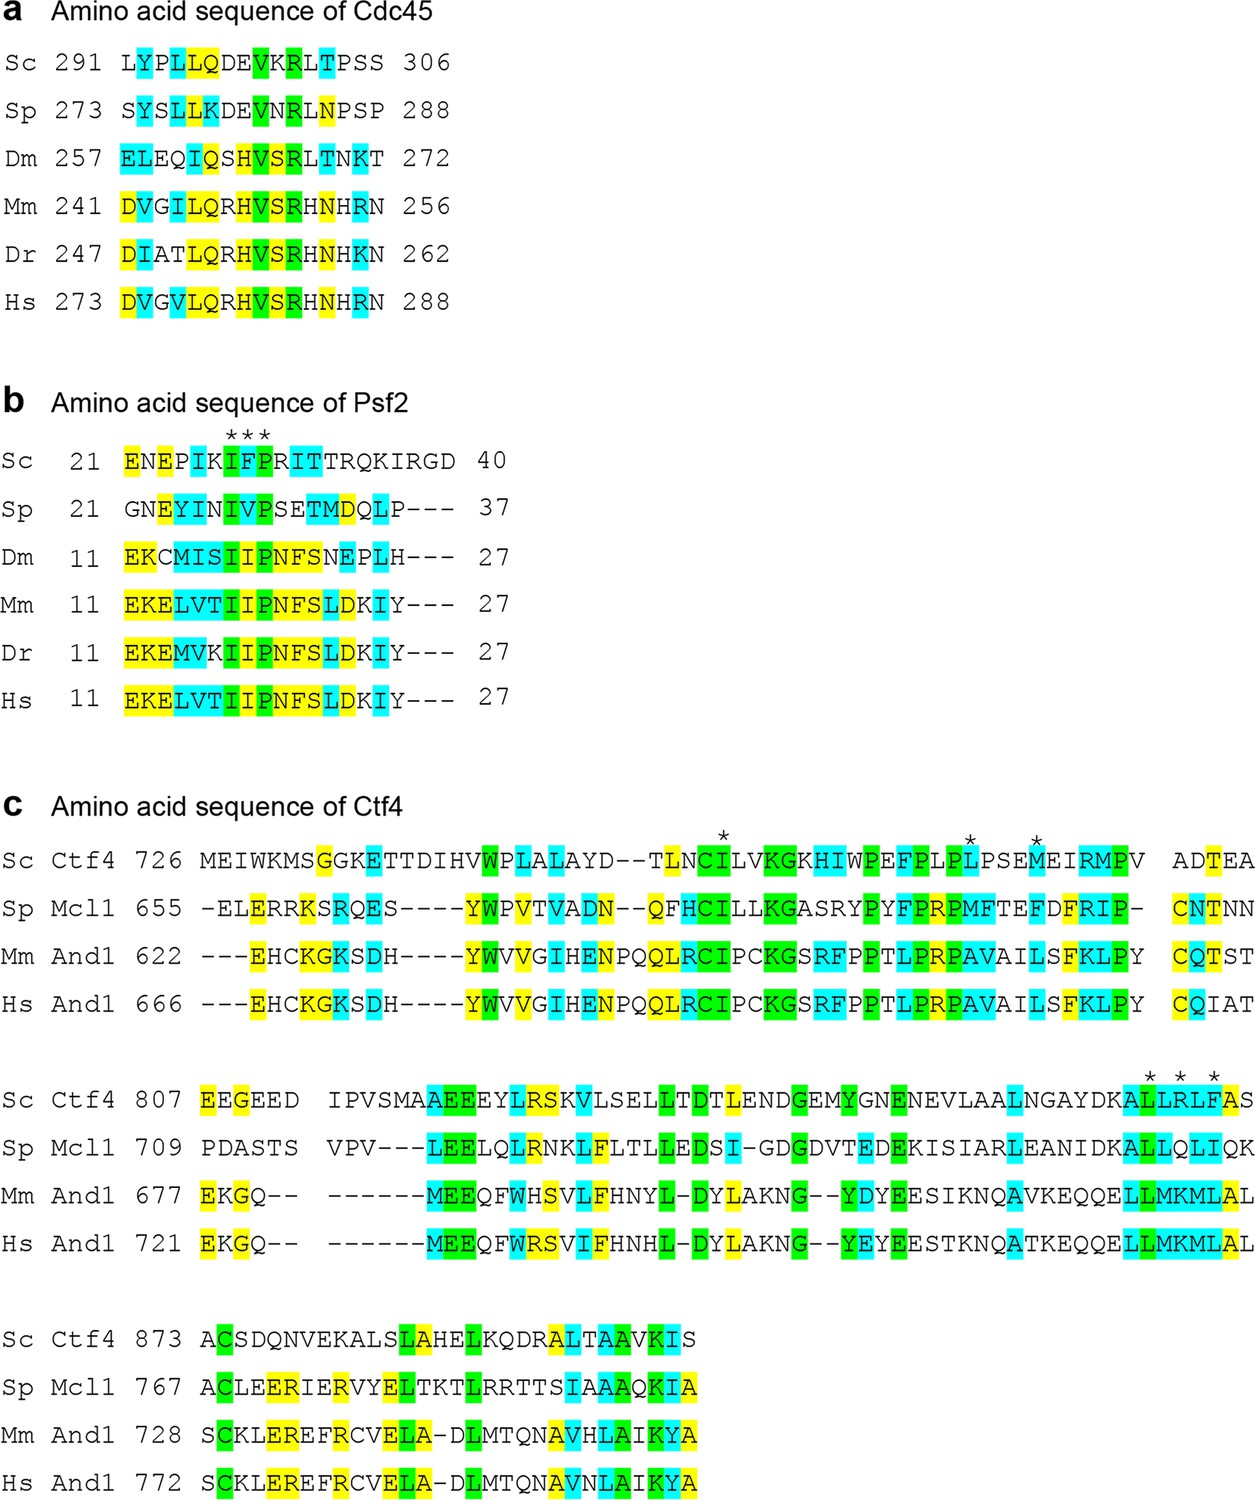
Sequence alignment of the Ctf4-contacting regions in CMG, Psf2 and Cdc45.
(a) Conserved sequences in Cdc45 that contact Ctf4. (b) Conserved sequences in Psf2 that contact Ctf4. (c) Conserved sequences in Cdc45 that contact Psf2 and Cdc45. The asterisks mark the conserved hydrophobic residue at the interface between Psf2 and Ctf4. Sc: Saccharomyces cerevisiae; Sp: Saccharomyces pombe; Dm: Drosophila melanogaster; Mm: Mus musculus; Dr: Danio rerio, Hs: Homo sapiens. Invariant residues are highlighted in green, identical residues in Yellow, and similar residues in cyan.
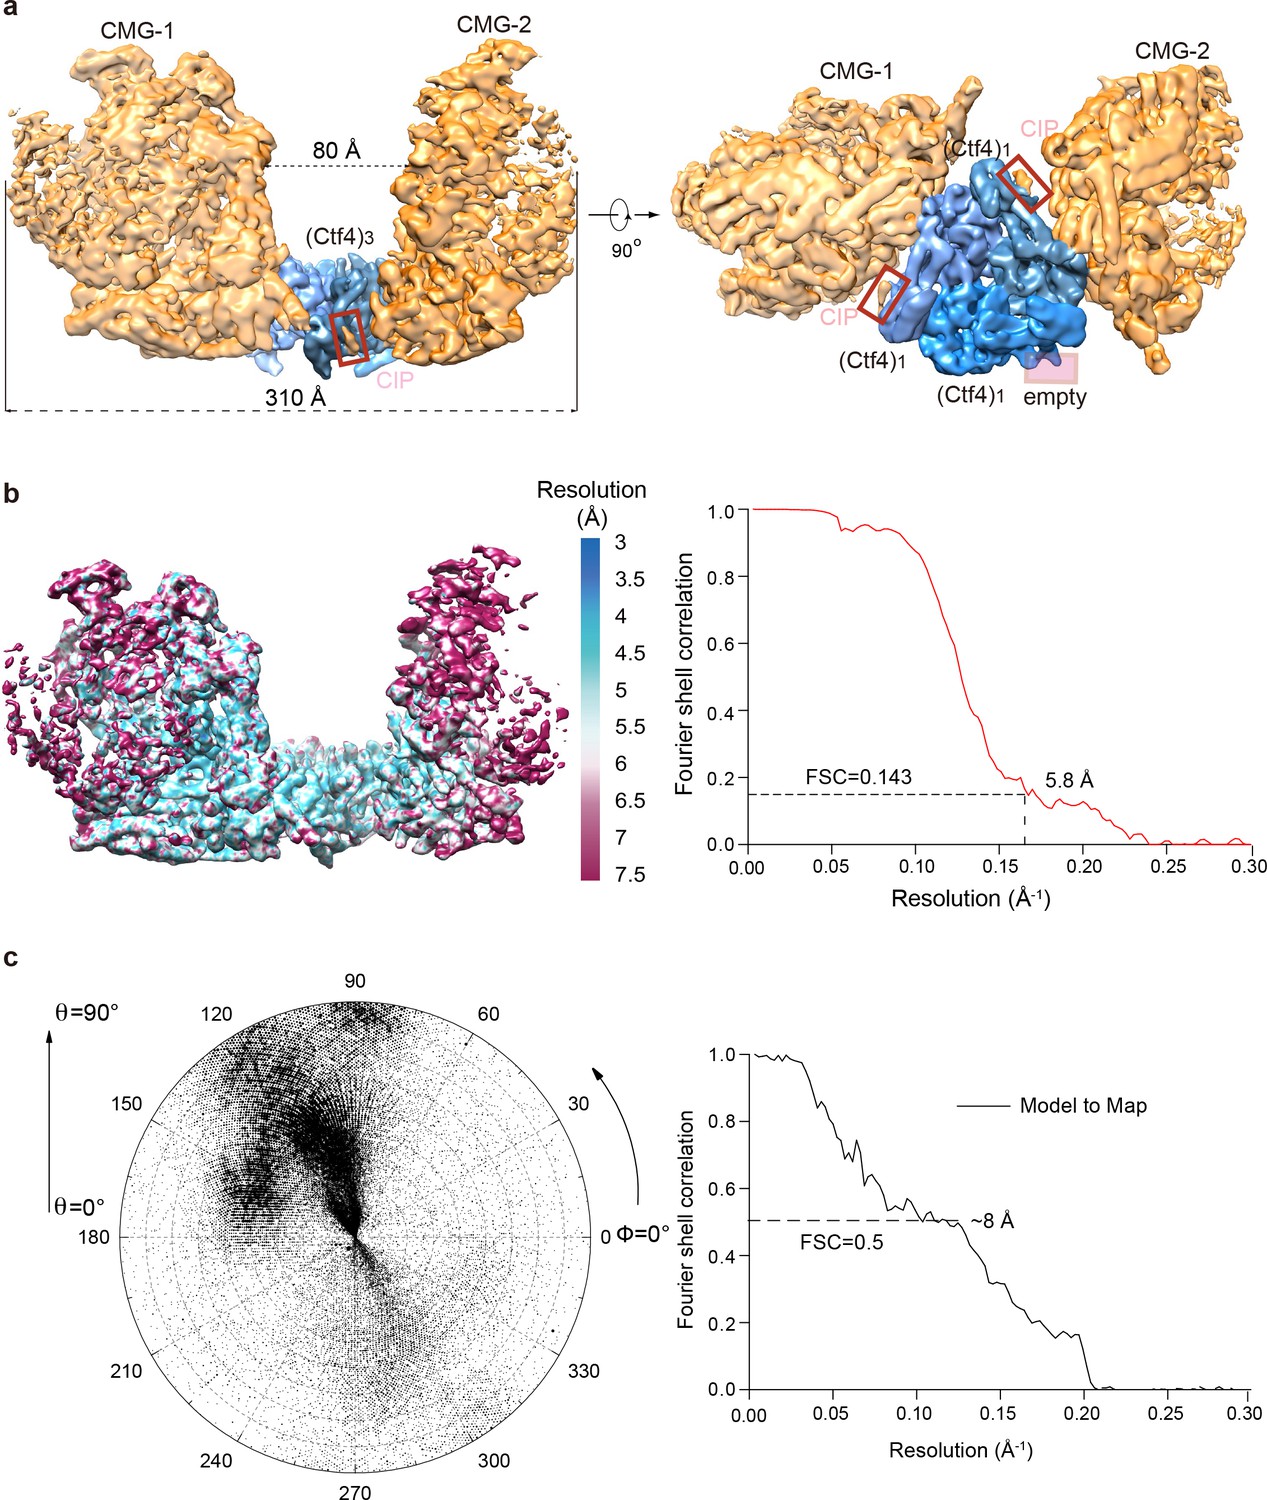
Figure 5 with 2 supplements
Cryo-EM structure of 2CMG–Ctf43.
(a) Selected 2D class averages of cryo-EM images of 2CMG−Ctf43. (b) A side and a bottom view of the 3D map with docked atomic models of Ctf43 and CMG shown in cartoon view. The C-tier AAA+ ring of Mcm2-7 is partially flexible and the density is invisible at the surface rendering threshold used. See also Figure 5—figure supplements 1 and 2 and Video 2.
Figure 5—figure supplement 1
3D map and resolution estimation of Ctf43 in complex with two CMG.
(a) Surface-rendered 3D map of 2CMG–Ctf43 in side view (left) and bottom view from the C-face of Ctf43 (right), (b) Color-coded 3D map of 2CMG−Ctf43 according to the local resolution (left) and the gold-standard Fourier shell correlation of the two half maps. (c) Left: Euler angle distribution of raw particles used in 3D reconstruction. Right: Model to map correlation for the 2CMG−Ctf43 complex.
Figure 5—figure supplement 2
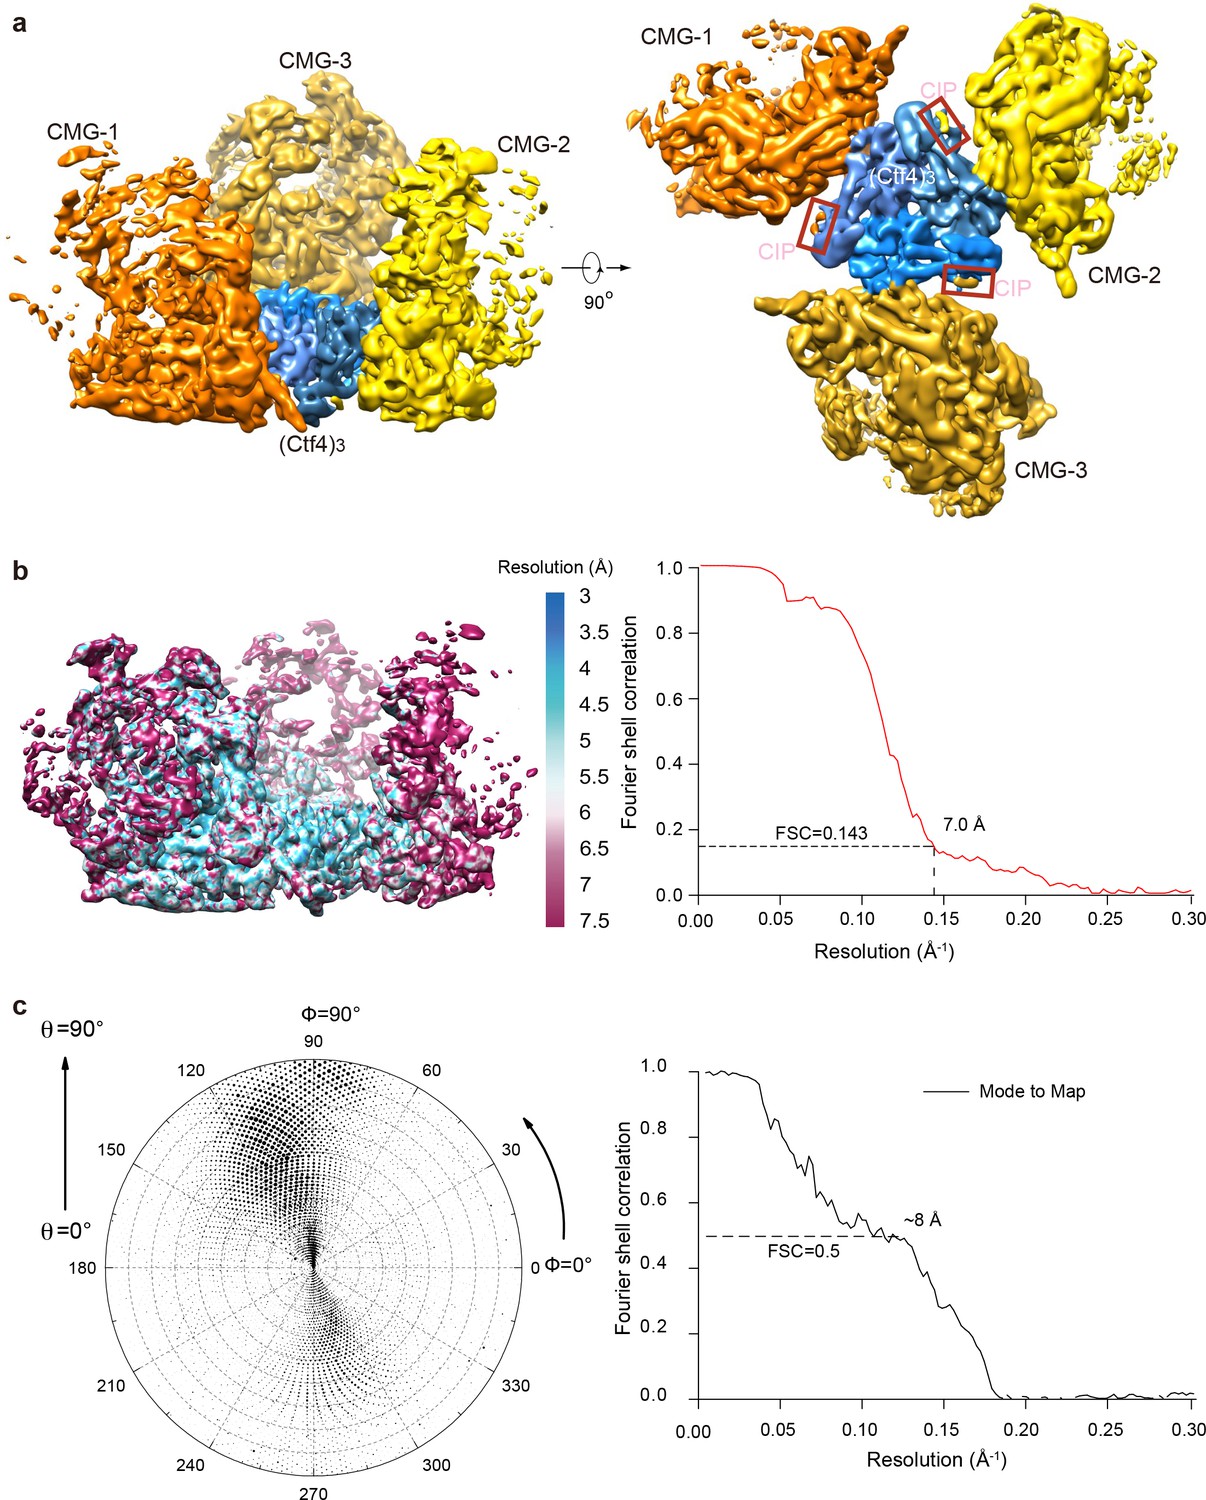
3D maps and resolution estimation of Ctf43 in complex with three CMG.
(a) Surface-rendered 3D map of 3CMG−Ctf43 in side (left) and bottom (right, C-face of Ctf43). (b) Color-coded 3D map of 3CMG−Ctf43 according to the local resolution (left) and the gold-standard Fourier shell correlation of the two half maps. (c) Left: Euler angle distribution of raw particles used in 3D reconstruction. Right: Model to map correlation for the 3CMG−Ctf43 complex.
Figure 6 with 2 supplements
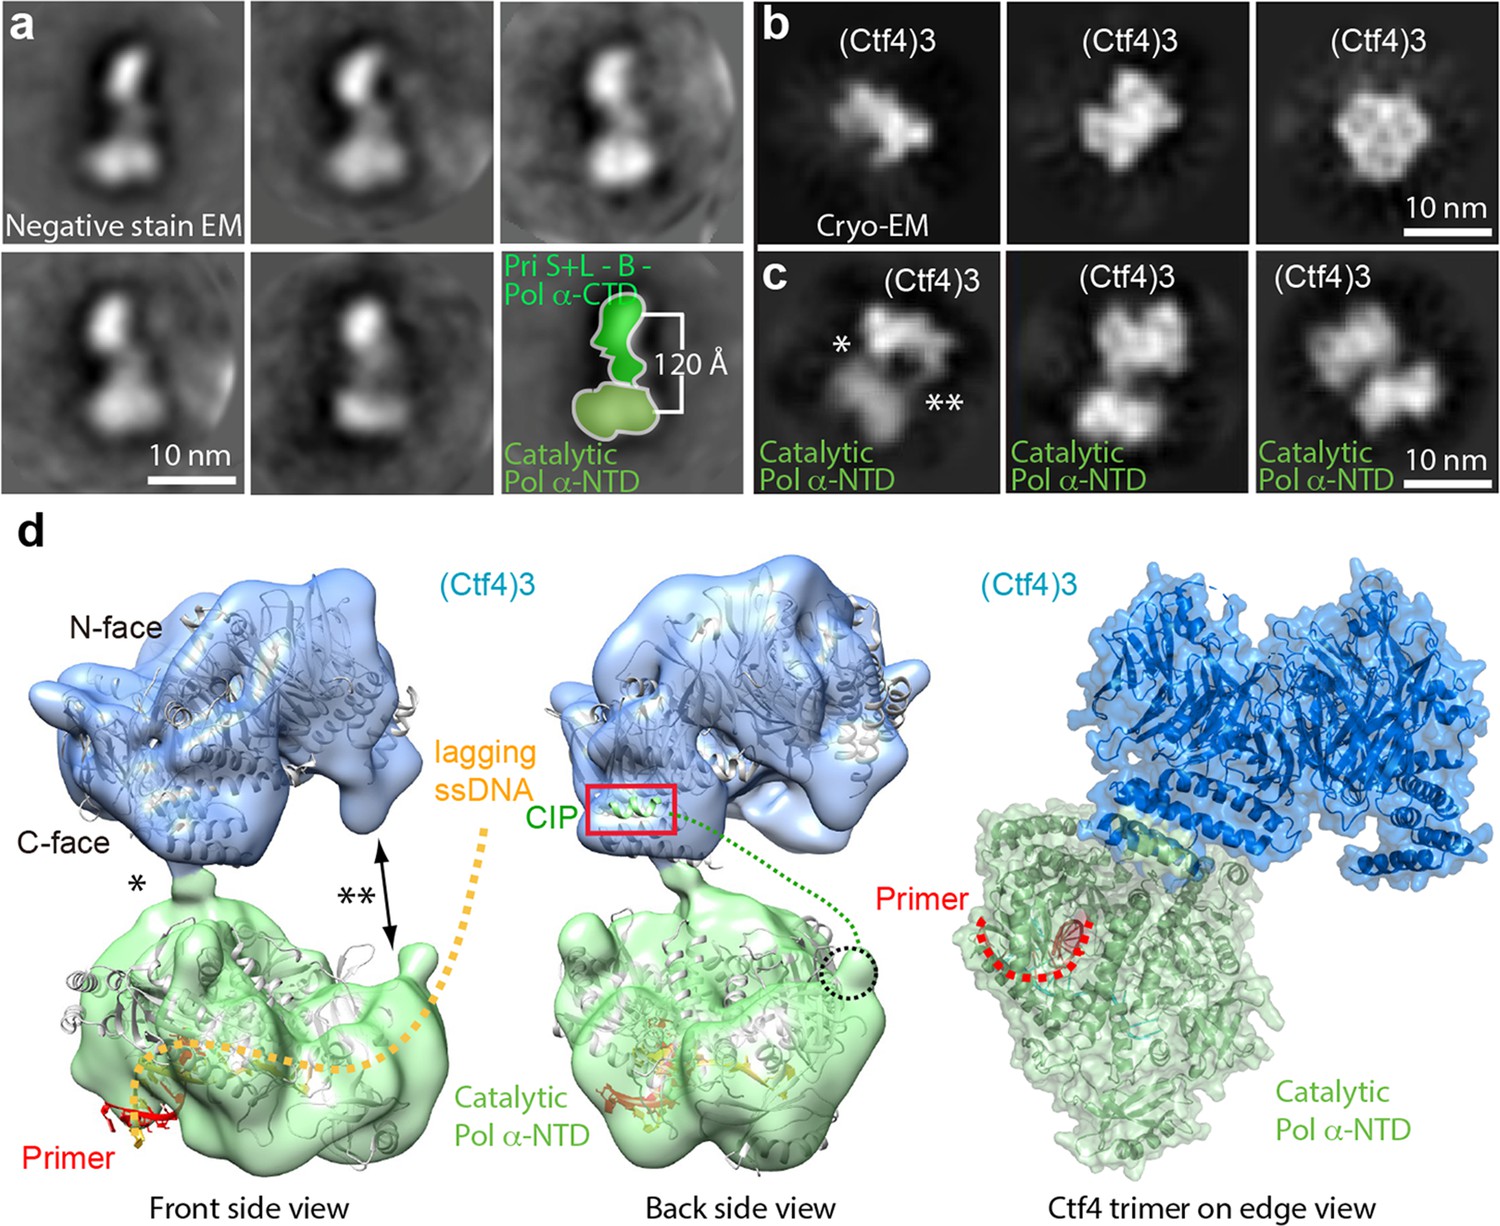
Cryo-EM map of Ctf43–Pol α-primase.
(a) Selected 2D class averages of negatively stained images of Pol α-primase showing the enzyme in a similar view with a two-lobed architecture. (b) 2D class averages of cryo-EM images of Ctf43 in three distinct views. (c) Three selected 2D class averages of cryo-EM images of Ctf43−Pol α-primase. Note the primase lobe of Ctf43−Pol α-primase is not visible. (d) Left and middle panels: front and back views of the surface-rendered cryo-EM 3D map of Ctf43−Pol α-primase docked with the crystal structure of Ctf4 in light blue and crystal structure of the catalytic Pol α-NTD in light green. Right panel: atomic model viewed when the Ctf4 trimer is orientated horizontal and on edge. Rigid body docking is further presented in Figure 6—figure supplement 1. The asterisk (*) and double asterisk (**) in (c, d) mark the left and right contacts, respectively, between Ctf43 and Pol α-NTD. The right contact is not visible in the 3D map (d). Increasing the concentration of Pol α-primase did not give additional Pol α-primase bound to Ctf4 (Figure 6—figure supplement 2).
Figure 6—figure supplement 1
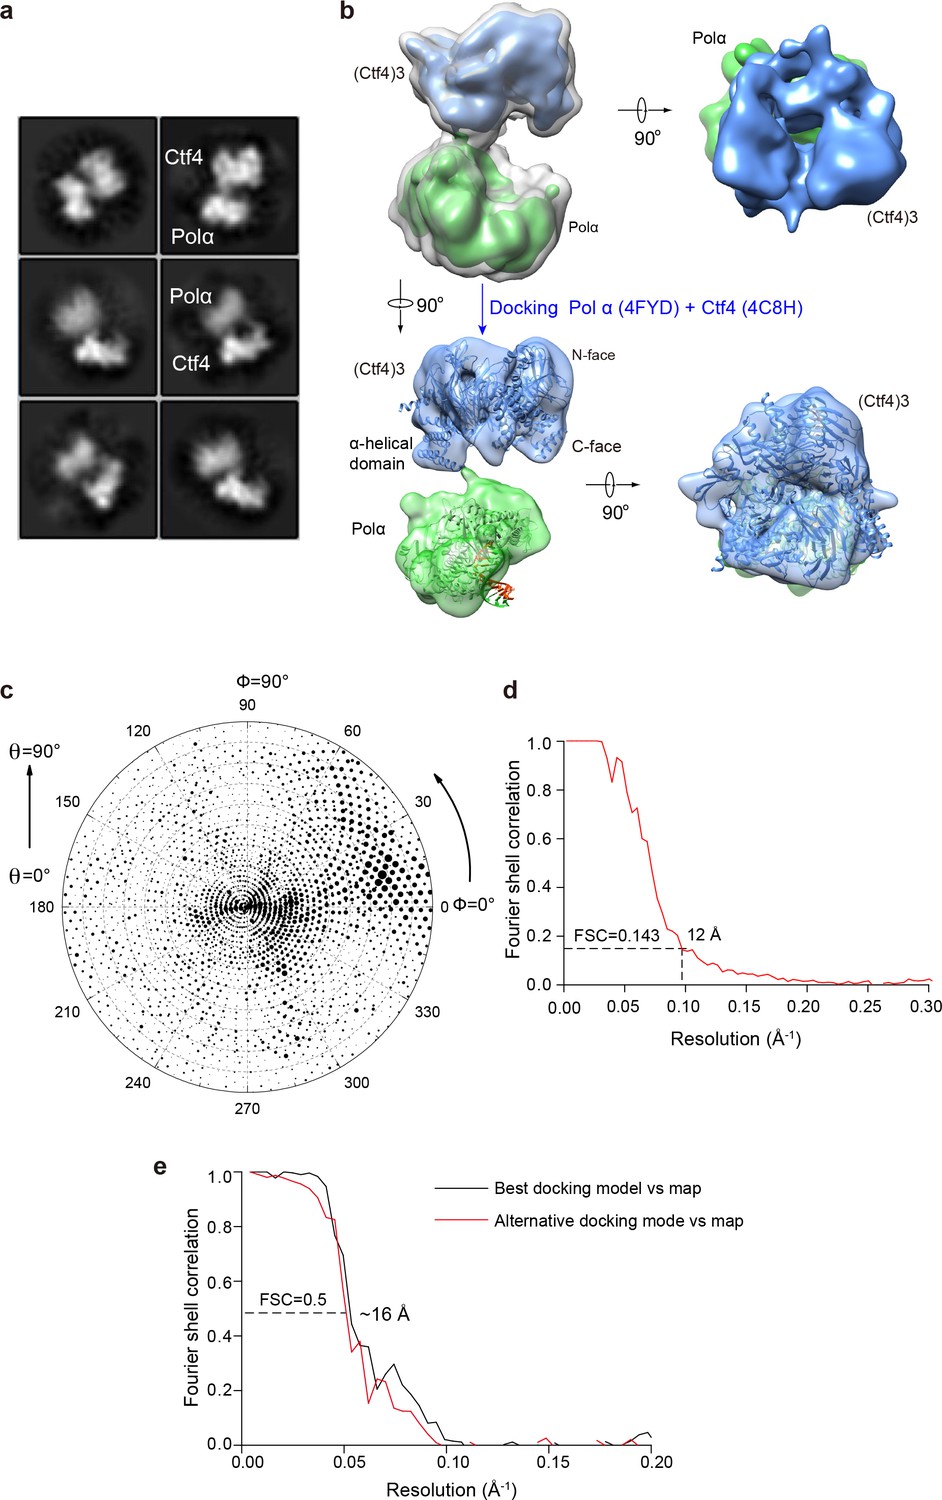
Cryo-EM of the Pol1–Ctf43 complex.
(a) 2D averages of Ctf43−Pol 1. (b) 2D classification reveals the presence of 1 Pol α bound to Ctf43. Side (left) and end-on (right) views of the 3D reconstruction of Pol1−Ctf43 complex are shown. Only the Pol1 subunit (green) of Pol α-primase is observed with Ctf43 (blue) in the Pol α-primase–Ctf43 3D reconstruction. In the end-on view, Pol1 appears to occlude the C-face of the Ctf4 trimer. The upper left structure shows both low and high thresholds, in gray and in color, respectively. The crystal structures of Pol1-DNA (4FYD) and the C-terminal half of Ctf4 (4C8H) were docked by rigid body docking of the unaltered crystal structures into semi-translucent views of the density at the bottom of panel b. (c, d) The Euler angle distribution and the FSC resolution curve are shown in panels c and d, respectively. (e) Model-to-map Fourier Shell Correlation plot comparing best and second-best docking solutions.
Figure 6—figure supplement 2
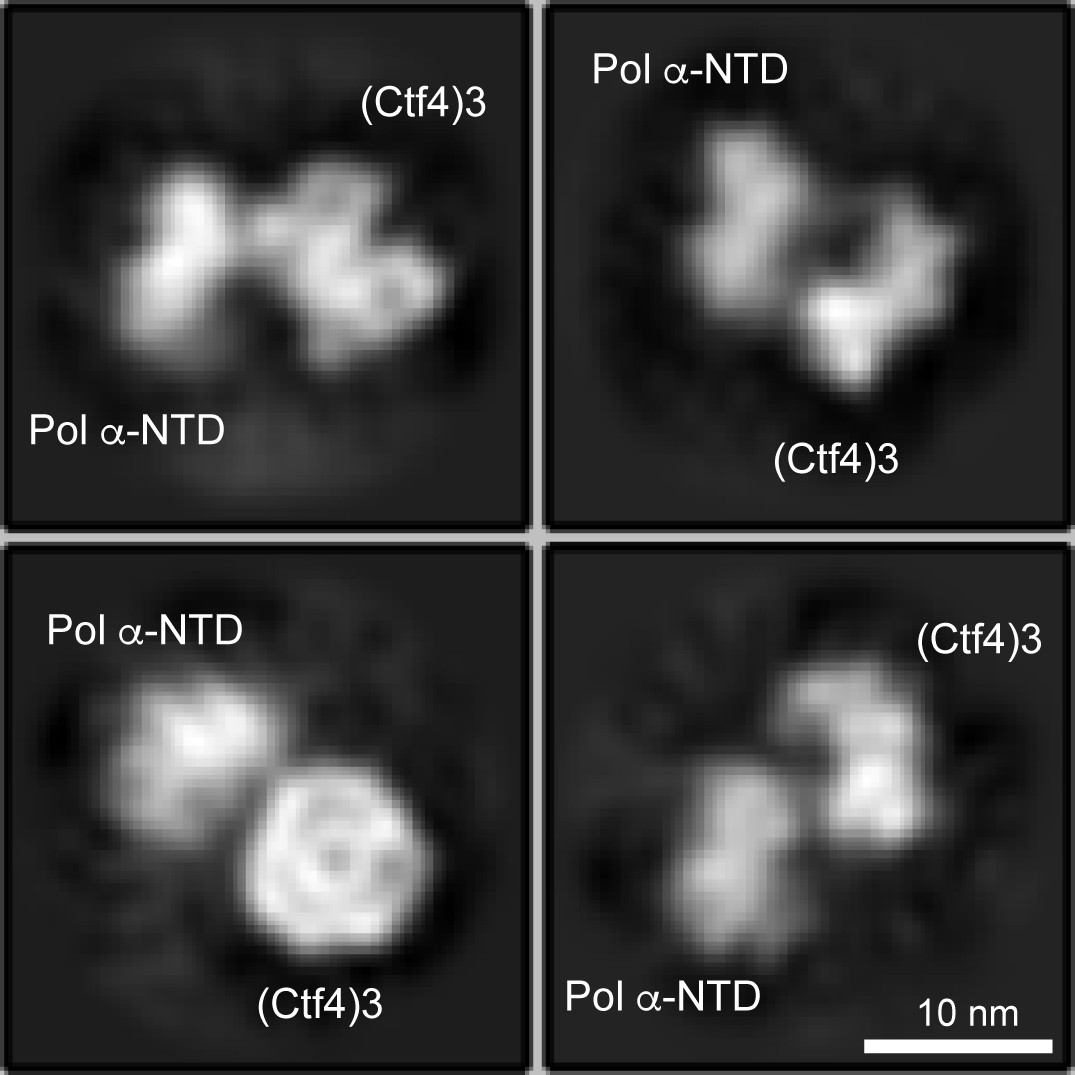
Only one Pol α-primase is observed to bind to the Ctf4 trimer using three fold excess Pol α-primase to Ctf43.
Cryo-EM 2D averages of protein mixtures containing Ctf43:Pol α-primase in a 1:3 molar ratio show no more than one Pol α-primase bound to Ctf43.
Figure 7 with 4 supplements
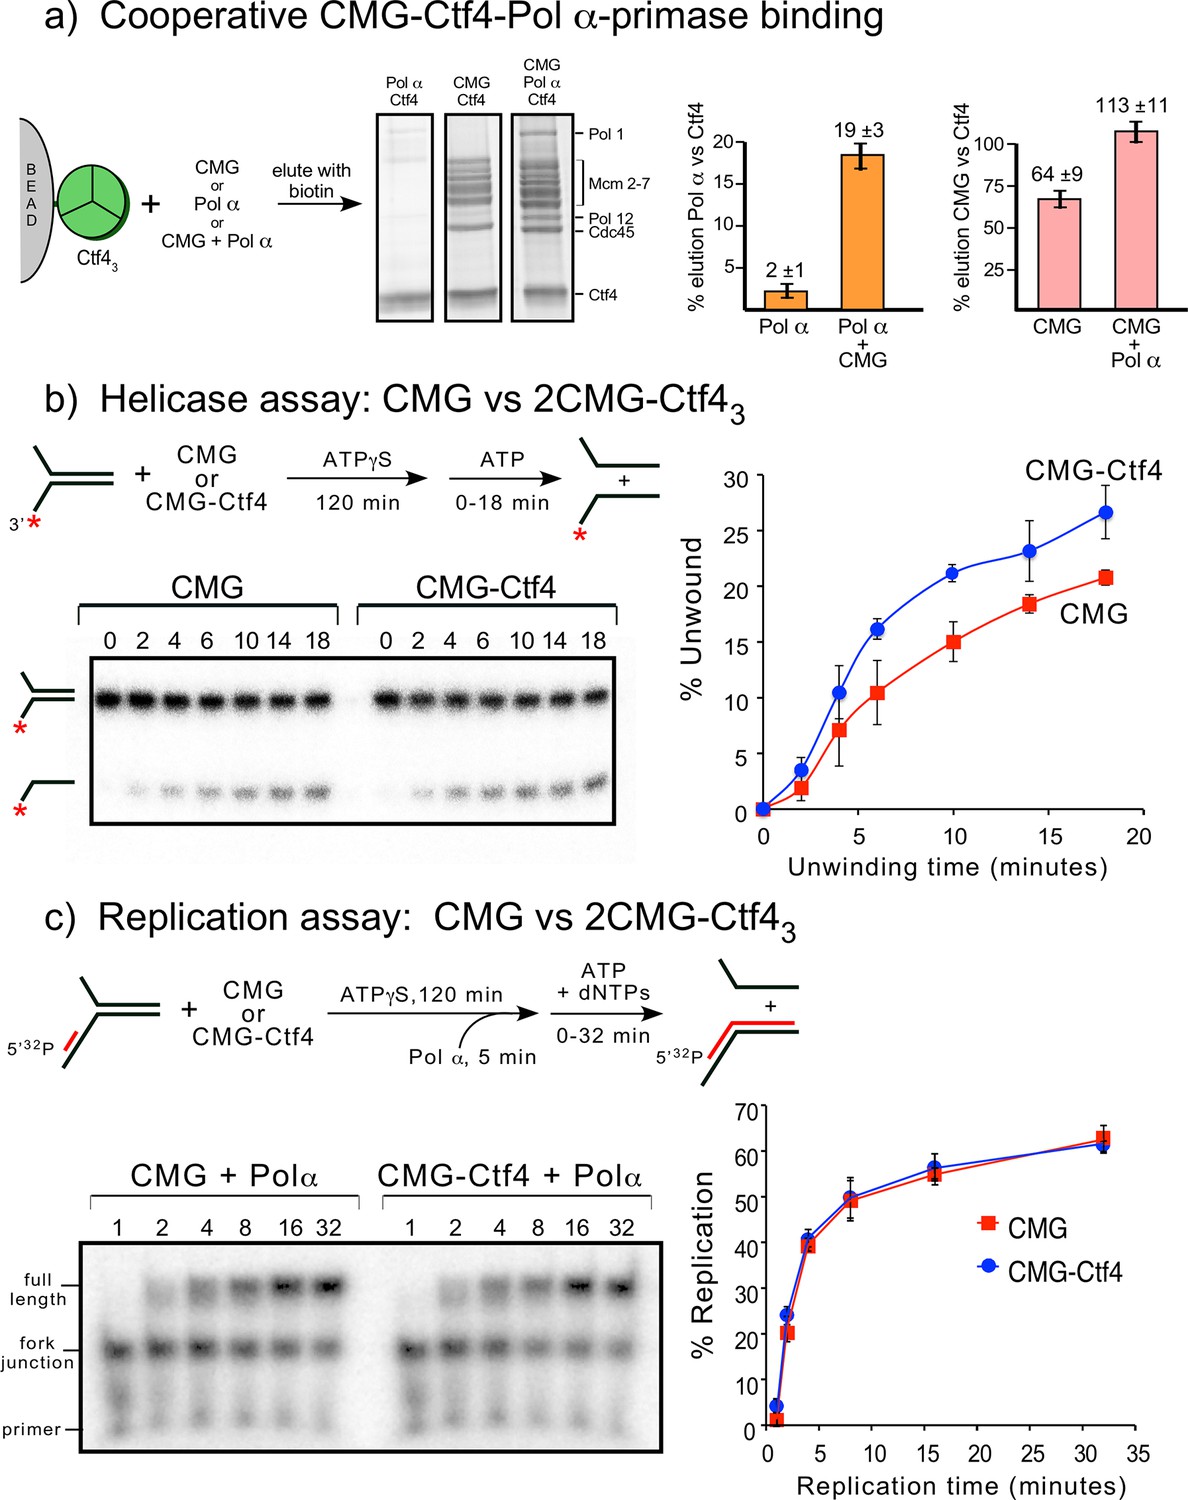
Cooperative assembly of the CMG−Ctf43−Pol α-primase complex, and the demonstration that CMGs multimerized by Ctf43 have helicase activity and support DNA replication.
(a) Streptag-Ctf4 trimer on streptactin magnetic beads was added to either Pol α, CMG or a mixture of Pol α + CMG. Proteins were eluted with biotin and analyzed by SDS-PAGE (upper right). The assay was repeated in triplicate and gel scans were quantitated (below). The error bars show the standard deviation. The cooperativity is consistent with the stoichiometric assembly of 2(CMG–Pol ε)−1Ctf43−1Pol α-primsae while excluding most of the Ctf43 in a glycerol gradient analysis (Figure 7—figure supplement 1). The results are also consistent with negative stain EM of a mixture of CMG+Ctf43+Pol α-primase, showing the presence of a 2CMG−1Ctf43−1Pol α-primase complex (Figure 7—figure supplement 2). (b, c). Both CMGs in the 2CMG−Ctf43 factory are active. (b) Controls for testing CMG−DNA binding time in 0.1 mM ATPγS are in Figure 7—figure supplement 3. Native PAGE analysis of helicase assays upon preincubation of either CMG or CMG + Ctf4 for 2 hr with 0.1 mM ATPγS and a 32P-forked DNA followed by 5 mM ATP to initiate unwinding. Timed aliquots were removed for analysis as indicated in the representative native PAGE gels. The plot represents results of triplicate assays. The mean value is indicated by the symbols and error bars show one standard deviation. (c) Preincubation experiments to determine the time for Pol α-primase to assemble onto the forked DNA are shown in Figure 7—figure supplement 4. Either CMG or CMG+Ctf43 were preincubated with 32P-primed DNA fork and 0.1 mM ATPγS for 115 min, followed by addition of Pol α-primase and a further 5 min incubation before initiating replication/unwinding with 5 mM ATP and 0.1 mM each dNTP. Timed aliquots were removed for analysis as indicated in the representative native PAGE gels. DNAs having CMG bound enable Pol α-primase to extend the DNA to full length. Pol α-primase only extends to the forked junction on DNAs that lack CMG due to inability of Pol α-primase to perform strand displacement synthesis. The plot of full-length products represents results of triplicate assays. The mean value is indicated by the symbols and error bars show one standard deviation.
Figure 7—figure supplement 1
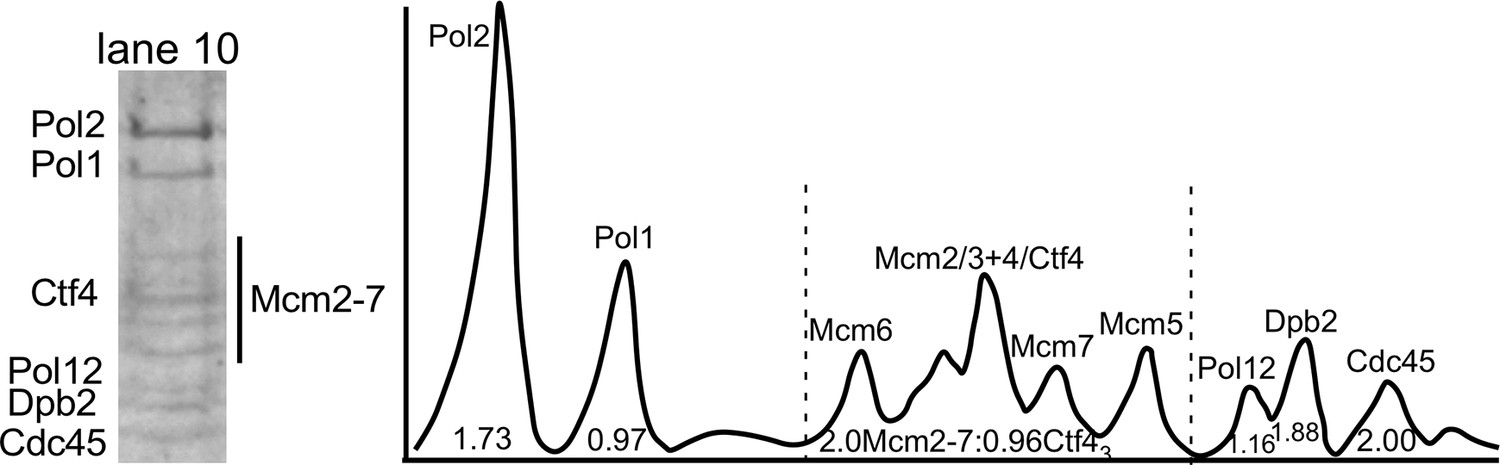
Densitometry analysis of CMGE−Ctf43−Pol α-primase.
Lane 10 of the SDS-PAGE of Figure 2—figure supplement 1 is shown to the left. The densitometry scan of the SDS gel lane 10 (right) was analyzed using ImageJ and indicates 2CMGE−1Ctf43−1Pol α-primase. The area of the Cdc45 peak was used as a proxy for CMG stoichiometry, and the area of the Cdc45 peak divided by the Cdc45 mw was assigned a value 2.0 because molar areas of Pol1, Pol12, and Ctf43 were about half the molar value of Cdc45. The amount of Ctf43, which overlaps Mcm4, was determined in two steps. First, the area of the Mcm2-7 region was divided by the molecular weight of Mcm2-7. The difference in area was deduced to belong to Ctf43, and calculated based on the molecular weight of a Ctf4 trimer. Calculated values are shown under the peaks. The stoichiometry approximates to 2 Cdc45 (and thus 2 Mcm2-7), 1 Ctf43, 1 Pol α, and 2 Pol ε.
Figure 7—figure supplement 2
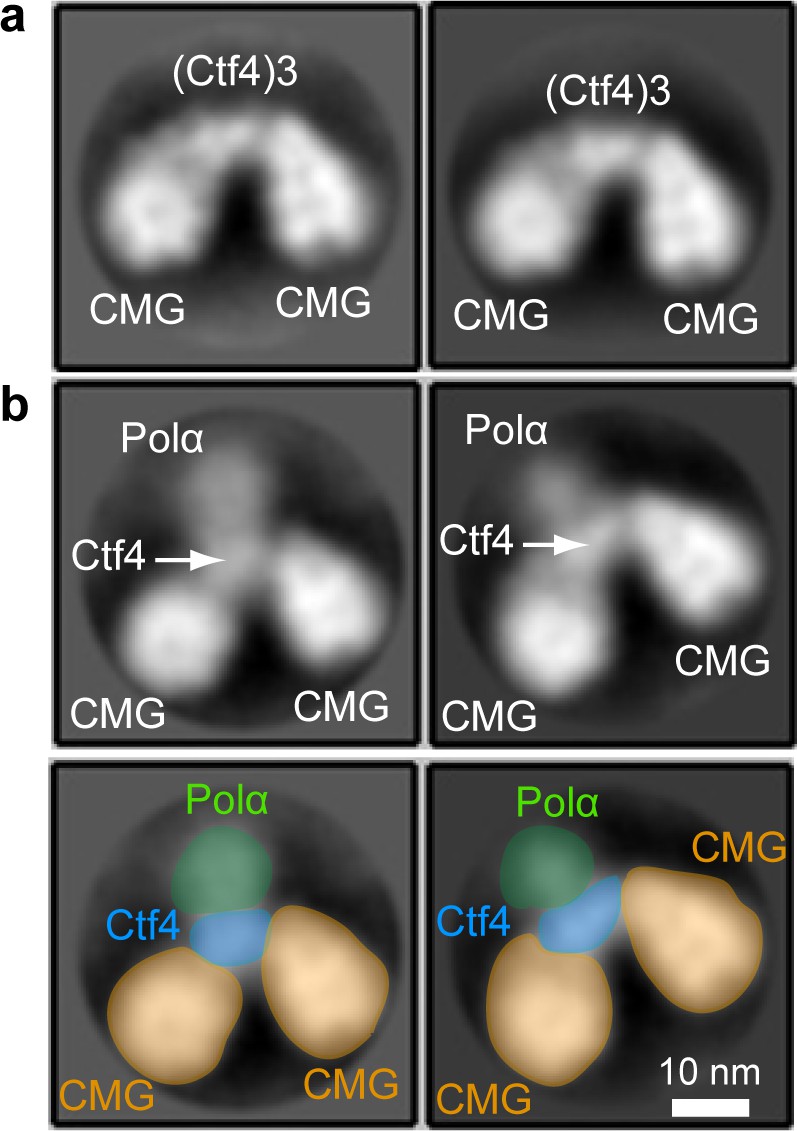
EM observations of a 2CMG−Ctf43−1-Pol α-primase complex.
(a) 2D class averages of negatively stained EM images of CMG plus Ctf4 trimer indicate a 2CMG−Ctf43 complex. (b) The top panels are 2D class averages of negatively stained EM images of a mixture of CMG, Ctf4 trimer and Pol α-primase, which we interpret as a complex of 2CMG−Ctf43−1Pol α-primase. The bottom panels explain the interpretation of the images in the top 2D averages of panel b using yellow to color CMGs, blue to color the Ctf4 trimer, and green to color the Pol1 subunit of Pol α-primase. See text for details.
Figure 7—figure supplement 3
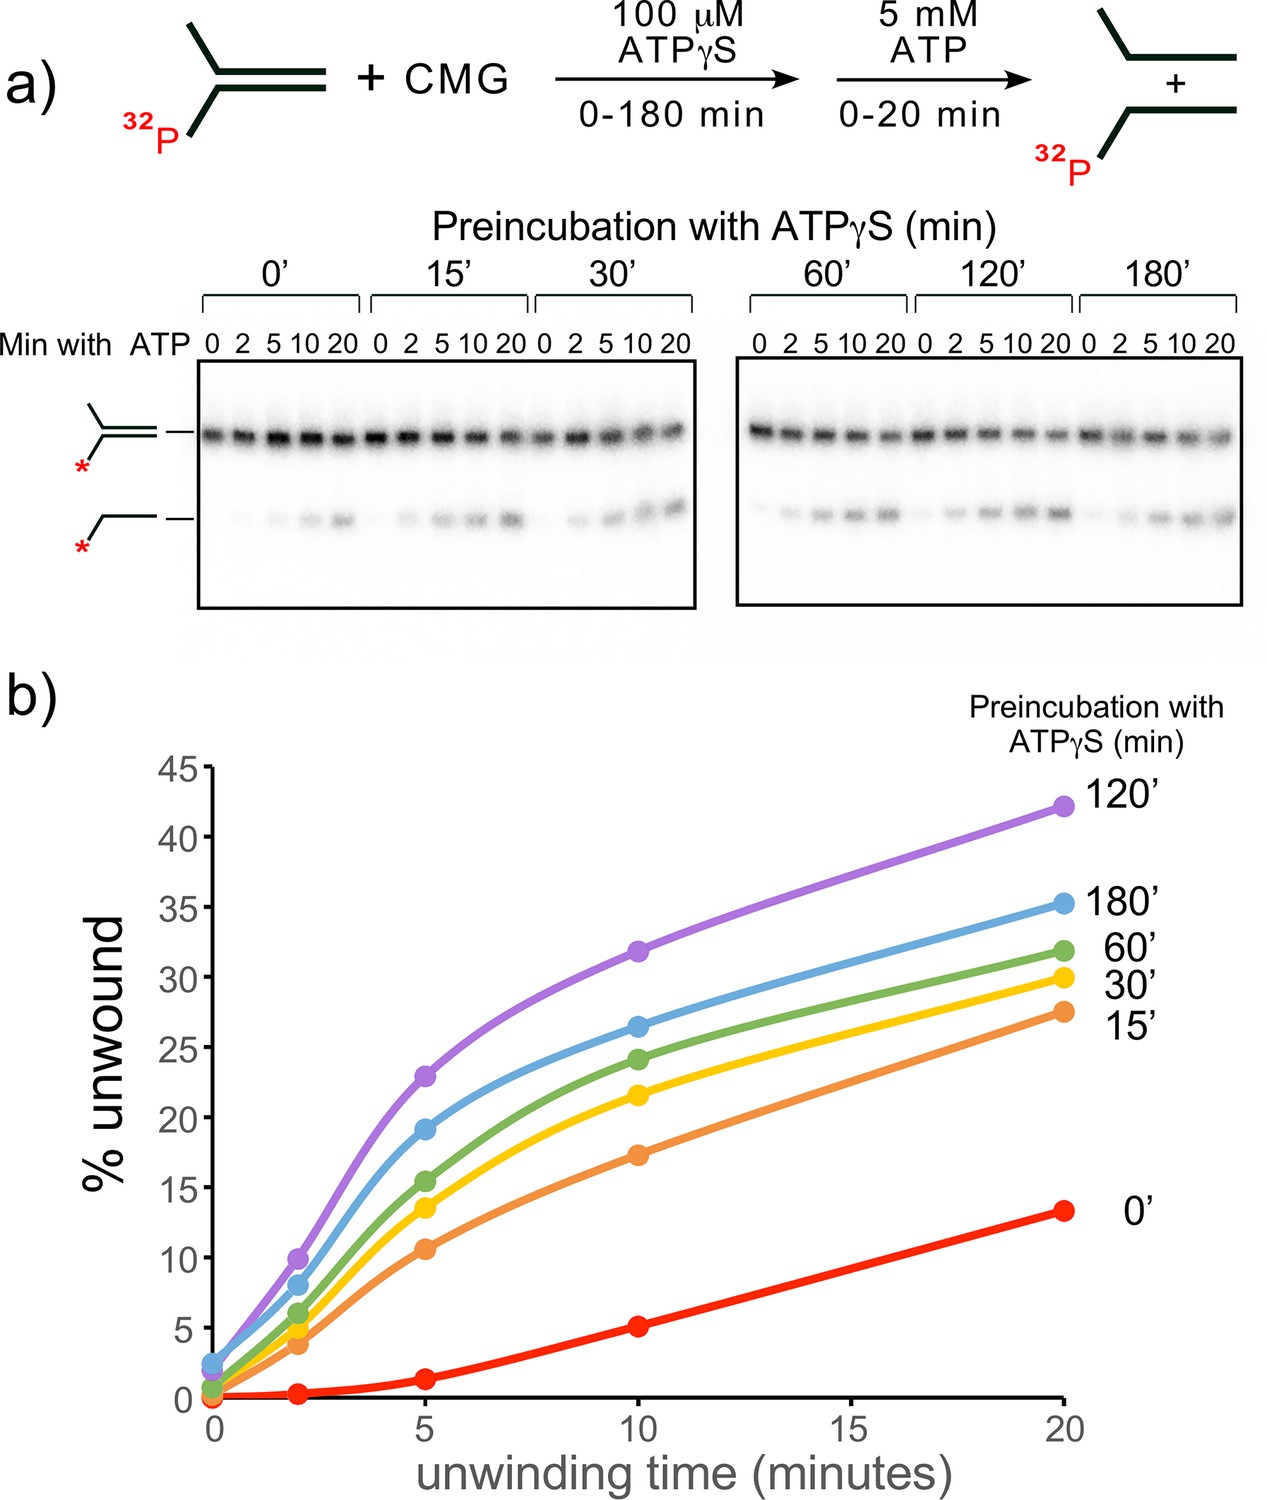
Establishing preincubation conditions for CMG binding to DNA before adding ATP for unwinding in helicase assays.
(a) Scheme of the assay (top) and native PAGE gel analysis (bottom) of CMG helicase activity at different times of preincubating DNA with CMG and 0.1 mM ATPγS, followed by adding 5 mM ATP to initiate unwinding. (b) Quantitation of the gels in panel (a). Minutes of preincubation of CMG, DNA and ATPγS are shown to the right of each line.
Figure 7—figure supplement 4

Establishing preincubation time for Pol α-primase binding to 32P-primed DNA for replication with CMG+/-Ctf4.
(a) Top: scheme of the assay. Reactions containing 20 nM CMG + /- 10 nM Ctf43 were preincubated with 0.5 nM 32-P primed fork DNA and 100 μM ATPγS for a total of 2 hr, and Pol α-primase was added at the times indicated, followed by a 10 min pulse of replication upon using 5 mM ATP and 100 μM each dNTP. Bottom: Reactions were quenched and analyzed by denaturing PAGE. Pol α-primase alone is unable to perform strand displacement, and therefore 32P-primed sites on DNA forks lacking CMG are only extended to the forked junction. (b) Quantitation of the full-length products.
Figure 8 with 2 supplements
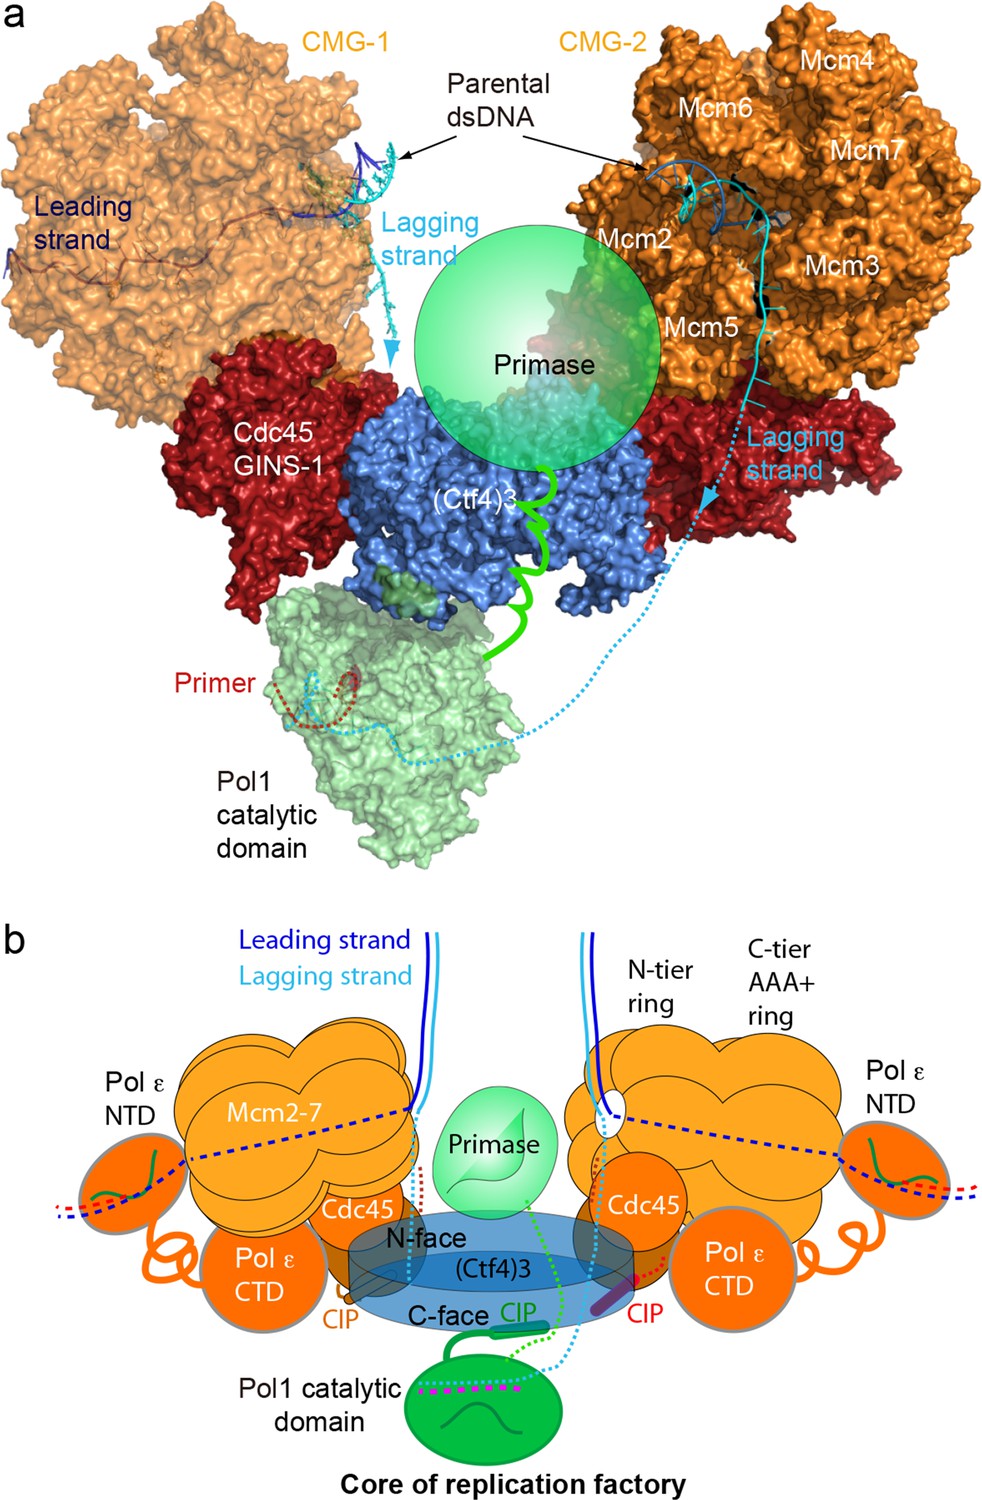
A model for the coupled sister replisomes.
(a) A composite atomic model of one Pol α-primase and two CMG helicases organized in a core factory with a Ctf4 trimer. The model is derived by aligning Ctf43 shared between the Ctf43–CMG dimer model and the model of Ctf43–Pol α NTD. The DNA structure is based on the structure of CMG–forked DNA (PDB 5U8S), but the lagging strand outside the CMG channel is modeled. The possible location of the primase module of Pol α-primase is indicated by a green ellipse. (b) A sketch illustrating the leading strand Pol ε at the C-tier face of the CMG helicase and the primase reaches atop the N-face of Ctf43, potentially capable of priming both lagging strands. See text for details. See also Figure 8—figure supplements 1 and 2, and Video 3. Figure Supplements and their legends.
Figure 8—figure supplement 1

The Pol1 and primase lobes of Pol α-primase have a 70° range of motion.
The primase lobe of Pol α-primase is shown as a semi-transparent sphere connected to Pol1 by a flexible linker. Assuming the primase lobe extends past the Ctf43 disk and resides near the CMGs, the black lines indicate a 70° angle to approximate the previously documented range of motion between the Pol and primase lobes (Núñez-Ramírez et al., 2011).
Figure 8—figure supplement 2

Comparison of the proposed sister replisome core factory to conclusion of super-resolution imagine of marked DNA in cells.
(a) Cartoon of the structural model of a core replicon factory from the current report, along with DNA produced from one bidirectional origin. The black arrows indicate the direction of duplicated leading strand DNA propelled from the leading strand Pol ε in the complex, and the red arrows correspond to the direction of lagging strand synthesis during Okazaki fragment extension. Panel (b) is adapted from Figure 1a in Natsume and Tanaka (2010).
Videos
Video 1
A 360° rotation around a vertical axis of the 3D density map of 1CMG–Ctf43 at 3.8 Å resolution, followed by the subunit-segmented map, and the cartoon view of the atomic model.
The map and model do not include the C-tier AAA+ motor ring of the Mcm2-7, which was excluded during 3D refinement.
Video 2
A 360° rotation of the 3D density map of 2CMG–Ctf43, at 5.8 Å resolution, followed by density segmentation, and then the atomic model of 2CMG–Ctf43.
https://doi.org/10.7554/eLife.47405.017
Video 3
Combination of the structures of 2CMG−Ctf43 with Ctf43–Pol α-primase to generate a pseudo-atomic model of the 2CMG−Ctf43–1Pol α-primase core replicon factory, by overlapping the shared Ctf43 density of the 2CMG−Ctf43 and Ctf43–Pol α-primase structures.
The final model is rotated 360° around a vertical axis.
Tables
Table 1
Cryo-EM 3D reconstruction and refinement of the three Ctf43–CMG complexes.
https://doi.org/10.7554/eLife.47405.008| Ctf43−CMG1 (EMD-20471) (PDB 6PTJ) | Ctf43−CMG2 (EMD-20472) (PDB 6PTN) | Ctf43−CMG3 (EMD-20473) (PDB 6PTO) | |
|---|---|---|---|
| Data collection and processing | |||
| Magnification | 130,000 | 130,000 | 130,000 |
| Voltage (kV) Electron dose (e-/Å2) | 300 50 | 300 50 | 300 50 |
| Under-focus range (μm) | 1.5–2.5 | 1.5–2.5 | 1.5–2.5 |
| Pixel size (Å) | 1.074 | 1.074 | 1.074 |
| Symmetry imposed | C1 | C1 | C1 |
| Initial particle images (no.) | 759,267 | 759,267 | 759,267 |
| Final particle images (no.) | 200,491 | 53,853 | 53,117 |
| Map resolution (Å) | 3.8 | 5.8 | 7.0 |
| FSC threshold | 0.143 | 0.143 | 0.143 |
| Map resolution range (Å) | 3.5–5.0 | 5.0–8.0 | 5.0–8.0 |
| Refinement | |||
| Initial model used (PDB code) | 3jc5, 4c8h | 3jc5, 4c8h | 3jc5, 4c8h |
| Map sharpening B factor (Å2) | −146 | −135 | −143 |
| Model composition | |||
| Non-hydrogen atoms | 34,366 | 90,831 | 131,141 |
| Protein and DNA residues | 41,92 | 11,221 | 15,710 |
| Ligands | 0 | 0 | 0 |
| R.m.s. deviations | |||
| Bond lengths (Å) | 0.009 | ||
| Bond angels (°) | 1.46 | ||
| Validation | |||
| MolProbity score | 2.05 | ||
| Clashscore | 10.96 | ||
| Poor rotamers (%) Ramachandran plot | 0.63 | ||
| Favored (%) | 91.65 | ||
| Allowed (%) | 8.16 | ||
| Disallowed (%) | 0.19 |
Table 2
Cryo-EM 3D reconstruction of the Ctf43–Pol α-primase complex.
https://doi.org/10.7554/eLife.47405.021| Ctf43–Polα- primase (EMD-20744) | |
|---|---|
| Data collection and processing | |
| Magnification | 120,000 |
| Voltage (kV) Electron dose (e-/Å2) | 200 60 |
| Under-focus range (μm) | 1.5–2.5 |
| Pixel size (Å) | 1.21 |
| Symmetry imposed | C1 |
| Initial particle images (no.) | 237,688 |
| Final particle images (no.) | 48,414 |
| Map resolution (Å) | 12 |
| FSC threshold | 0.143 |
| Map resolution range (Å) | 10–15 |
Additional files
-
Transparent reporting form
- https://doi.org/10.7554/eLife.47405.031
Download links
A two-part list of links to download the article, or parts of the article, in various formats.
Downloads (link to download the article as PDF)
Open citations (links to open the citations from this article in various online reference manager services)
Cite this article (links to download the citations from this article in formats compatible with various reference manager tools)
Ctf4 organizes sister replisomes and Pol α into a replication factory
eLife 8:e47405.
https://doi.org/10.7554/eLife.47405


