Default mode-visual network hypoconnectivity in an autism subtype with pronounced social visual engagement difficulties
- Center for Neuroscience and Cognitive Systems @UniTn, Istituto Italiano di Tecnologia, Italy
- University of Cambridge, United Kingdom
- University of California, San Diego, United States
- VISN 22 Mental Illness Research, Education, and Clinical Center, VA San Diego Healthcare System, United States
Figures
Figure 1 with 1 supplement

Identification of the GeoPref ASD subtype and behavioral differentiation in ASD symptoms, verbal, non-verbal, and adaptive behavior domains.
Panel A shows examples of the stimuli used in the GeoPref eye tracking test as well as example fixations from a GeoPref ASD individual (pink), and a nonGeo ASD individual (blue). The red dots superimposed on the stimulus show visual fixations and the size of the red dots indicate fixation duration. Panel B shows a scatter-boxplot of eye tracking data on the GeoPref test for subjects who also had rsfMRI data available (GeoPref ASD, n = 16, pink; nonGeo ASD, n = 62, blue; language/developmental delay, LD/DD, n = 15 yellow; typically developing siblings of ASD individuals, TD ASDSib, n = 16 green; typically developing toddlers, n = 55, turquoise). The middle line of the boxplot represents the median. The box boundaries represent the interquartile range (IQR; Q1 = 25th percentile, Q3 = 75th percentile), while the whiskers indicate the a distance of 1.5*IQR. Percentage of time fixating on the geometric visual stimulus is plotted on the y-axis and group membership is plotted on the x-axis. The cutoff threshold of 69% is noted as the dashed line. GeoPref ASD toddlers (pink) fall above the cutoff, while all other ASD toddlers (nonGeo ASD; blue) fall below the cutoff. Panel C depicts individual and group-level developmental trajectories for longitudinal data from GeoPref ASD (n = 60, pink) or nonGeo ASD (n = 62, blue) on ADOS, Mullen Early Scales of Learning, and Vineland Adaptive Behavior subscales. All measures show a significant main effect of subtype passing FDR q < 0.05. Mullen Receptive Language and Visual Reception subscales additionally show significant (FDR q < 0.05) age*subtype interactions, indicative of different developmental trajectories between the subtypes. The image of a child shown in panel A is taken from a commercially available video (Yoga Kids 3; Gaiam, Boulder, Colorado, http://www.gaiam.com, created by Marsha Wenig, http://yogakids.com) and re-produced here with permission.
© 2003 Gaiam Americas, Inc. All Rights Reserved. Figure 1A is taken from a commercially available video (Yoga Kids 3; Gaiam, Boulder, Colorado, http://www.gaiam.com, created by Marsha Wenig, http://yogakids.com) and re-produced here with permission.
Figure 1—figure supplement 1

Developmental trajectories across Vineland Daily Living Skills and Motor subscales.
GeoPref ASD subtype (pink) and nonGeo ASD toddlers (blue).
Figure 2 with 3 supplements

Functional hypoconnectivity between DMN, visual and attention networks in ASD.
The left column shows surface renderings of ICA components of visual association areas in occipito-temporal cortex (OTC; IC02), primary visual cortex (PVC; IC05), the dorsal attention network (DAN; IC09) and the default mode network (DMN; IC10). The middle column shows scatter-boxplots for DMN-OTC, DMN-PVC, and DMN-DAN connectivity across GeoPref ASD (pink), nonGeo ASD (blue), ASD with no eye tracking data (ASD no ET; magenta), LD/DD (yellow), TD ASDSib (green), and TD (turquoise). Standardized effect sizes (Cohen’s d) are reported in the plots for comparisons of all ASD individuals combined, compared to the other non-ASD comparison groups. The middle line of the boxplot represents the median. The box boundaries represent the interquartile range (IQR; Q1 = 25th percentile, Q3 = 75th percentile), while the whiskers indicate the a distance of 1.5*IQR. The right column uses heatmaps to show standardized effect sizes (Cohen’s d) for all pairwise comparisons of groups with rsfMRI and eye tracking data used in the subtype model. Note that effect sizes are depicted as absolute values, and the directionality of the effects can be seen in the scatter-boxplots. Cells outlined in thick black lines are specific comparisons that survive FDR q < 0.05. Cells outlined in thinner black lines are comparisons that survive FDR q < 0.1.
Figure 2—figure supplement 1
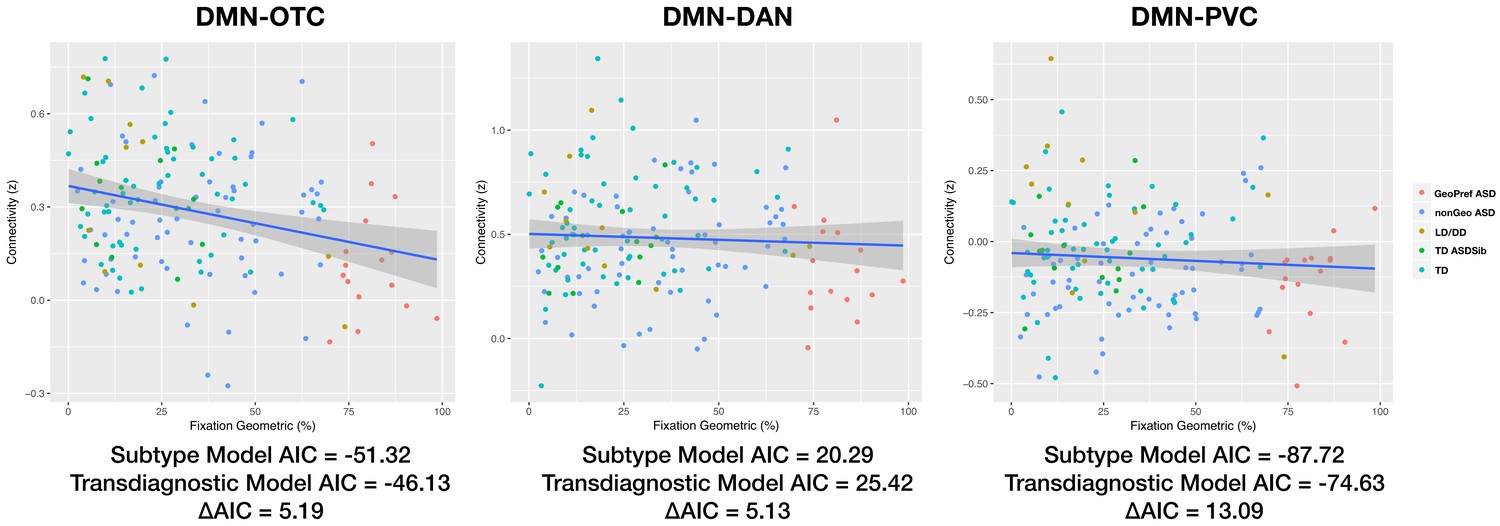
Scatterplots of the relationship between functional connectivity by percentage fixation on the geometric stimulus.
This figure shows scatterplots of functional connectivity and percentage fixation on the geometric stimulus. Below each scatterplot are the AIC values for the subtype and transdiagnostic models.
Figure 2—figure supplement 2
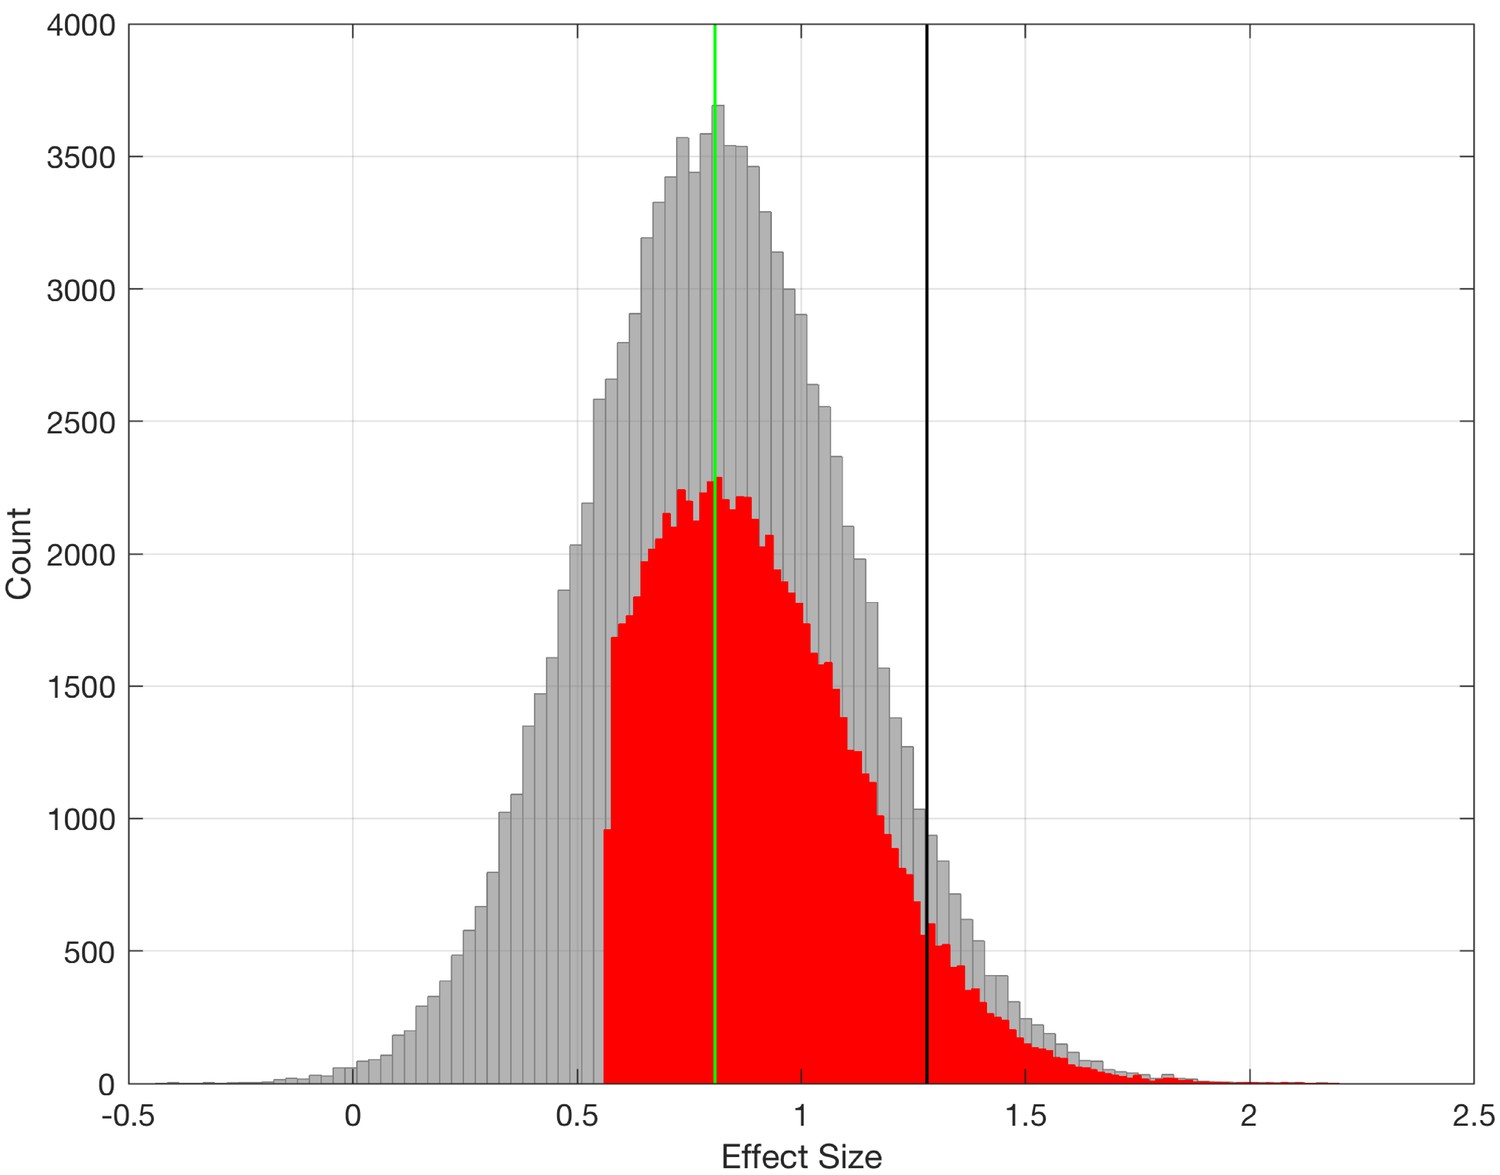
Simulation illustrating statistical power.
Power simulation at minimum effect size (d = 0.80751) to achieve 80% power at alpha = 0.05 and n = 16 (GeoPref ASD) vs n = 55 (TD). The gray histogram plotted here are the sample effect size estimates simulated from 100,000 experiments sampling n = 16 vs n = 55 from a population size of n = 10,000,000, and where the true population effect size is d = 0.80751 (green vertical line). Plotted in red is the histogram of sample effect sizes from 80,000 experiments whereby the results of the simulated experiment resulted in a rejected null hypothesis (e.g., p<0.05). Plotted as a black vertical line is the actual sample effect size estimated from the current study for GeoPref ASD vs TD (d = 1.28).
Figure 2—figure supplement 3
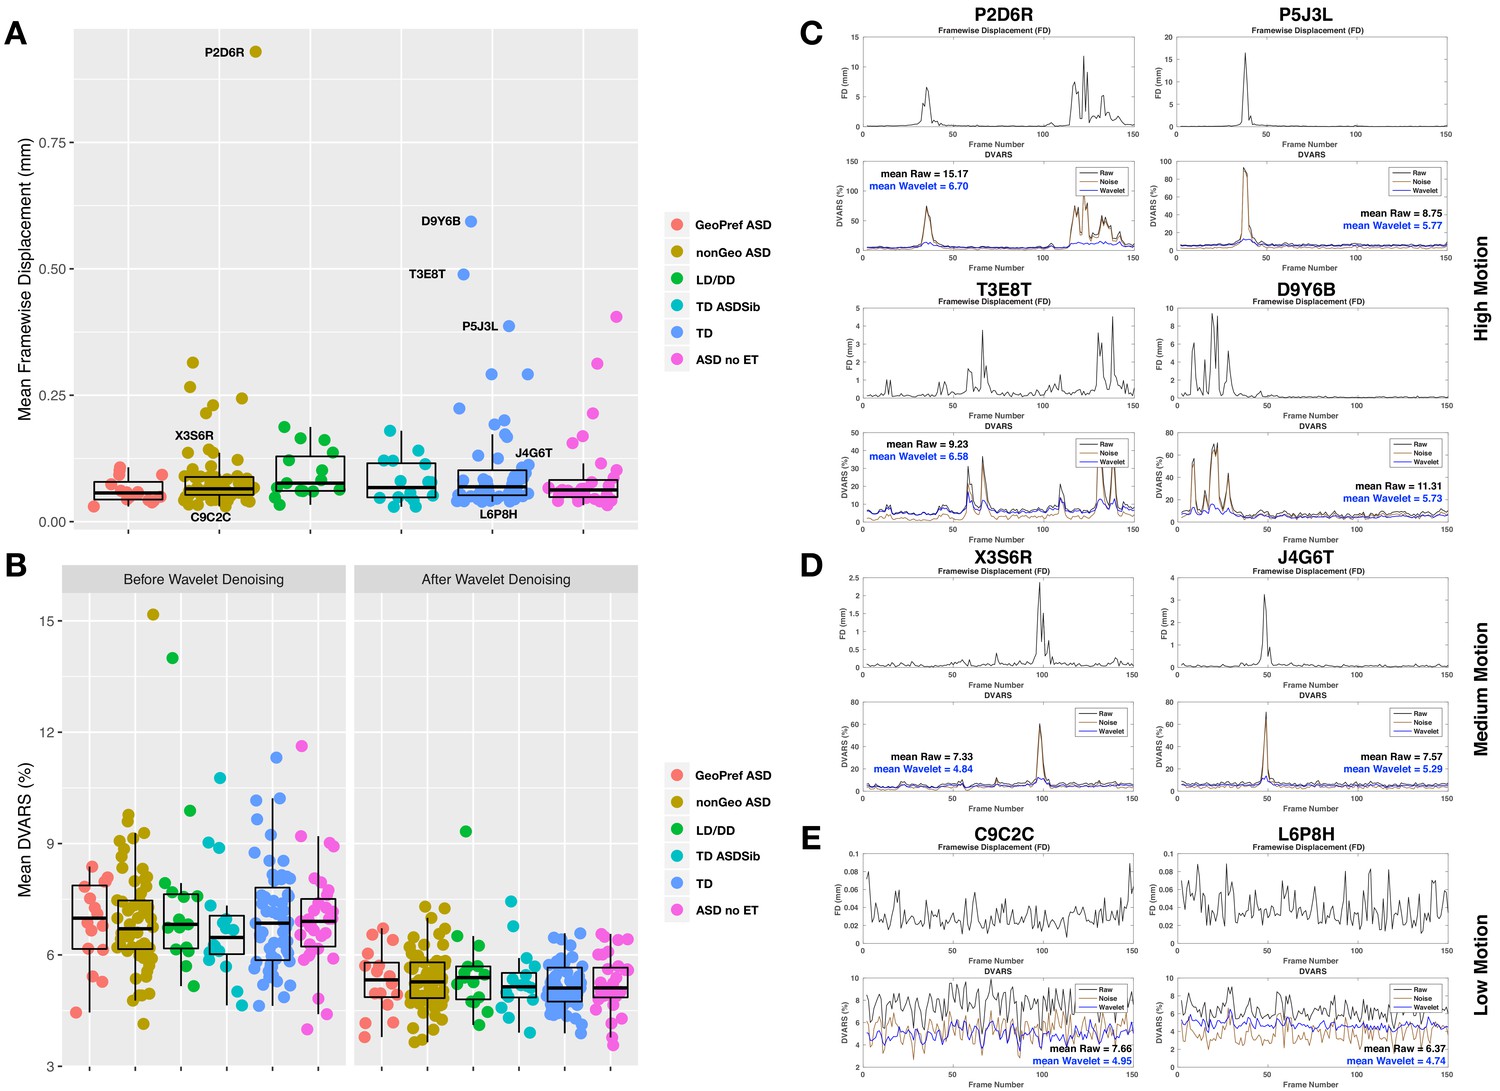
Head motion effects.
Panels A-B show mean framewise displacement (A) and mean DVARS before and after wavelet denoising (B) across all groups. Specific example subjects are labeled in panel A and shown in panels C-E as examples of high (C), medium (D), or low motion (E) subjects. The plots in panels C-E show framewise displacement on top and DVARS on the bottom. The DVARS plot shows the DVARS trace from the raw preprocessed data (black), the noise identified from wavelet denoising (brown), and the final wavelet denoised dataset (blue).
Figure 3
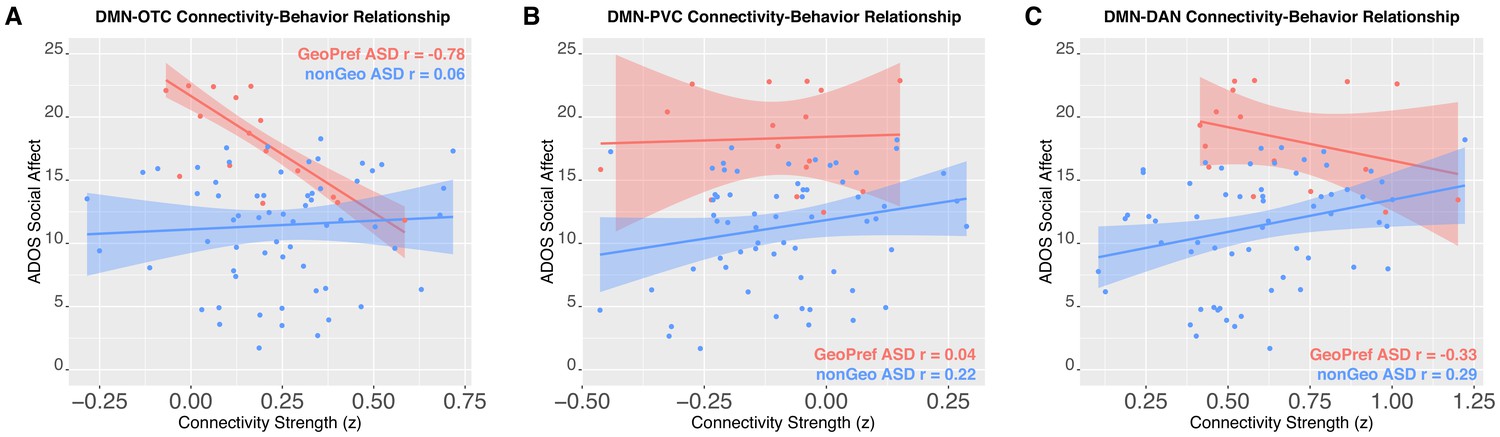
Connectivity-social-communication relationships.
This figure shows functional connectivity-social-communication relationships for DMN-OTC (Panel A), DMN-PVC (Panel B), and DMN-DAN (Panel C). The relationship for GeoPref ASD is shown in pink, while nonGeo ASD is shown in blue. Both ADOS social affect and connectivity scores shown in the plot are covariate adjusted scores (taking into account age) from the robust regression model evaluating the relationship.
Tables
Table 1
Descriptive statistics across all groups for age at rsfMRI scan, sex, and head motion measurements.
| N (M, F) | Mean age at eye tracking in months (SD) | Mean age at rsfMRI scan in months (SD) | Age range at rsfMRI scan in months | Mean framewise displacement (SD) | |
|---|---|---|---|---|---|
| ASD no ET (rsfMRI data only; no eye tracking data) | 31 (27,4) | - | 29.69 (8.88) | 13.21–43.63 | 0.09 (0.08) |
| GeoPref ASD | 16 (11,5) | 28.37 (7.77) | 29.92 (8.71) | 14.16–43.79 | 0.06 (0.02) |
| nonGeo ASD | 62 (49,13) | 26.30 (8.35) | 29.37 (8.35) | 12.35–44.05 | 0.09 (0.12) |
| LD/DD | 15 (10,5) | 19.36 (4.15) | 25.12 (7.97) | 13.37–39.75 | 0.10 (0.05) |
| TD ASDSib | 16 (8,8) | 19.79 (6.20) | 26.74 (9.38) | 12.52–44.09 | 0.08 (0.04) |
| TD | 55 (37,18) | 23.07 (9.07) | 29.61 (10.14) | 13.17–47.93 | 0.10 (0.11) |
Additional files
-
Supplementary file 1
Statistics for longitudinal behavior analyses.
This file shows statistics for linear mixed effect models for longitudinal behavioral analyses. Each behavioral measure used as the dependent variable (e.g., ADOS, Mullen, and Vineland subscales) is noted at the top of each table. Degrees of freedom, F-statistics, and p-values are reported for main effects of age, subgroup and the age*subgroup interaction. Red stars indicate effects that pass FDR q < 0.05 for multiple comparisons.
- https://cdn.elifesciences.org/articles/47427/elife-47427-supp1-v1.xlsx
-
Supplementary file 2
Statistics for each functional connectivity comparison.
This file shows statistics for case-control or subtype models for each functional connectivity component-pair comparison. Case-control and subtype models report degrees of freedom, F-stats, p-values, and η2, and FDR statistics. Additionally, there are columns reporting the AIC values for the case-control or subtype models. The final set of columns report t-stats, p-values, and effect size (Cohen’s d) for specific pairwise group comparisons. Note that these statistics are estimated based on the full dataset of n = 195 toddlers with rsfMRI scanning data available (with or without eye tracking data). Red color indicates comparisons that pass FDR q < 0.05.
- https://cdn.elifesciences.org/articles/47427/elife-47427-supp2-v1.xlsx
-
Supplementary file 3
Statistics for pairwise group comparisons from DMN-OTC, DMN-PVC, and DMN-DAN component-pairs.
This file shows t-statistics, p-values estimated from non-parametric permutation tests, FDR q-values, and standardized effect sizes (Cohen’s d) statistics for each pairwise group comparisons for DMN-OTC, DMN-PVC, and DMN-DAN component pairs. Note that these statistics are estimated based on the dataset of toddlers that had both rsfMRI and eye tracking data available (n = 164). Red color indicates comparisons that pass FDR q < 0.05.
- https://cdn.elifesciences.org/articles/47427/elife-47427-supp3-v1.xlsx
-
Transparent reporting form
- https://cdn.elifesciences.org/articles/47427/elife-47427-transrepform-v1.docx
Download links
A two-part list of links to download the article, or parts of the article, in various formats.
Downloads (link to download the article as PDF)
Open citations (links to open the citations from this article in various online reference manager services)
Cite this article (links to download the citations from this article in formats compatible with various reference manager tools)
Default mode-visual network hypoconnectivity in an autism subtype with pronounced social visual engagement difficulties
eLife 8:e47427.
https://doi.org/10.7554/eLife.47427


