The structure of species discrimination signals across a primate radiation
- New York University, United States
- New York Consortium in Evolutionary Primatology, United States
- Swansea University, United Kingdom
Figures
Figure 1 with 1 supplement
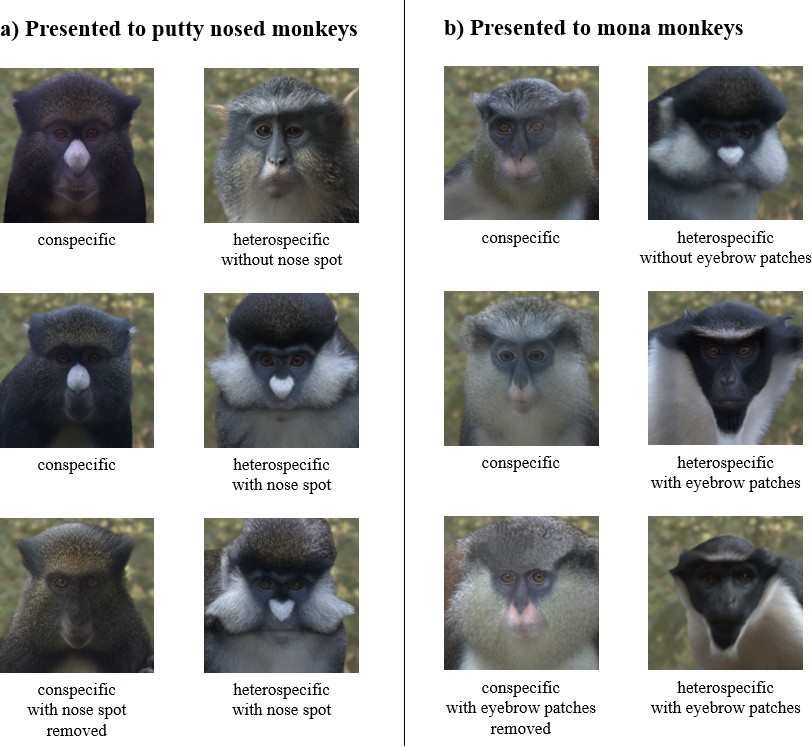
Example experimental stimulus pairs.
Subjects were shown a pair of stimulus images consisting of a conspecific and a heterospecific. Facial traits (nose spots for putty nosed monkeys and eyebrow patches for mona monkeys) were varied across trials, with conspecifics paired with a heterospecific species that shares the facial trait (row 1) and one that does not (rows 2 and 3). Conspecifics were displayed either naturally (rows 1 and 2) or with the facial trait removed (row 3). All subjects participated in all three trial types. Trial order and stimulus image side were counterbalanced across subjects.
Figure 1—figure supplement 1

The experimental apparatus.
(Top) The apparatus was painted to draw interest and placed immediately outside subject enclosures. (Middle) A widescreen laptop and video camera were housed inside the apparatus to display stimulus images and record subject responses. (Bottom) View of subject participating in looking time trial as recorded by the internal video camera.
Figure 2 with 11 supplements
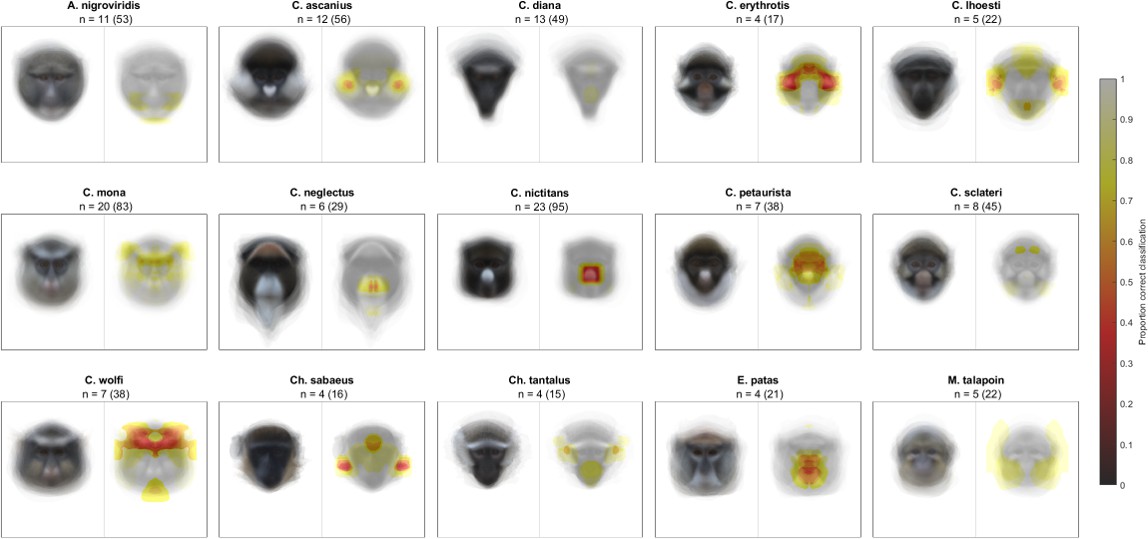
Likelihood of correct classification based on occlusion of different face regions.
Species average faces are displayed on the left and heatmaps identifying critical face regions on the right. Sample size is reported as n = number of individuals (number of total images).
Figure 2—figure supplement 1

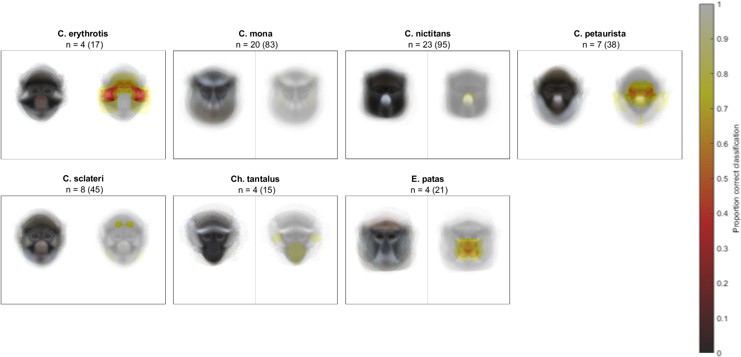
Likelihood of correct classification based on occlusion of different face regions with the occluder set to the species-specific mean face color and run on the left hemi-face (see Appendix), using a subset of species that overlap in range with putty nosed monkeys.
Species average faces are displayed on the left and heatmaps identifying critical face regions on the right. Sample size is reported as n = number of individuals (number of total images).
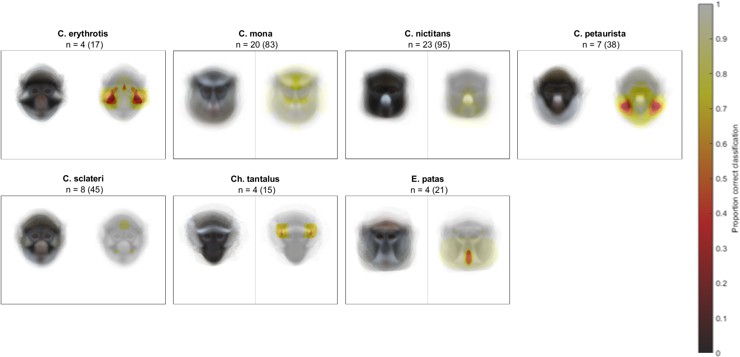
Figure 2—figure supplement 2
Likelihood of correct classification based on occlusion of different face regions with the occluder set to the species-specific mean face color and run on the right hemi-face (see Appendix), using a subset of species that overlap in range with putty nosed monkeys.
Species average faces are displayed on the left and heatmaps identifying critical face regions on the right. Sample size is reported as n = number of individuals (number of total images).
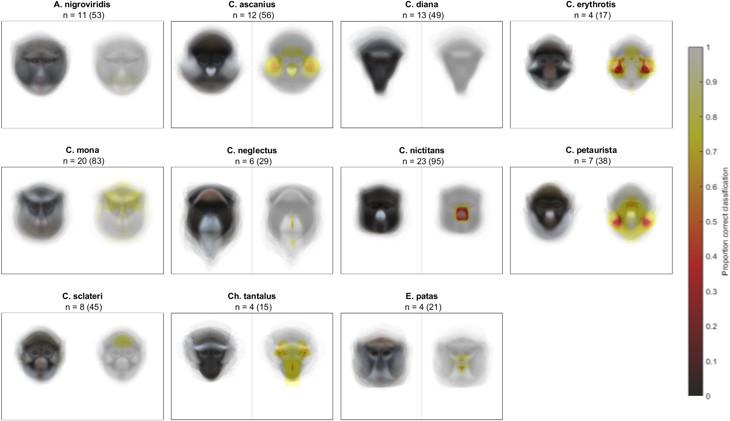
Figure 2—figure supplement 3
Likelihood of correct classification based on occlusion of different face regions using an average gray occluder on left hemi-face (see Appendix), using a subset of species that overlap in range with putty nosed monkeys.
Species average faces are displayed on the left and heatmaps identifying critical face regions on the right. Sample size is reported as n = number of individuals (number of total images).
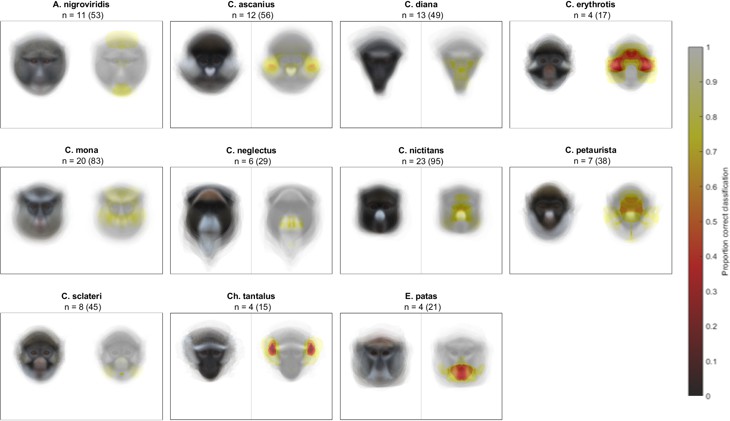
Figure 2—figure supplement 4

Likelihood of correct classification based on occlusion of different face regions using an average gray occluder on right hemi-face (see Appendix), using a subset of species that overlap in range with putty nosed monkeys.
Species average faces are displayed on the left and heatmaps identifying critical face regions on the right. Sample size is reported as n = number of individuals (number of total images).
Figure 2—figure supplement 5
Likelihood of correct classification based on occlusion of different face regions with the occluder set to the species-specific mean face color and run on the left hemi-face (see Appendix), using a subset of species that overlap in range with mona monkeys.
Species average faces are displayed on the left and heatmaps identifying critical face regions on the right. Sample size is reported as n = number of individuals (number of total images).
Figure 2—figure supplement 6

Likelihood of correct classification based on occlusion of different face regions with the occluder set to the species-specific mean face color and run on the right hemi-face (see Appendix), using a subset of species that overlap in range with mona monkeys.
Species average faces are displayed on the left and heatmaps identifying critical face regions on the right. Sample size is reported as n = number of individuals (number of total images).
Figure 2—figure supplement 7

Likelihood of correct classification based on occlusion of different face regions using an average gray occluder on left hemi-face (see Appendix), using a subset of species that overlap in range with mona monkeys.
Species average faces are displayed on the left and heatmaps identifying critical face regions on the right. Sample size is reported as n = number of individuals (number of total images).
Figure 2—figure supplement 8
Likelihood of correct classification based on occlusion of different face regions using an average gray occluder on right hemi-face (see Appendix), using a subset of species that overlap in range with mona monkeys.
Species average faces are displayed on the left and heatmaps identifying critical face regions on the right. Sample size is reported as n = number of individuals (number of total images).
Figure 2—figure supplement 9
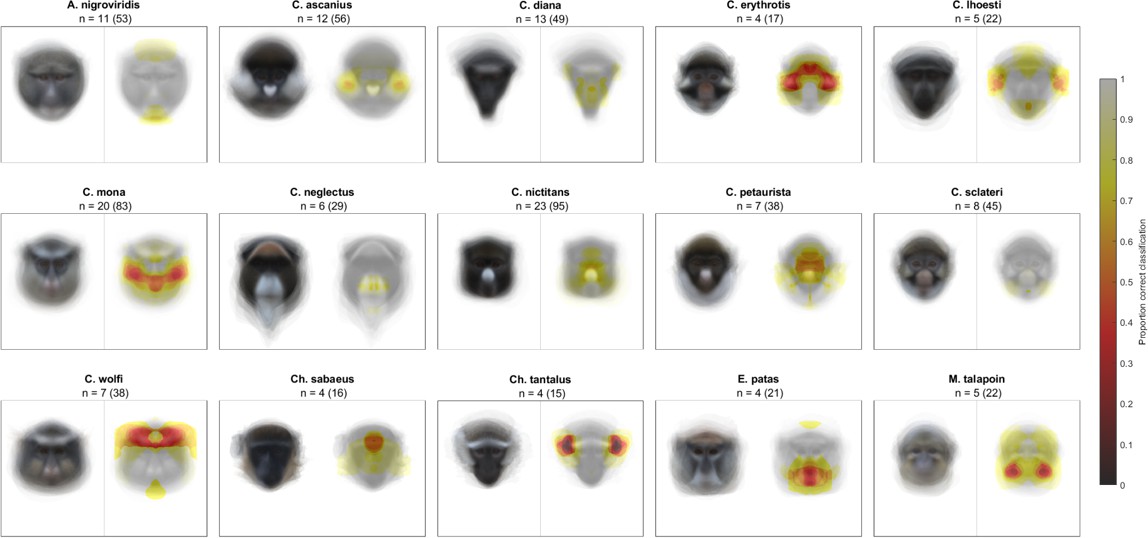
Likelihood of correct classification based on occlusion of different face regions using an average gray occluder on left hemi-faces (see Appendix).
Species average faces are displayed on the left and heatmaps identifying critical face regions on the right. Sample size is reported as n = number of individuals (number of total images).
Figure 2—figure supplement 10
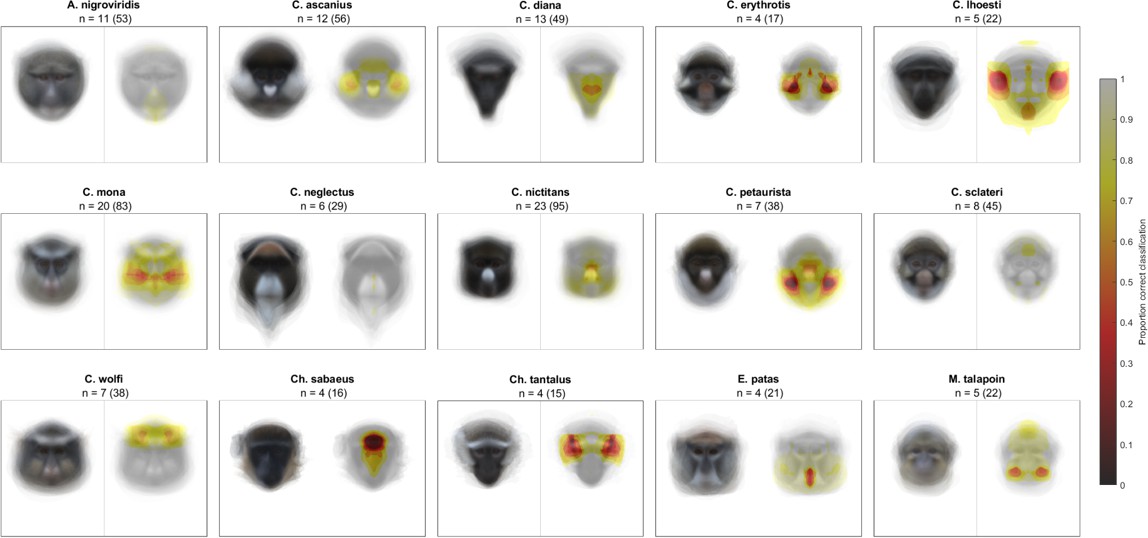
Likelihood of correct classification based on occlusion of different face regions using an average gray occluder on right hemi-faces (see Appendix).
Species average faces are displayed on the left and heatmaps identifying critical face regions on the right. Sample size is reported as n = number of individuals (number of total images).
Figure 2—figure supplement 11

Likelihood of correct classification based on occlusion of different face regions with the occluder set to the species-specific mean face color and run on the right hemi-face (see Appendix).
Species average faces are displayed on the left and heatmaps identifying critical face regions on the right. Sample size is reported as n = number of individuals (number of total images).
Figure 3
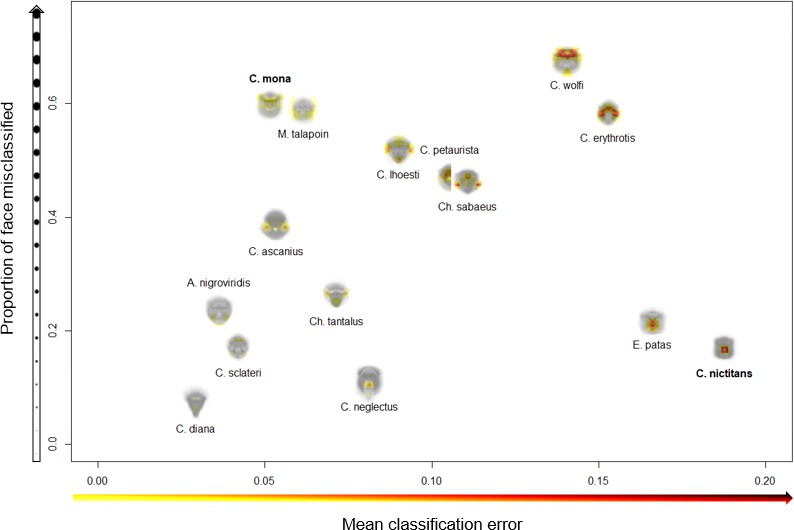
Variation across species in face regions identified as essential for correct species classification.
The proportion of the face misclassified (y-axis) indicates the spread of essential regions across the face; higher values signify broader spread and lower values more concentrated regions. The mean classification error (x-axis) measures the relative importance of identified features; higher values indicate higher rates of misclassification, suggesting identified regions are particularly essential for correct species classification. Experimental results are presented for C. mona and C. nictitans (Figure 4).
Figure 4
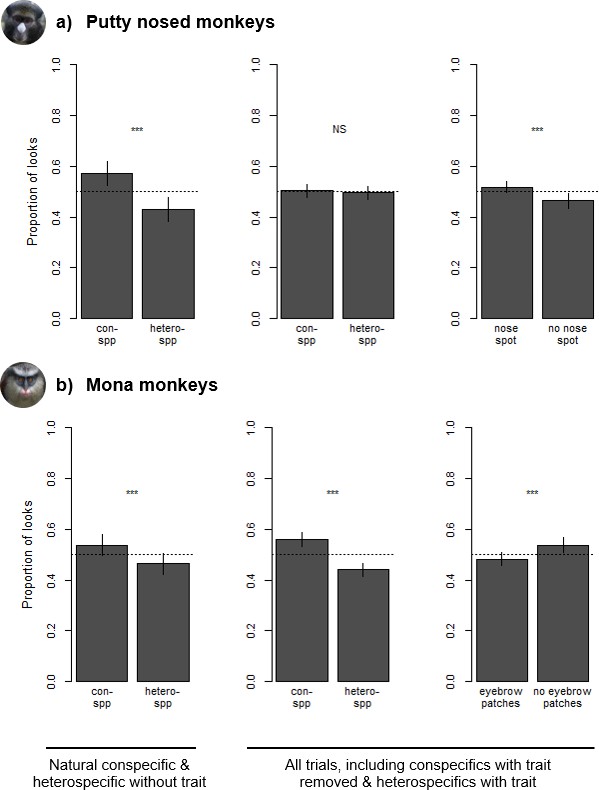
Species and trait biases observed during looking time tasks with (a) putty nosed monkeys and (b) mona monkeys.
Each trial involved the simultaneous presentation of two images, with proportion of looks calculated as the relative duration of eye gaze at each image. Leftmost plots depict differences in looking time in trials consisting of conspecifics and heterospecifics without the relevant facial trait. Center and right plots depict looking time differences across all trials – which also include heterospecifics with the relevant facial trait and conspecifics without it – with species biases depicted in the center and trait biases on the right. Results are based on 18 putty nosed monkeys and 16 mona monkeys. Each subject participated in three trials (see Figure 1 for example stimuli for each trial type). Error bars indicate the standard error of the mean.
Figure 5

Average guenon face with an occluder shown in the top left.
The occluder is depicted in black for maximal visibility, but in analyses presented here is set to the mean face color of the relevant species. During the occlude-reclassify analysis, the occluder is slid across the image and the image re-classified; an incorrect classification at a given occluder location indicates the presence of face information critical to correct classification. Analyses are run on hemi-faces to account for facial symmetry. Image borders outside the radius of the occluder are not tested; the dashed line encloses the region of the image analyzed using the occlude-reclassify procedure.
Additional files
-
Supplementary file 1
Occlude-reclassify machine classification results.
- https://cdn.elifesciences.org/articles/47428/elife-47428-supp1-v1.zip
-
Supplementary file 2
Looking time results.
- https://cdn.elifesciences.org/articles/47428/elife-47428-supp2-v1.docx
-
Transparent reporting form
- https://cdn.elifesciences.org/articles/47428/elife-47428-transrepform-v1.docx
Download links
A two-part list of links to download the article, or parts of the article, in various formats.
Downloads (link to download the article as PDF)
Open citations (links to open the citations from this article in various online reference manager services)
Cite this article (links to download the citations from this article in formats compatible with various reference manager tools)
The structure of species discrimination signals across a primate radiation
eLife 9:e47428.
https://doi.org/10.7554/eLife.47428


