Intergenerational effects of early adversity on survival in wild baboons
- Duke University, United States
- University of Notre Dame, United States
- Institute of Primate Research, National Museums of Kenya, Kenya
- Princeton University, United States
Figures
Figure 1
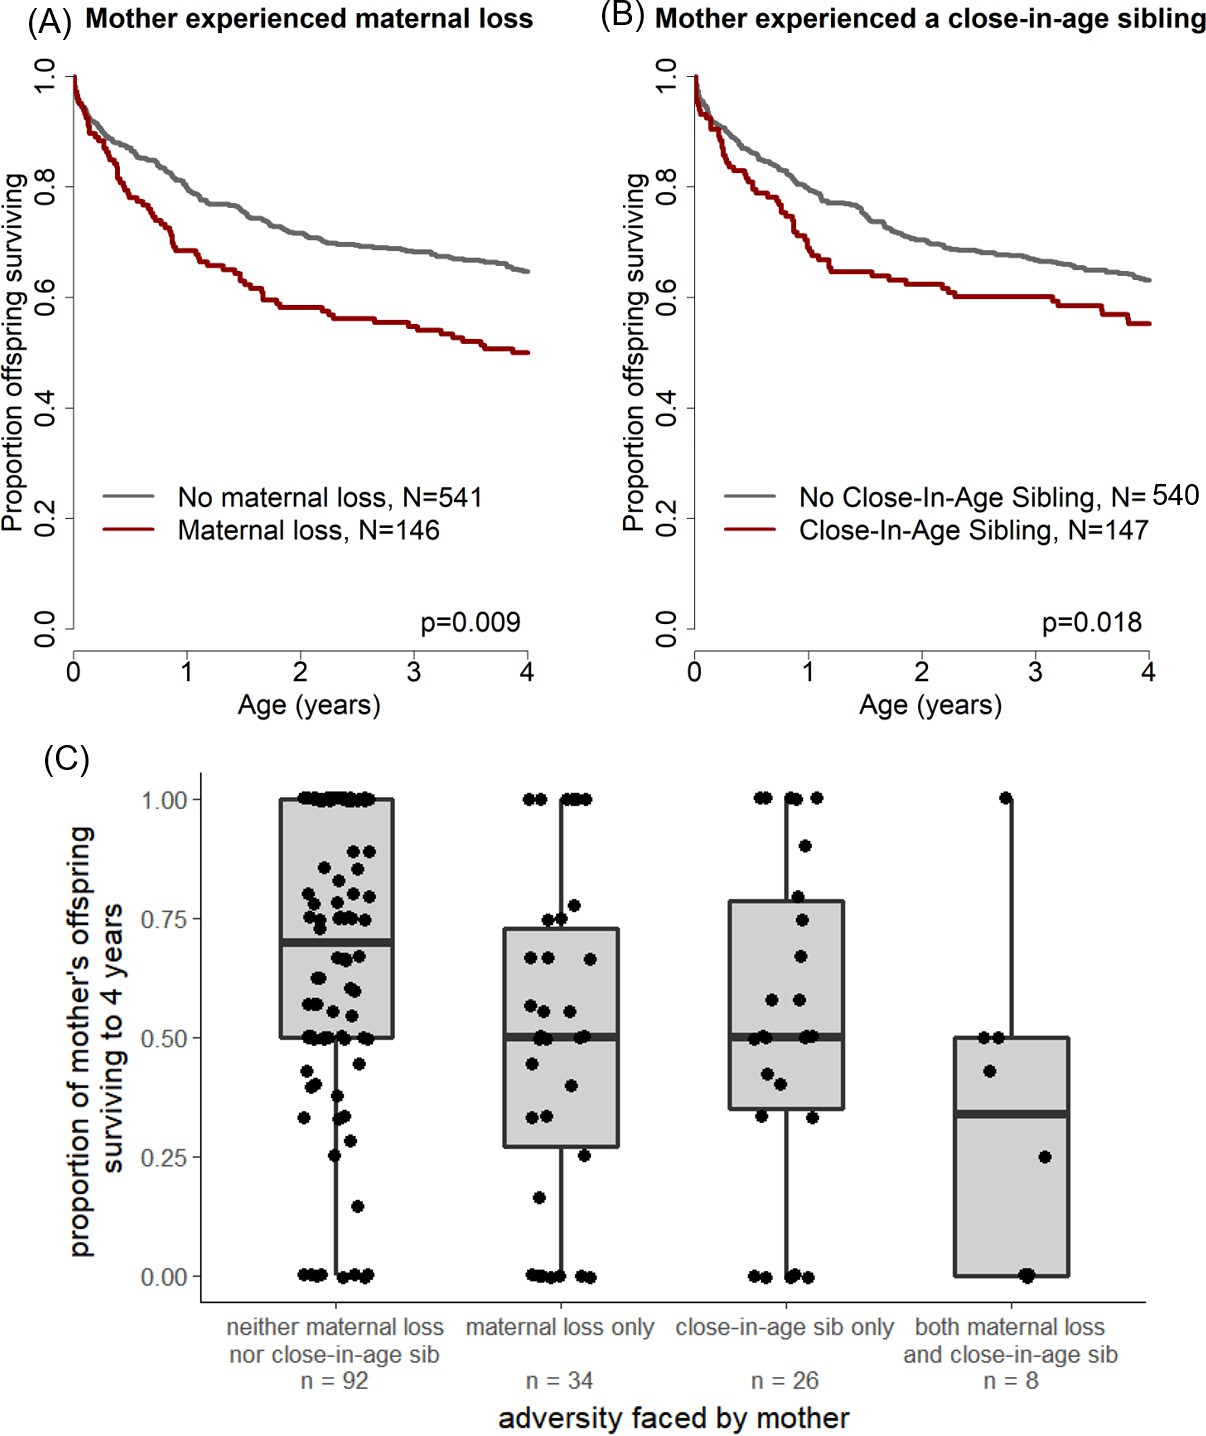
Offspring survival was influenced by characteristics of their mothers’ early-life environments.
Offspring survived relatively less well during the juvenile period if (A) their mother lost her own mother during her early life and/or (B) their mother experienced a close-in-age younger sibling. An alternative visualization of the data (C) shows an equivalent pattern when mothers, rather than offspring, are treated as the unit of analysis.
Figure 2
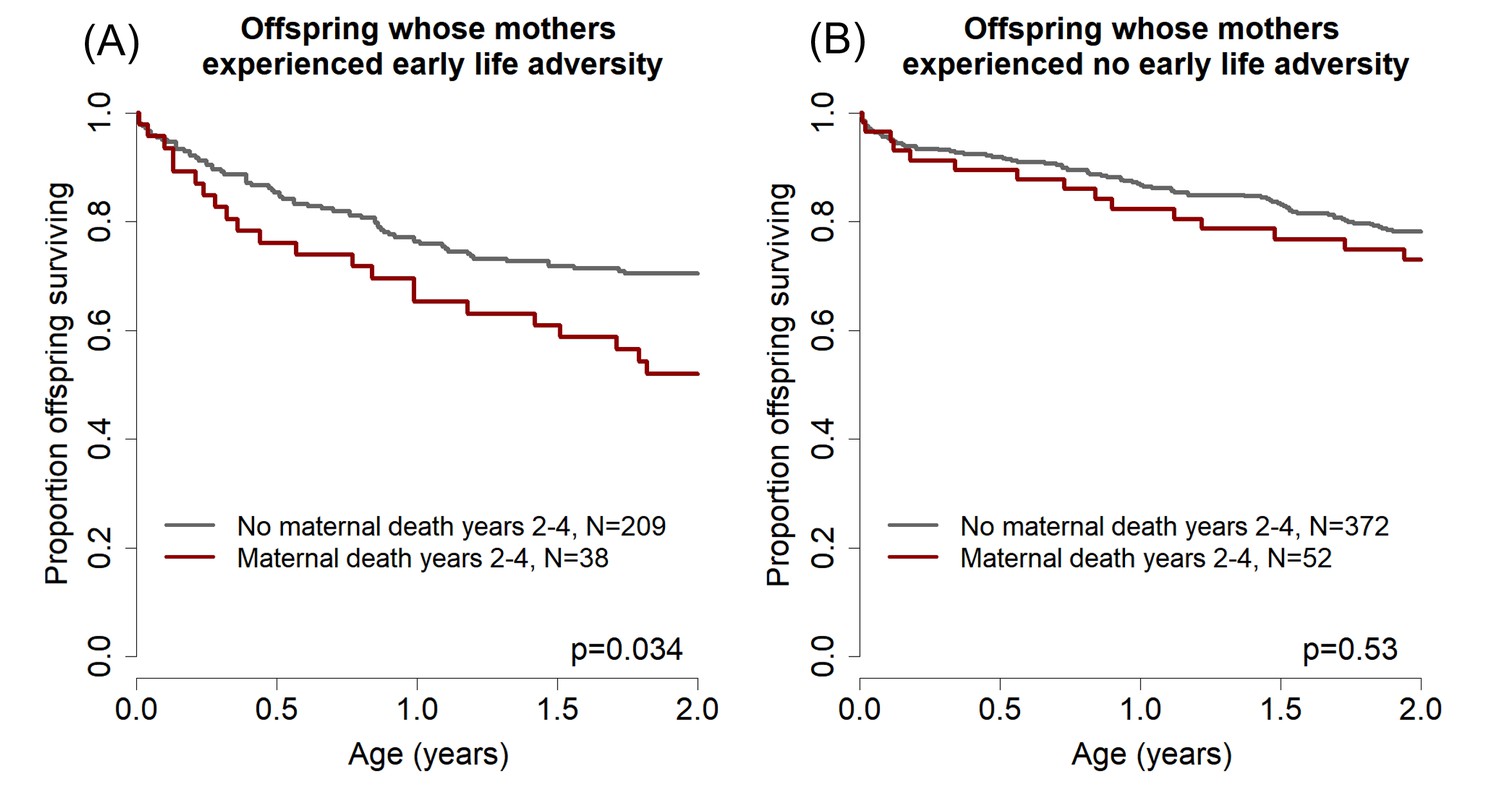
Effects of maternal adversity on offspring survival are explained by reduced maternal viability.
(A) Among those offspring whose mothers experienced significant early life adversity (maternal loss and/or a competing younger sibling), poor offspring survival from ages 0–2 (while the mother was still alive) was predicted by maternal death in years 2–4 after the offspring’s birth. (B) In contrast, there was no relationship between offspring survival in the first two years of life and maternal death in years 2–4 for the offspring of mothers who did not experience early life adversity.
Tables
Table 1
Early adverse conditions and the frequencies with which they occur in maternal and offspring generations of our dataset.
https://doi.org/10.7554/eLife.47433.003| Adverse Condition* | Criterion | Frequency | |
|---|---|---|---|
| Maternal Generation | Offspring Generation | ||
| Drought | During the first year of life, the focal individual experienced less than 200 mm of rainfall (i.e., drought conditions; Beehner et al., 2006). | 0.09 | 0.15 |
| High Social Density | The individual was born into a group with a high social density (>35 adults), indicating high levels of within-group competition. | 0.06 | 0.32 |
| Maternal Loss | The mother of the focal individual died within four years of the individual’s birth. | 0.21 | 0.25 |
| Low Maternal Rank† | The focal individual was born to a mother with a low social rank (mother’s rank fell in the bottom quartile of the group’s dominance hierarchy, rank < 0.25). | 0.17 | 0.23 |
| Close-In-Age Younger Sibling‡ | The focal individual had a younger sibling born to its mother within 18 months of the focal’s birth. | 0.20 | -- |
-
*These criteria were used in a previous analysis in our population (Tung et al., 2016), with the exception of maternal rank, which is evaluated here as a proportional measure rather than an ordinal one as in the previous analysis.
†Proportional rank is the proportion of other adult females in a group that an individual’s mother outranks. The reduced frequency with which low maternal rank appears in the maternal generation is a likely a result of offspring of low-ranking mothers surviving less well (Silk et al., 2003), and therefore not surviving to appear as mothers in our dataset.
-
‡We excluded the birth of a close-in-age younger sibling for the offspring generation to avoid including a potential reverse-causal factor in our model: the closest-in-age siblings in our dataset occur as a result of the focal offspring’s death, because female baboons (who are not seasonal reproducers) accelerate their next conception after the death of a dependent offspring.
Table 2
Reduced model of the effects of maternal and offspring early adversity on offspring survival during early life (R2 = 0.07).
https://doi.org/10.7554/eLife.47433.005| Generation | Parameter* | Coefficient | Hazard ratio (95% CI) | P value | Interpretation |
|---|---|---|---|---|---|
| Maternal | Maternal Loss | 0.37 | 1.44 (1.10–1.90) | 0.009 | Offspring survive less well if their mother experienced maternal loss during her early life. |
| Close-in-age Younger Sibling | 0.35 | 1.42 (1.06–1.90) | 0.018 | Offspring survive less well if their mother had a close-in-age younger sibling during her early life. | |
| Offspring | Maternal Loss | 0.68 | 1.98 (1.53–2.56) | 3 × 10⁻⁷ | Offspring survive less well if they experienced maternal loss within four years of their birth. |
| Low Maternal Rank | 0.43 | 1.54 (1.17–2.01) | 0.002 | Offspring survive less well if they were born to a low-ranking mother. |
-
*An alternative model that considered cumulative maternal adversity was not a better or worse fit than the reduced multivariate maternal adversity model (see Supplementary file 1 Table S6. For both the model presented here and that in Supplementary file 1 Table S6, R2 = 0.07, log likelihood = −1598).
Additional files
-
Supplementary file 1
Tables S1-S7.
- https://doi.org/10.7554/eLife.47433.007
-
Transparent reporting form
- https://doi.org/10.7554/eLife.47433.008
Download links
A two-part list of links to download the article, or parts of the article, in various formats.
Downloads (link to download the article as PDF)
Open citations (links to open the citations from this article in various online reference manager services)
Cite this article (links to download the citations from this article in formats compatible with various reference manager tools)
Intergenerational effects of early adversity on survival in wild baboons
eLife 8:e47433.
https://doi.org/10.7554/eLife.47433


