Processing of different spatial scales in the human brain
- Hebrew University of Jerusalem, Israel
- Hadassah Hebrew University Medical School, Israel
- University of Pennsylvania, United States
Figures
Figure 1 with 2 supplements
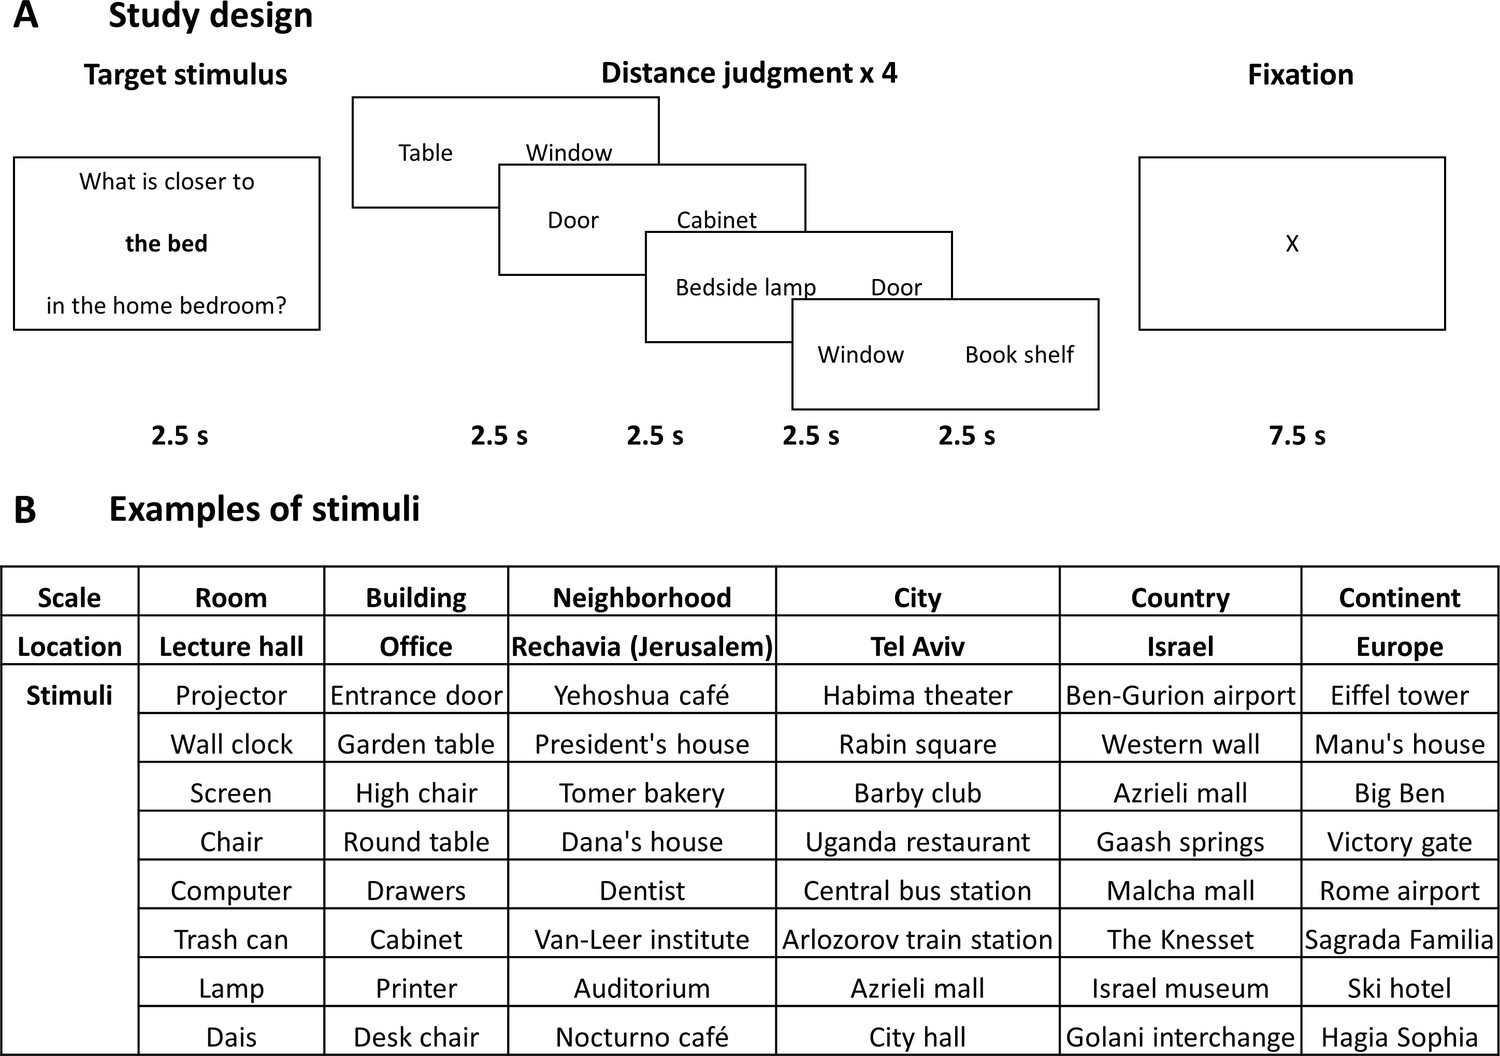
Study design and stimuli.
(A) The design of the study. In each block, subjects viewed one target item in a specific scale and location, and then performed four proximity comparisons for pairs of other items from the same location. All stimuli were provided by the subjects from locations personally familiar to them, and target and comparison items were chosen randomly from the subject’s stimulus set. (B) Examples of stimuli (subject-provided locations and items) in each spatial scale.
Figure 1—figure supplement 1
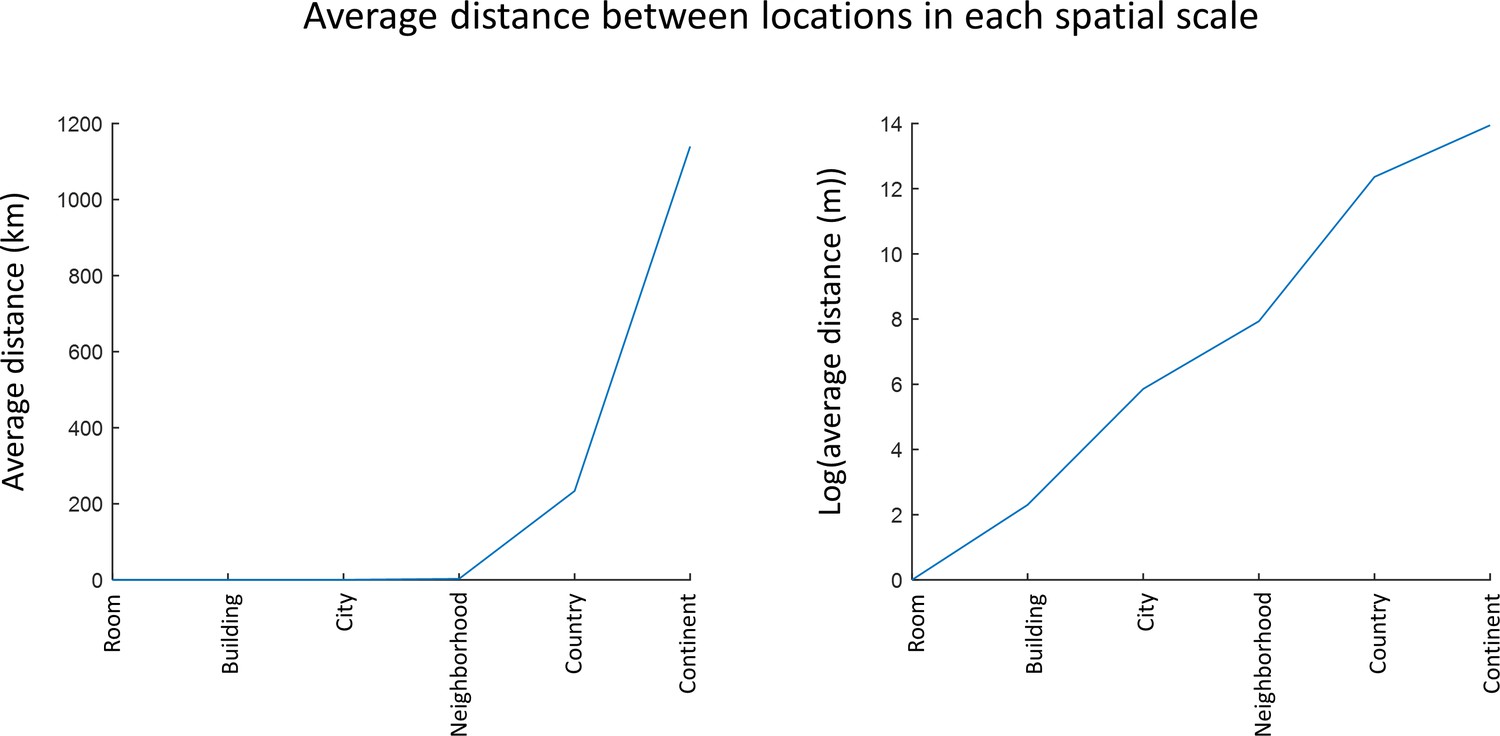
increase in size of spatial scales.
The latitude and longitude coordinates of subjects’ provided stimuli were identified, and the distances between all stimuli pairs were calculated. Distances of 1 m between objects in a room and 10 m between objects in a building were assumed. The distances can be seen to reflect an approximately logarithmic increase between the scales.
Figure 1—figure supplement 2

Behavioral results.
Subjects ratings of emotional valence (A), difficulty (B), familiarity (C) and use of first or third person perspective (E) for each location used in the experiment, and average subjects response times (seconds) in each condition (D). Error bars represent standard errors across subjects. Asterisks represent significant differences between scales (p<0.01, one-way ANOVA, Tukey-Kramer post-hoc test).
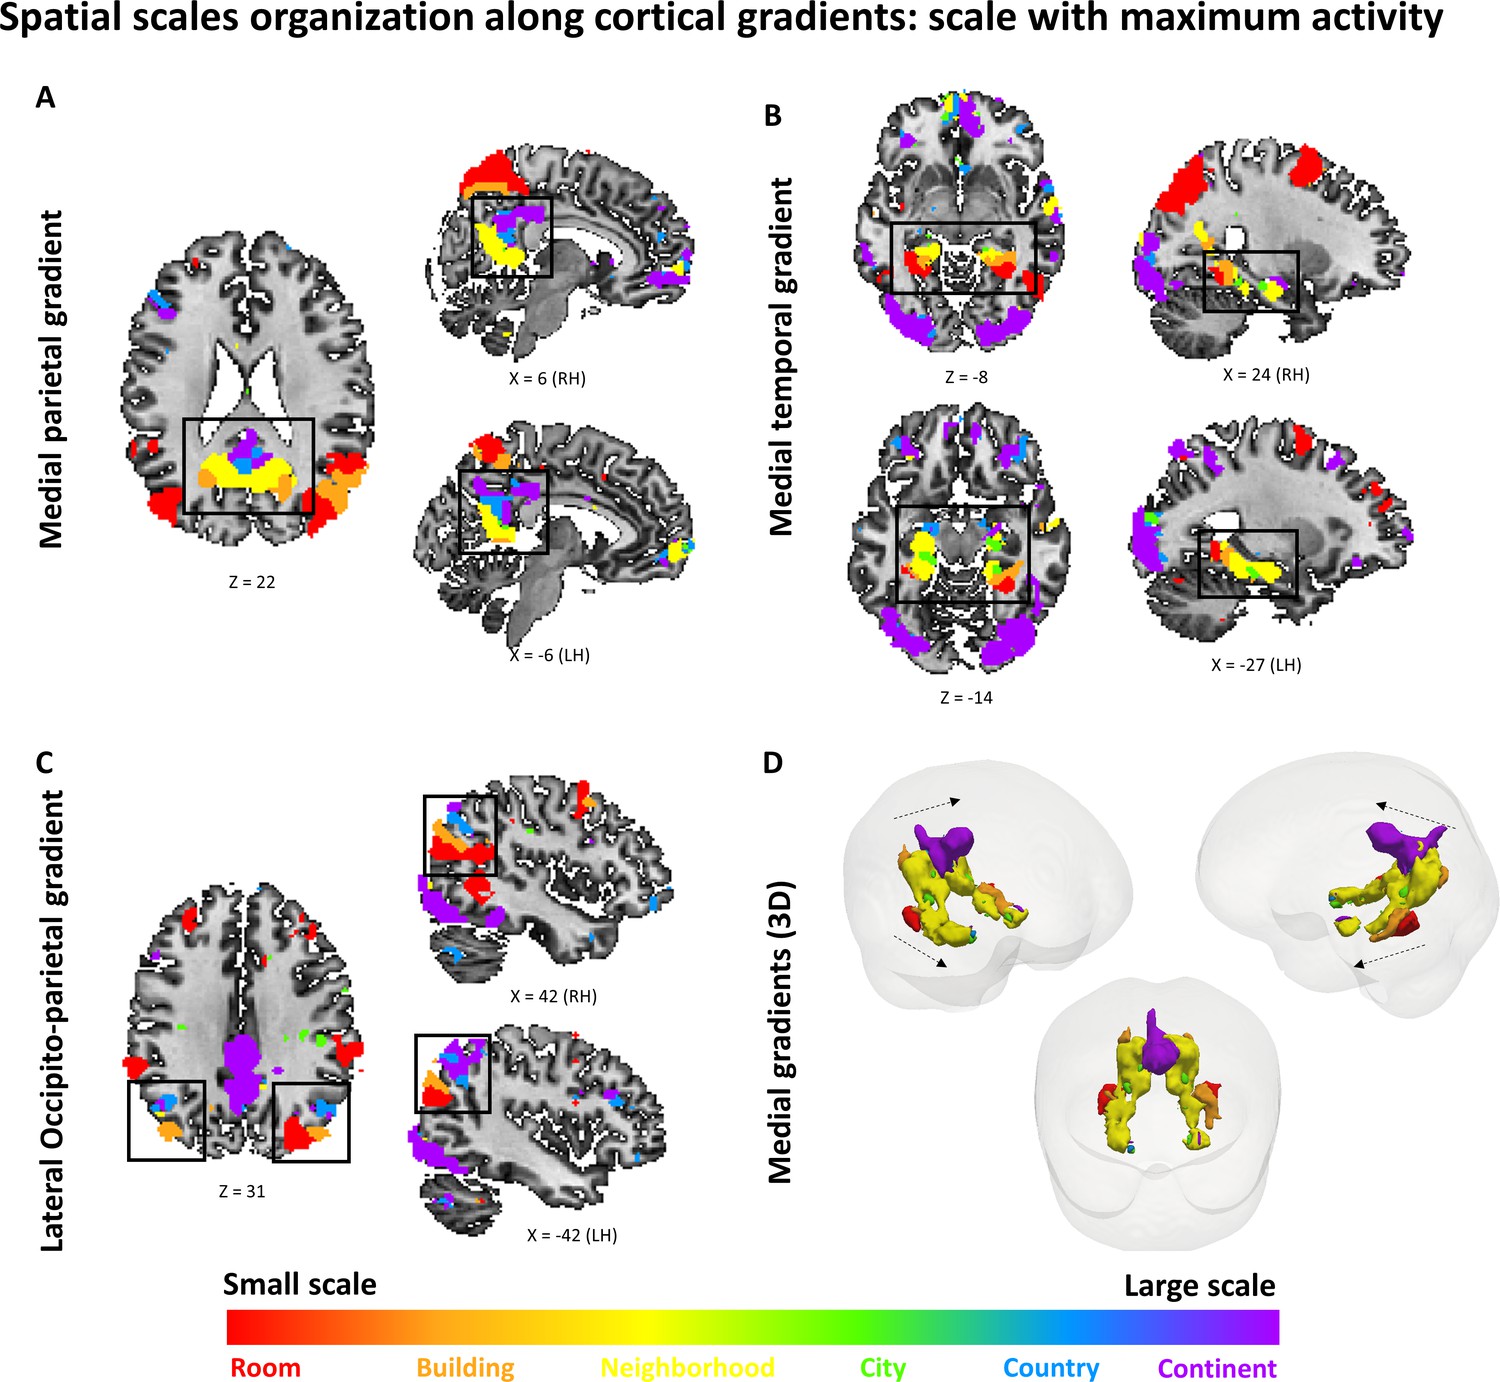
Figure 2 with 5 supplements
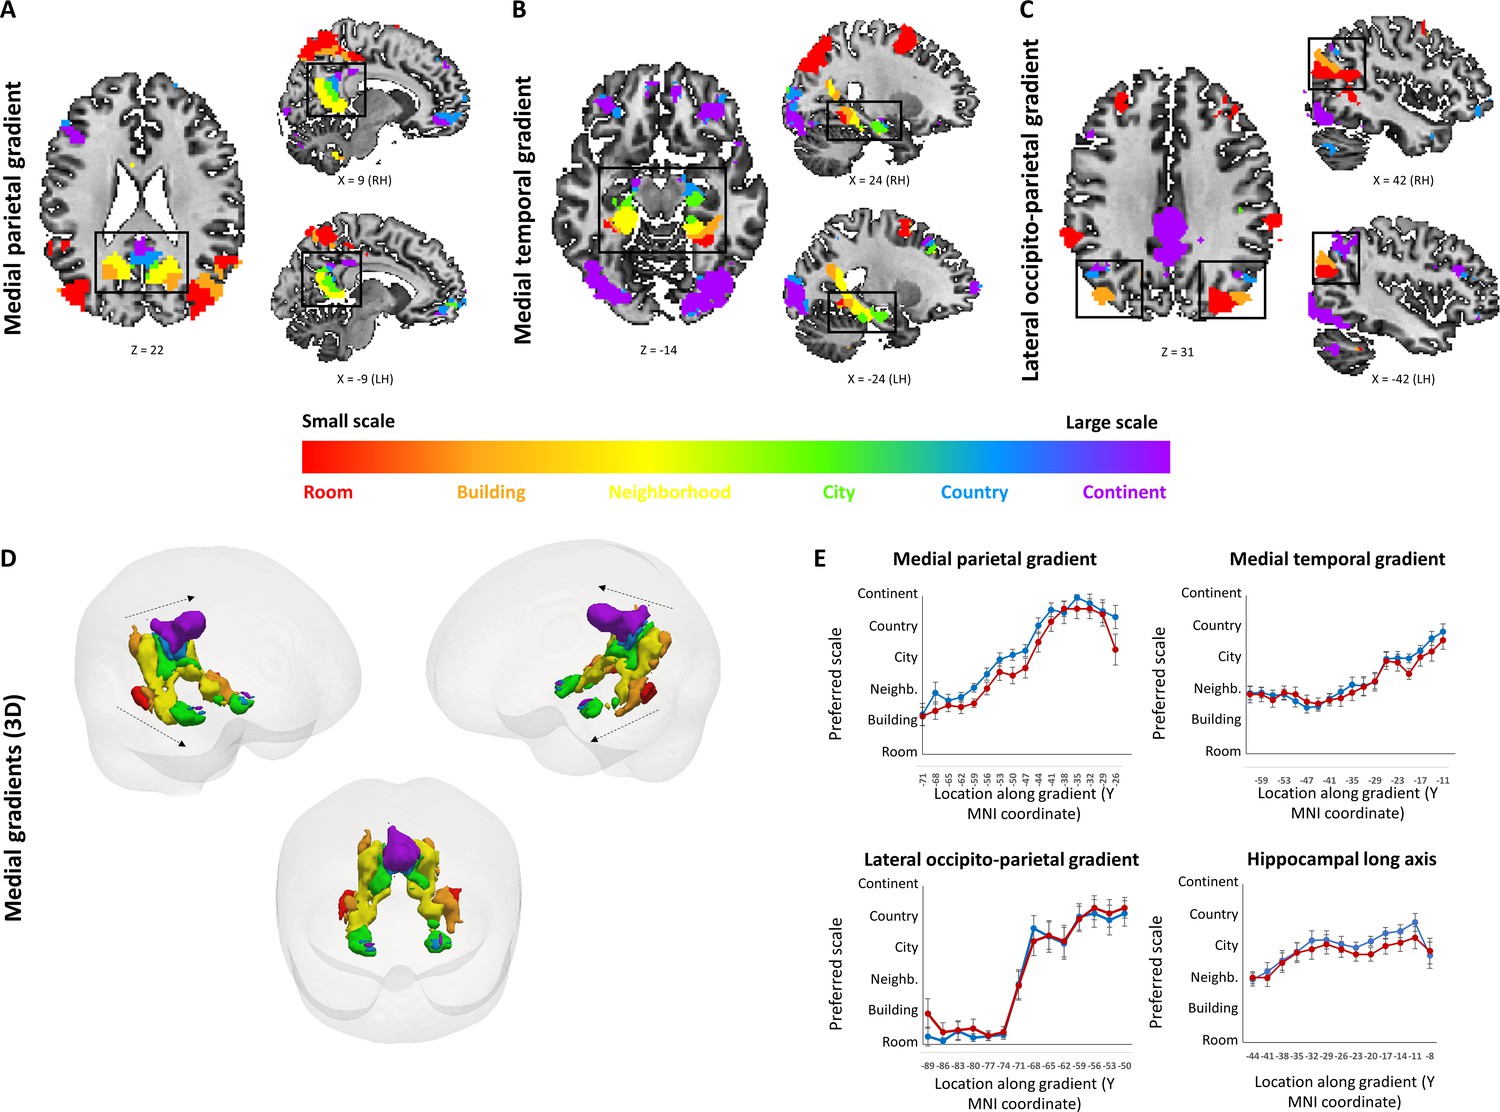
Small to large spatial scales preferentially activate regions along continuous posterior-anterior gradients.
Three cortical gradients were observed demonstrating a continuous shift in spatial scale selectivity. Within each gradient, posterior regions were selectively active for smaller spatial scales, and anterior ones for larger spatial scales. Colors indicate Gaussian fit peak scale position (voxels identified by ANOVA across beta values, p<0.01, FDR-corrected for multiple comparisons, minimum r2 of fit = 0.7). (A) Medial parietal gradient, (B) Medial temporal gradient, (C) lateral occipito-parietal gradient. (D) 3D visualization of the two medial gradients (gradients marked by dashed arrows, other activations not shown). (E) change in average spatial scale selectivity along the posterior-anterior axis of each gradient and along the hippocampal long axis (X axis represents MNI coordinates from posterior to anterior, blue – average position of a Gaussian fit peak for all scale-sensitive voxels at each coordinate, red – average position of scale with maximum activity for all scale-sensitive voxels at each coordinate). RH – right hemisphere, LH – left hemisphere. Full volume maps of these results are available online at https://github.com/CompuNeuroPsychiatryLabEinKerem/publications_data/tree/master/spatial_scales (Peer et al., 2019, copy archived at https://github.com/elifesciences-publications/publications_data).
Figure 2—figure supplement 1
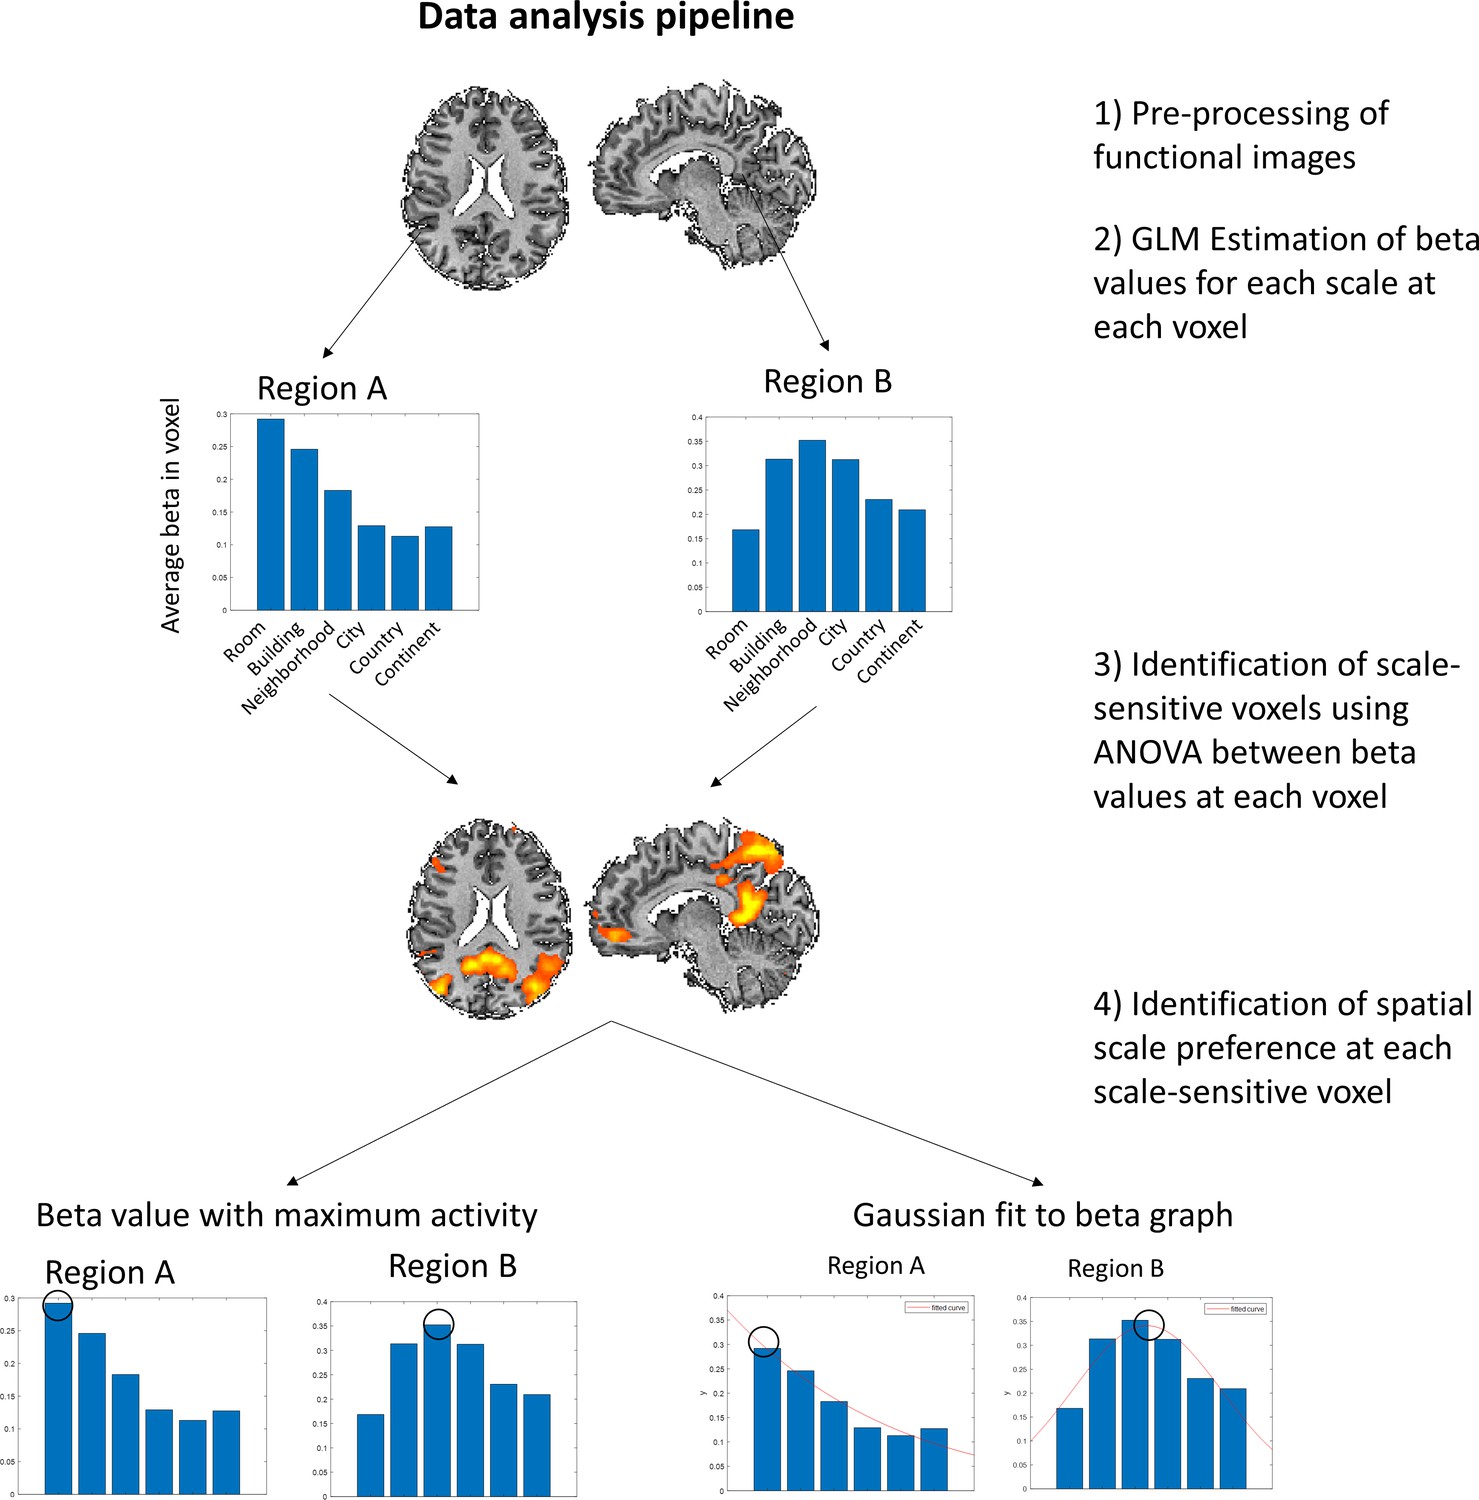
Main data analysis pipeline.
(A) The structure of each block of the task. Subjects are presented with a target stimulus, to which they have to compare four pairs of stimuli. (B) The data analysis pipeline. After pre-processing of the functional data, a GLM was fitted at each voxel with predictors for each spatial scale. ANOVA analysis was then applied on the resulting beta values to identify voxels with scale-selective activity. Finally, the scale with maximal response has been chosen for each scale-sensitive voxel. Additionally, a Gaussian function was fitted to the beta graph at each voxel, and its peak was selected as the voxel’s preferred scale, to identify selectivity when considering the overall pattern of activity across all scales.
Figure 2—figure supplement 2

Volume view of all scene-selective activations.
Colors represent the spatial scale at the position of Gaussian fit peak.
Figure 2—figure supplement 3
Gradients of spatial scale selectivity – scale with highest activity (beta value) at each voxel.
Colors correspond to the scale with the highest beta value at each voxel. The posterior-anterior organization of spatial scales along the three gradients is observed here, although the regions with preference to the city and country scales are much less prevalent. Scale-sensitive voxels identified by ANOVA across subjects on the beta values for scale-specific regressors (p<0.01, FDR-corrected), with preferred scale determined by the maximal beta value at each voxel. (A) medial parietal gradient, (B) medial temporal gradient, (C) lateral occipito-parietal gradient, (D) 3D visualization of the two medial gradients (gradients marked by dashed arrows, other activations not shown). RH – right hemisphere, LH – left hemisphere. Full volume maps of these results are available online at https://github.com/CompuNeuroPsychiatryLabEinKerem/publications_data/tree/master/spatial_scales (Peer et al., 2019, copy archived at https://github.com/elifesciences-publications/publications_data).
Figure 2—figure supplement 4
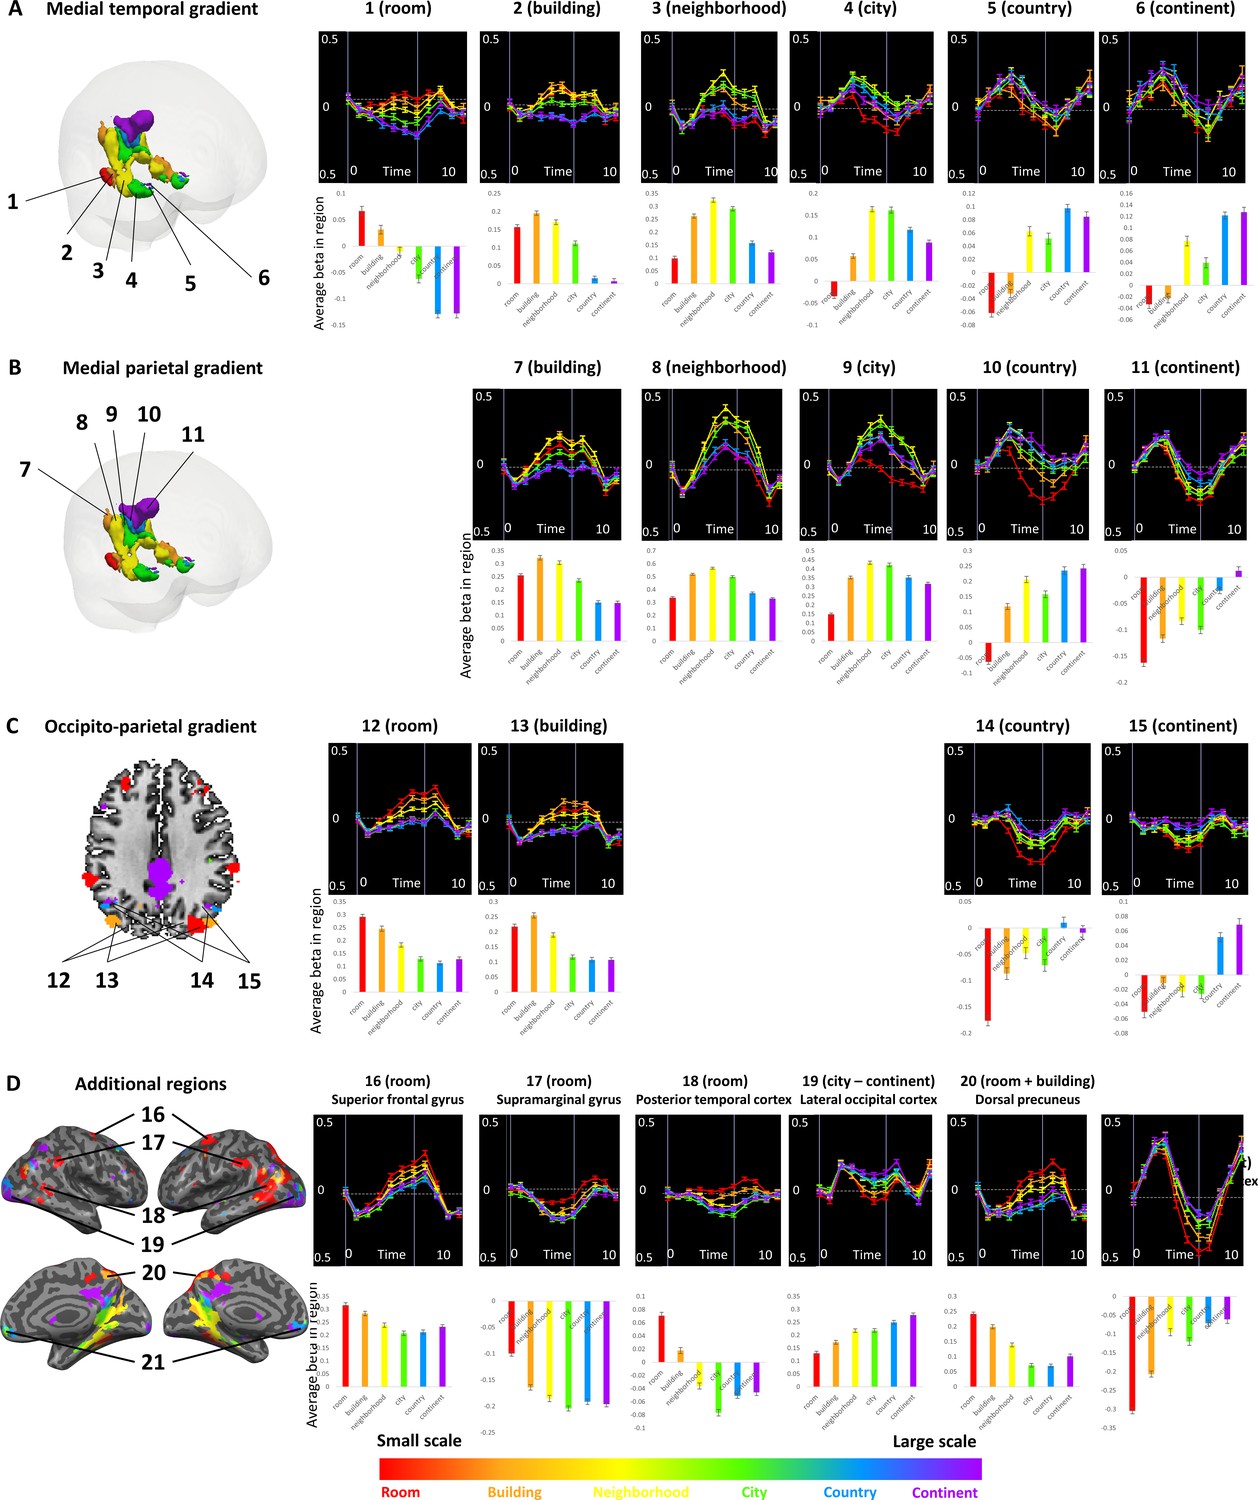
Activity profiles for spatial scale-sensitive regions.
For each region with a specific scale sensitivity, the activity profile (averaged across subjects) is presented, where 0 indicates the beginning of the experimental block. Below each graph the fitted GLM beta values for scale-specific regressors are presented. Error bars represent standard error across subjects. (A) medial temporal gradient, (B) medial parietal gradient, (C) lateral occipito-parietal gradient, (D) additional regions of interest.
Figure 2—figure supplement 5

Effects of different potential contributing factors.
Subjects ratings of each location and scale were used to create parametrically modulated regressors, to investigate the possible contribution of these factors to the spatial scales effect.
Figure 3
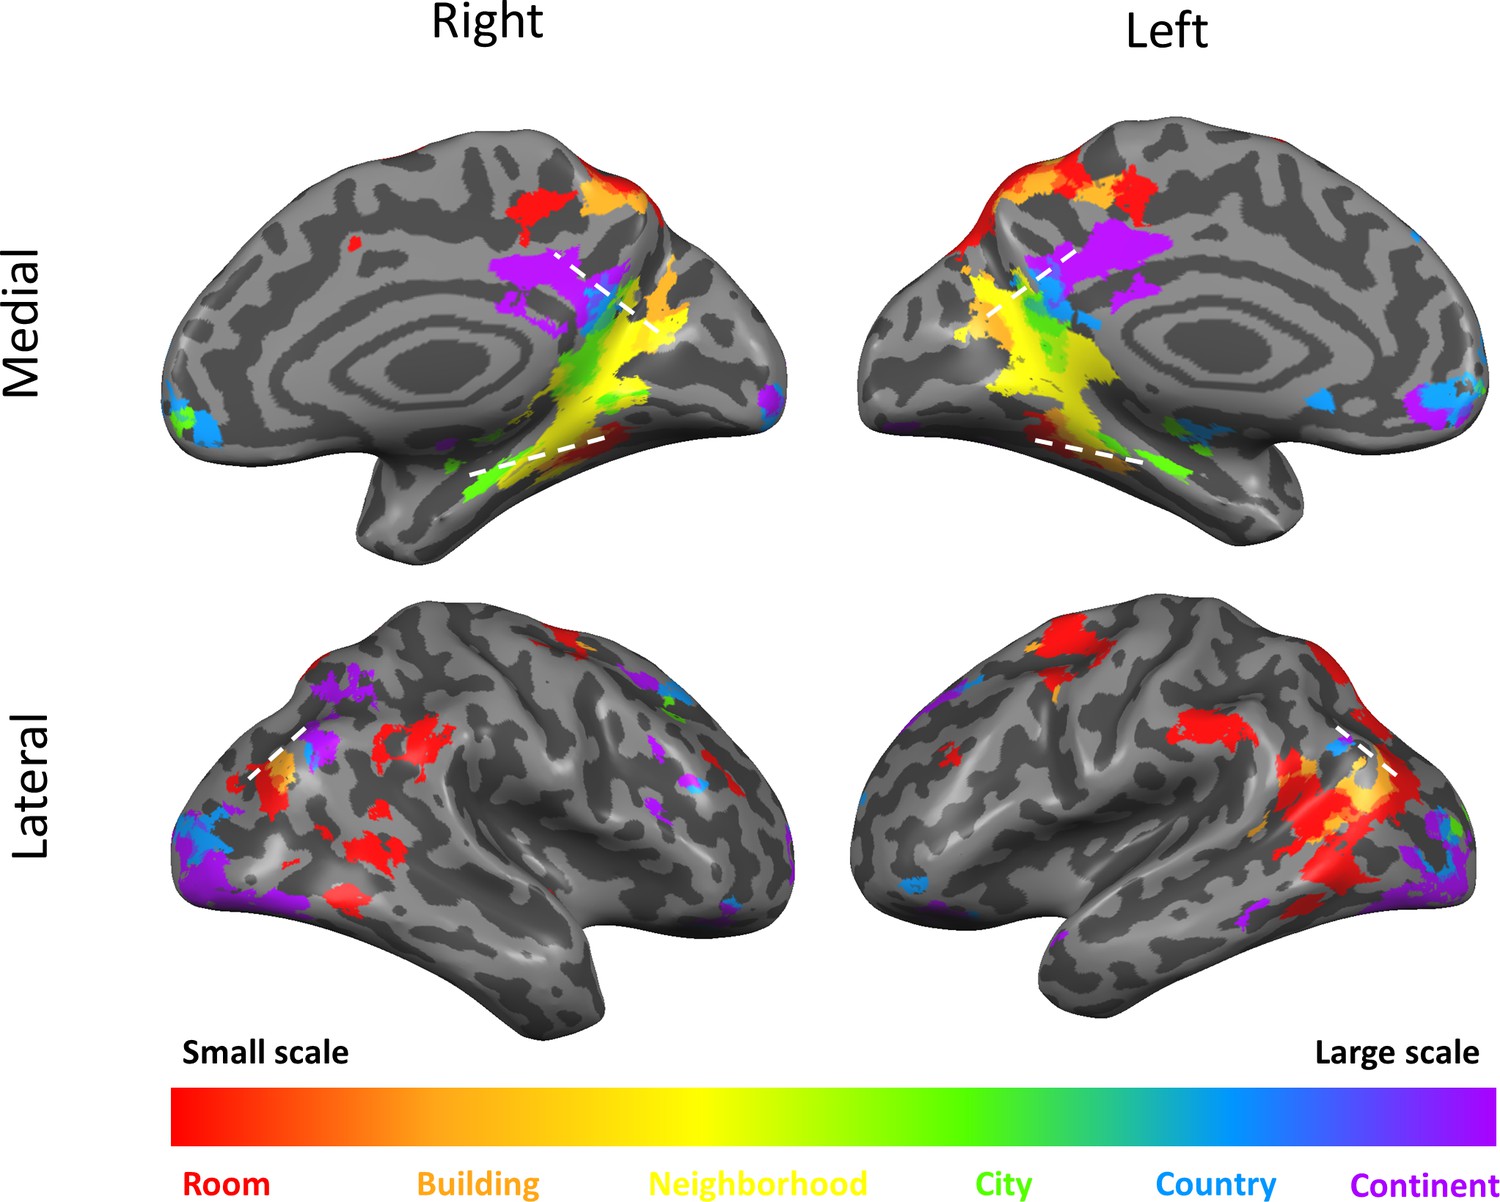
Scale-selective activity along gradients and additional cortical regions.
Surface view of all scale-selective cortical activations (including regions outside of the three gradients; voxels identified by ANOVA across beta values, p<0.01, FDR-corrected for multiple comparisons, minimum r2 of fit = 0.7, cluster threshold = 15 mm2). Continuous scale-sensitive gradients are marked by white dashed lines. Full volume maps of these results are available online at https://github.com/CompuNeuroPsychiatryLabEinKerem/publications_data/tree/master/spatial_scales (Peer et al., 2019, copy archived at https://github.com/elifesciences-publications/publications_data).
Figure 4
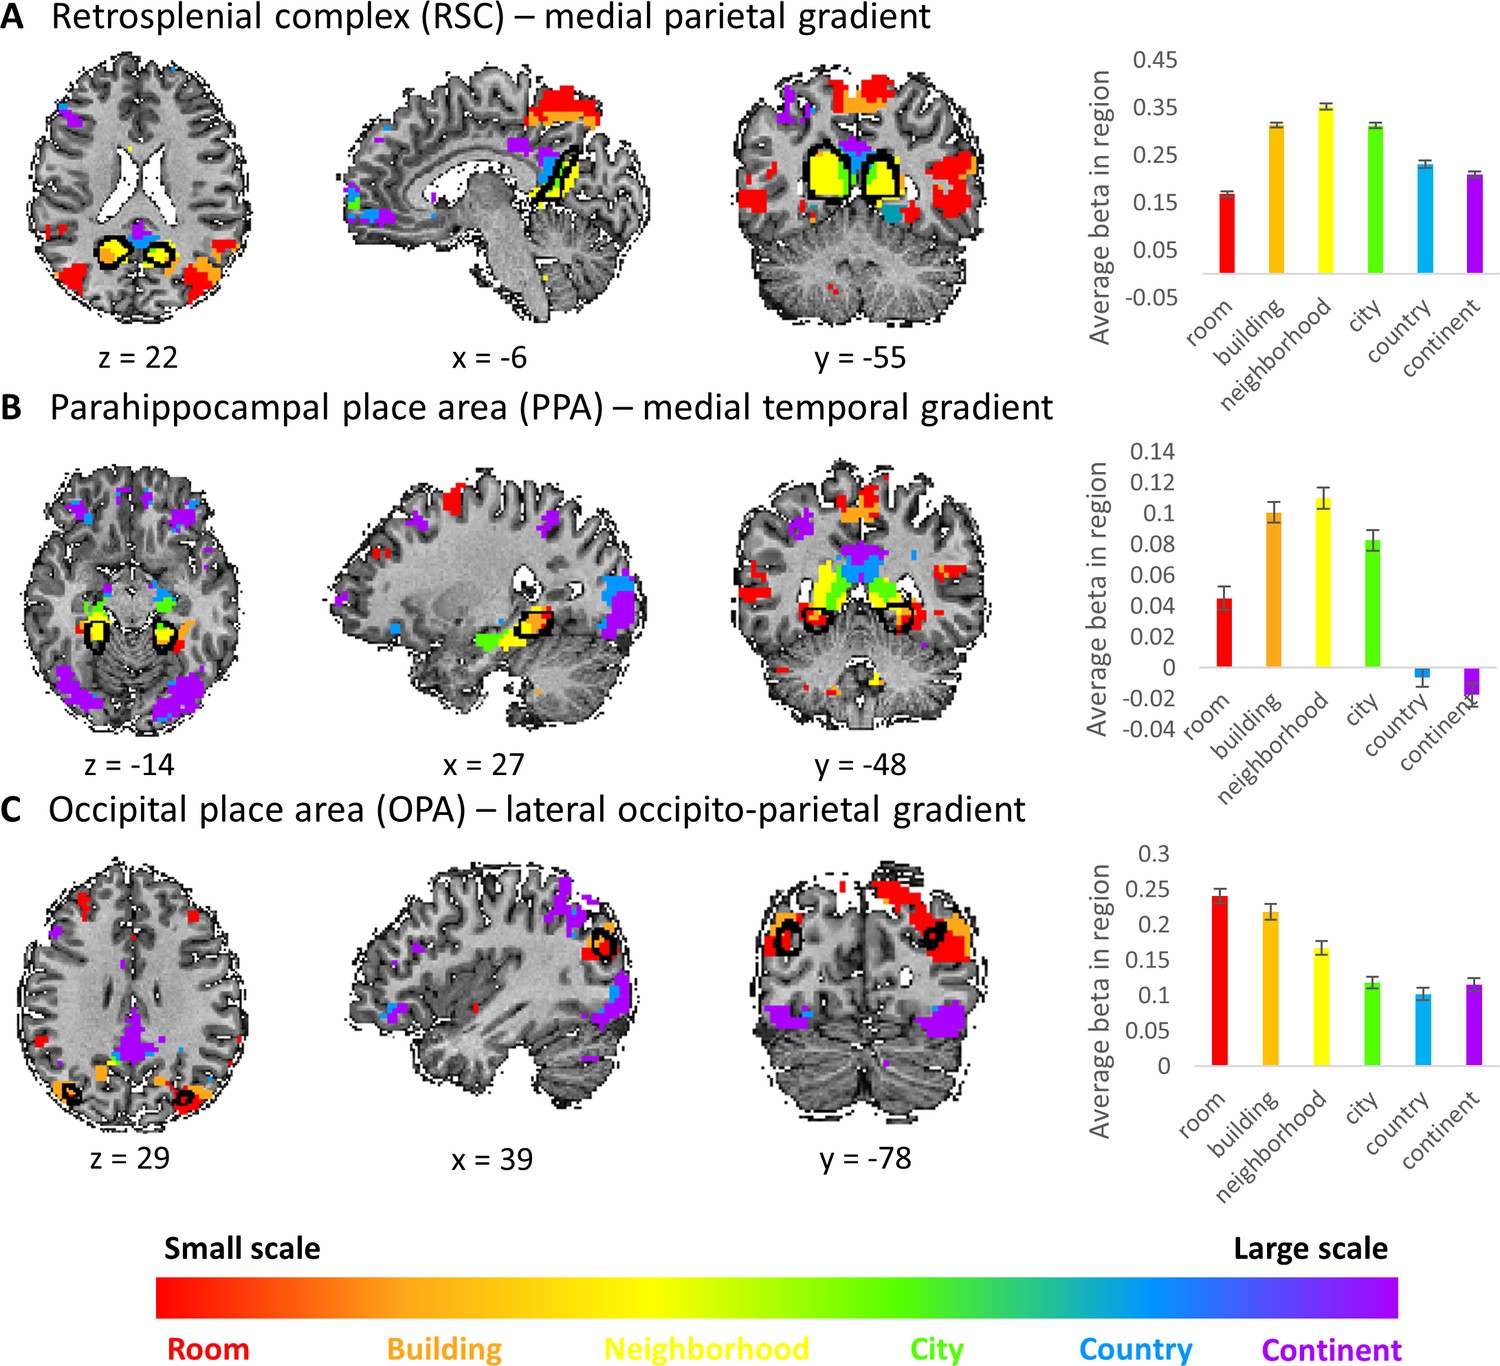
Visual scene-responsive cortical regions (PPA, RSC and OPA) are preferentially active for small to medium spatial scales.
Scene-responsive cortical regions (marked by a black outline) were defined using publicly available dataset by responses to a places > objects contrast in a separate subject sample (Julian et al., 2012). (A) retrosplenial complex (RSC), (B) parahippocampal place area (PPA), (C) occipital place area (OPA). Left – overlap of scene-responsive regions and the three scale-sensitive gradients. Right– average beta weights for each condition (scale) within each region of interest (error bars represent standard errors across subjects). The visual scene-responsive regions are situated at the posterior part of the three gradients, and are therefore mostly active during processing of small to medium scale environments.
Figure 5 with 1 supplement

The three scale-selective cortical gradients have different voxel distributions, demonstrating preference for processing different spatial scales.
The position of the Gaussian fit peak was used to identify voxels responsive to each scale. Voxel numbers are described within each gradient. Results indicate that the medial parietal gradient mostly represents scales at the neighborhood level and larger, the medial temporal gradient mostly represents environment up to the neighborhood-sized scales and has only small portions dedicated to larger scales, and the lateral occipito-parietal gradient is highly active both for the smallest scales and the largest ones.
Figure 5—figure supplement 1

Scale-selective voxel distributions within the three gradients.
The scale with the highest activity was used to identify voxels responsive to each scale. Voxel numbers are described within each gradient. Results indicate that most voxels in the medial parietal gradient have the highest activity for the neighborhood or continent scales, most voxels in the medial temporal gradient are active for scales up to city with the largest number active for the neighborhood scale, and the lateral occipito-parietal cortex is highly active for the two smallest and two largest scales.
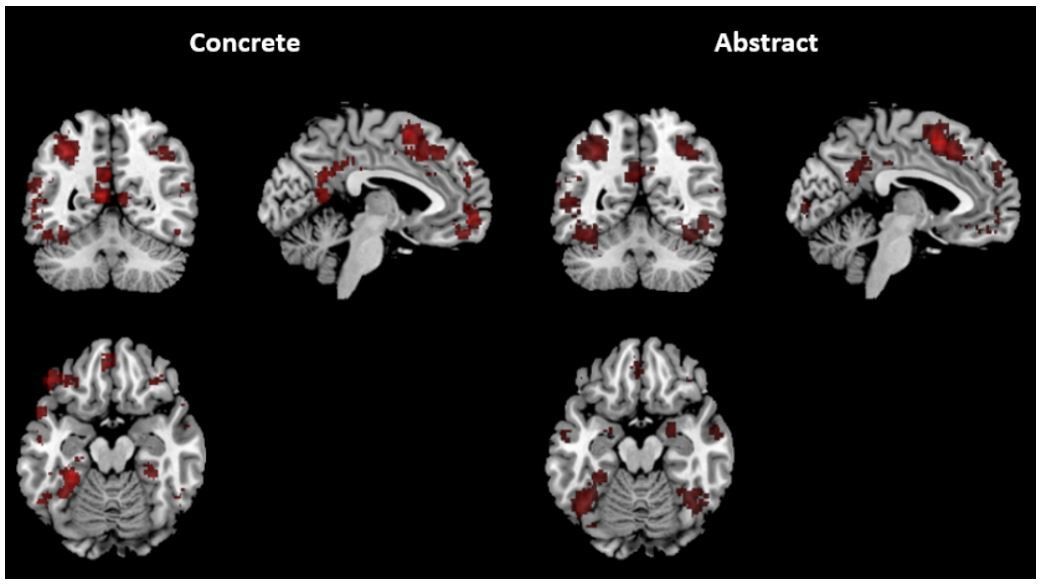
Author response image 1
Tables
Author response table 1
Neurosynth results – overlap of the “concrete” and “abstract” maps with each scale-specific gradient part.
https://doi.org/10.7554/eLife.47492.019| Room | Building | Neighborhood | City | Country | Continent | |
|---|---|---|---|---|---|---|
| Parahippocampal gradient | ||||||
| Concrete | 5.9% | 20% | 9.9% | 5.2% | 0% | 0% |
| Abstract | 10% | 16.8% | 1.8% | 0% | 1.8% | 0% |
| Retrosplenial gradient | ||||||
| Concrete | 0% | 0% | 18% | 31.6% | 27.5% | 15.3% |
| Abstract | 0% | 0% | 2% | 4.4% | 19% | 16.1% |
| Occipito-parietal gradient | ||||||
| Concrete | 4.8% | 16.9% | 0% | 0% | 27.9% | 23.6% |
| Abstract | 16.2% | 13.7% | 0% | 0% | 23.3% | 39.7% |
Additional files
-
Supplementary file 1
Supplementary tables.
Table S1: coordinates of all scene-sensitive activations, sorted by the spatial scale at the position of the Gaussian fit peak. Table S2: relation of cortical gradients to large-scale resting-state brain systems. Table S3: verbal descriptions of strategy used in task performance for each spatial scale.
- https://doi.org/10.7554/eLife.47492.015
-
Transparent reporting form
- https://doi.org/10.7554/eLife.47492.016
Download links
A two-part list of links to download the article, or parts of the article, in various formats.
Downloads (link to download the article as PDF)
Open citations (links to open the citations from this article in various online reference manager services)
Cite this article (links to download the citations from this article in formats compatible with various reference manager tools)
Processing of different spatial scales in the human brain
eLife 8:e47492.
https://doi.org/10.7554/eLife.47492


