Complementary encoding of priors in monkey frontoparietal network supports a dual process of decision-making
- German Primate Center - Leibniz Institute for Primate Research, Germany
- University of Göttingen, Germany
- Leibniz Science Campus Primate Cognition, Germany
- Bernstein Center for Computational Neuroscience, Germany
Figures
Figure 1

Rule-guided reach-selection task with trial-by-trial manipulation of action prior.
In each trial, the monkey reached from the center of the screen to one of four cardinal directions: up, down, left, or right. The peripheral reach goals were not directly indicated by visual target stimuli. Instead, monkey inferred two potential reach locations from a double-arrow pre-cue, either clockwise (cw) or counter-clockwise (ccw) from the location of the pre-cue. Trial-by-trial, we induced variable prior by assigning probabilistic information to the sizes of the pre-cue arrowheads. The arrowhead sizes announced the prior probability with which one of the two alternative rotation rules would later be instructed by the rule-cue. A reach to the goal associated with the instructed rule (color matching the corresponding arrowhead) was always rewarded, the non-instructed (non-matching color) never. A color-neutral (white) rule-cue indicated a free-choice trial, in which both potential motor goals were rewarded equally.
Figure 2
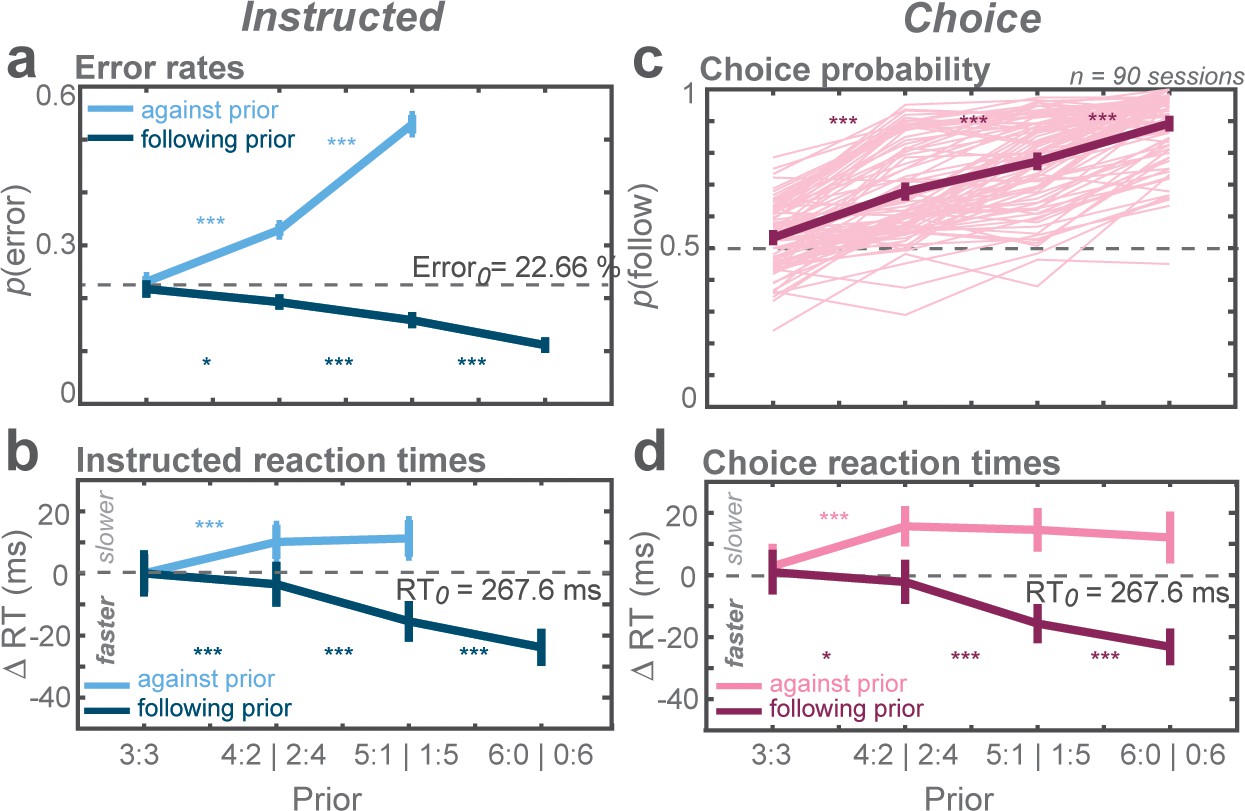
Biasing effects of action priors on the monkeys’ behavior.
(a) Average error rates, (b) average reaction time (RT) difference, both for trials instructing the monkey to reach the more (follow) and less (against) likely goal. Cw trials were arbitrarily defined as follow trials in the zero-prior condition. The dashed horizontal line indicates average value of both cw and ccw trials in the zero-prior instructed condition. (c) Average choice probabilities, (d) average choice RTs. Error bars depict standard errors across trials. Asterisks next to the curves indicate significant difference between neighboring data points (*p < αcorr at 5%, **p < αcorr at 1%, ***p < αcorr at 0.1%; Bonferroni-corrected t-test).
-
Figure 2—source data 1
Mean error rates, choice probabilities, and reaction times.
- https://doi.org/10.7554/eLife.47581.004
Figure 3 with 1 supplement
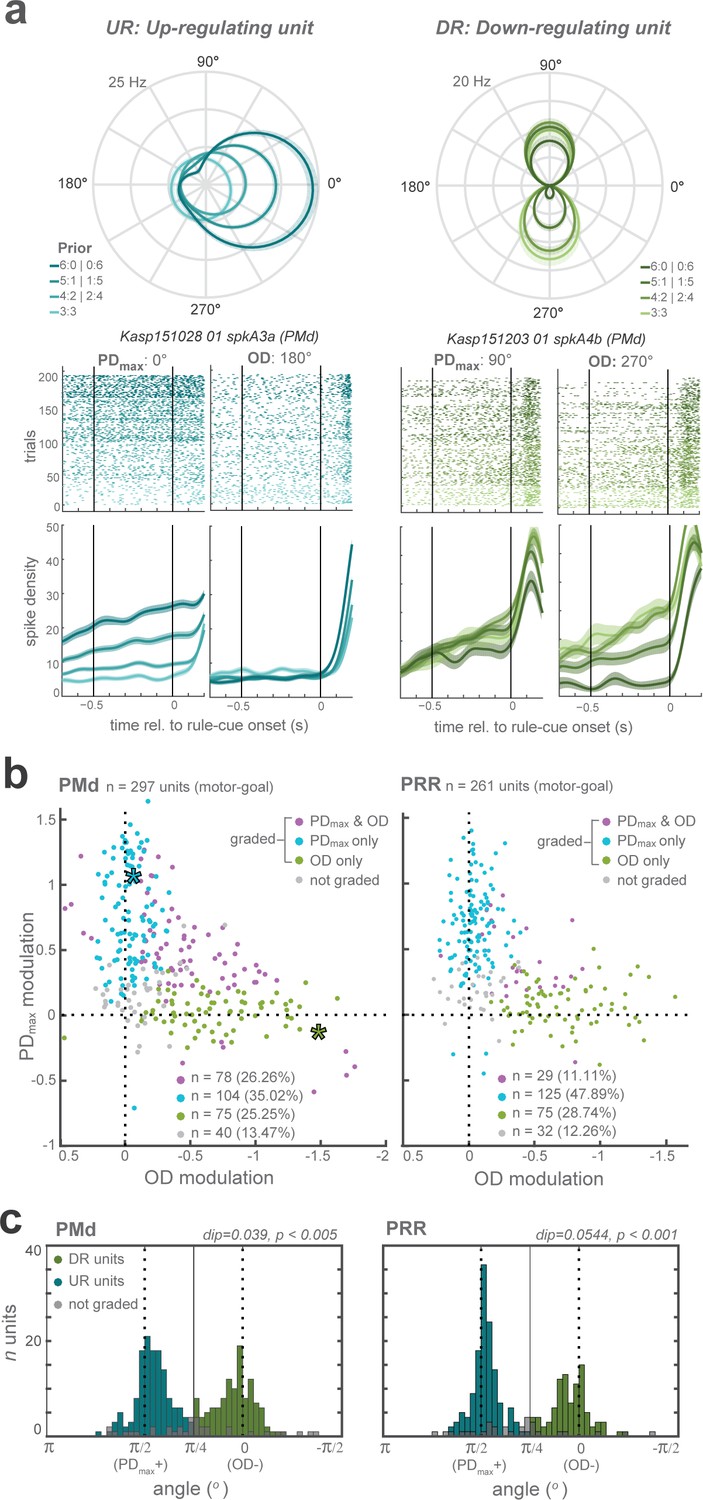
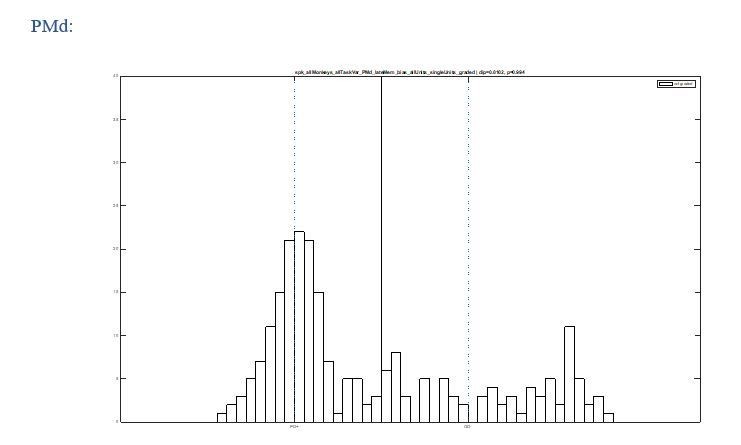
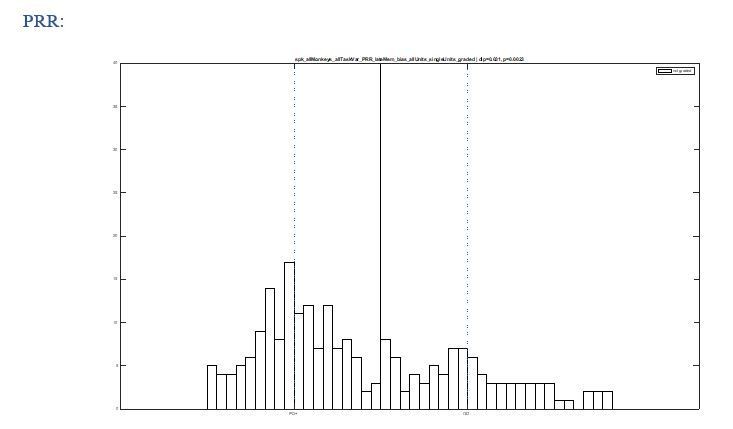
Distinct classes of prior-dependent graded modulation in single units.
(a) Examples neurons with graded modulation at the neuron’s maximum direction (PDmax; left panel) or opposite direction (OD; right), respectively. Polar plot tuning functions (top) and raster plots with averaged spike densities (bottom) of each unit are shown for each prior level as different shades. (b) Graded modulation is quantified as function of prior separately in the PDmax and the OD, and plotted against each other, for all PMd (left) and PRR (right) neurons. The upper-right quadrant reflects increasing activities (positive modulation) of PDmax responses and decreasing activities (negative modulation; inversed x-axis) of OD responses. Purple data points: neurons that showed significant modulation of both PDmax and OD activities as function of prior; blue: prior-dependent modulation of PDmax responses only; green: modulation of OD responses only; gray: no modulation. Asterisks indicate the example units shown in (a) (blue - left unit (PDmax-graded); green - right unit (OD-graded)). (c) The angular distribution of relative PD and OD modulation in all graded neurons in each area, with results of Hartigans’ dip test, indicating bimodality with a concentration of the modulation along the PDmax(+) and OD(-) axes. Two shades of colors signify our henceforth two categories of neurons, up-regulating (UR) and down-regulating (DR) neurons.
-
Figure 3—source data 1
Prior-modulation at PDmax and OD, along with relative modulation strength for each PMd and PRR units.
- https://doi.org/10.7554/eLife.47581.007
Figure 3—figure supplement 1
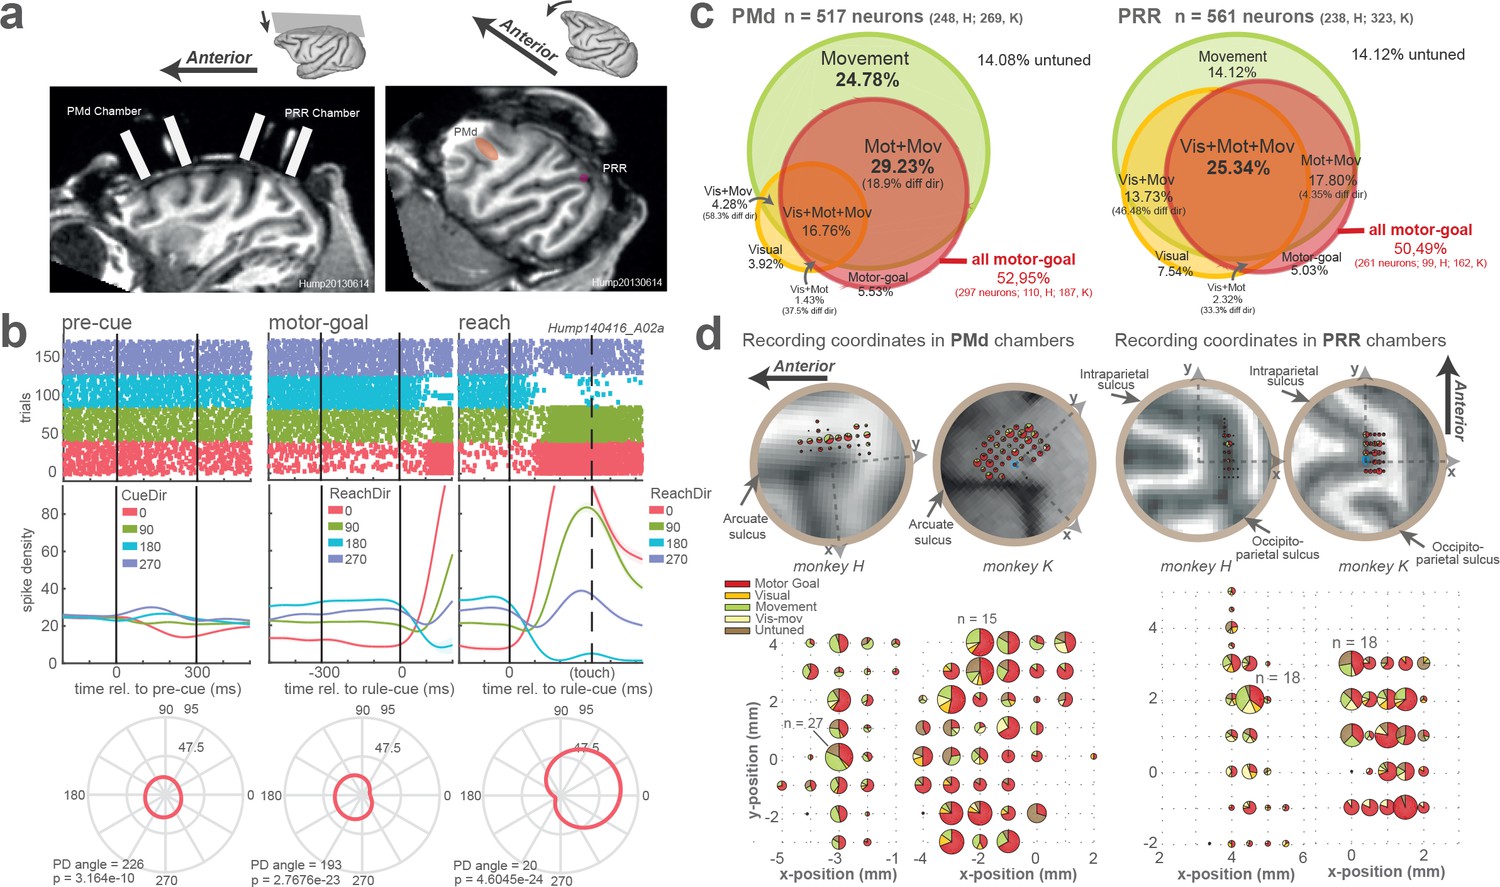
Chamber positions, recording coordinates, and neuronal directional selectivity.
(a) PMd and PRR chambers: rotated view of the monkey’s left side to see both chambers (left) and both areas (right) on the same plane. (b) Recording coordinates in PMd and PRR chambers. The area of each pie chart corresponds to the number of neurons of different response category at each coordinate. Note that the sizes of the pie charts are not comparable between areas; the biggest pie chart in PMd represents 23 cells vs. 32 cells in PRR. Motor Goal: all neurons that show motor-goal selectivity, Visual: visually tuned neurons (and not motor-goal tuned), Movement: peri-movement neurons (and not motor-goal tuned), Vis-mov: neurons showing visual and movement tuning but not tuned during planning period. (c) Neuronal categorization in PMd and PRR. Venn diagrams show percentage of neuronal response categories. Neuronal categorization revealed differences in frequency of different categories among neurons in both areas. For example, while ~50% of neurons in both areas were selective in the motor-goal period, a two-fold larger fraction in PRR (49%) than PMd (26%) also showed selectivity during visual cue presentation. (see further details in Neural data selection and direction selectivity).
Figure 4 with 3 supplements
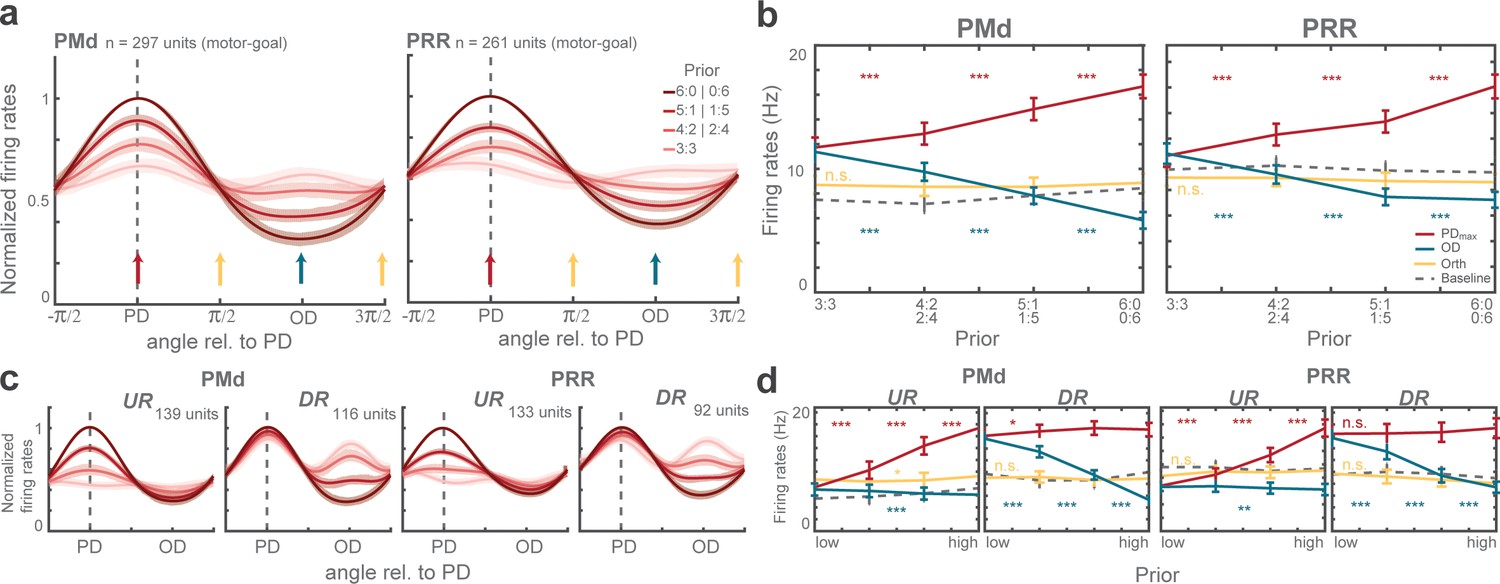
Population tuning functions and graded modulation of motor-goal activities.
(a) Average normalized tuning function. Shaded areas correspond to standard errors. Vertical arrows illustrate directions quantified in (b). (b) Comparison of (non-normalized) average firing rates at maximum direction (PDmax: red), opposite direction (OD: blue), orthogonal direction (Orth: yellow) during the planning period (300 ms before the rule-cue onset), and the baseline (gray dotted line) of all motor-goal tuned PMd (left) and PRR (right) neurons. Error bars depict standard errors (*p < αcorr at 5%, **p < αcorr at 1%, ***p < αcorr at 0.1%; Bonferroni-corrected t-test). Interpolated population tunings (a) were plotted for illustrative purposes, in which we refer to interpolated firing rates and PDs continuously between 0° and 360°. Statistical analyses are based on the original neuronal activities restricted to the four discrete directions (0°, 90°, 180°, 270°) which we had sampled in our task as shown in (b). The preferred direction of a neuron was then defined by the direction toward which the motor-goal evoked the maximum response, denoted PDmax. (c–d) Same as (a–b) for upregulating (UR) and downregulating (DR) neurons separately.
-
Figure 4—source data 1
Average firing rates at PDmax, OD, and Orth directions, along with interpolated tuning curve of each unit.
- https://doi.org/10.7554/eLife.47581.012
-
Figure 4—source data 2
Average firing rates at PDmax, OD, and Orth directions, along with interpolated tuning curve, separately for DR and UR neurons.
- https://doi.org/10.7554/eLife.47581.013
Figure 4—figure supplement 1
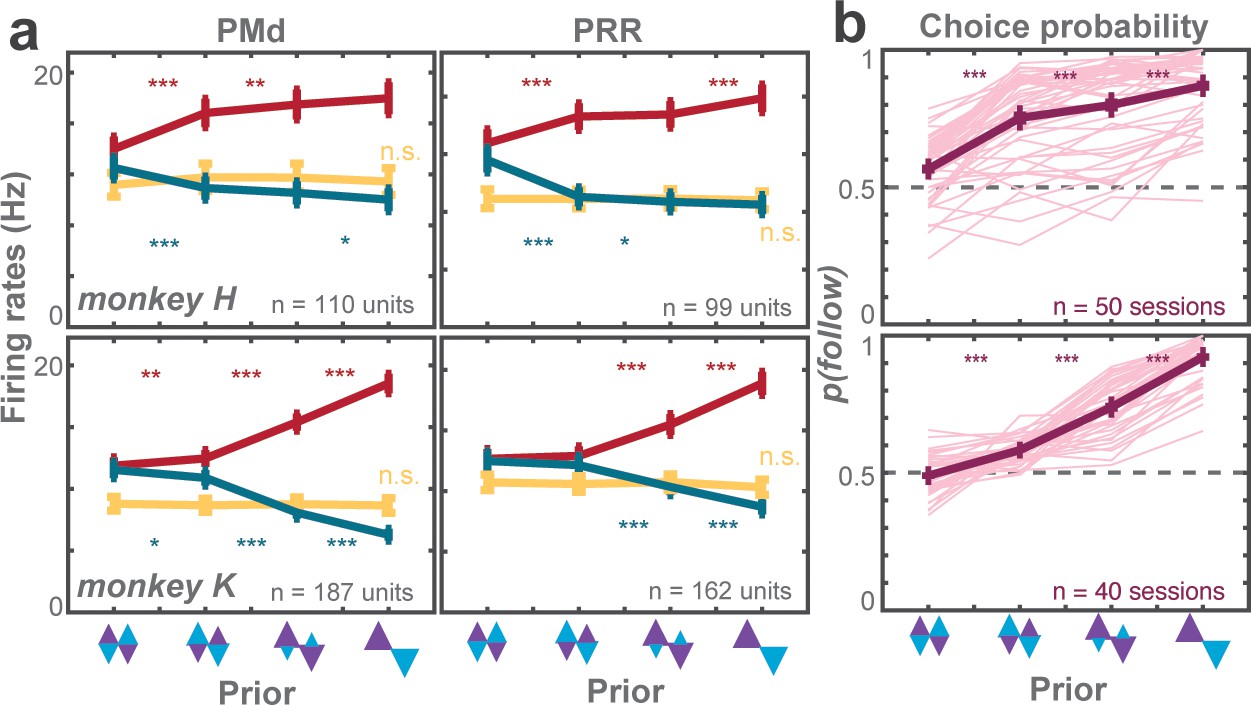
Planning-period activities reflect each monkey’s choice bias as function of action priors.
(a) Neuronal population responses in PMd (left) and PRR (right) for monkey H (top row) and K (bottom row) as function of action prior for different prior directions relative to the PD of the neurons (conventions as in Figure 4a & c). (b) Average choice probabilities of monkey H (top) and monkey K (bottom) as function of prior. Conventions for pairwise comparisons: *p < αcorr at 5%, **p < αcorr at 1%, ***p < αcorr at 0.1%; Bonferroni-corrected t-test.
Figure 4—figure supplement 2
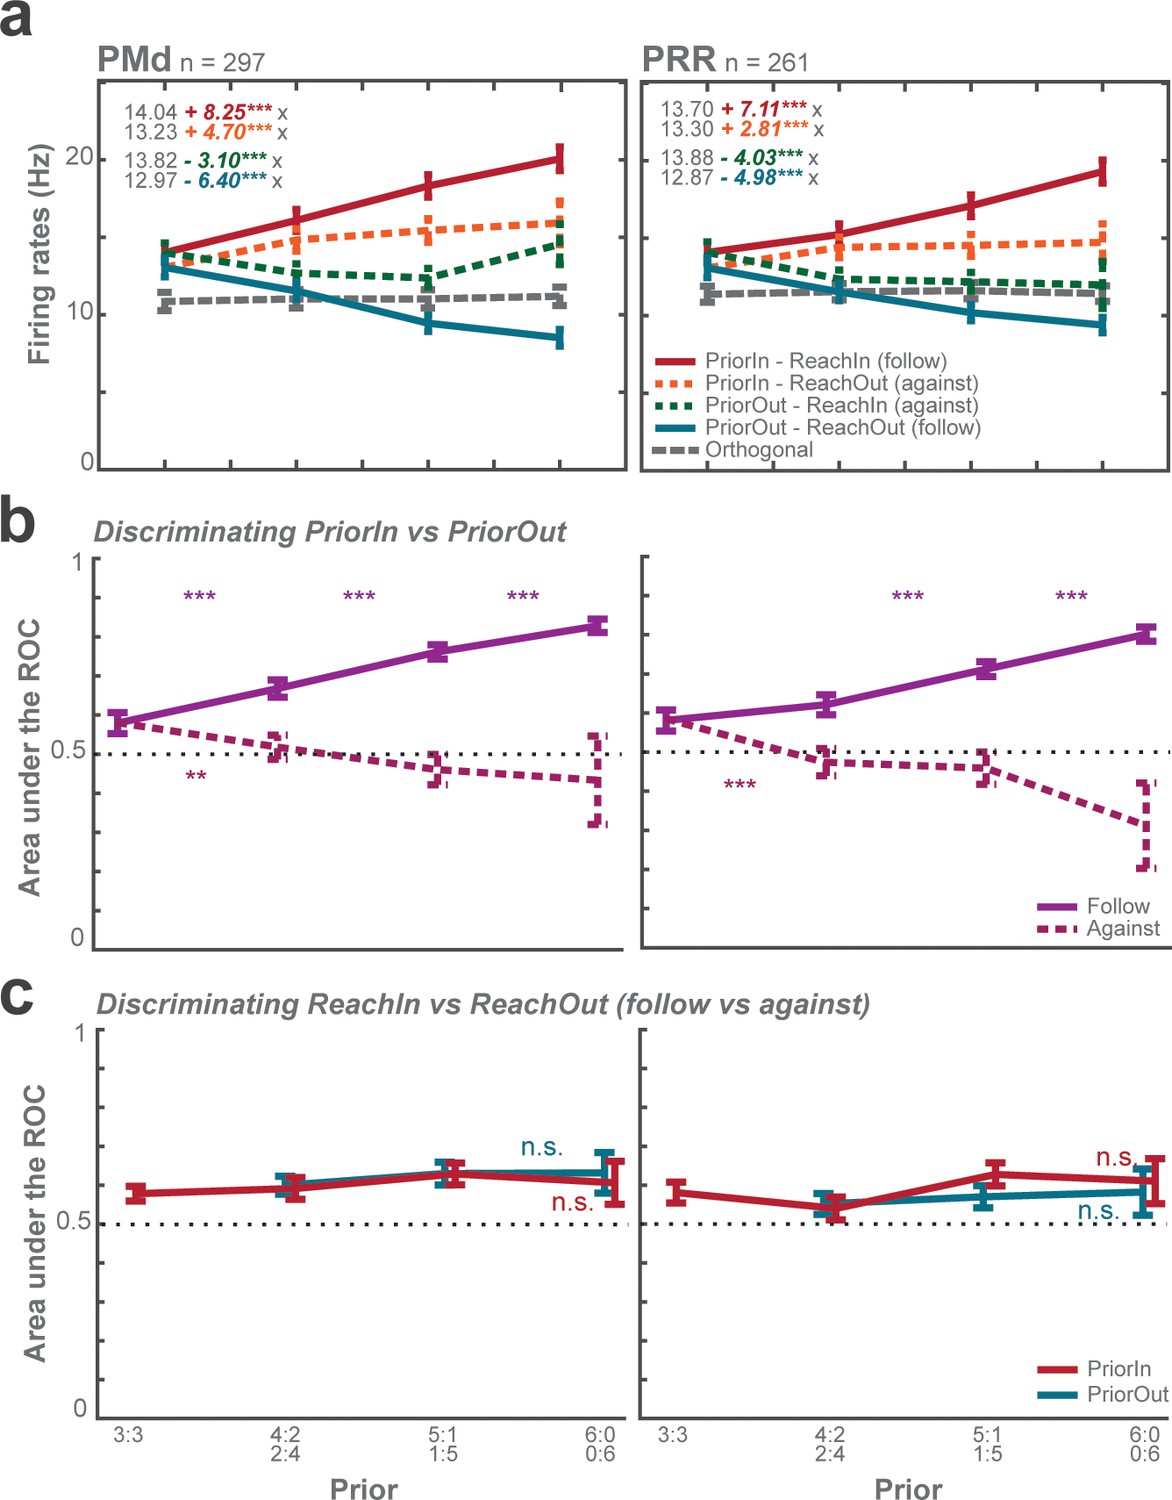
ROC analyses of choice predictive responses.
(a) Average firing rates as function of prior and sorted according to Prior-in vs. Prior-out and Reach-in vs. Reach-out show that prior direction rather than later reach choice determines the neuronal response most strongly. This panel also shows that against choices did not result from unambiguous against reach-goal encoding, but rather from neural stochasticity; individual trials in which the effect of prior was not sufficiently strong, probabilistic against choices occurred. Each panel displays fitted equation using GLMM. (b) Average area under the ROC curves discriminating Prior-in and Prior-out trials (between-condition ROC). The ROC discriminability is low in zero-prior conditions and increases with prior. (c) Average area under the ROC curves discriminating follow and against trials as function of prior (within-condition ROC). The average discriminability of later choice stagnated around 0.6 across prior levels with no significant biasing effect in either area. This means, neuronal fluctuations across trials with the same level of action priors were not predictive about later reach choice. Taken together, the choice predictive and ROC analyses confirm that the animals did not alternate over trials between two premature unambiguous reach plans. Error bars depict standard errors. Pairwise comparisons b-c: *p < αcorr at 5%, **p < αcorr at 1%, ***p < αcorr at 0.1%; Bonferroni-corrected t-test.
Figure 4—figure supplement 3
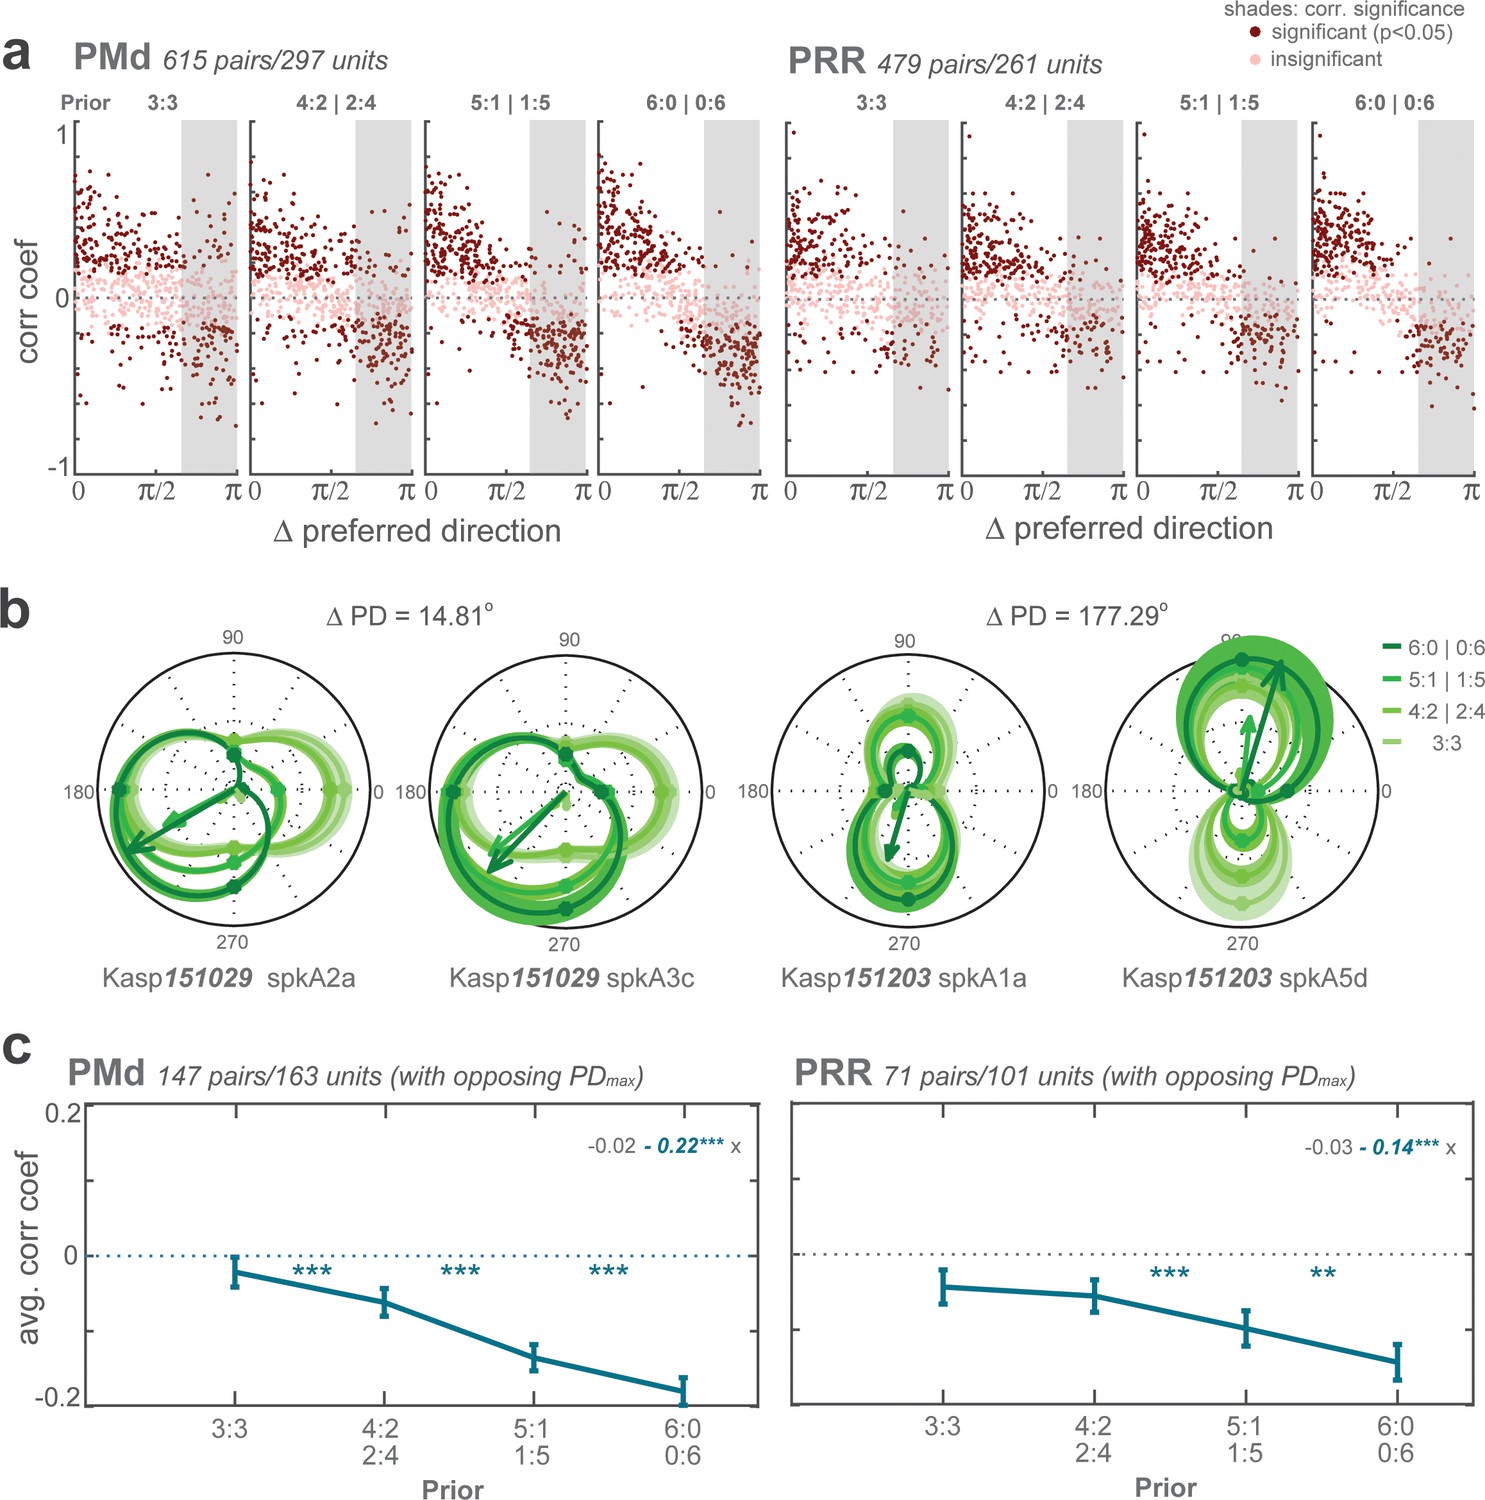
Neuronal co-activation analysis.
(a) Trial-by-trial signal correlation between each pair of PMd (left) and PRR (right) neurons recorded in the same experimental session, plotted against difference in PD of the two neurons. Each panel represents a different level of prior. Dark color points depict significantly positive or negative correlation. By definition, during unambiguous encoding of a single motor goal, neurons with similar PD have positive signal correlations, while neurons with opposite PD have negative signal correlations. In zero-prior condition, some neurons with large distance in PD (right half of each plot) showed positive signal correlation (dark red dots on the right half above the zero-line). Shaded areas emphasize neurons with large difference in PD that are expected to show correlation reversal from negative in full-prior conditions (6:0 and 0:6) to positive in zero-prior condition (3:3). (b) Example pairs of neurons with small (left) and large (right) difference in PD (low to high prior: light to dark traces). (c) Average signal correlation as function of prior. On average over all neurons, a significant decrease in signal correlation between opposing neurons with decreasing prior. PMd showed slightly stronger decrease than PRR. These results reject the idea of alternating early commitment to a motor-goal and instead support the idea of proper co-encoding of two potential motor goals during ambiguous planning. Each panel displays the results of a GLMM for each curve. Error bars show standard errors. Pairwise comparisons: *p < αcorr at 5%, **p < αcorr at 1%, ***p < αcorr at 0.1%; Bonferroni-corrected t-test.
Figure 5 with 1 supplement

Population average of spike density functions and analyses of selection-signal latencies.
(a) Average spike density functions are shown for different prior levels at maximum (PDmax: red), opposite (OD: green) and orthogonal directions (Orth: dotted gray). Orthogonal trials are only shown in zero-prior trials for better visibility). Gray-shaded areas indicate duration of pre-cue presentation in pre-cue epoch and rule-cue presentation in reach epoch. Small dots above the curves represent average reaction times (RTs) and horizontal bars represent standard errors in corresponding colors. For the reach epoch, only free-choice trials in which monkeys chose to follow the priors are illustrated. (b) Neural distances at different levels of prior aligned to rule-cue onset. RTs, maximal velocity times (MVTs), and plateau times (PTs) are shown above the curves. (c) Between-area comparisons of MVTs relative to rule-cue onset for DR and UR neurons. All prior conditions and both instructed (top) and free-choice (bottom) trials are shown. Solid lines indicate follow trials and dashed lines indicate against trials. RTs are also shown as gray lines. (d) Comparisons of MVTs. Zero-prior (3:3) and one high-prior (5:1) conditions, against and follow trials separately, are shown. Latency differences were tested between neuronal subclasses within each area (e.g. PMd-DR vs PMd-UR) and between areas only within the same neuronal subclasses (e.g. PMd-DR vs PRR-DR), depicted by horizontal gray and red lines above the bar plots (*p < α at 5%, **p < α at 1%, ***p < α at 0.1%; permutation test).
-
Figure 5—source data 1
Average spike densities functions of UR and DR neurons of PMd and PRR.
- https://doi.org/10.7554/eLife.47581.016
-
Figure 5—source data 2
Euclidean distances of UR and DR neurons of PMd and PRR.
- https://doi.org/10.7554/eLife.47581.017
-
Figure 5—source data 3
Selection-signal latencies (maximum velocity time: MTV and plateau time: PT) of UR and DR neurons of PMd and PRR.
- https://doi.org/10.7554/eLife.47581.018
Figure 5—figure supplement 1
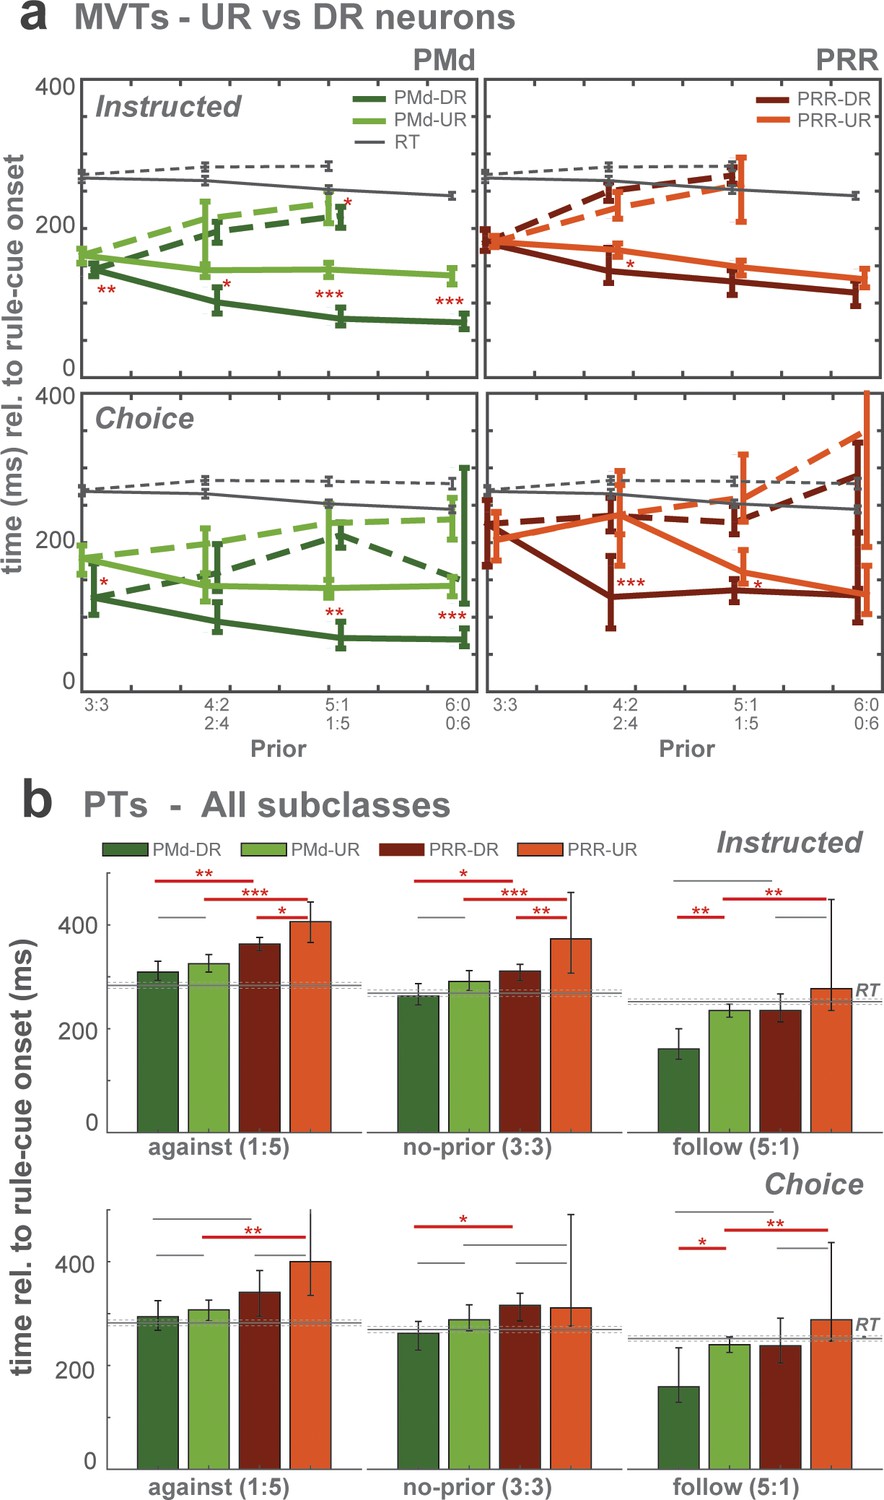
Selection-signal latencies between DR and UR neurons of PMd and PRR.
(a) Comparisons of MVTs between DR and UR neurons in PMd (left) and in PRR (right). Instructed trials are shown on the left column and choice trials on the right. Solid lines indicate follow trials and dashed lines indicate against trials. RTs are also shown with MVTs. (*p < α at 5%, **p < α at 1%, ***p < α at 0.1%; permutation test). (b) Comparisons of plateau times (PTs) of neural distances relative to rule-cue onset. Zero-prior (3:3) and one high-prior (5:1) conditions, against and follow trials separately, are shown. Latency differences were tested between neural subclasses within each area (e.g. PMd-DR vs PMd-UR) and between areas only within the same neural subclasses (e.g. PMd-DR vs PRR-DR), depicted by horizontal gray and red lines above the bar plots (*p < α at 5%, **p < α at 1%, ***p < α at 0.1%; permutation test).
Figure 6
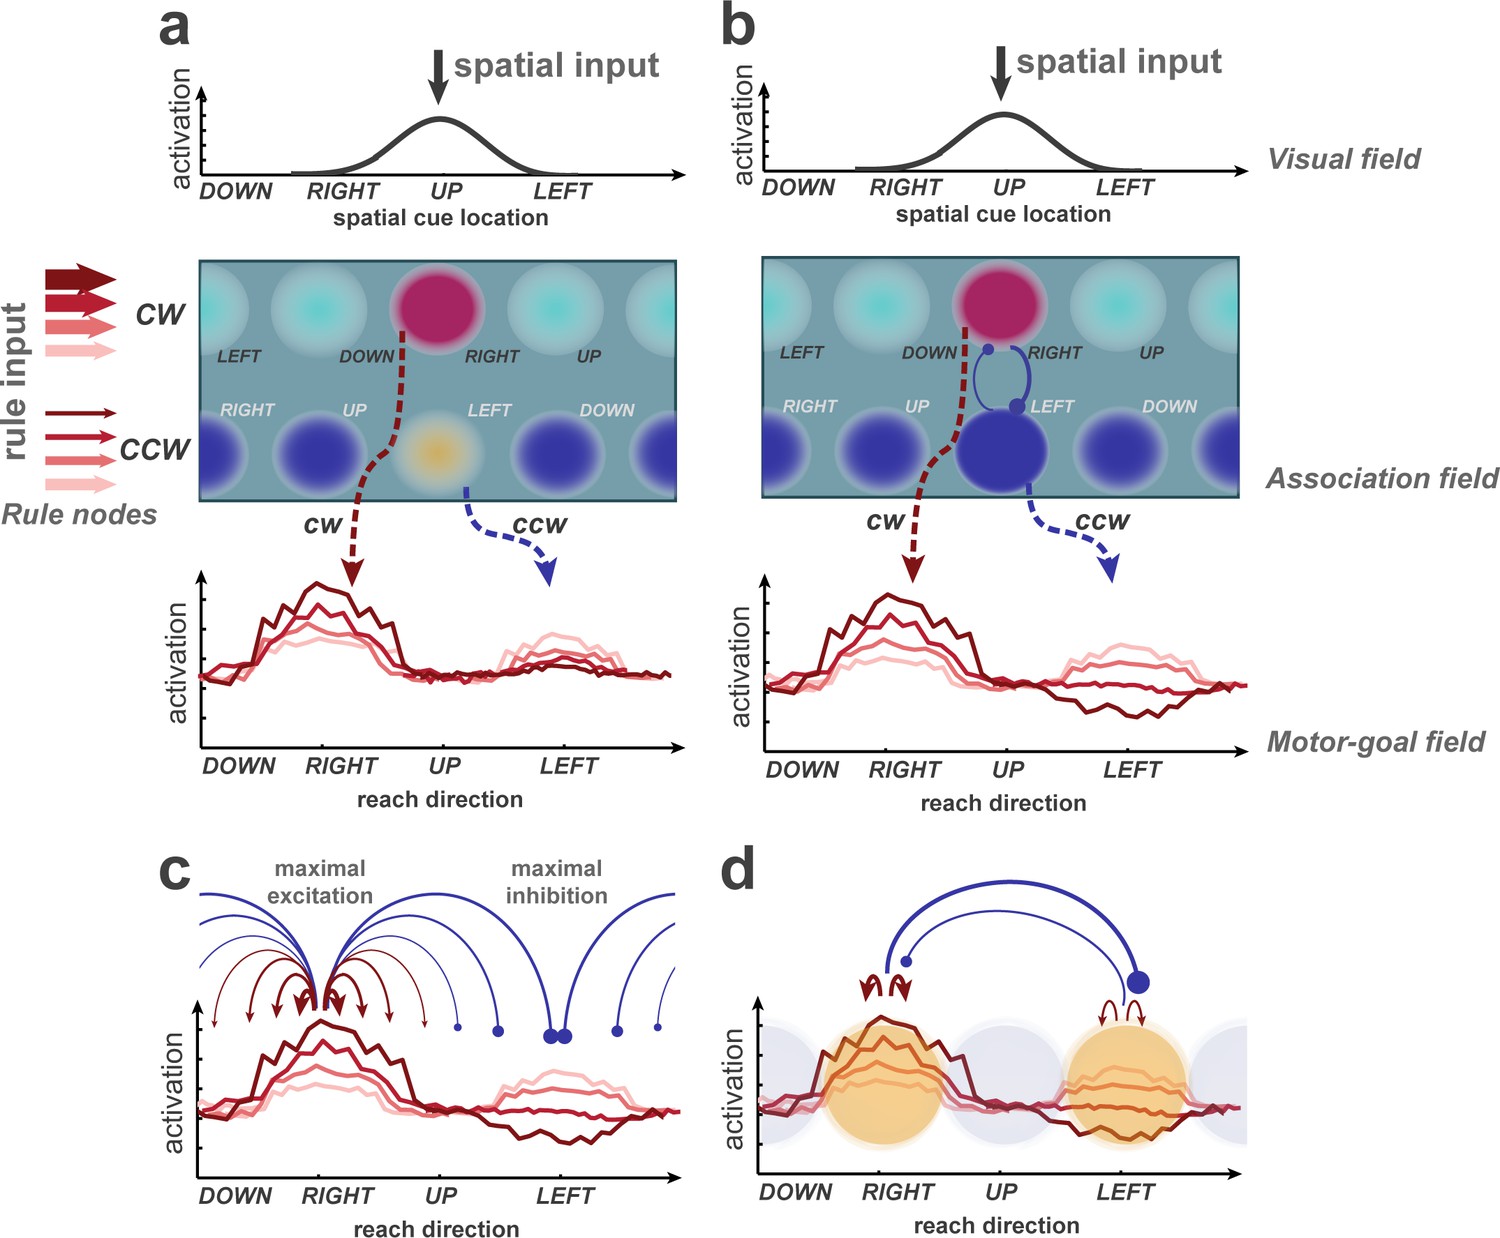
Potential explanations of selective inhibition, discussed on the basis of a learning dynamic neural field (DNF) model previously used to simulate rule-guided reach selection (Klaes et al., 2012).
It consists of an association field, linking visual and rule inputs, and projecting onto a motor-goal field. The visual and motor-goal fields are one-dimensional, covering the space of spatial cue/reach directions. The 2D association field (AF) receives input from the visual field and two rule nodes. Putative activation levels are indicated by color temperature. Sustained representations in the AF and downstream fields are supported by local self-excitation and compete via surrounding suppression. Through training, the model learned to map a single spatial cue onto two potential motor goals in the spatial motor goal field (dashed arrows; figure conceptually illustrates simulation data from Klaes et al., 2012. A rule bias enhances regions in the AF which encode the corresponding rule in conjunction with their spatial selectivity. (b) Hypothetical extension of the model to account for the effect of PD enhancement and OD suppression observed in the current experiment. Anisotropic lateral inhibition leads to strong mutual competition (blue circle-headed arrows) along the rule dimension, that is between regions that share the same spatial selectivity but prefer different rules. (c) Distance-dependent inhibition in the motor-goal field could be task-specific and maximal when the potential movement goals are 180° apart. (d) Mutual inhibition could occur selectively among currently relevant regions, representing the options, in a given decision.
Author response image 1
Author response image 2
Tables
Author response table 1
Success rate in instructed trials depending on the previous trial
https://doi.org/10.7554/eLife.47581.024| Current CW [mean ± SE; n (avg / session)] | Current CCW | ||
| Previous CW | Correct | 82.15 ± 0.22; n = 198.4 | 72.96 ± 0.35; n = 143.8 |
| Wrong | 70.49 ± 1.41; n = 38.02 | 68.83 ± 2.28; n = 25.7 | |
| Previous CCW | Correct | 72.14 ± 0.35; n = 145.2 | 81.61 ± 0.22; n = 200.0 |
| Wrong | 67.54 ± 2.29; n = 25.0 | 73.76 ± 1.35; n = 36.4 |
Author response table 2
Similar for follow vs. against trials:
https://doi.org/10.7554/eLife.47581.025| Current Follow [mean ± SE; n (avg / session)] | Current Against | ||
| Previous F | Correct | 85.55 ± 0.12; n = 367.1 | 59.72 ± 0.39; n = 142.4 |
| Wrong | 80.69 ± 0.14; n = 37.5 | 55.83 ± 4.77; n = 13.3 | |
| Previous A | Correct | 81.31 ± 0.38; n = 118.5 | 67.85 ± 0.93; n = 59.4 |
| Wrong | 72.7 ± 1.48; n = 37.7 | 62.27 ± 1.67; n = 36.7 |
Author response table 3
Choice probability depending on the previous trial:
https://doi.org/10.7554/eLife.47581.026| P(CW) [mean ± SE; n (avg / session)] | ||
| Previous CW | Correct | 48.03 ± 0.55; n = 103.9 |
| Wrong | 48.15 ± 6.55; n = 9.73 | |
| Previous CCW | Correct | 52.68 ± 0.55; n = 103.5 |
| Wrong | 48.10 ± 6.74; n = 9.6 |
Author response table 4
Choice probability depending on follow/against
https://doi.org/10.7554/eLife.47581.027| P(Follow) [mean ± SE; n (avg / session)] | ||
| Previous F | Correct | 72.77 ± 0.30; n = 155.5 |
| Wrong | 67.44 ± 5.73; n = 7.8 | |
| Previous A | Correct | 64.13 ± 1.04; n = 50.8 |
| Wrong | 62.18 ± 5.43; n = 11.4 |
Additional files
-
Transparent reporting form
- https://doi.org/10.7554/eLife.47581.020
Download links
A two-part list of links to download the article, or parts of the article, in various formats.
Downloads (link to download the article as PDF)
Open citations (links to open the citations from this article in various online reference manager services)
Cite this article (links to download the citations from this article in formats compatible with various reference manager tools)
Complementary encoding of priors in monkey frontoparietal network supports a dual process of decision-making
eLife 8:e47581.
https://doi.org/10.7554/eLife.47581


