Population response magnitude variation in inferotemporal cortex predicts image memorability
- University of Pennsylvania, United States
- Massachusetts Institute of Technology, United States
- Brain and Mind Institute, Western University, Canada
- Western University, Canada
Figures
Figure 1
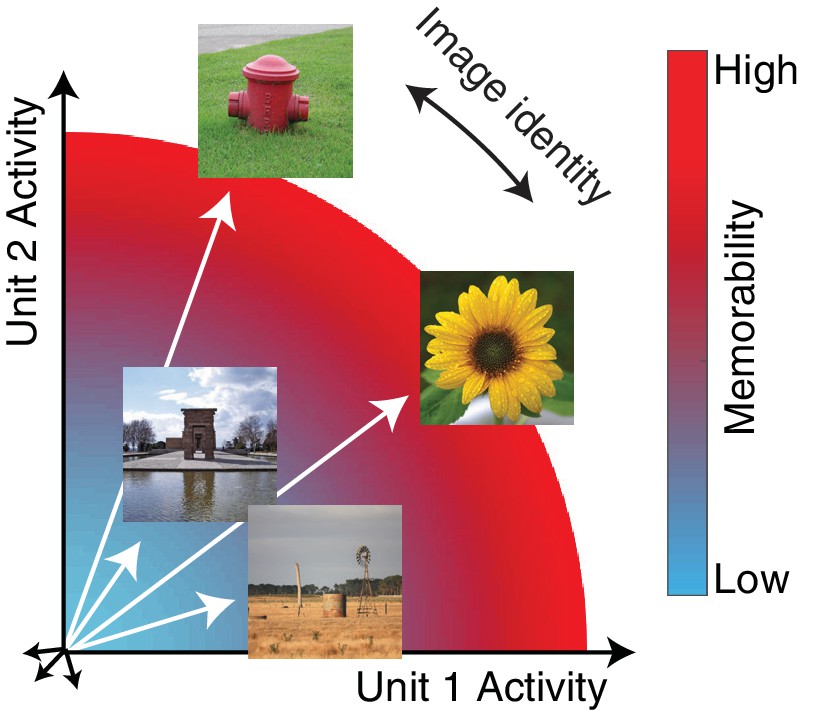
The hypothesis: the magnitude of the IT population response encodes image memorability.
In geometric depictions of how IT represents image identity, the population response to an image is depicted as a vector in an N-dimensional space, where N indicates the number of neurons in the population, and identity is encoded by the direction of the population vector. Here we test the hypothesis that image memorability is encoded by the magnitude (or equivalently length) of the IT population vector, where images that produce larger population responses are more memorable.
Figure 2 with 4 supplements
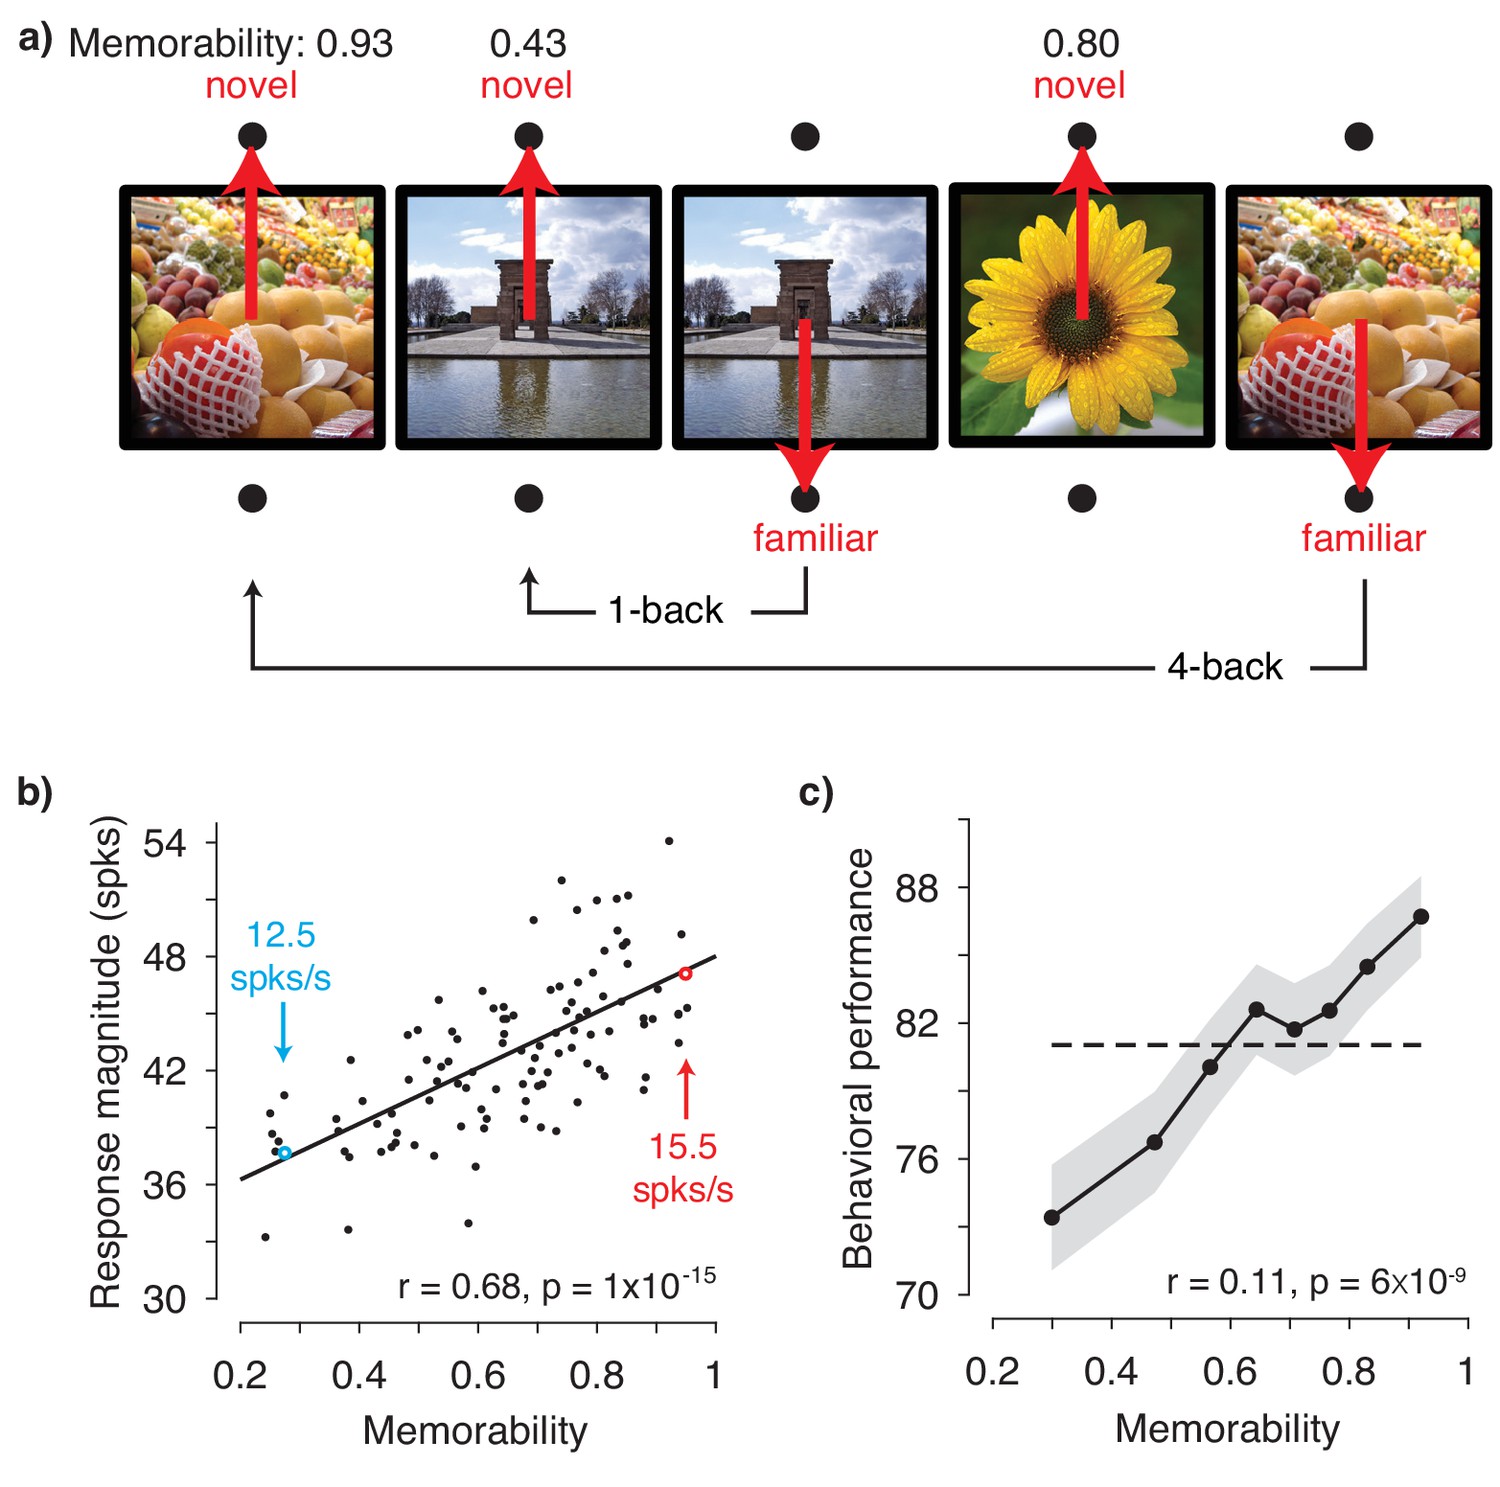
IT population response magnitude strongly correlates with image memorability.
(a) The monkeys’ task involved viewing each image for 400 ms and then reporting whether the image was novel or familiar with an eye movement to one of two response targets. The probability of a novel versus familiar image was fixed at 50% and images were repeated with delays ranging from 0 to 63 intervening trials (4.5 s to 4.8 min). Shown are 5 example trials with image memorability scores labeled. The memorability of each image was scored from 0-1, where the score reflects the predicted chance-corrected hit rate for detecting a familiar image (i.e., 0 maps to chance and 1 maps to ceiling; Khosla et al., 2015). (b) The relationship between image memorability scores and IT population response magnitudes. Each point corresponds to a different image (N=107 images). Population response magnitudes were computed as the L2 norm , where ri is the spike count response of the ith unit, across a pseudopopulation of 707 units. Spikes were counted in an 80 ms window positioned 180 to 260 ms following stimulus onset (see Figure 2—figure supplement 3a for different window positions). The Pearson correlation and its p-value are labeled. The solid line depicts the linear regression fit to the data. For reference, the mean firing rates for two example images are also labeled (see also Figure 2—figure supplement 3b). (c) Mean and standard error (across experimental sessions) of monkey behavioral performance on the memory task as a function of human-based image memorability scores. For visualization, performance was binned across images with neighboring memorability scores and pooled across monkeys (see Figure 2—figure supplement 4 for plots by individual). The dashed line corresponds to the grand average performance, and if there were no correlation, all points should fall near this line. The point-biserial correlation and its p-value, computed for the raw data (i.e. 2889 continuous memorability scores and 2889 binary performance values for each image in each session) are labeled. Source data are included as Figure 2—source data 1 and Figure 2—source data 2.
-
Figure 2—source data 1
Data used to compute monkey neural responses as well as human-based memorability scores for each image.
Neural data include the spike count responses of each unit, averaged across novel and familiar presentations. The human-based memorability scores for each image are also provided.
- https://doi.org/10.7554/eLife.47596.008
-
Figure 2—source data 2
Data used to compute monkey behavioral responses as well as human-based memorability scores for each image.
Behavioral data include monkey performance when images were presented as familiar. The human-based memorability scores for each image are also provided. Ethics: Animal experimentation: All procedures were performed in accordance with the guidelines of the University of Pennsylvania Institutional Animal Care and Use Committee under protocol 804222.
- https://doi.org/10.7554/eLife.47596.009
Figure 2—figure supplement 1

Distributions of memorability scores for the images used in these experiments.
Memorability scores range from 0 to 1, where the score reflects the predicted chance-corrected hit rate for detecting a familiar image and 0 maps to chance (see Methods and Khosla et al., 2015).
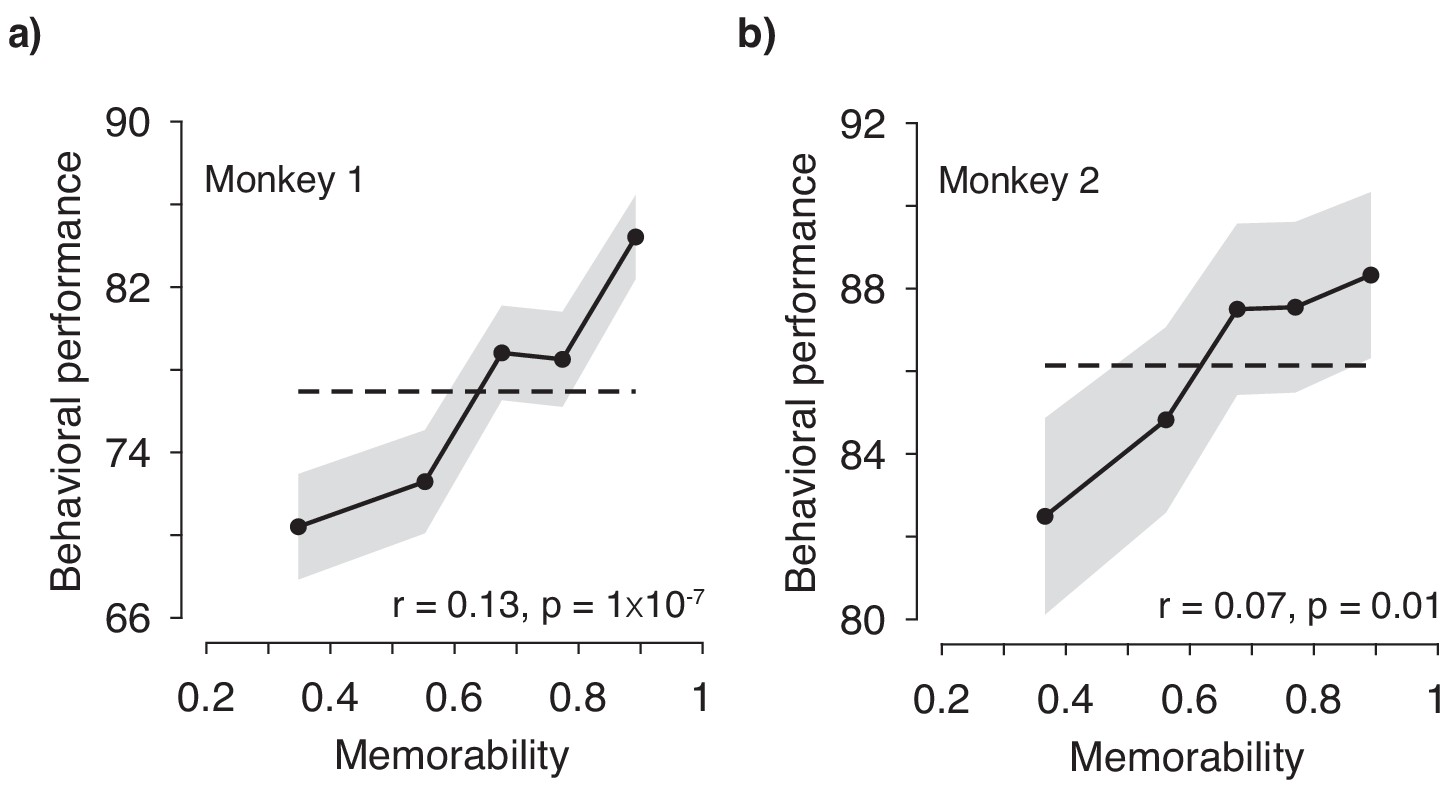
Figure 2—figure supplement 2
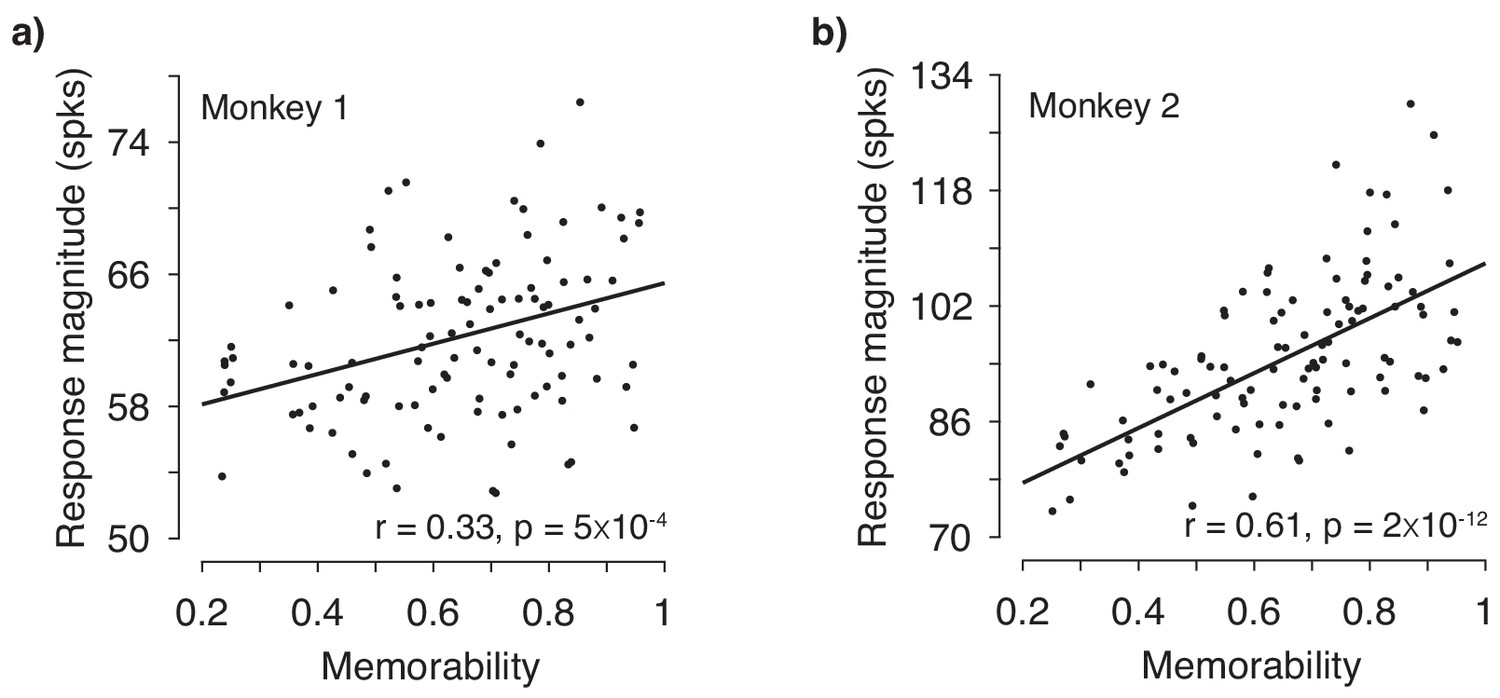
The correlation of memorability and population response magnitude, for each monkey individually.
(a-b) Figure 2b replotted for each monkey individually (monkey 1: 353 units; monkey 2 354 units). To compensate for parsing the data, the spike count window was increased to 250 ms in these plots (positioned 150 ms – 400 ms) relative to the 80 ms window depicted in Figure 2. The Pearson correlation and its p-value are labeled. The following two points were included in computing the correlations but fall outside the boundaries of the plot or are obscured by text: Monkey 1 (panel a): memorability = 0.86, response magnitude = 83.6; Monkey 2 (panel b): memorability = 0.57, response magnitude = 71.5. Solid lines depict the linear regression fits to the data.
Figure 2—figure supplement 3
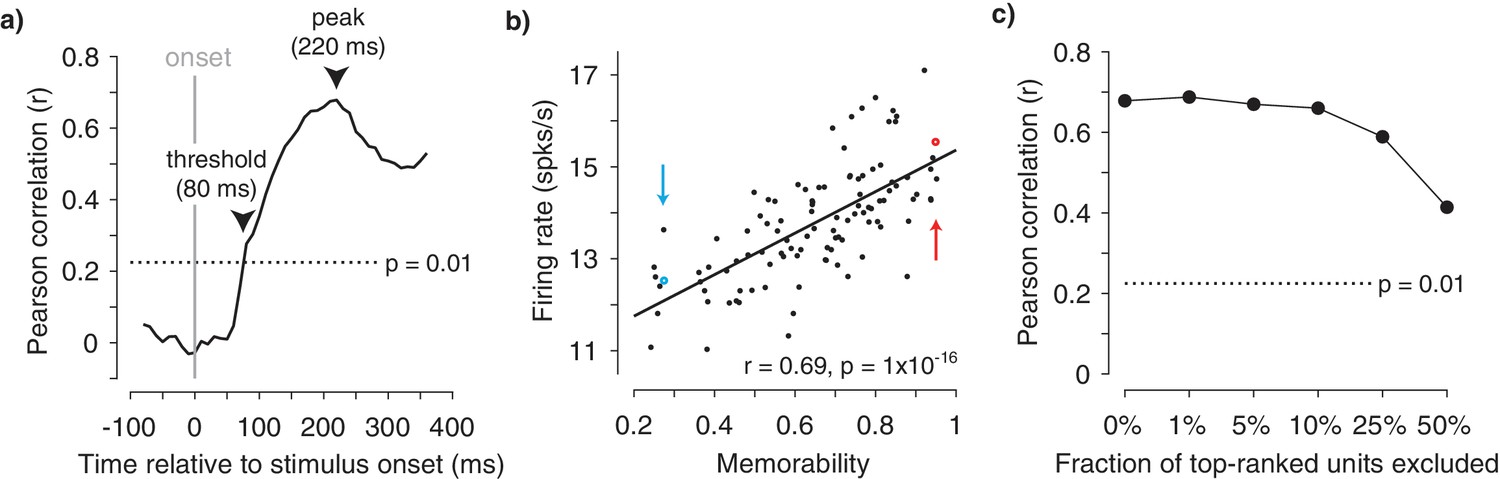
The correlation of memorability and the IT population response, applied to different time windows, assessed with firing rate, and determined with top-ranked firing units removed.
(a) The same analysis described for Figure 2b, but applied to 80 ms windows shifted at different positions relative to stimulus onset, where the correlations are plotted against the center of each time bin. Figure 2b is shown at the peak of this plot (220 ms). Also shown (dotted line) is the critical correlation threshold for p<0.01, which the population reached at 80 ms following stimulus onset. (b) Correlations between memorability and grand mean firing rate across the 707 units (in contrast to the plots of response magnitude in Figure 2b). The two example images from 2b are indicated. Solid line depicts the linear regression fit to the data. (c) The analysis in Figure 2b with N% top-ranked firing rate units excluded from the pseudopopulation for different N. The dotted line indicates the critical correlation for the significance level p=0.01.
Figure 2—figure supplement 4
Human-based memorability scores predict what monkeys find memorable.
The analysis presented in Figure 2c, applied to each monkey individually. To compensate for parsing the data, the data is parsed into five bins as opposed to the seven bins in Figure 2c. The dashed lines correspond to the grand average performance, and if there were no correlation, all points should fall near this line. The point-biserial correlation and its p-value, computed for the raw data, are labeled.
Figure 3 with 1 supplement

Correlations between memorability and population response increase in strength across layers of a CNN trained to classify objects and scenes.
Shown are mean and 95% CIs of the Pearson correlations between image memorability and population response magnitude for each hierarchical layer of the CNN described in Zhou et al. (2014), up to the last hidden layer. ‘Conv’: convolutional layer; ‘FC’: fully connected layer. p-values for a one-sided comparison that correlation strength was larger for the trained than the randomly connected network: p<0.0001 for all layers.
Figure 3—figure supplement 1
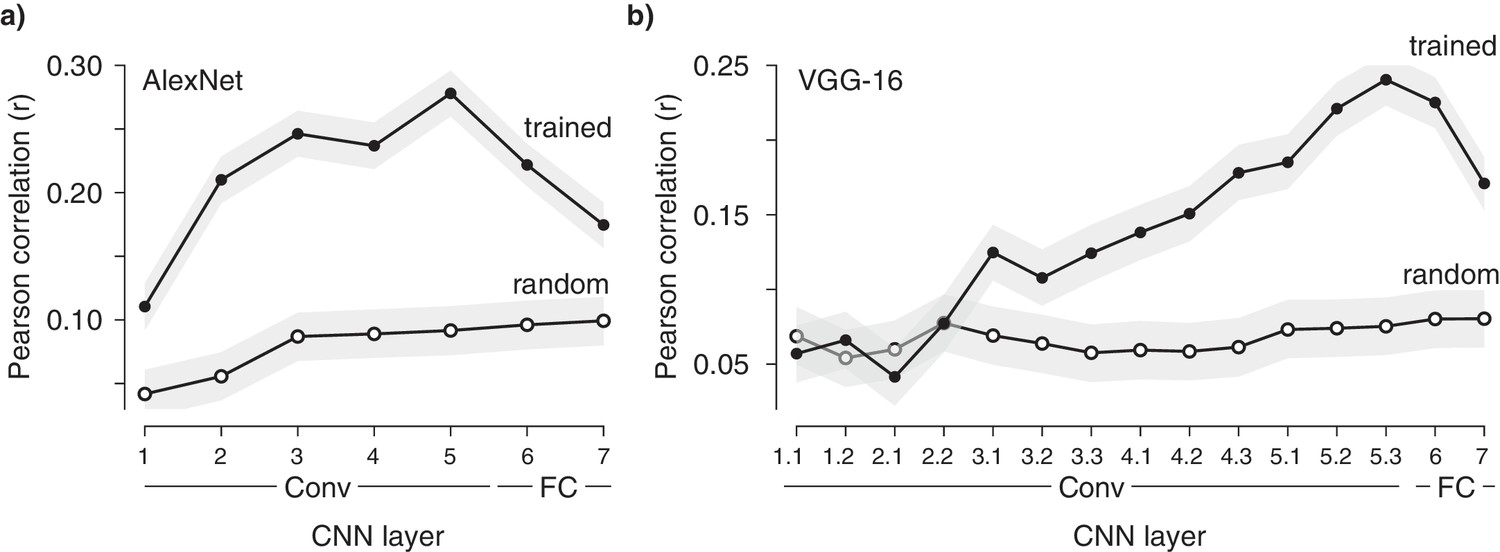
Correlations between memorability and population response magnitude are also reflected in two other CNNs.
Shown are mean and 95% CIs of the Pearson correlations between image memorability and population response magnitude for each hierarchical layer for two CNNs, including (a) AlexNet (Krizhevsky et al., 2012), (b) VGG-16 (Simonyan and Zisserman, 2015), up to the last hidden layer. ‘Conv’: convolutional layer; ‘FC’: fully connected layer. p-values for a one-sided comparison that correlation strength was larger for the trained than the randomly connected network, AlexNet: p<0.0001 for all layers; VGG-16: p=0.8, 0.2, 0.9, and 0.5 for Conv 1.1, 1.2, 2.1, and 2.2, respectively, p=0.0008 for Conv 3.2, and p<0.0001 for all other layers.
Author response image 1
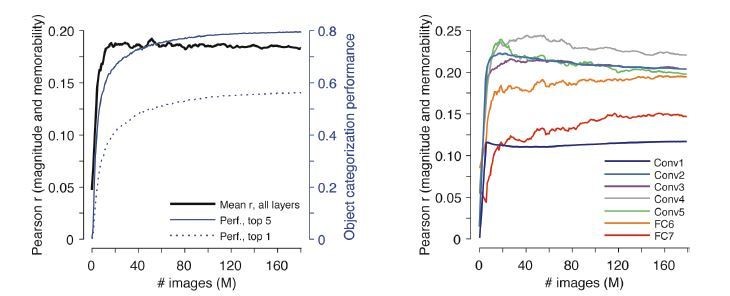
Emergence of the correlation between response magnitude and memorability in one network, AlexNet, as a function of training duration starting from a randomly initialized network.
Left: Shown for the left-hand axis (black) is the mean Pearson correlation (across all network layers) as a function of training, where training is quantified by the numbers of images (in Millions) used for training and 0 reflects the randomly initialized state. Superimposed with the right-hand axis (blue) is the object categorization performance of the network, quantified as top-1 and top-5 accuracy on a 1000-way object categorization task on the ImageNet validation set (see below for more details). Right: Shown are the Pearson correlations for the individual layers of the network that were combined to produce the mean in the right panel (black).
Additional files
-
Transparent reporting form
- https://doi.org/10.7554/eLife.47596.012
Download links
A two-part list of links to download the article, or parts of the article, in various formats.
Downloads (link to download the article as PDF)
Open citations (links to open the citations from this article in various online reference manager services)
Cite this article (links to download the citations from this article in formats compatible with various reference manager tools)
Population response magnitude variation in inferotemporal cortex predicts image memorability
eLife 8:e47596.
https://doi.org/10.7554/eLife.47596


