Endangered wild salmon infected by newly discovered viruses
- University of British Columbia, Canada
- Fisheries and Oceans Canada, Canada
- Pacific Salmon Foundation, Canada
- Simon Fraser University, Canada
- St. George’s University, Grenada
Figures
Figure 1 with 1 supplement
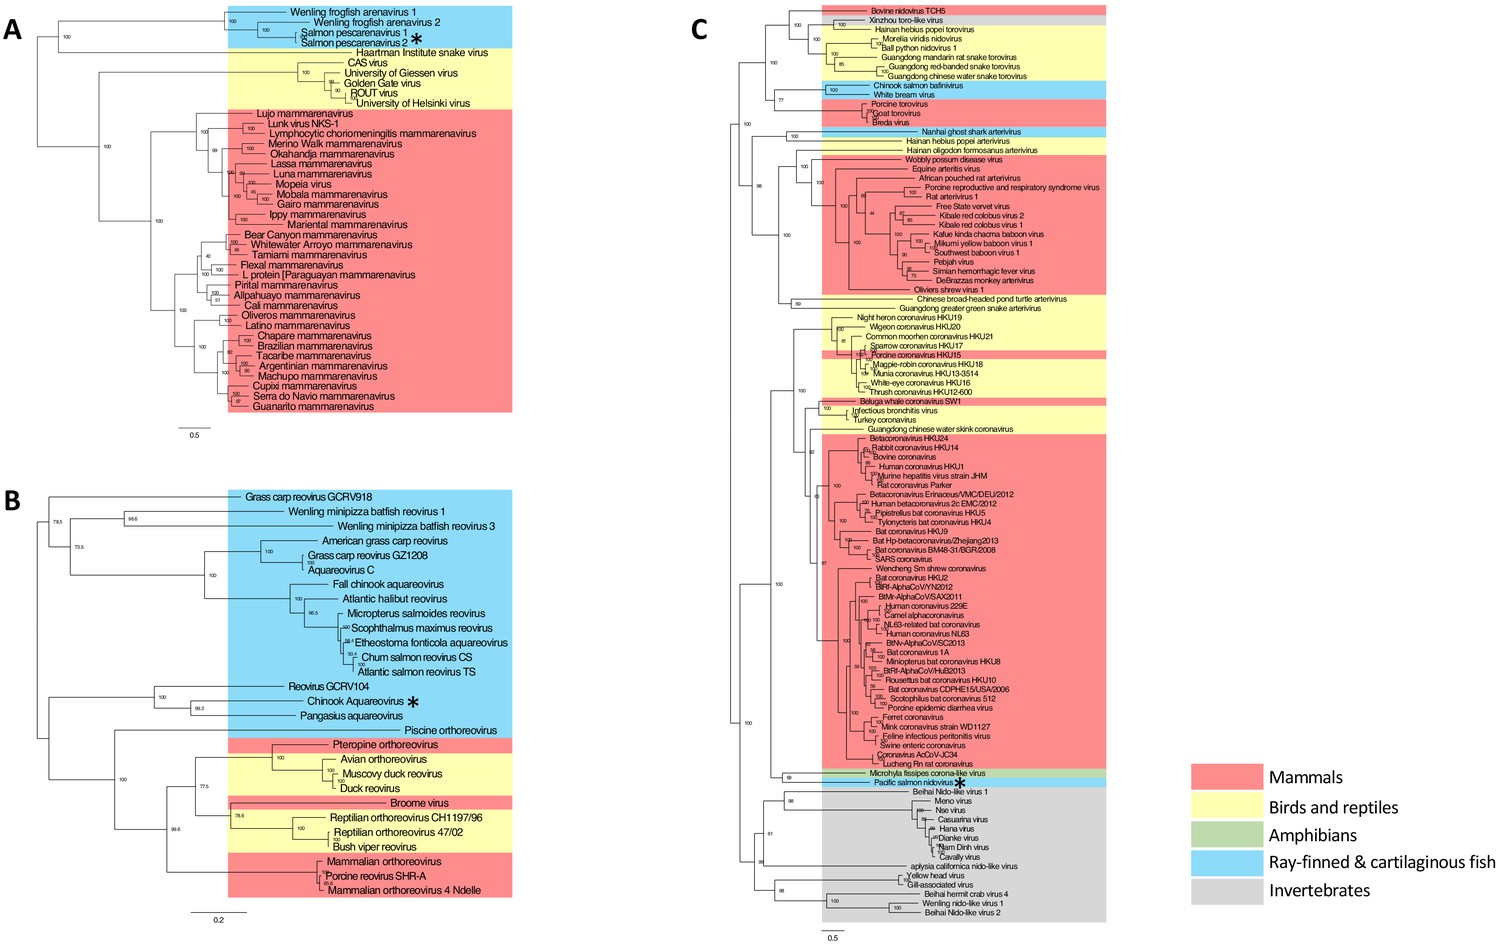
Maximum likelihood phylogenetic tree based on MAFFT alignments of the predicted replicase protein of (A) Salmon pescarenavirus and related arenaviruses, (B) Chinook Aquareovirus and related Aqua and orthoreoviruses and (C) Pacific salmon nidovirus and related Nidovirales.
Sequences from this study are marked with an asterisk, scale bar represents the number of amino substitutions per site, node labels show the bootstrap support and host groups are shown by colour. Trees are mid-point rooted, so do not necessarily represent the ancestral relationship of the viruses. Amino acid alignments have been provided in the source data for Figure 1.
-
Figure 1—source data 1
Arenavirus amino acid alignment.
- https://doi.org/10.7554/eLife.47615.006
-
Figure 1—source data 2
Nidovirus amino acid alignment.
- https://doi.org/10.7554/eLife.47615.007
-
Figure 1—source data 3
Reovirus amino acid alignment.
- https://doi.org/10.7554/eLife.47615.008
-
Figure 1—source data 4
Arenavirus phylogenetic tree.
- https://doi.org/10.7554/eLife.47615.009
-
Figure 1—source data 5
Reovirus phylogenetic tree.
- https://doi.org/10.7554/eLife.47615.010
-
Figure 1—source data 6
Nidovirus phylogenetic tree.
- https://doi.org/10.7554/eLife.47615.011
Figure 1—figure supplement 1
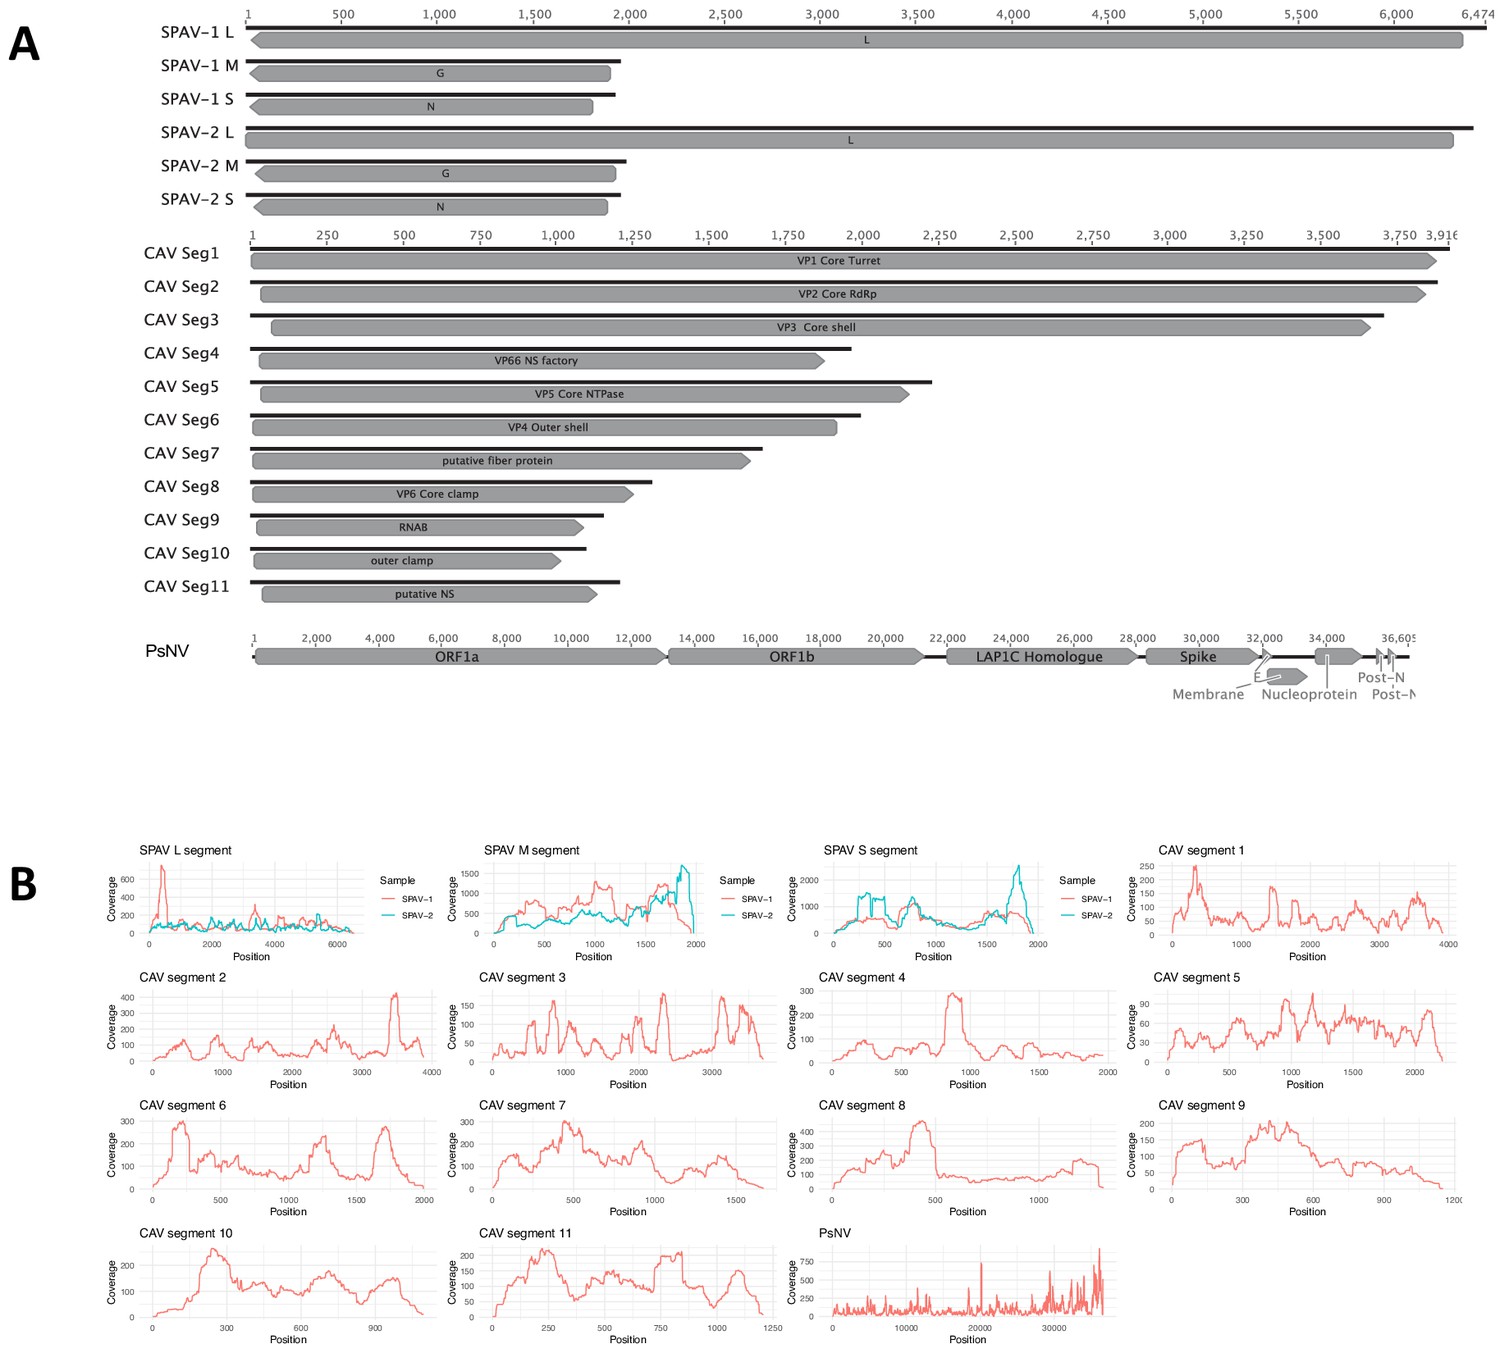
Genome organisation and coverage.
(A) Genome organisation, ORF prediction and (B) Genome coverage for Salmon pescarenavirus 1 and 2 (SPAV), Chinook Aquareovirus (CAV) segments 1-and Pacific salmon Nidovirus (PsNV). Black lines represent the genome and boxes show the predicted open reading frames. Nucleotide sequences are provided in fasta format in the source data for Figure 1.
-
Figure 1—figure supplement 1—source data 1
Viral genomic nucleotide sequences.
- https://doi.org/10.7554/eLife.47615.005
Figure 2 with 2 supplements
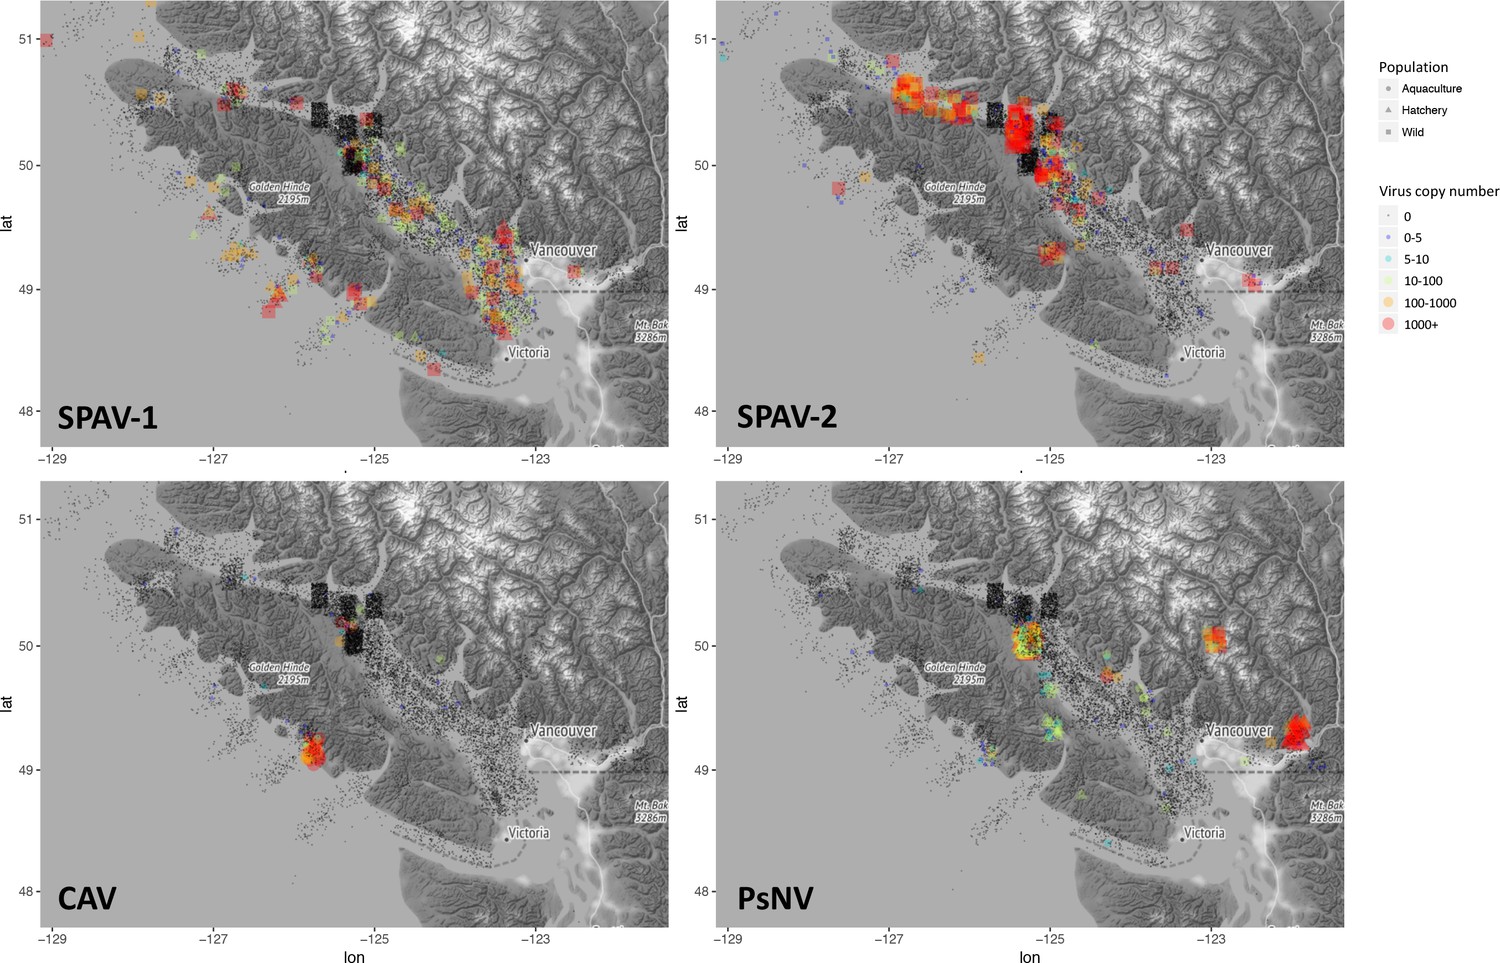
Epidemiological maps of Salmon pescarenavirus 1 and 2 (SPAV-1 and SPAV-2), Chinook aquareovirus (CAV) and Pacific salmon nidovirus (PsNV) around the coast of Vancouver Island.
Individual samples are shown at the location collected, negative samples are black, and positive samples are coloured and sized according to the virus copy number. A small degree of random noise was added to the longitude and latitude to prevent overplotting.
-
Figure 2—source data 1
Source data (RT-PCR copy number and sampling locations) for hte epidemiological maps.
- https://doi.org/10.7554/eLife.47615.015
Figure 2—figure supplement 1
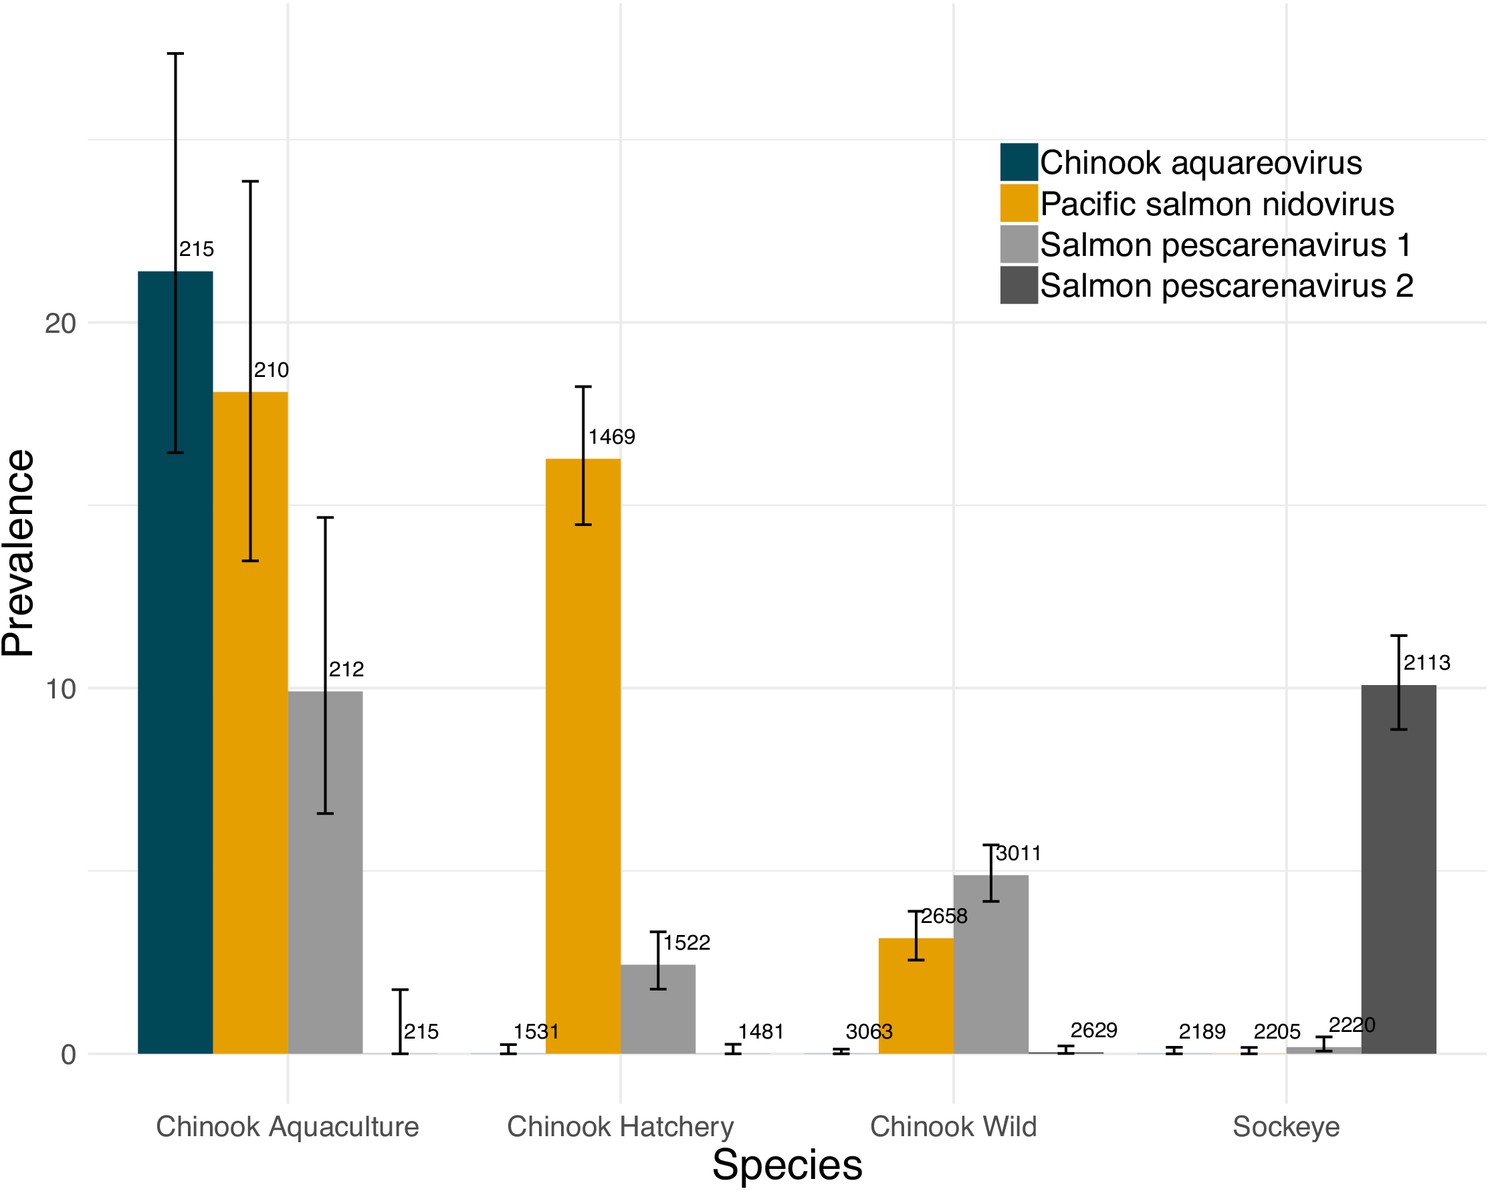
Summary of RT-PCR for SPAV-1 and −2, PsNV and CAV using the Biomark Fluidigm platform.
The data shown are the prevalence (percentage) of positive amplifications above the calculated limit of detection (95%). Numbers show the sample size and error bars show Wilson’s binomial confidence intervals. Hatchery Chinook are fish with clipped fins, whilst wild represent all other wild caught fish.
Figure 2—figure supplement 2
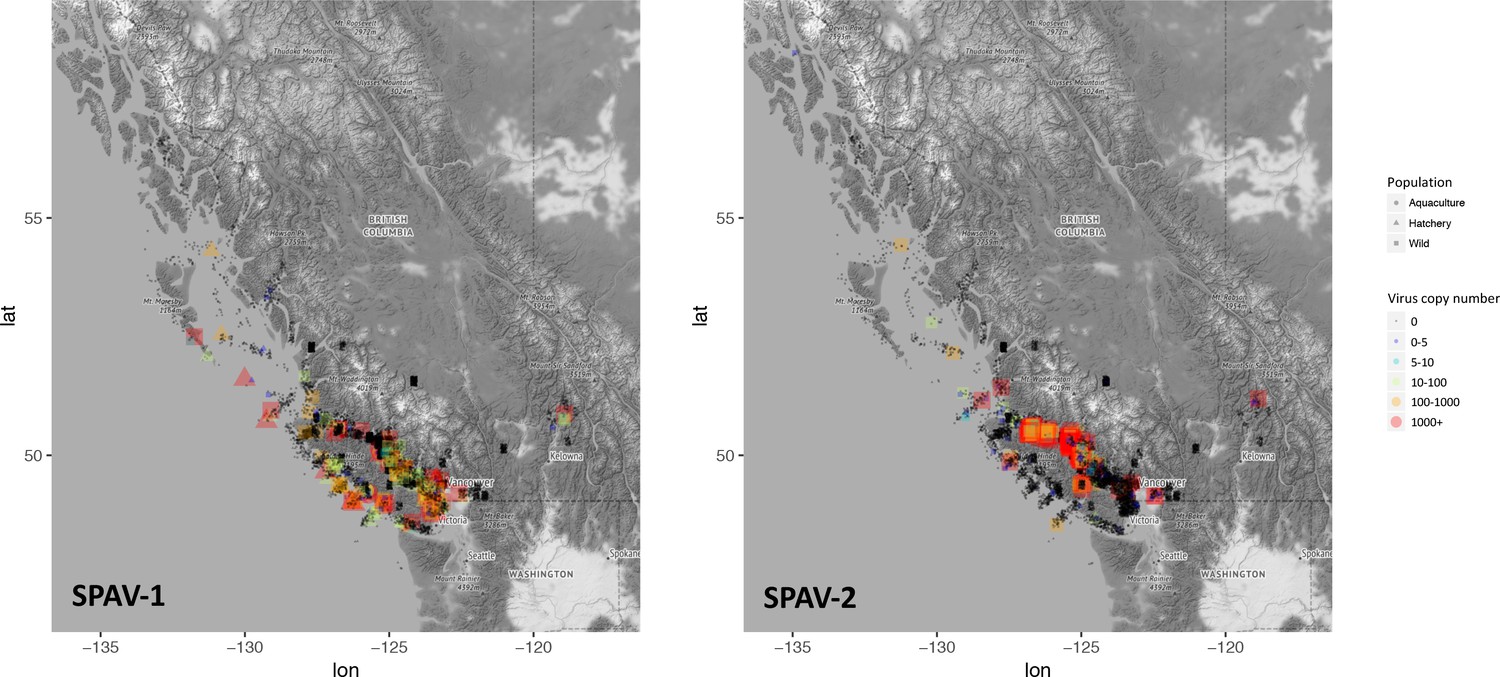
Epidemiological maps from Washington to Alaska of Salmon pescarenavirus 1 and 2 (SPAV-1 and SPAV-2).
Individual samples are shown at the location collected, samples negative for SPAV are black, and positive samples are coloured and sized according to the virus copy number. A small degree of random noise was added to the latitude and longitude to prevent overplotting.
Figure 3 with 1 supplement
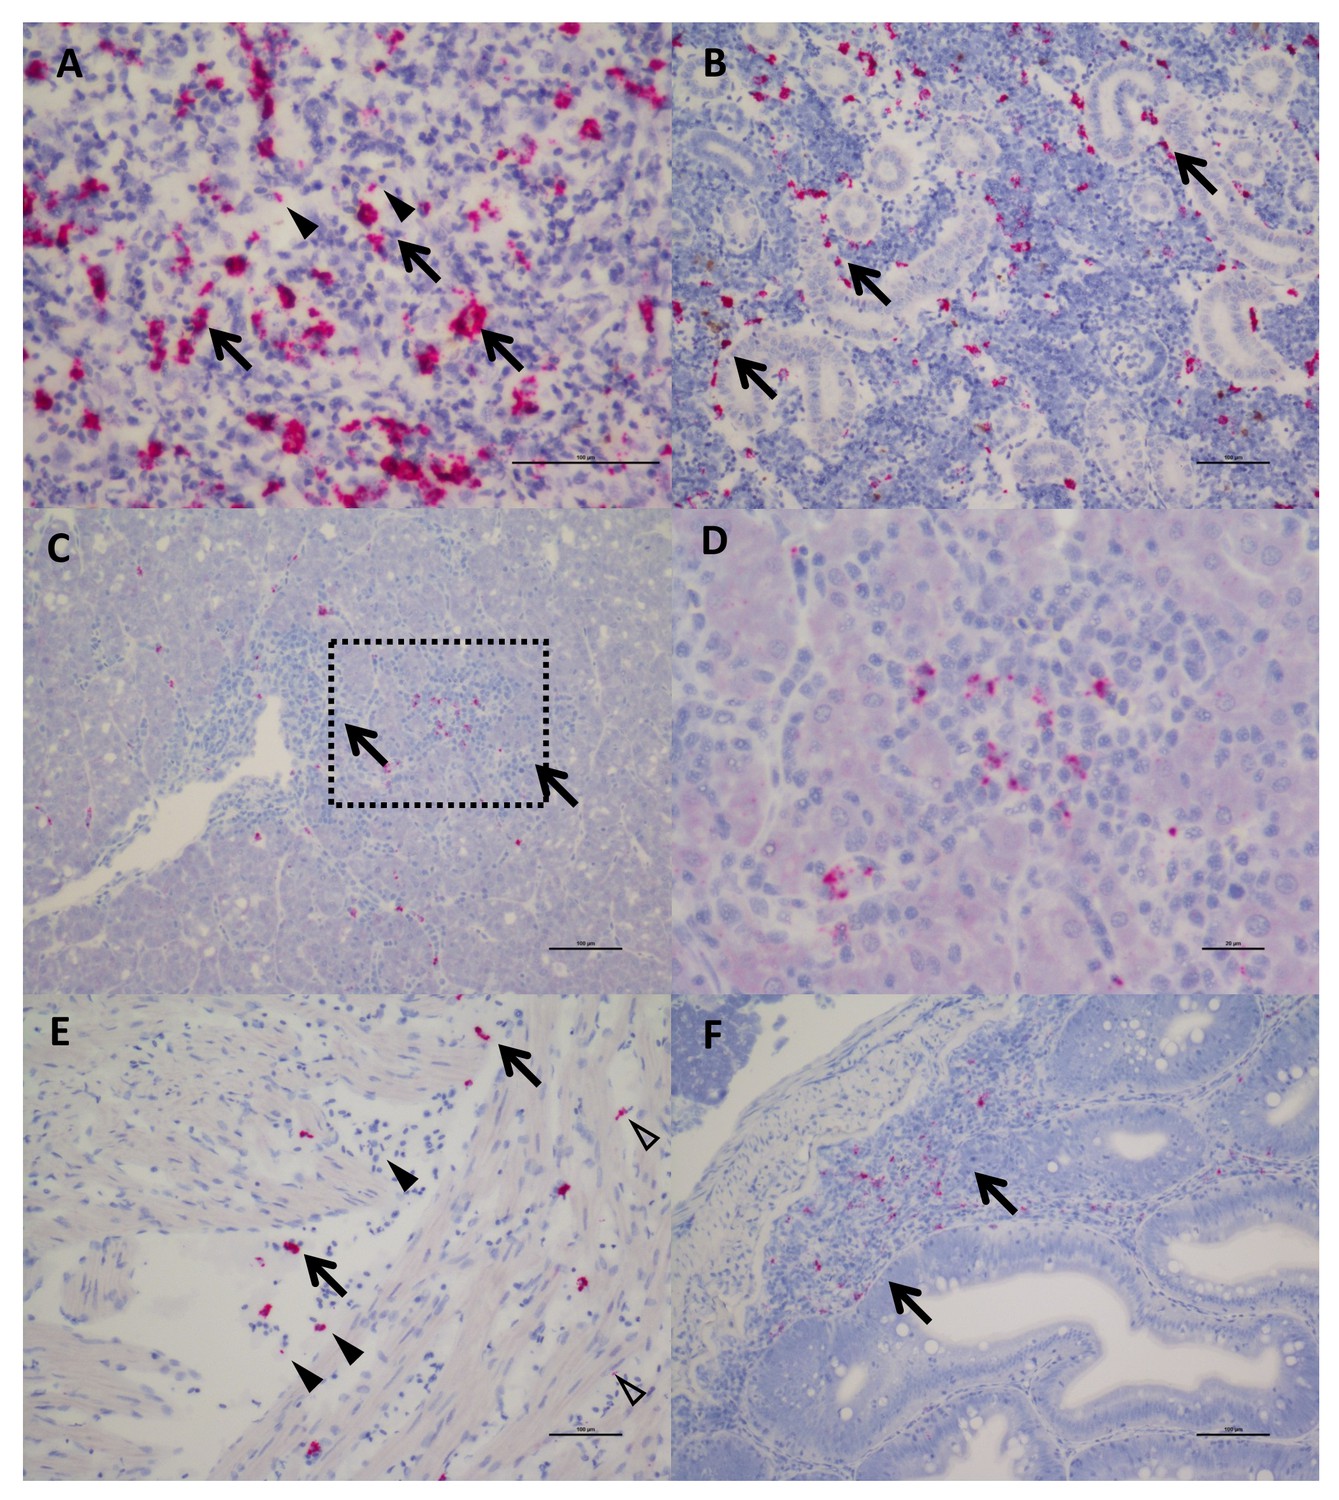
In Situ Hybridization staining of SPAV-1 in Chinook salmon.
The red stain indicates localisation of viral RNA as well as viral transcripts. (A) Spleen: staining mostly localised in the macrophages (arrows) located around the sinusoids, although scattered positive red blood cells (arrowheads) are also present (scale bar 50 µm). (B) Posterior Kidney: the virus appears to be primarily localised in the peritubular capillaries (renal portal vessels) and macrophages (arrows) (scale bar 100 µm). (C) Liver: nodules of inflammation are mainly concentrated in a highly marked area. (scale bar 100 µm), dashed rectangle is enlarged in (D) showing lymphocytes and macrophages in the inflammatory nodule (several of which are positive for the virus). (scale bar 20 µm). (E) Heart: positive macrophages (arrows) are present between the fibres of the spongy myocardium, along with several positive red blood cells (arrowhead) and endothelial cells (open arrowheads). (scale bar 100 µm). (F) Intestine: staining for SPAV-1 is primarily localised to the gut-associated lymphoid tissue (arrows). (scale bar 100 µm).
Figure 3—figure supplement 1
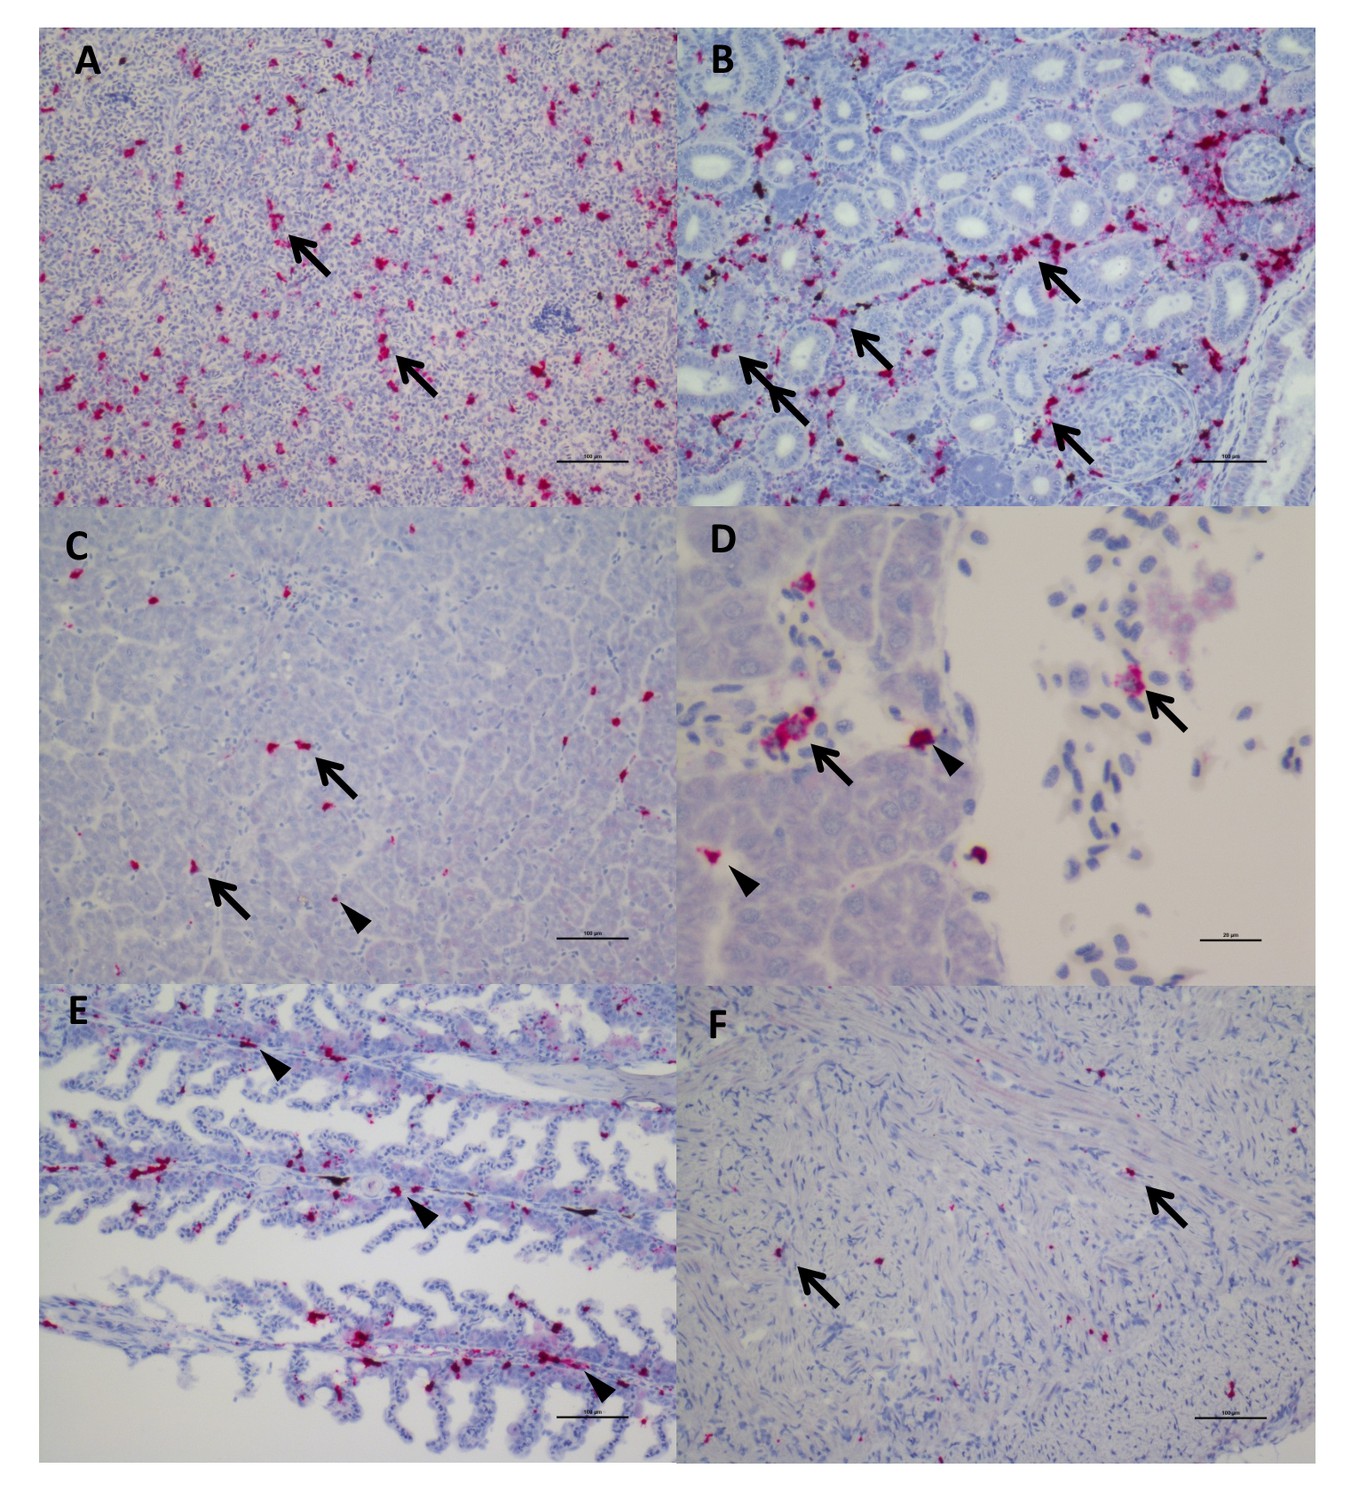
In Situ Hybridization staining of SPAV-2 in sockeye salmon.
The red stain indicates localisation of viral RNA as well as viral transcripts (A) Spleen: staining mostly localised to the macrophages (arrows) scattered throughout the tissue. (scale bar 100 µm). (B) SPAV-2 appears to be primarily localised to the peritubular capillaries (renal portal vessels) and macrophages (arrows) (scale bar 100 µm). (C) Liver: macrophages (arrows) and red blood cells (arrowhead) positive for SPAV-2 are present in the blood circulating in the sinusoids. (scale bar 100 µm). (D) Liver: SPAV-2 is localised to the blood, inside macrophages (arrows) and red blood cells (arrowheads). (scale bar 20 µm). (E) Gills: several red blood cells (arrowhead) were positive for SPAV-2. (scale bar 100 µm). (F) Heart: virus was localised to macrophages (arrows) in the blood circulating in the myocardium. (scale bar 100 µm).
Figure 4
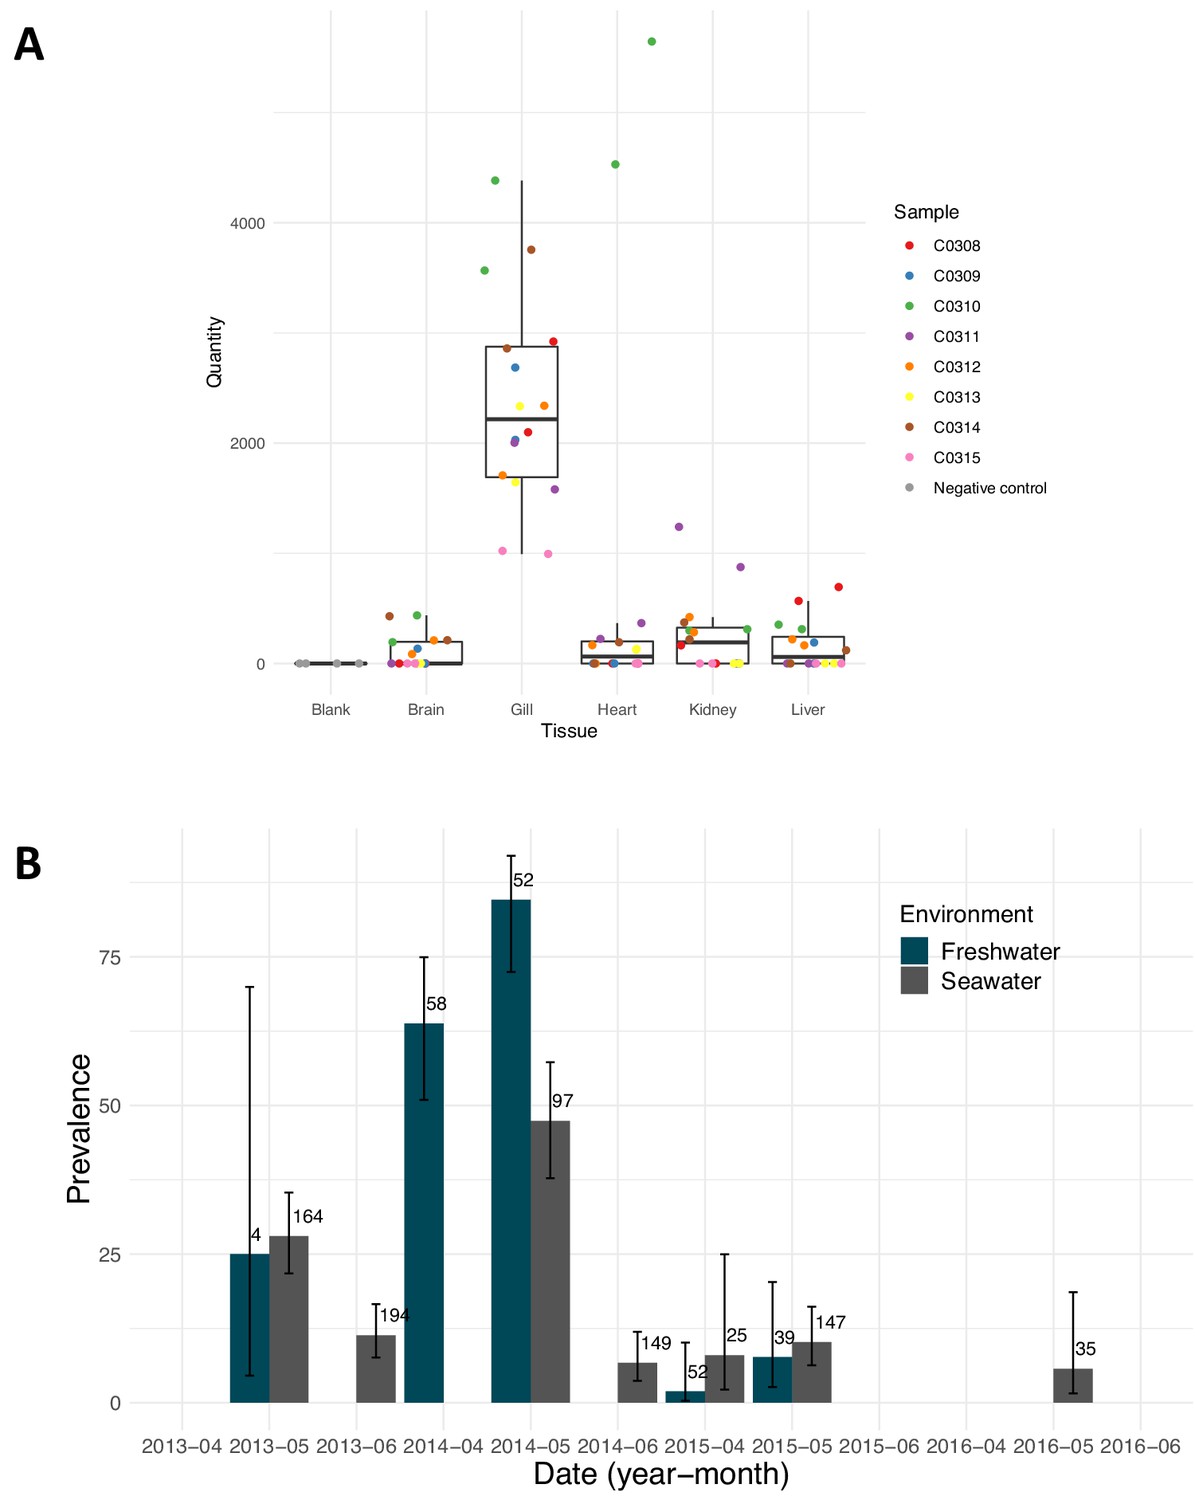
Pacific salmon nidovirus localisation and detections at a single salmon enhancement hatchery.
(A) Average relative quantity of Pacific salmon nidovirus in dissected tissues of eight Chinook. Each sample was run and plotted in duplicate. (B) Prevalence of Pacific salmon nidovirus in fish collected in fresh and saltwater at a single salmon enhancement hatchery over four years. The data shown are the prevalence of positive amplifications above the calculated limit of detection (95%). Numbers show the sample size and error bars show Wilson’s binomial confidence intervals.
Additional files
-
Supplementary file 1
Table of primers and taqman assays used in this study.
- https://doi.org/10.7554/eLife.47615.019
-
Supplementary file 2
Commands used in the bioinformatic pipeline.
- https://doi.org/10.7554/eLife.47615.020
-
Transparent reporting form
- https://doi.org/10.7554/eLife.47615.021
Download links
A two-part list of links to download the article, or parts of the article, in various formats.
Downloads (link to download the article as PDF)
Open citations (links to open the citations from this article in various online reference manager services)
Cite this article (links to download the citations from this article in formats compatible with various reference manager tools)
Endangered wild salmon infected by newly discovered viruses
eLife 8:e47615.
https://doi.org/10.7554/eLife.47615


