N-cadherin-regulated FGFR ubiquitination and degradation control mammalian neocortical projection neuron migration
- Institute of Neuroscience, Université Catholique de Louvain, Belgium
- Fred Hutchinson Cancer Research Center, United States
Figures
Figure 1 with 1 supplement
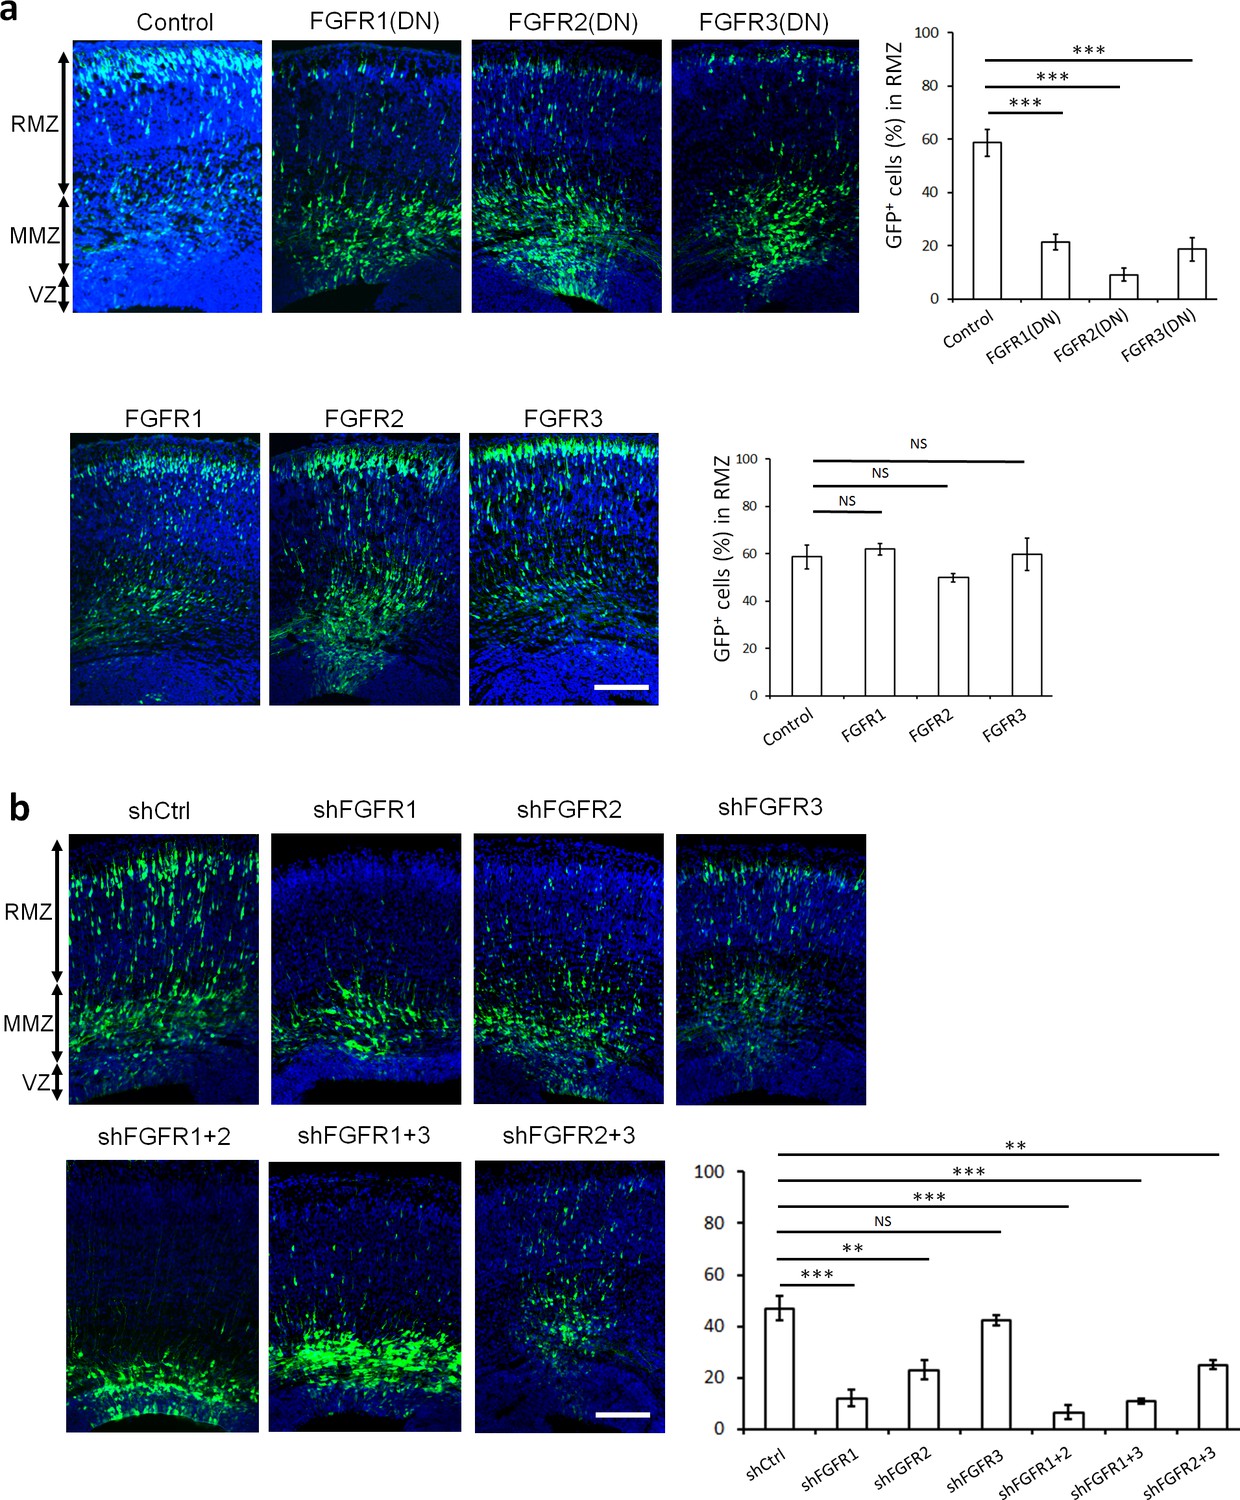
FGFRs regulate projection neuron migration in vivo.
(a,b) shRNA against FGFR1, 2 or 3 and dominant-negative (DN) but not wildtype FGFR1, 2 or 3 induce an accumulation of neurons at the MMZ. (a) pNeuroD-FGFR(DN) and pNeuroD-FGFR plasmids, expressed in neurons, and (b) shRNA against FGFR1, 2 or 3 or negative control shRNA (shCtrl) were co-electroporated in utero with pCAG-GFP, expressed in progenitors and neurons, at embryonic day (E) 14.5. (a,b) Three days later, cryosections were prepared and labeled for DAPI (blue) and GFP (green). The cerebral wall was subdivided into radial morphology zone (RMZ), multipolar morphology zone (MMZ) and VZ. Graphs show the percentage of cells in the RMZ. n = 5 Control, 7 FGFR1(DN), 4 FGFR2(DN), 4 FGFR3(DN), 3 FGFR1, 3 FGFR2, 4 FGFR3, 6 shCtrl, 4 shFGFR1, 4 shFGFR2, 4 shFGFR3, 5 shFGFR1+2, 3 shFGFR1+3, 3 shFGFR2+3. P values: FGFR1(DN): 9.6E-6, FGFR2(DN): 4.2E-6, FGFR3(DN): 4.0E-5, FGFR1: 0.245, FGFR2: 0.170, FGFR3: 0.353, shFGFR1: 3.0E-4, shFGFR2: 2.9E-3, shFGFR3: 0.169, shFGFR1+2: 6.4E-5, shFGFR1+3: 1.0E-4, shFGFR2+3: 3.2E-3. Error bars, s.e.m. ***p<0.001, **p<0.01, *p<0.05, NS, not significant Scale bar 100 µm.
-
Figure 1—source data 1
FGFRs regulate projection neuron migration in vivo.
(a,b) shRNA against FGFR1, 2 or three and Dominant-negative (DN) but not wildtype FGFR1, 2 or 3 induce an accumulation of neurons at the MMZ. a pNeuroD-FGFR(DN) and pNeuroD-FGFR plasmids, expressed in neurons, and b shRNA against FGFR1, 2 or 3 or negative control shRNA (shCtrl) were co-electroporated in utero with pCAG-GFP, expressed in progenitors and neurons, at embryonic day (E) 14.5. (a,b) Three days later, cryosections were prepared and labeled for DAPI (blue) and GFP (green). The cerebral wall was subdivided into radial morphology zone (RMZ), multipolar morphology zone (MMZ) and VZ. Tables show the percentage of cells in the RMZ. n = 5 Control, 7 FGFR1(DN), 4 FGFR2(DN), 4 FGFR3(DN), 3 FGFR1, 3 FGFR2, 4 FGFR3, 6 shCtrl, 4 shFGFR1, 4 shFGFR2, 4 shFGFR3, 5 shFGFR1+2, 3 shFGFR1+3, 3 shFGFR2+3.
- https://doi.org/10.7554/eLife.47673.004
Figure 1—figure supplement 1
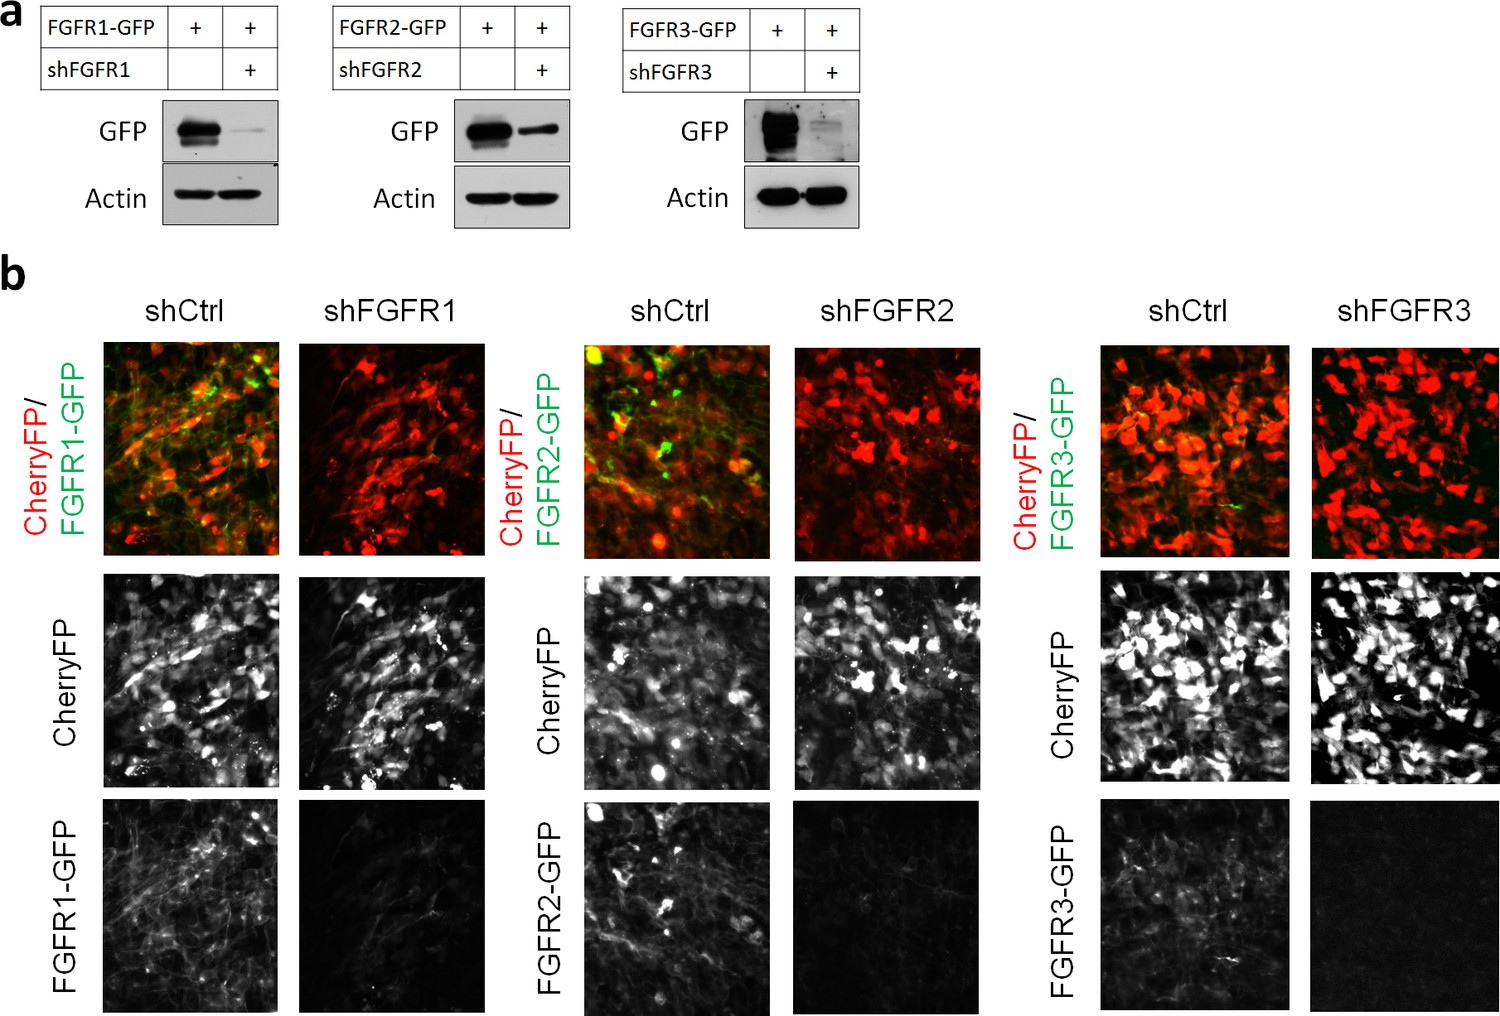
Efficiency of shRNAs against FGFR1, 2, 3.
(a) HEK293T cells were transfected with pCAG-FGFR1-GFP, FGFR2-GFP, FGFR3-GFP together with expression vectors for shRNAs against the corresponding receptor or a negative control shRNA (shCtrl). Protein levels were determined by Western blot two days later. (b) E14.5 embryos were electroporated in utero with a mixture of pCAG-CherryFP, pNeuroD-FGFR1-GFP, FGFR2-GFP or FGFR3-GFP and an expression vectors for shRNA against the corresponding receptor or negative control shRNA. Two days later, CherryFP and FGFRs-GFP were detected by epifluorescence.
Figure 2
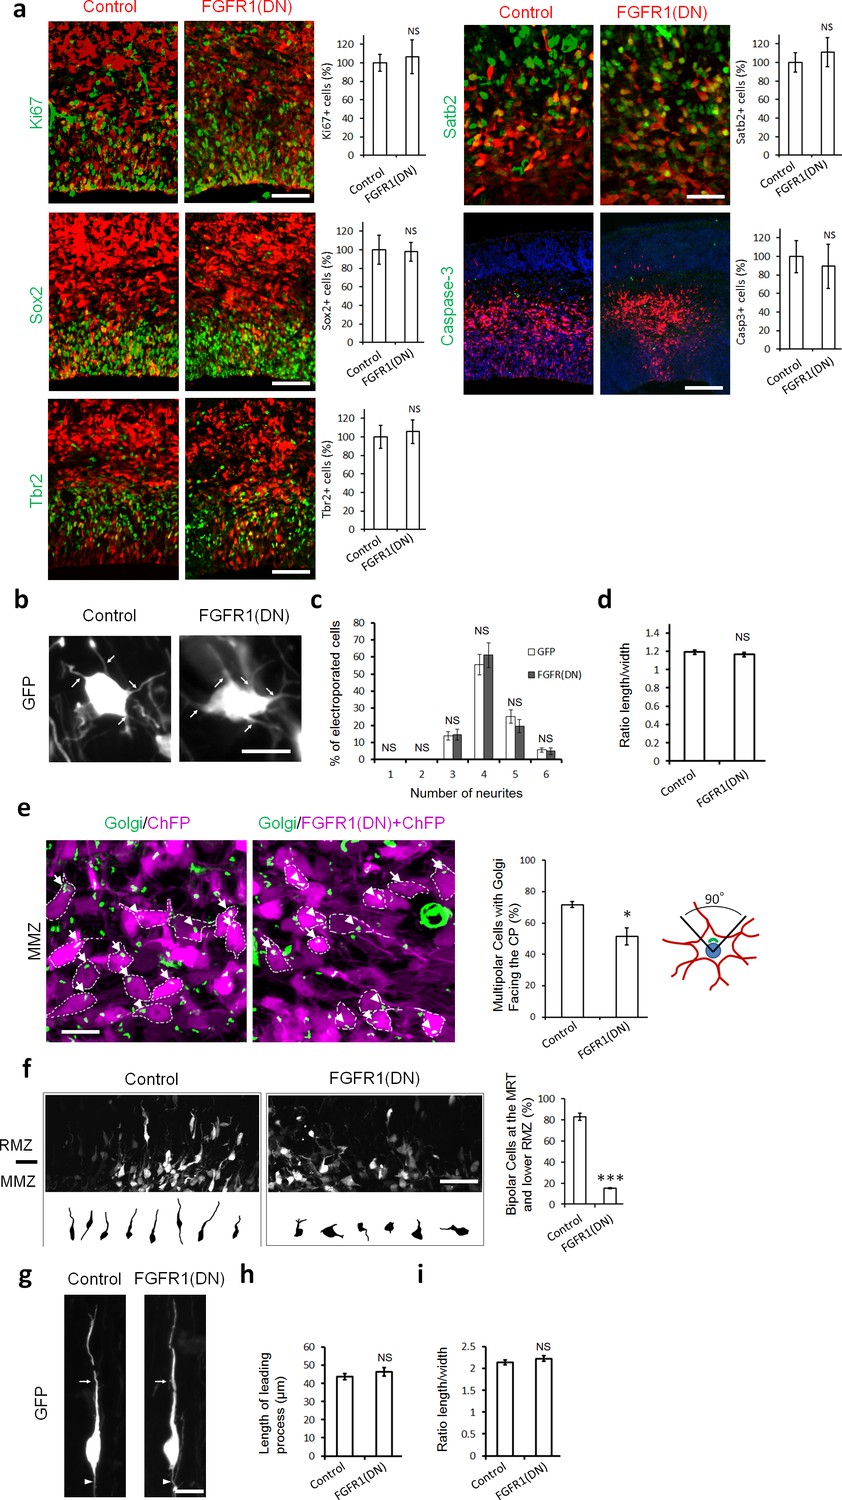
Inhibiting FGFRs in post-mitotic neurons has no effect on proliferation and differentiation but regulates multipolar neuron orientation and morphology.
In utero electroporation was performed at embryonic day E14.5 and analyzed 2 days later (a–f) or 3 days later (g–i). (a) Inhibition of FGFRs did not affect cell division (Ki67), apical (Sox2) or basal (Tbr2) progenitor cells, neuronal commitment (Satb2), or survival (cleaved Caspase-3). Expression of CherryFP (red) alone (control) or with FGFR1(DN) as indicated. After immunostaining for the indicated markers (green), the results were quantified by counting the number of labeled electroporated cells in a constant area of each section and averaged across sections from at least three different embryos for each antibody. Values are normalized to control (100%). (mean ± s.e.m.). NS, not significant. Scale bars, 50 μm for Ki67, Sox2 and Tbr2, 25 µm for Satb2, 100 μm for cleaved Caspase 3. (b, c, d) Inhibition of FGFR did not affect the number of neurites or the length to width morphology of multipolar cells. (b) High magnification of GFP+ multipolar neurons within the MMZ following overexpression of GFP or FGFR(DN). (c) Proportion of GFP+ cells with the indicated number of neurites within the MMZ. (d) Ratio of length/width of the GFP+ cells within the MMZ as an indicator of cell shape. P value: 0.196. (mean ± s.e.m.). NS, not significant. Arrows indicate the neurites, arrowheads indicate the axons. Scale bar 10 µm e) FGFR-inhibited neurons are disoriented. Golgi staining (green) of MMZ neurons (purple). The figure shows examples of multipolar neurons with their Golgi facing the CP (white arrows) or facing other directions (white arrowheads). The percentage of cells with Golgi facing the cortical plate was calculated (mean ± s.e.m.). *p<0.05, P value: 0.013. Scale bar 10 µm. (f) FGFR inhibition affects the multipolar to radial transition. Computer-based reconstruction of GFP+ neurons morphologies at the multipolar to radial transition zone (MRT) and the lower RMZ. The graph shows the percentage of bipolar radially oriented neurons. Scale bar 30 µm. Error bars, s.e.m. ***p<0.001, P value: 6.5E-6. (g, h, i) Inhibition of FGFR did not affect the length of the leading process and the length-to-width morphology of radially migrating cells. (g) High magnification of GFP+ bipolar neurons within the RMZ following overexpression of GFP or FGFR(DN). (h) Length of the leading process of GFP+ bipolar cells within the RMZ. P value: 0.180. (i) Ratio of length/width of the GFP+ cells within the RMZ as an indicator of cell shape. P value: 0.155 Arrows indicate the leading process, Scale bar 10 µm. (mean ± s.e.m.). NS, not significant.
-
Figure 2—source data 1
Inhibiting FGFRs in post-mitotic neurons has no effect on proliferation and differentiation but regulates multipolar neuron orientation and morphology.
(a) Inhibition of FGFRs did not affect cell division (Ki67), apical (Sox2) or basal (Tbr2) progenitor cells, neuronal commitment (Satb2), or survival (cleaved Caspase-3). Expression of CherryFP (red) alone (control) or with FGFR1(DN) as indicated. After immunostaining for the indicated markers (green), the results were quantified by counting the number of labeled electroporated cells in a constant area of each section and averaged across sections from at least three different embryos for each antibody. (c, d) Inhibition of FGFR did not affect the number of neurites or the length to width morphology of multipolar cells. (c) Proportion of GFP+ cells with the indicated number of neurites within the MMZ. (d) Ratio of length/width of the GFP+ cells within the MMZ as an indicator of cell shape. (e) FGFR-inhibited neurons are disoriented. Golgi staining (green) of MMZ neurons (purple). The figure shows examples of multipolar neurons with their Golgi facing the CP (white arrows) or facing other directions (white arrowheads). The percentage of cells with Golgi facing the cortical plate was calculated (mean ± s.e.m.). (f) FGFR inhibition affects the multipolar to radial transition. Computer-based reconstruction of GFP+ neurons morphologies at the multipolar to radial transition zone (MRT) and the lower RMZ. The table shows the percentage of bipolar radially oriented neurons. (h, i) Inhibition of FGFR did not affect the length of the leading process and the length-to-width morphology of radially migrating cells. (h) Length of the leading process of GFP+ bipolar cells within the RMZ. (i) Ratio of length/width of the GFP+ cells within the RMZ as an indicator of cell shape.
- https://doi.org/10.7554/eLife.47673.006
Figure 3 with 1 supplement
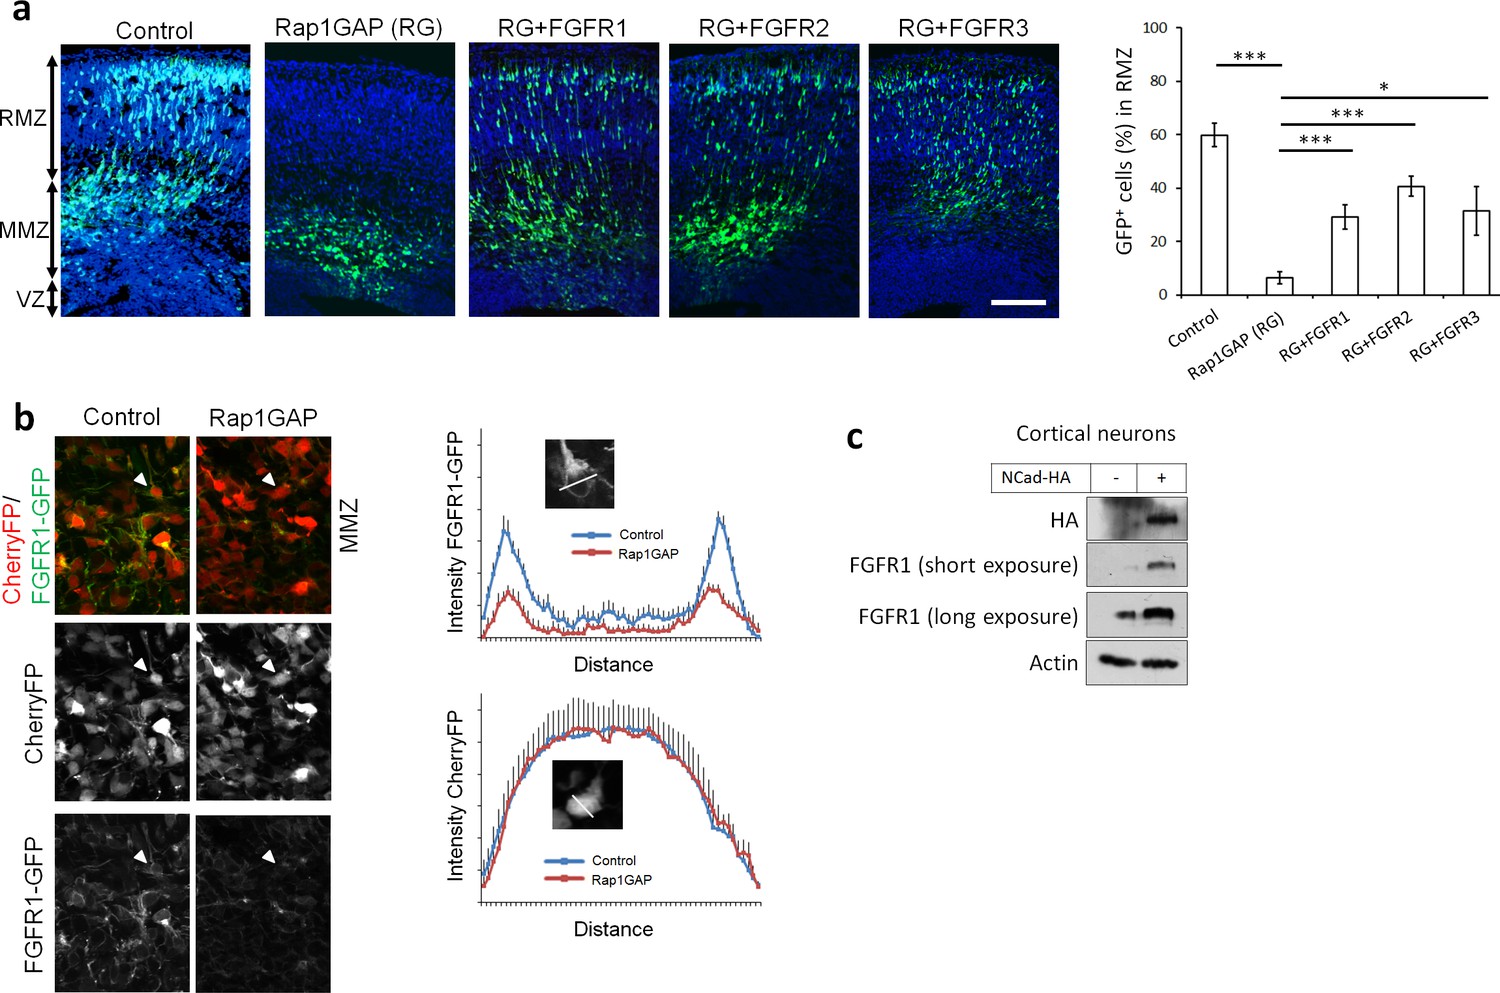
Rap1 and NCad regulate FGFR levels and function in multipolar migrating neurons.
(a) FGFR1, 2 and 3 partially rescue the neuronal migration phenotype induced by Rap1 inhibition. E14.5 embryos were electroporated in utero with pCAG-GFP, pNeuroD vector or pNeuroD-Rap1GAP (RG), and pNeuroD-FGFR1, 2 or 3 as shown. Cryosections were prepared 3 days later and labeled for DAPI (blue) and GFP (green). The cerebral wall was subdivided into radial morphology zone (RMZ), multipolar morphology zone (MMZ) and VZ. Graphs show the percentage of cells in the RMZ (mean ± s.e.m.). ***p<0.001; *p<0.05, P values: Rap1GAP (RG): 9.8E-8, RG+FGFR1: 7.0E-4, RG+FGFR2: 3.0E-4, RG+FGFR3: 0.020 (n = 4 Control, 4 Rap1GAP (RG), 7 RG+FGFR1, 7 RG+FGFR2, 4 RG+FGFR3). (b) Protein abundance of FGFR1-GFP is regulated by Rap1 in vivo. E14.5 embryos were electroporated in utero with a mixture of pCAG-CherryFP, pNeuroD-FGFR1-GFP and either vector or pNeuroD-Rap1GAP. Two days later, mCherry and FGFR1-GFP were detected by epifluorescence. The graphs show mean and standard deviation of image intensity measured across lines drawn through the center of the cell body for eight neurons in each case. (c) Embryonic cortical neurons were electroporated to overexpress pCAG-NCad-HA or with a control plasmid, cultured for 2 days then analyzed for the protein level of NCad-HA and endogenous FGFR1 by Western blot.
-
Figure 3—source data 1
FGFR1, 2 and 3 partially rescue the neuronal migration phenotype induced by Rap1 inhibition.
E14.5 embryos were electroporated in utero with pCAG-GFP, pNeuroD vector or pNeuroD-Rap1GAP (RG), and pNeuroD-FGFR1, 2 or three as shown. Cryosections were prepared 3 days later and labeled for DAPI (blue) and GFP (green). The cerebral wall was subdivided into radial morphology zone (RMZ), multipolar morphology zone (MMZ) and VZ. Table shows the percentage of cells in the RMZ. (n = 4 Control, 4 Rap1GAP (RG), 7 RG+FGFR1, 7 RG+FGFR2, 4 RG+FGFR3).
- https://doi.org/10.7554/eLife.47673.009
Figure 3—figure supplement 1
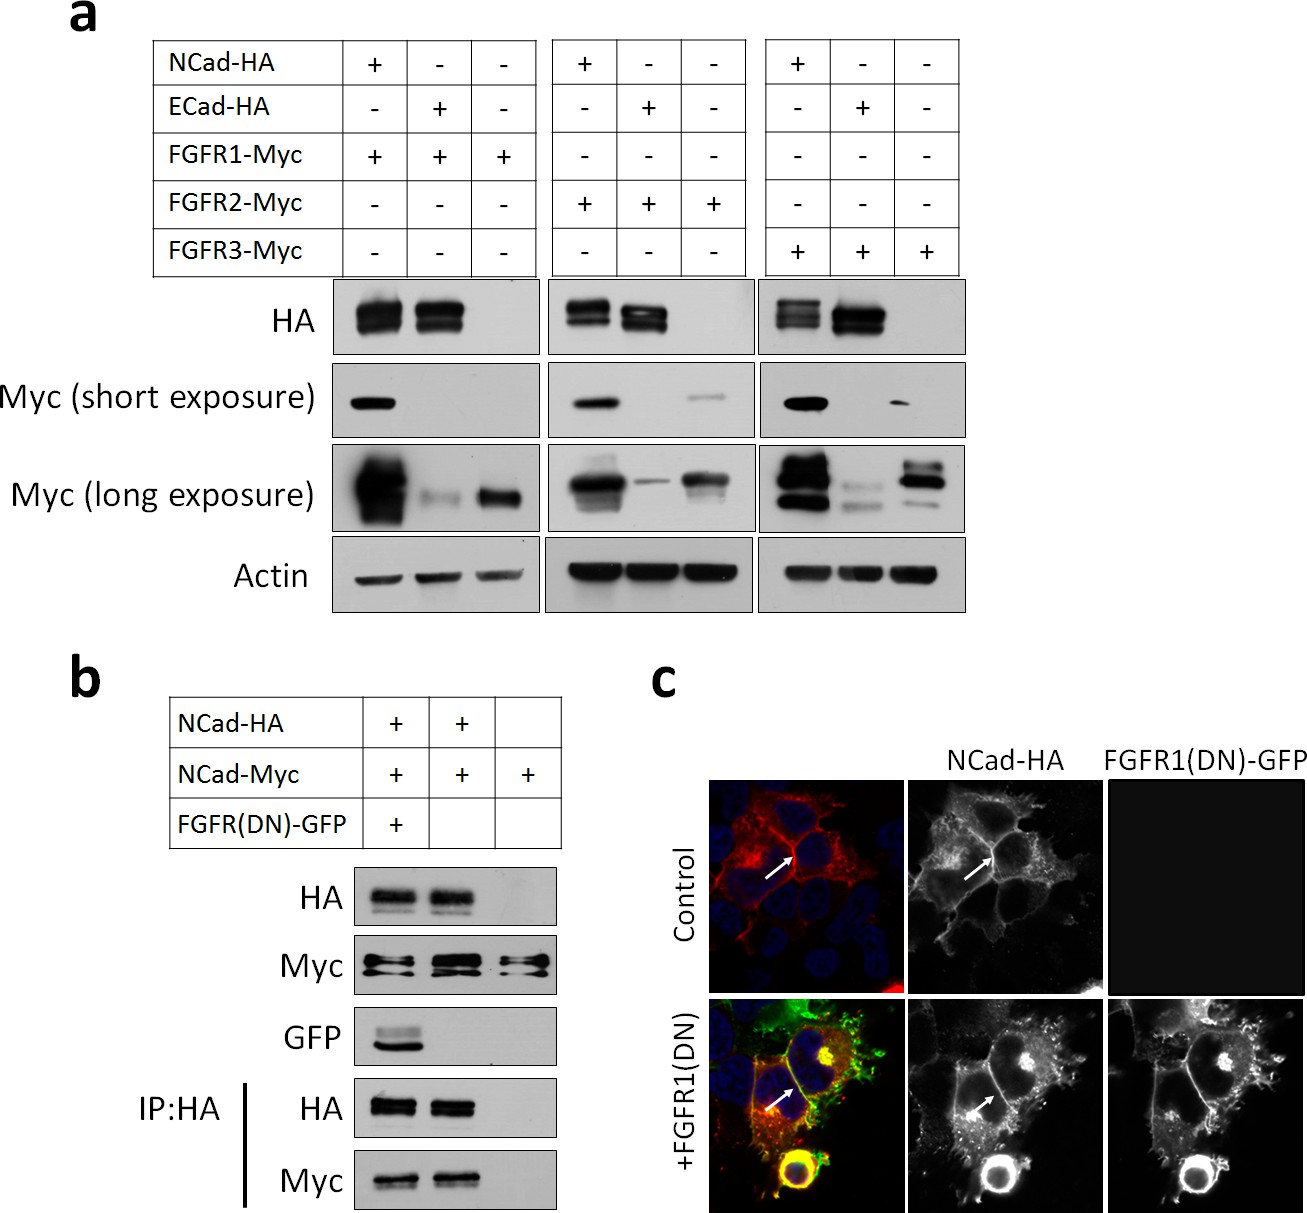
FGFR protein levels are increased by NCad but not by ECad.
(a) Cells were transfected with pCAG-NCad-HA, ECad-HA or vector together with pCAG-FGFR1, 2 or 3-Myc and protein abundance determined by Western blot 24 hr later. (b) FGFR1(DN) does not change NCad protein level and does not reduce NCad homophilic interaction. Cells were transfected with pCAG-NCad-Myc, pCAG-NCad-HA and pCAG-FGFR1(DN)-GFP or vector. One day later, cells were lysed and immunoprecipitated with anti-HA. Lysates and co-immunoprecipitated proteins were analyzed by Western blot. (c) NCad-HA accumulates at cell-cell junctions in the presence of FGFR(DN)-GFP. Immunostaining of cells expressing NCad-HA alone of with FGFR(DN)-GFP. Arrows show NCad-HA at cell-cell junctions.
Figure 4 with 2 supplements
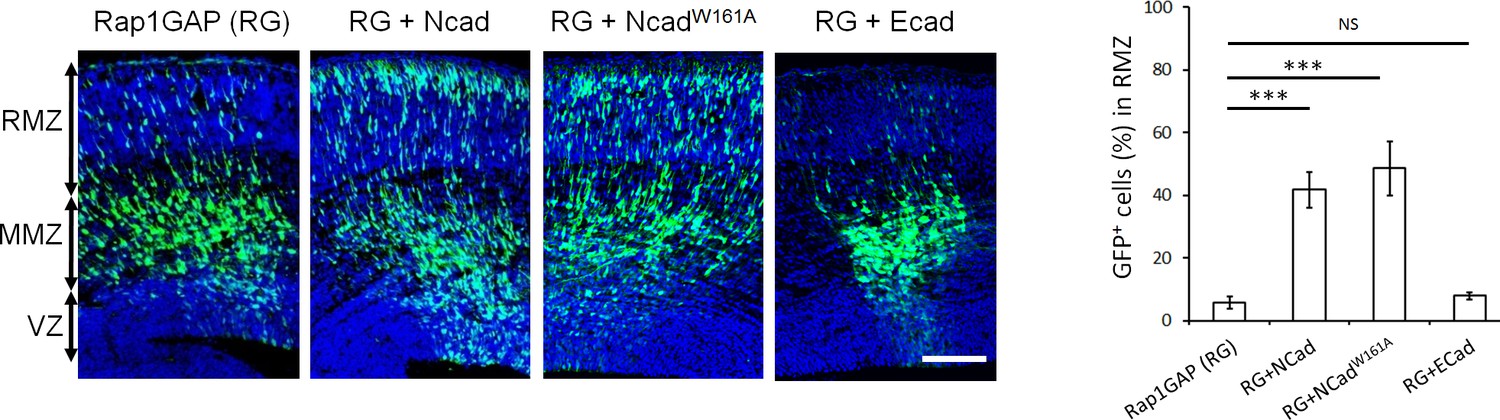
NCad homophilic binding mutant NCadW161A but not ECad rescues multipolar migration of Rap1-inhibited neurons.
E14.5 embryos were electroporated in utero with pCAG-GFP, pNeuroD-Rap1GAP (RG), and pNeuroD vector, NCad, NCadW161A or ECad. Cryosections were prepared 3 days later and labeled for DAPI (blue) or GFP (green). The graph shows the percentage of cells in the RMZ (mean ± s.e.m.). P values: RG+NCad: 9.8E-6, RG+ NCadW161A: 9.3E-6, RG+ECad: 0.213 (n = 5 Rap1GAP (RG), 5 RG+NCad, 6 RG+NCadW161A, 5 RG+ECad). Error bars, s.e.m. ***p<0.001, NS, not significant. Scale bar 100 µm.
-
Figure 4—source data 1
NCad homophilic binding mutant NCadW161A but not ECad rescues multipolar migration of Rap1-inhibited neurons.
E14.5 embryos were electroporated in utero with pCAG-GFP, pNeuroD-Rap1GAP (RG), and pNeuroD vector, NCad, NCadW161A or ECad. Cryosections were prepared 3 days later and labeled for DAPI (blue) or GFP (green). Table shows the percentage of cells in the RMZ. (n = 5 Rap1GAP (RG), 5 RG+NCad, 6 RG+NCadW161A, 5 RG+ECad).
- https://doi.org/10.7554/eLife.47673.013
Figure 4—figure supplement 1
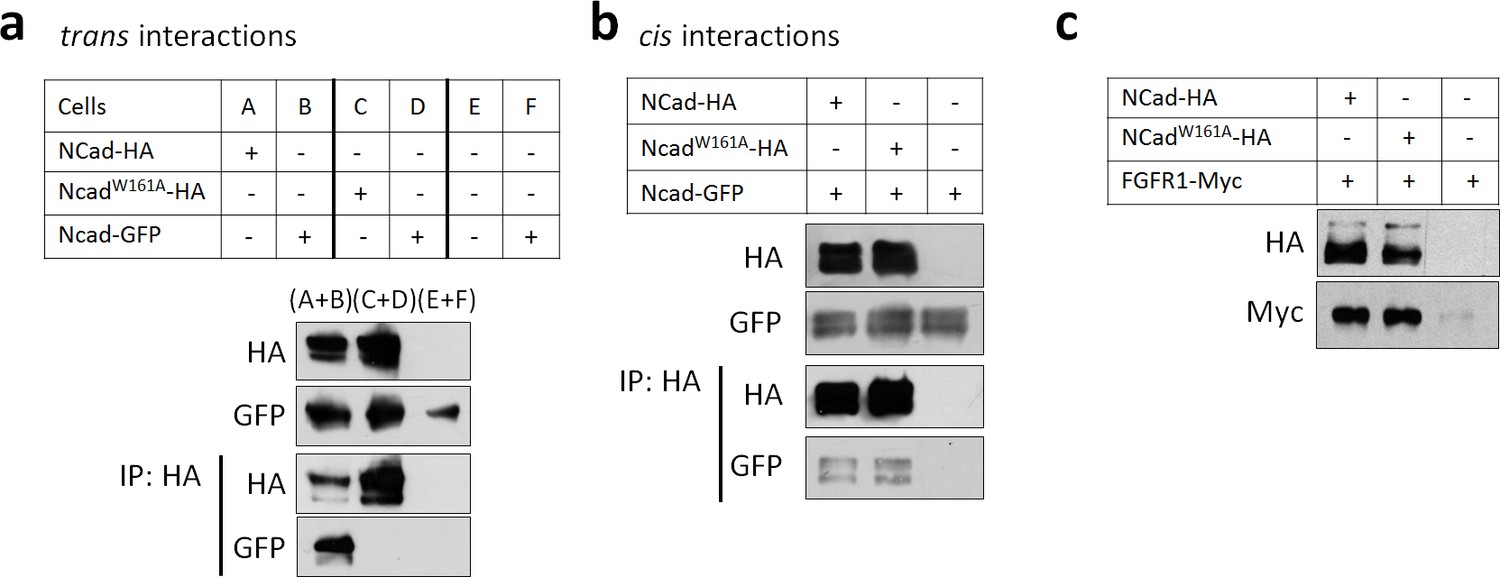
NCad W161A mutation inhibits trans but not cis homophilic binding.
(a) Cells were transfected separately to express NCad-GFP (B, D and F), NCad-HA (A), NCadW161A-HA (C), or vector (E). Twice the amount of DNA was used for NCadW161A-HA transfection to equalize the protein level with NCad-HA. After transfection, cells were mixed as described in the table and re-plated allowing only trans interactions to be detected. 24 hr later, cells were lysed, immunoprecipitated with anti-HA antibody, and proteins detected by Western blot. (b) Cells were co-transfected with NCad-GFP and either NCad-HA, NCadW161A-HA or vector. Cells were then left in contact or kept in suspension to prevent cell contact and enable cis interactions only. Receptor interactions were then tested by co-immunoprecipitation as above. (c) NCadW161A increased the protein abundance of FGFR1 as efficiently as wild-type NCad. 293T cells were transfected for the expression of the indicated proteins. Twice the amount of DNA was used for NCadW161A in order to equalize protein levels. Cell lysates were analyzed by Western blot. All experiments were repeated three times with similar results.
Figure 4—figure supplement 2
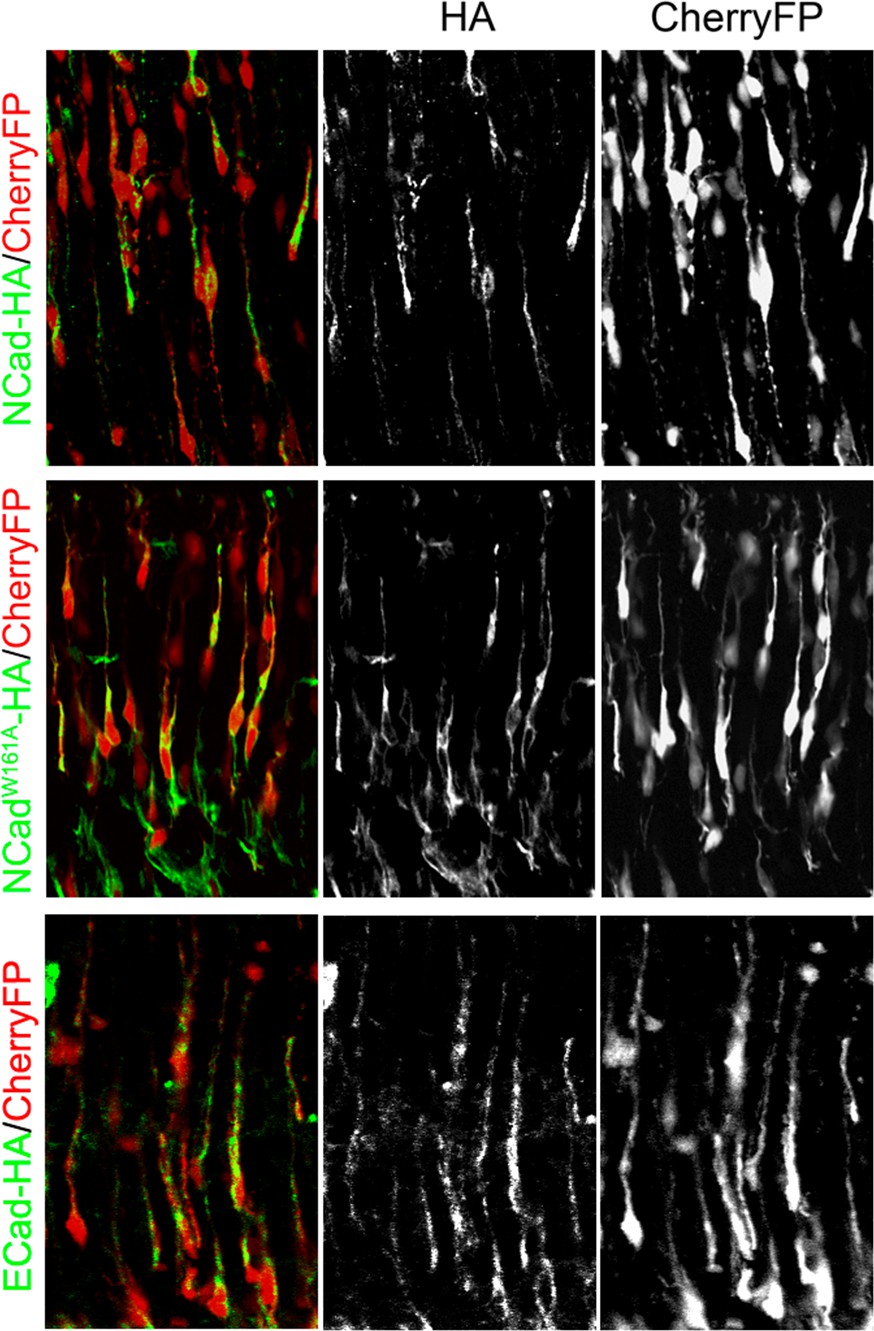
Ncad-HA, NcadW161A-HA and ECad-HA are expressed at equal levels by in utero electroporation.
Embryos were electroporated in utero at E14.5 with the indicated genes under the NeuroD promoter (HA immunolabelling in green) and CherryFP under the ubiquitous CAG promoter (Red). Brains were analyzed 3 days after electroporation.
Figure 5 with 1 supplement
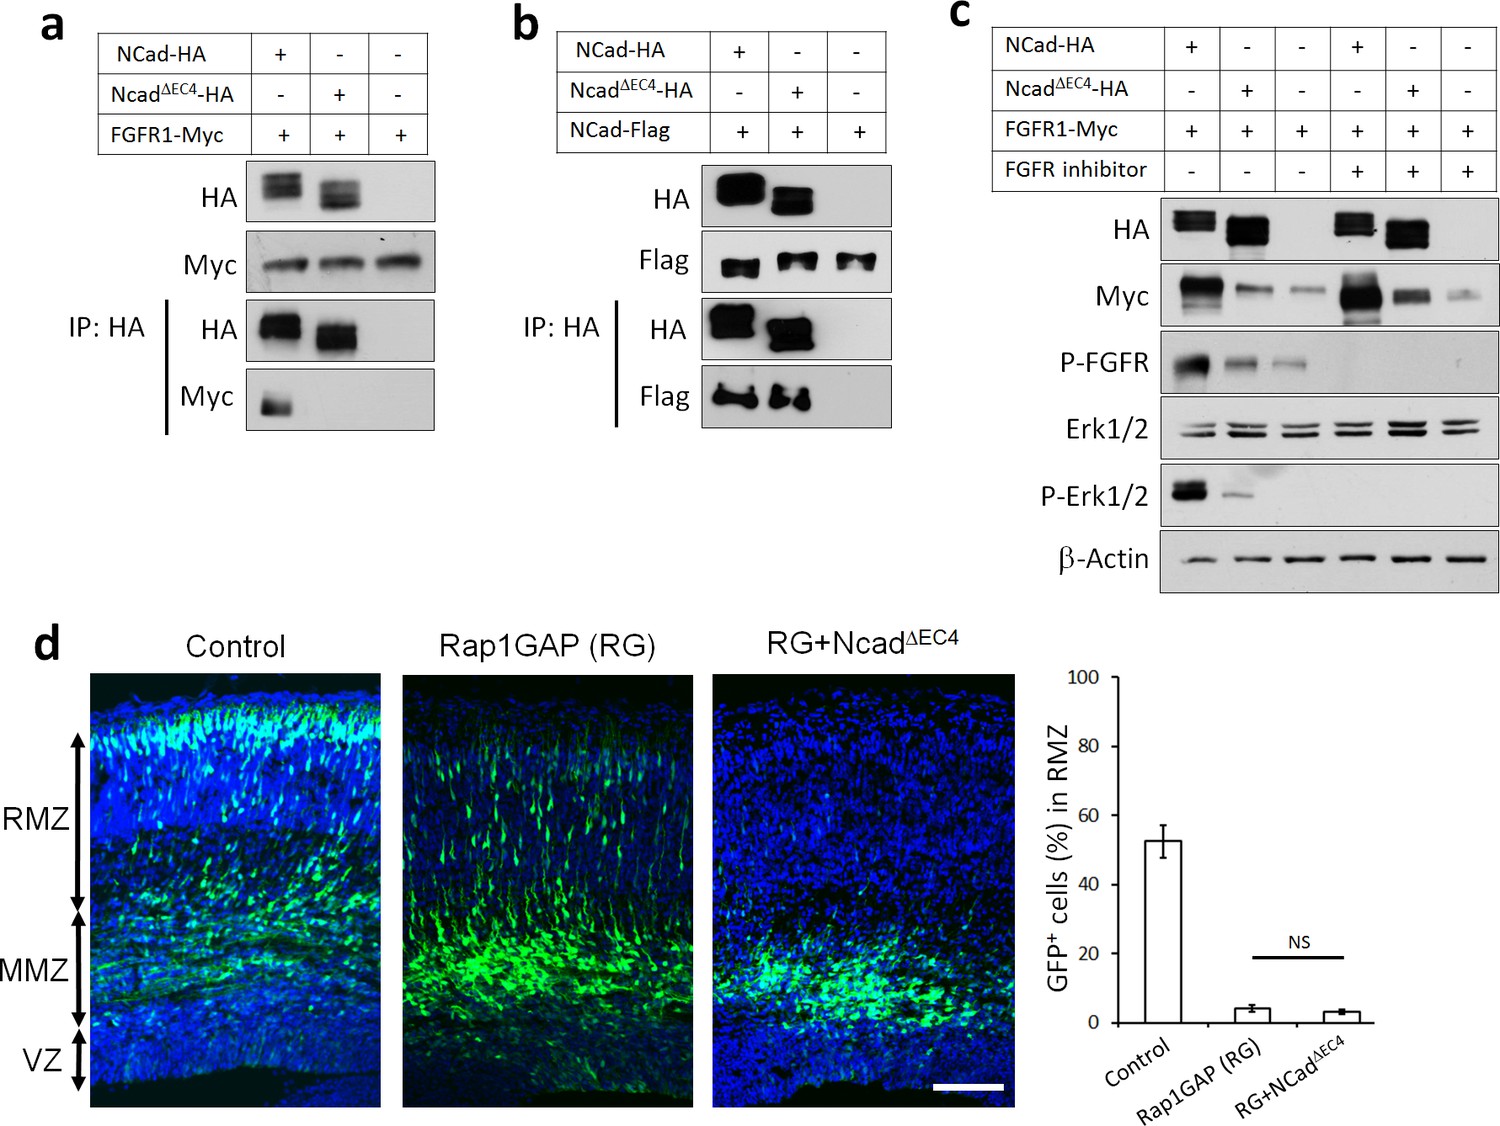
NCad-FGFR cis interaction through NCad EC4 is required for multipolar migration in vivo.
(a) NCad EC4 is required for FGFR1 binding in vitro. Cells were transfected with pCAG-FGFR1-Myc and pCAG-NCad-HA, NCadΔEC4-HA or vector. To equalize FGFR1-Myc expression, half the amount of FGFR1-Myc was transfected with wildtype NCad. One day later, cells were lysed and immunoprecipitated with anti-HA. Lysates and co-immunoprecipitated proteins were analyzed by Western blot. (b) EC4 is dispensable for NCad homophilic binding. Cells were transfected with pCAG-NCad-FLAG and pCAG-NCad-HA, NCadΔEC4-HA or vector. One day later, cells were lysed and immunoprecipitated with anti-HA. Lysates and co-immunoprecipitated proteins were analyzed by Western blot. (c) NCad increases FGFR protein level dependent on EC4, and increases FGFR and Erk1/2 phosphorylation dependent on EC4 and FGFR kinase activity. HEK293T cells were transfected with equal amounts of pCAG-FGFR1-Myc DNA and either pCAG-NCad-HA, pCAG-NCadΔEC4-HA or vector. 24 hr after transfection, the specific FGFR inhibitor Debio1347 was used at 5 µM for 2 hr. Lysates were analyzed by Western blot using the indicated antibodies. Experiments a–c) were repeated independently three times with similar results. (d) NCad EC4 is required for the multipolar migration. E14.5 embryos were electroporated in utero with pCAG-GFP and pNeuroD-Rap1GAP (RG), pNeuroD-NCadΔEC4-HA or vector. Cryosections were prepared three days later and labeled for DAPI (blue) and GFP (green). The graph shows the percentage of cells in the RMZ. n = 4 control, 4 Rap1GAP (RG), 6 RG+ NCadΔEC4. P value: 0.116. Scale bar 100 µm. Error bars, s.e.m., NS, not significant.
-
Figure 5—source data 1
NCad EC4 is required for the multipolar migration.
E14.5 embryos were electroporated in utero with pCAG-GFP and pNeuroD-Rap1GAP (RG), pNeuroD-NCadDEC4-HA or vector. Cryosections were prepared three days later and labeled for DAPI (blue) and GFP (green). The table shows the percentage of cells in the RMZ. n = 4 control, 4 Rap1GAP (RG), 6 RG+ NCadDEC4.
- https://doi.org/10.7554/eLife.47673.016
Figure 5—figure supplement 1
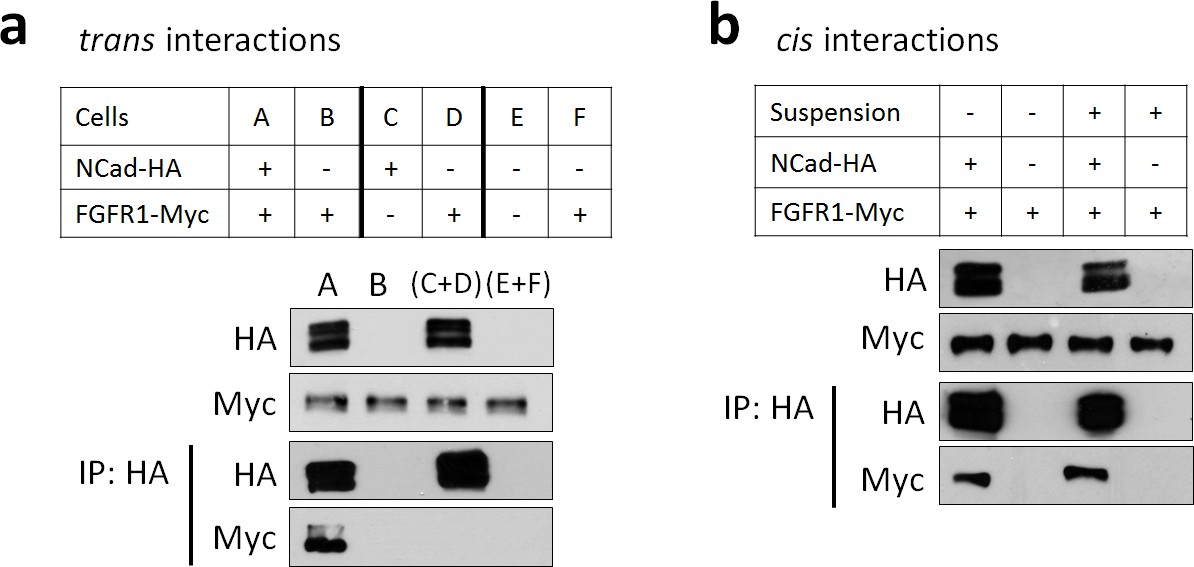
FGFR1-NCad binding does not occur in trans, between cells but occurs in cis, within cells.
(a) FGFR1-NCad binding does not occur in trans, between cells. Cells were transfected with FGFR1-Myc and NCad-HA together (A), NCad-HA and vector (C), or FGFR1-Myc and vector (D and F). The transfected cells were removed from the dish, mixed as shown, and re-plated to allow cell-cell contact. One day later the cells were lysed and immunoprecipitated with anti-HA. Lysates and immunoprecipitates were analyzed by Western blotting. FGFR1-Myc co-precipitated with NCad-HA when co-expressed (A) but not when binding could only occur between cells (C+D). (b) FGFR1-NCad binding occurs in cis, within cells. Cells were transfected with FGFR1-Myc and NCad-HA or vector, then left in contact or placed in suspension to prevent cell-cell interaction. One day later the cells were lysed and immunoprecipitated with anti-HA. Lysates and immunoprecipitates were analyzed by Western blotting. FGFR1-Myc co-precipitated with NCad-HA whether or not cell-cell contact was permitted. All experiments were repeated three times with similar results.
Figure 6 with 1 supplement
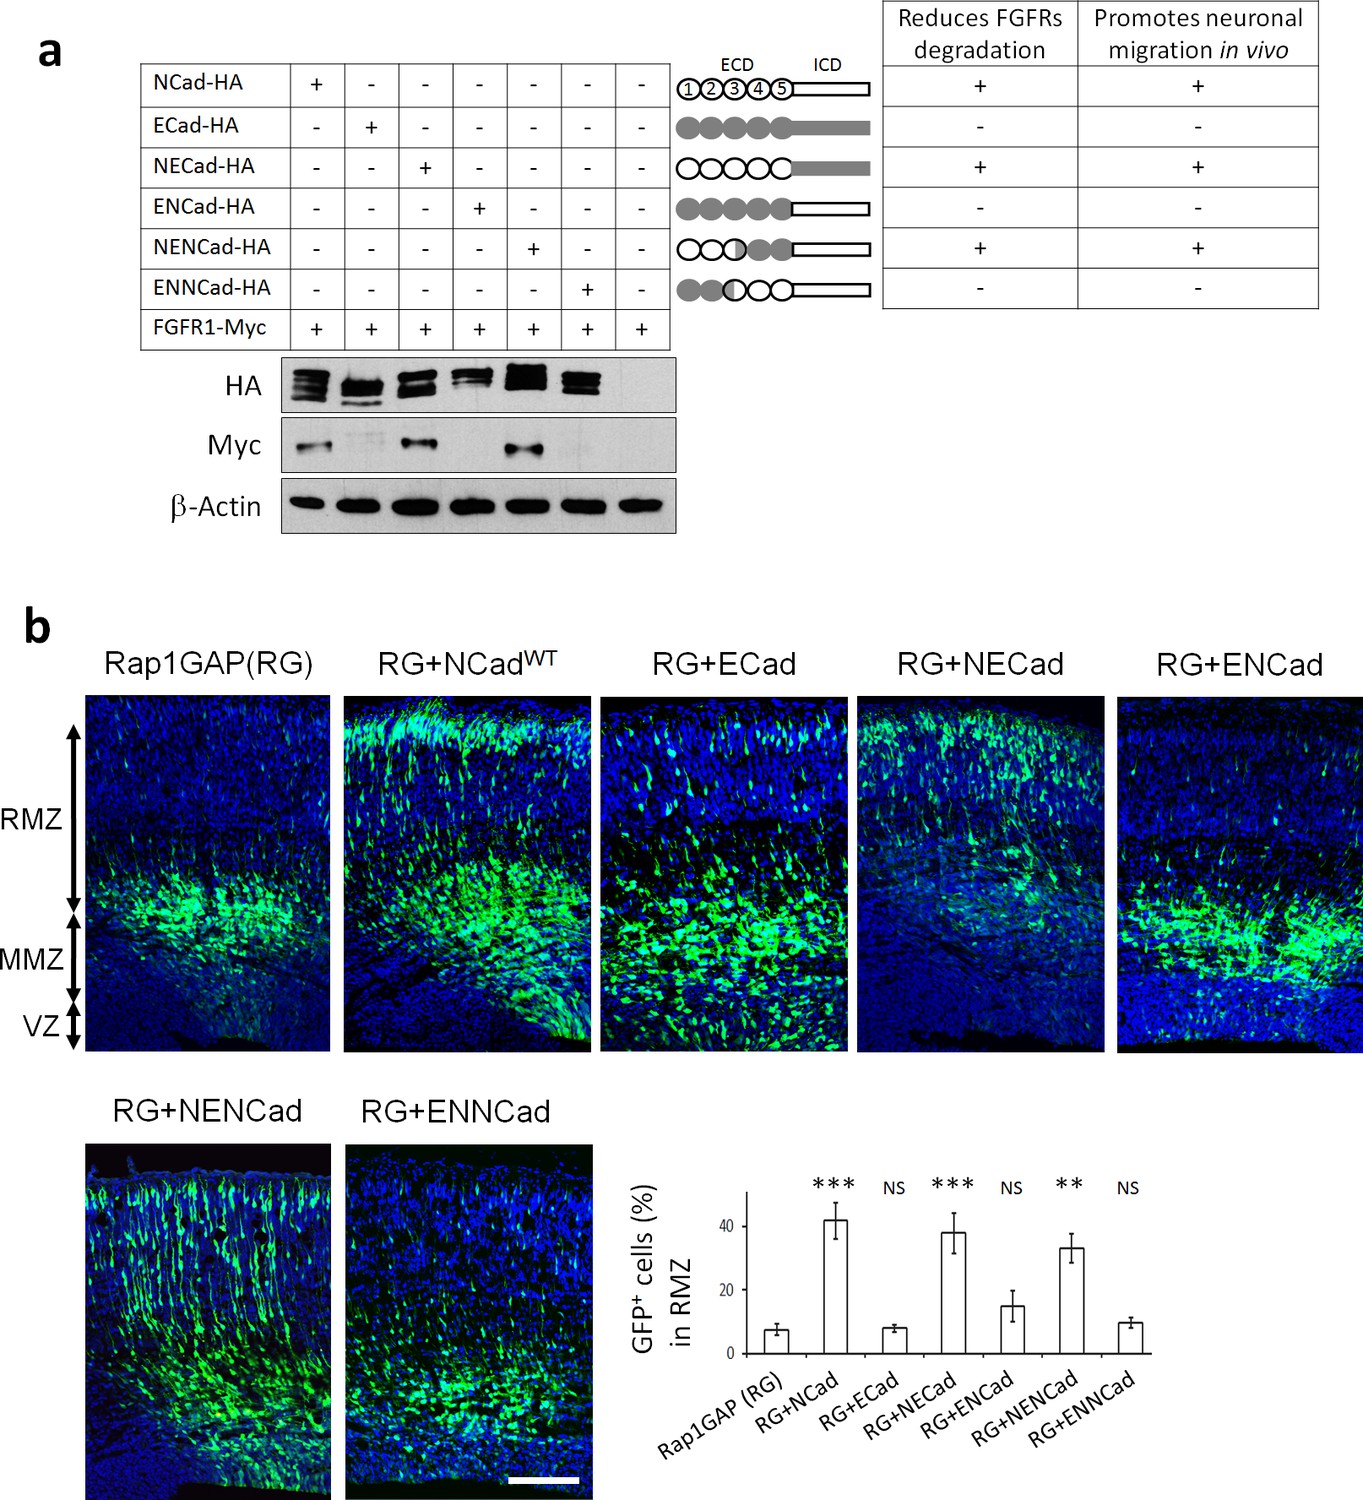
NCad EC1-2 are required to increase FGFR protein levels and stimulate multipolar migration in vivo.
(a) NCad EC1-2 are necessary to increase FGFR protein abundance. Cells were transfected to express the indicated proteins. 2 days later, protein levels were observed by Western blot. Similar results were obtained from three independent experiments. The figure includes a schematic representing the chimeric proteins used. (b) NCad EC1-2 promote neuronal migration in vivo. In utero electroporation at embryonic day E14.5 and analysis 3 days later. pNeuroD plasmids coding for the indicated proteins and pCAG-GFP were co-electroporated. The graph shows the percentage of cells in the RMZ (mean ± s.e.m.). P values: RG+NCad: 9.8E-6, RG+ECad: 0.215, RG+NECad: 5.4E-4, RG+ENCad: 0.080, RG+NENCad: 4.0E-3, RG+ENNCad: 0.206. n = 5 Rap1GAP (RG), 5 RG+NCad, 5 RG+ECad, 8 RG+NECad, 5 RG+ENCad, 5 RG+NENCad, 5 RG+ENNCad. Error bars, s.e.m. ***p<0.001, **p<0.01, NS, not significant.
-
Figure 6—source data 1
NCad EC1-2 promote neuronal migration in vivo.
In utero electroporation at embryonic day E14.5 and analysis 3 days later. pNeuroD plasmids coding for the indicated proteins and pCAG-GFP were co-electroporated. The table shows the percentage of cells in the RMZ. n = 5 Rap1GAP (RG), 5 RG+NCad, 5 RG+ECad, 8 RG+NECad, 5 RG+ENCad, 5 RG+NENCad, 5 RG+ENNCad.
- https://doi.org/10.7554/eLife.47673.019
Figure 6—figure supplement 1
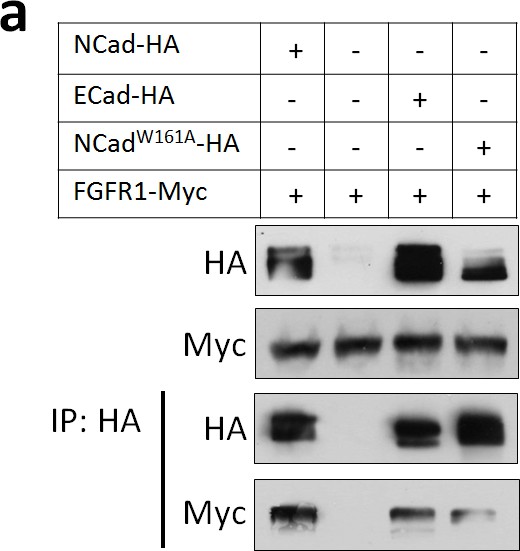
FGFR1 binds NCad, NCadW161A and ECad HEK293T cells were transfected with FGFR1-Myc and NCad-HA, vector, ECad-HA or NCadW161A-HA.
24 hr later, cells were lysed and lysates and anti-HA immunoprecipitates analyzed by Western blot. To equalize FGFR1-Myc expression level, half the amount of FGFR1-Myc DNA was transfected with NCad-HA or NCadW161A-HA.
Figure 7 with 1 supplement

FGFRs K27/K29-linked polyubiquitination and lysosomal degradation controls multipolar neuronal migration in vivo.
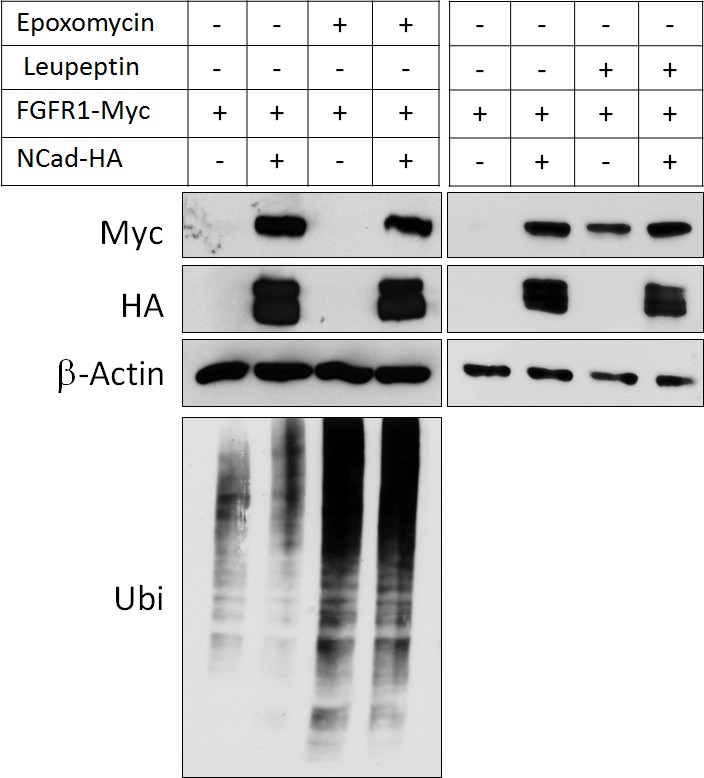
(a) NCad but not NCadΔEC4 inhibits FGFR1 ubiquitination. Cells were transfected with pCAG-FGFR1-Myc and pCAG-NCad, NCadΔEC4-HA or vector. One day later, cells were lysed and proteins immunoprecipitated with anti-Myc. Lysates and immunoprecipitates were analyzed with Western blotting using antibodies to Myc and ubiquitin. To equalize FGFR1-Myc levels, half the amount of DNA was used for FGFR1-Myc when expressed with NCad-HA. (b) HA-UbiKO but not HA-UbiWT increased FGFR1 protein level and decreased FGFR1 ubiquitination. Cells were transfected with pCAG-FGFR1-Myc and HA-UbiKO or HA-UbiWT. One day later, cells were lysed and proteins immunoprecipitated with anti-Myc. Lysates and immunoprecipitates were analyzed with Western blotting using antibodies to Myc and HA. (c) Inhibition of K27- and K29-linked polyubiquitination increases FGFR1 protein level. Ubiquitin-GFP mutants in which one lysine is mutated into arginine were used to identify lysine residues required for polyubiquitin chain formation. Co-translational cleavage detaches the GFP and frees the terminal glycine of ubiquitin for subsequent conjugation (Boname et al., 2010). The cleaved GFP was used to quantify ubiquitin mutant expression. The graph shows the relative FGFR1-Myc band intensity when expressed in the presence or absence of NCad-HA and in the presence of an ubiquitin mutant as indicated (mean ± s.e.m.). P values: UbiK6R: 0.026, UbiK11R: 0.034, UbiK27R: 0.490, UbiK29R: 0.466, UbiK33R: 0.036, UbiK48R: 0.032, UbiK63R: 0.024, UbiWT: 4.8E-4. n = 4 UbiK6R, 3 UbiK11R, 3 UbiK27R, 3 UbiK29R, 4 UbiK33R, 4 UbiK48R, 3 UbiK63R, 8 UbiWT. (d) FGFR1 levels remain normal only when both K27- and K29-linked polyubiquitination are permitted. HA-Ubiquitin mutants in which all but one lysine is mutated into arginine were used to allow only one type of polyubiquitin chain formation (UbiK27 and UbiK29). (e) Inhibition of K27-linked polyubiquitin chain formation in vivo rescues the migration defect of Rap1GAP-expressing cells. In utero electroporation at embryonic day E14.5 and analysis 3 days later. Plasmids coding for the indicated proteins and GFP were co-electroporated. The graph shows the percentage of cells in the RMZ (mean ± s.e.m.). P values: RG+UbiK27R: 1.7E-3, RG+UbiWT: 0.471. n = 4 Rap1GAP (RG), 8 RG+UbiK27R, 6 RG+UbiWT. (f) Endogenous FGFR1 is degraded by the lysosome in vivo. Primary embryonic cortical neurons were cultured in the presence of 250 nM proteasome inhibitor epoxomycin or 300 µM lysosome inhibitor leupeptin for 4 hr and analyzed by Western blot. Similar results were obtained in three independent experiments. Scale bar 100 µm. *p<0.05, **p<0.01 ***p<0.001, NS not significant.
-
Figure 7—source data 1
Inhibition of K27- and K29-linked polyubiquitination increases FGFR1 protein level and rescues the migration defect of Rap1GAP-expressing cells.
(c) Inhibition of K27- and K29-linked polyubiquitination increases FGFR1 protein level. Ubiquitin-GFP mutants in which one lysine is mutated into arginine were used to identify lysine residues required for polyubiquitin chain formation. Co-translational cleavage detaches the GFP and frees the terminal glycine of ubiquitin for subsequent conjugation (Boname et al., 2010). The cleaved GFP was used to quantify ubiquitin mutant expression. The table shows the relative FGFR1-Myc band intensity when expressed in the presence or absence of NCad-HA and in the presence of an ubiquitin mutant as indicated (mean ± s.e.m.). n = 4 UbiK6R, 3 UbiK11R, 3 UbiK27R, 3 UbiK29R, 4 UbiK33R, 4 UbiK48R, 3 UbiK63R, 8 UbiWT. (e) Inhibition of K27-linked polyubiquitin chain formation in vivo rescues the migration defect of Rap1GAP-expressing cells. In utero electroporation at embryonic day E14.5 and analysis 3 days later. Plasmids coding for the indicated proteins and GFP were co-electroporated. The table shows the percentage of cells in the RMZ (mean ± s.e.m.). n = 4 Rap1GAP (RG), 8 RG+UbiK27R, 6 RG+UbiWT.
- https://doi.org/10.7554/eLife.47673.022
Figure 7—figure supplement 1
NCad over-expression and lysosomal inhibition increase FGFR1 protein level to the same extent.
Cells co-transfected with pCAG-FGFR1-Myc and pCAG-NCad-HA or vector were incubated with 250 nM proteasome inhibitor epoxomycin or 300 µM lysosome inhibitor leupeptin for 4 hr and analyzed by Western blot. Epoxomycin inhibited proteasomal degradation of many ubiquitinated cell proteins, as indicated by an increase in total protein ubiquitination.
Figure 8 with 1 supplement
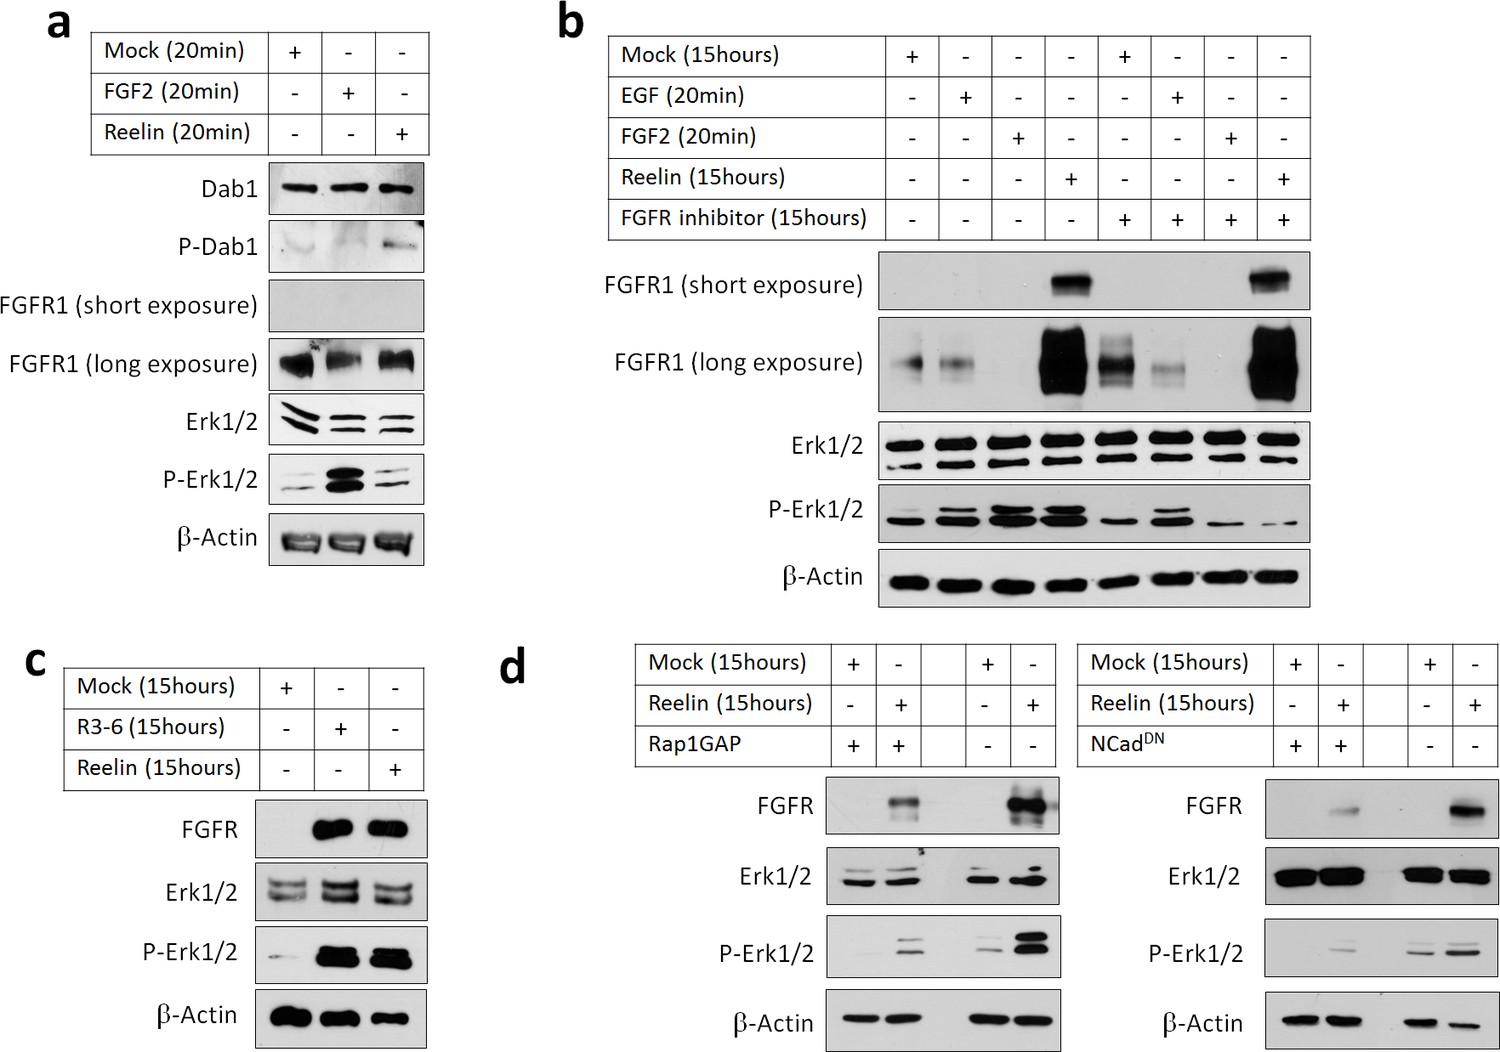
Reelin induces Rap1- and NCad-dependent FGFR and Erk1/2 activity in cortical neurons.
E16.5 mouse cortical neurons were cultured for 3 days then stimulated with FGF2 or Reelin for different times. All experiments were repeated three times with similar results. (a) Short-term Reelin stimulation does not increase FGFR1 protein level or Erk1/2 phosphorylation. Neurons were stimulated for 20 min with 75 ng/ml FGF2, Mock- or Reelin-conditioned media. (b) Long-term Reelin stimulation increases FGFR1 protein level and FGFR1 and Erk1/2 phosphorylation dependent on FGFR1 kinase activity. Neurons were stimulated for 15 hr with Mock- or Reelin-conditioned media or for 20 min with FGF2 or EGF. FGFR inhibitor Debio1347 was used at a concentration of 5 µM for a total of 17 hr before cell lysis. (c) Reelin fragment R3-6 induces FGFR1 accumulation and Erk1/2 activation. Neurons were stimulated for 15 hr with Mock, R3-6 or Reelin-conditioned medium. (d) Long-term Reelin stimulation of FGFR1 protein level and Erk phosphorylation requires Rap1 and NCad. Neurons were electroporated with pCAG-Rap1GAP, pCAG-NCadDN, or vector, incubated for 2 days, then stimulated with Mock- or Reelin-conditioned media for 15 hr and analyzed by Western blotting.
Figure 8—figure supplement 1
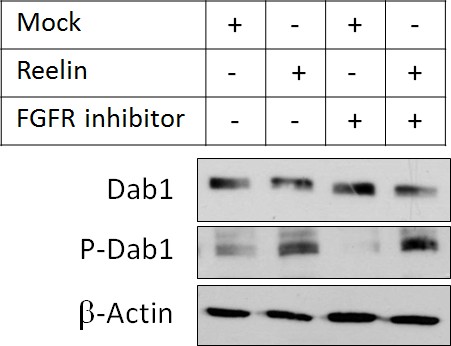
FGFR inhibitor does not inhibit Dab1 phosphorylation.
E16.5 mouse cortical neurons were cultured in the presence of mock-conditioned or Reelin-conditioned media for 20 min. 5 μM FGFR inhibitor Debio1347 was added 2 hr before and during stimulations. Cell lysates were analyzed by Western blotting.
Figure 9
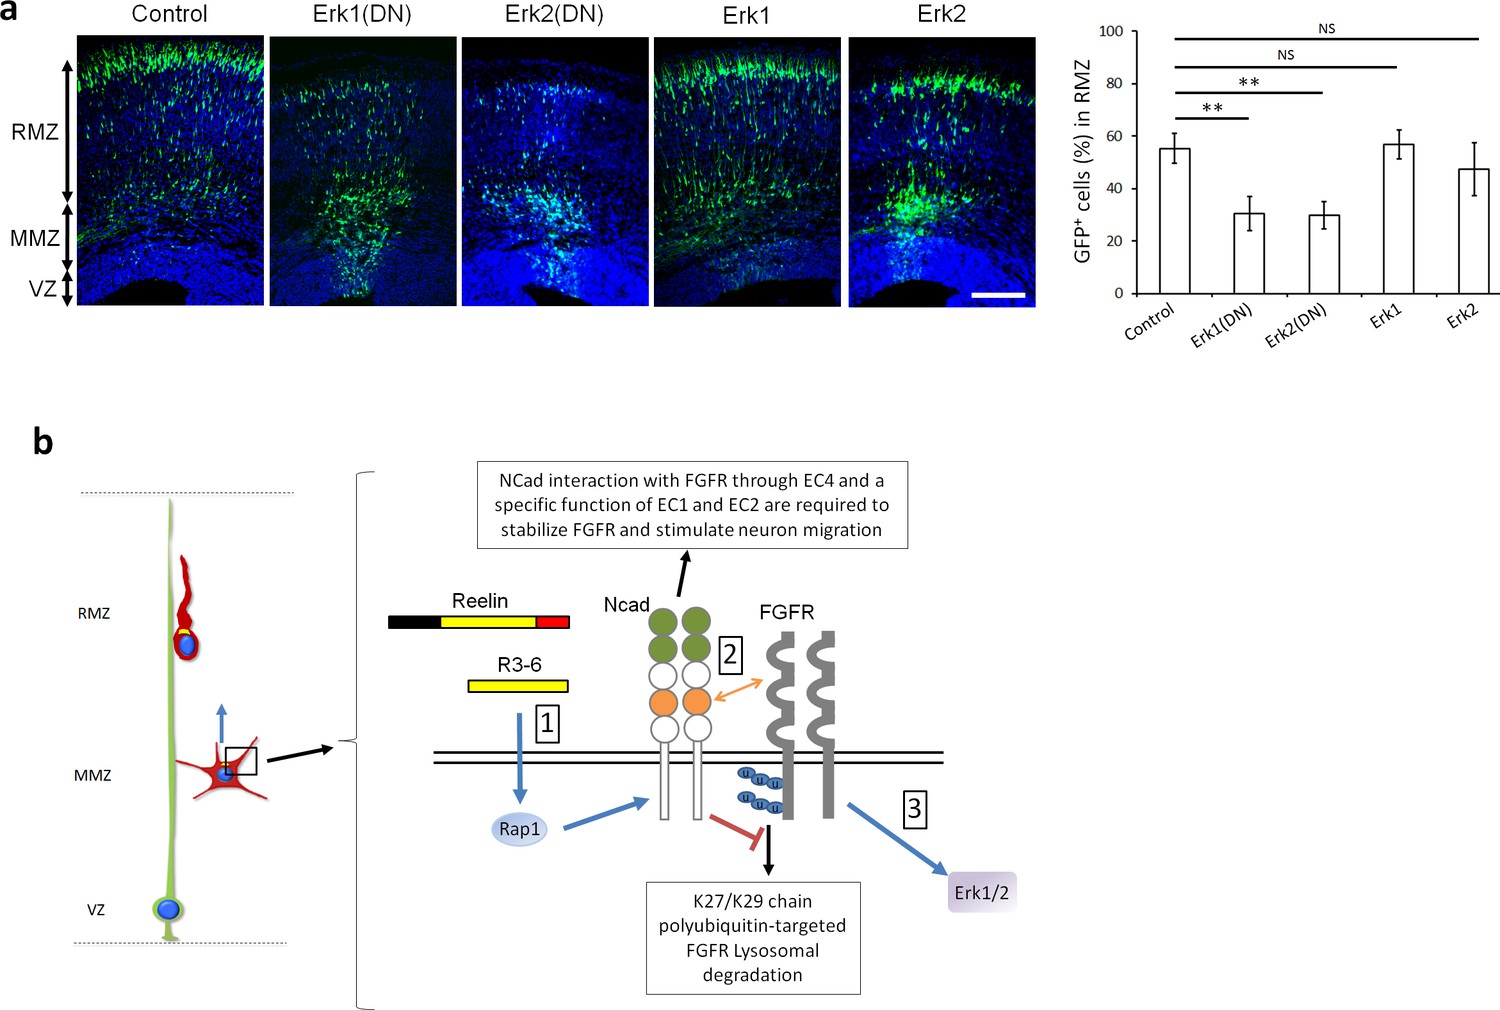
Erk1 and Erk2 regulate multipolar migration in vivo.
(a) Erk1/2 inhibition impairs multipolar migration. E14.5 embryos were electroporated in utero with pCAG-GFP and dominant-negative (DN) or wildtype pNeuroD-Erk1/2. Cryosections were prepared three days later. The graph shows the percentage of cells in the RMZ (mean ± s.e.m.). P values: Erk1(DN): 1.4E-3, Erk2(DN): 1.2E-3, Erk1: 0.497, Erk2: 0.173. n = 4 Control, 6 Erk1(DN), 5 Erk2(DN), 6 Erk1, 4 Erk2. Scale bar 100 µm; Error bars, s.e.m, **p<0.01, NS, not significant. (b) Working model. (1) Reelin, its central fragment R3-6, and possibly other signals activate Rap1 in multipolar neurons. Rap1 upregulates NCad on the cell surface. (2) The NCad fourth cadherin extracellular domain (EC4, orange color) binds FGFRs. This binding, together with a specific function of NCad EC1 and EC2 (green color) prevents FGFR polyubiquitination by mixed K27- and K29-linked polyubiquitin chains and lysosomal degradation. (3) Decreased FGFR ubiquitination causes FGFR accumulation and persistent activation of FGFR signaling pathways, including Erk1/2. Erk1/2 and maybe other effectors are required for the multipolar migration in vivo. The mechanisms by which NCad EC1-2 regulate FGFR stability and by which Erk1/2 regulate migration remain unknown. See text for discussion.
-
Figure 9—source data 1
Erk1/2 inhibition impairs multipolar migration.
E14.5 embryos were electroporated in utero with pCAG-GFP and dominant-negative (DN) or wildtype pNeuroD-Erk1/2. Cryosections were prepared three days later. The table shows the percentage of cells in the RMZ. n = 4 Control, 6 Erk1(DN), 5 Erk2(DN), 6 Erk1, 4 Erk2.
- https://doi.org/10.7554/eLife.47673.026
Tables
Key resources table
| Reagent type (species) or resource | Designation | Source or reference | Identifiers | Additional information |
|---|---|---|---|---|
| Strain, strain background (Escherichia coli) | One shot TOP10 | Thermo Fisher Scientific | Cat #: C404010 | Chemically Competent Cells |
| Strain, strain background (Mus musculus) | CD1 | Charles River Laboratories | 022 | |
| Cell line (Homo sapiens) | HEK293T cells | ATCC | CRL-3216 | |
| Cell line (Mus musculus) | Embryonic primary mouse cortical neuron | This paper | N/A | Primary culture at E16,5. |
| Antibody | Anti-HA.11 clone 16B12 (Mouse monoclonal) | Eurogenetic | Cat# MMS-101R-500, RRID: AB_10063630 | WB (1:8000) IF (1:100) IP (1:400) |
| Antibody | Anti-Myc (Rabbit polyclonal) | Cell Signaling Technology | Cat# 2272, RRID: AB_10692100 | WB (1:5000) |
| Antibody | Anti-Myc-tag clone 9B11 (Mouse monoclonal) | Cell Signaling Technology | Cat# 2276, RRID: AB_331783 | IP (1:200) |
| Antibody | Anti mono- and polyubiquitinated conjugated, clone FK2 (Mouse monoclonal) | Enzo Life Science | Cat# BML-PW8810-0500, RRID: AB_2051891 | WB (1:1000) |
| Antibody | Anti-B-actin (Mouse monoclonal) | Thermo Fisher Scientific | Cat# MA5-15739, RRID: AB_10979409 | WB (1:5000) |
| Antibody | Anti- p44/42 MAPK (Erk1/2) (Rabbit polyclonal) | Cell Signaling Technology | Cat# 9102, RRID: AB_330744 | WB (1:5000) |
| Antibody | Anti-Phospho-p44/42 MAPK (Erk1/2) (Thr202/Tyr204) clone D13.14.4E (Rabbit monoclonal) | Cell Signaling Technology | Cat# 4370, RRID: AB_2315112 | WB (1:5000) |
| Antibody | Anti-FGFR1(D8E4) XP (Rabbit monoclonal) | Cell Signaling Technology | Cat# 9740, RRID: AB_11178519 | WB (1:500) |
| Antibody | Anti- Dab-1 (E1) (Mouse) | Jossin et al., 2004 | N/A | WB (1:1000) |
| Antibody | Phospho-Tyrosine (P-Tyr-100) #9411(Mouse Monoclonal) | Cell Signaling Technology | Cat# 9411, RRID: AB_331228 | WB (1:1000) |
| Antibody | Anti-Reelin(G10) Mouse | de Bergeyck et al., 1997 | N/A | WB (1:1000) |
| Antibody | Anti-DYKDDDDK (FLAG) Tag (FG4R) (Mouse monoclonal) | Thermo Fisher Scientific | Cat# MA5-15255, RRID: AB_2537646 | WB (1:5000) |
| Antibody | Anti-GFP (Rabbit polyclonal) | Thermo Fisher Scientific | Cat# A-11122, RRID: AB_221569 | WB (1:5000) |
| Antibody | Anti-Ki67 (Mouse monoclonal) | BD Biosciences | Cat# 556003, RRID: AB_396287 | IF (1:100) |
| Antibody | Anti- Sox2 (L1D6A2) (Mouse monoclonal) | Cell Signaling Technology | Cat# 4900, RRID: AB_10560516 | IF (1:100) |
| Antibody | Anti-Tbr2 (Rabbit polyclonal) | Abcam | Cat# ab23345, RRID: AB_778267 | IF (1:100) |
| Antibody | Anti-Satb2 (mouse | Abcam | Cat# ab51502 RRID: AB_882455 | IF (1:100) |
| Antibody | Anti-cleaved caspase3 (Rabbit polyclonal) | Cell Signaling Technology | Cat# 9661, RRID: AB_2341188 | IF (1:100) |
| Antibody | GM130 (Mouse monoclonal) | BD Biosciences | Cat# 610823, RRID: AB_398142 | IF (1:100) |
| Antibody | Anti-mouse IgG, HRP-linked Antibody (horse) | Cell Signaling Technology | Cat# 7076, RRID: AB_330924 | WB (1:5000) |
| Antibody | Anti-rabbit IgG, HRP-linked Antibody (goat polyclonal) | Cell Signaling Technology | Cat# 7074, RRID: AB_2099233 | WB (1:5000) |
| Antibody | Anti-Mouse IgG (H+L) Cross-Adsorbed Secondary Antibody, Alexa Fluor 488 (Goat Polyclonal) | invitrogen | Cat# A-11001, RRID: AB_2534069 | IF (1:100) |
| Antibody | Anti-Rabbit IgG (H+L) Antibody, Alexa Fluor 488 Conjugated (Goat polyclonal) | invitrogen | Cat# A-11008, RRID: AB_143165 | IF (1:100) |
| Antibody | Anti-Mouse IgG (H+L) Antibody, Alexa Fluor 568 Conjugated (goat polyclonal) | invitrogen | Cat# A-11004, RRID: AB_2534072 | IF (1:100) |
| Antibody | Anti-Rabbit IgG (H+L) Cross-Adsorbed Secondary Antibody, Alexa Fluor 568 (Goat polyclonal) | invitrogen | Cat# A-11011, RRID: AB_143157 | IF (1:100) |
| Antibody | Anti-Mouse IgG (H+L) Cross-Adsorbed Secondary Antibody, Alexa Fluor 647 (Goat polyclonal) | invitrogen | Cat# A-21235, RRID: AB_2535804 | IF (1:100) |
| Antibody | Anti-Rabbit IgG (H+L) Cross-Adsorbed Secondary Antibody, Alexa Fluor 647 (Goat polyclonal) | invitrogen | Cat# A-21244, RRID: AB_2535812 | IF (1:100) |
| Recombinant DNA reagent | NeuroD: Rap1GAP | Jossin and Cooper, 2011 | N/A | |
| Recombinant DNA reagent | NeuroD: NCad CAG: NCad | Jossin and Cooper, 2011 | N/A | |
| Recombinant DNA reagent | pBS mFgfr1 (CT#92) | Addgene | RRID: Addgene_14005 | mFgfr1 subcloned into pCAG and pNeuroD vectors. |
| Recombinant DNA reagent | CAG:FGFR2 NeuroD:FGFR2 | This paper | N/A | |
| Recombinant DNA reagent | CAG:FGFR3 NeuroD-FGFR3 | This paper | N/A | |
| Recombinant DNA reagent | CAG:FGFR1-DN NeuroD:FGFR1-DN | This paper | N/A | Deletion of the ICD, replace by GFP |
| Recombinant DNA reagent | CAG:FGFR2-DN NeuroD:FGFR2-DN | This paper | N/A | Deletion of the ICD, replace by GFP |
| Recombinant DNA reagent | CAG:FGFR3-DN NeuroD:FGFR3-DN | This paper | N/A | Deletion of the ICD, replace by GFP |
| Recombinant DNA reagent | pRK5:HA-ubiquitin-KO | Addgene | RRID: Addgene_17603 | |
| Recombinant DNA reagent | pRK5:HA-ubiquitin-K27 | Addgene | RRID: Addgene_22902 | |
| Recombinant DNA reagent | pRK5:HA-ubiquitin-K29 | Addgene | RRID: Addgene_22903 | |
| Recombinant DNA reagent | pHRSIN:6HIS-UbiWT-GFP | Schaller et al., 2014 | N/A | |
| Recombinant DNA reagent | pHRSIN:6HIS-UbiK6R-GFP | Schaller et al., 2014 | N/A | |
| Recombinant DNA reagent | pHRSIN:6HIS-UbiK11R-GFP | Schaller et al., 2014 | N/A | |
| Recombinant DNA reagent | pHRSIN:6HIS-UbiK27R-GFP | Schaller et al., 2014 | N/A | |
| Recombinant DNA reagent | pHRSIN:6HIS-UbiK29R-GFP | Schaller et al., 2014 | N/A | |
| Recombinant DNA reagent | pHRSIN:6HIS-UbiK33R-GFP | Schaller et al., 2014 | N/A | |
| Recombinant DNA reagent | pHRSIN:6HIS-UbiK48R-GFP | Schaller et al., 2014 | N/A | |
| Recombinant DNA reagent | pHRSIN:6HIS-UbiK63R-GFP | Schaller et al., 2014 | N/A | |
| Recombinant DNA reagent | pFLAG-CMV-hErk1 | Addgene | RRID: Addgene_49328 | hErk1 subcloned into pCAG and pNeuroD vectors |
| Recombinant DNA reagent | pFLAG-CMV-hErk1K71R | Addgene | RRID: Addgene_49329 | hErk1K71R subcloned into pCAG and pNeuroD vectors |
| Recombinant DNA reagent | p3XFLAG-CMV7-Erk2 | Addgene | RRID: Addgene_39223 | Erk2 subcloned into pCAG and pNeuroD vectors |
| Recombinant DNA reagent | p3XFLAG-CMV7-Erk2_KR | Addgene | RRID: Addgene_39224 | Erk2_KR subcloned into pCAG and pNeuroD vectors |
| Recombinant DNA reagent | NeuroD:NCadΔEC4 CAG: NCadΔEC4 | This paper | N/A | Deletion of residues515–604 |
| Recombinant DNA reagent | CAG:NCadDN NeuroD:NCadDN | Jossin and Cooper, 2011 | N/A | Deletion of residues 99–708 |
| Recombinant DNA reagent | CAG: NcadW161A NeuroD: NcadW161A | This paper | N/A | Codon 161 TGG replaced by GCG |
| Recombinant DNA reagent | CAG:Ecad NeuroD:ECad | This paper | N/A | |
| Recombinant DNA reagent | CAG:ENCad NeuroD: ENCad | This paper | N/A | |
| Recombinant DNA reagent | CAG:NECad NeuroD: NECad | This paper | N/A | |
| Recombinant DNA reagent | CAG: NENCad NeuroD: NENCad | This paper | N/A | |
| Recombinant DNA reagent | CAG: ENNcad NeuroD: ENNcad | This paper | N/A | |
| Recombinant DNA reagent | pLKO.1.shFGFR1 | Sigma | Cat #: TCRN0000378435 | Target sequence: 5’-CTGGCTGGAGTCTCCGAATAT-3’ |
| Recombinant DNA reagent | pLKO.1.shFGFR2 | Sigma | Cat #: TRCN0000023715 | Target sequence: 5’-GCCAGGGATATCAACAACATA-3’ |
| Recombinant DNA reagent | pLKO.1.shFGFR3 | Sigma | Cat #: TRCN0000363373 | Target sequence: 5’CCACTTCAGTGTGCGTGTAAC-3’ |
| Recombinant DNA reagent | pCMV:Reelin and pCMV:R3-6 | Jossin et al., 2004 | N/A | |
| Peptide, recombinant protein | hFGF-2 | PeproTech | Cat #: 100-18B | |
| Peptide, recombinant protein | mEGF-2 | PeproTech | Cat #: 315–09 | |
| Chemical compound, drug | Protease inhibitor cocktail | Roche | Cat# 05056489001 | |
| Chemical compound, drug | Phosphatase inhibitor cocktail | Roche | Cat #: A32957 | |
| Chemical compound, drug | B27 | invitrogen | Cat #: 17504–044 | |
| Chemical compound, drug | Epoxomycin | Sigma | Cat #: E3652 | |
| Chemical compound, drug | Leupeptin | Carl Roth | Cat #: CN33 | |
| Chemical compound, drug | Debio1347 | Selleckchem | Cat #: S7665 | |
| Chemical compound, drug | Penicillin-streptomycin | Gibco | Cat #: 11548876 | |
| Commercial assay or kit | Plasmid DNA Purification Mini Prep Kit | Intron Biotechnology | Cat# 17098 | |
| Commercial assay or kit | Quick Gel extraction Kit | Thermo Fisher Scientific | Cat# K2100-12 | |
| Commercial assay or kit | HiPure Plasmid Maxiprep Kit | Thermo Fisher Scientific | Cat# K2100-07 | |
| Software, algorithm | Image J | NIH | N/A | |
| Other | DAPI staining | Sigma | Cat #: D9542 | |
| Other | PolyJet In Vitro DNA Transfection Reagent | Signagen | Cat #: SL100688 | |
| Other | Dynabeads protein A | invitrogen | Cat #: 10001D | |
| Other | Dynabeads protein G | İnvitrogen | Cat #: 1003D | |
| Other | Super signal West Pico PLUS chemuluminescent substrate | Thermo Scientific | Cat #: 34578 | |
| Other | O.C.T. | VWR | Cat # 361603E | |
| Other | DMEM-F-12 | Gibco | Cat #: 21331–020 | |
| Other | DMEM, high glucose | Gibco | Cat #: 41965–039 | |
| Other | CL-X Posure film | Thermo fisher | Cat #: 34091 |
Additional files
-
Transparent reporting form
- https://doi.org/10.7554/eLife.47673.027
Download links
A two-part list of links to download the article, or parts of the article, in various formats.
Downloads (link to download the article as PDF)
Open citations (links to open the citations from this article in various online reference manager services)
Cite this article (links to download the citations from this article in formats compatible with various reference manager tools)
N-cadherin-regulated FGFR ubiquitination and degradation control mammalian neocortical projection neuron migration
eLife 8:e47673.
https://doi.org/10.7554/eLife.47673


