Acetic acid activates distinct taste pathways in Drosophila to elicit opposing, state-dependent feeding responses
- Columbia University, United States
- Howard Hughes Medical Institute, Columbia University, United States
Figures
Figure 1 with 3 supplements
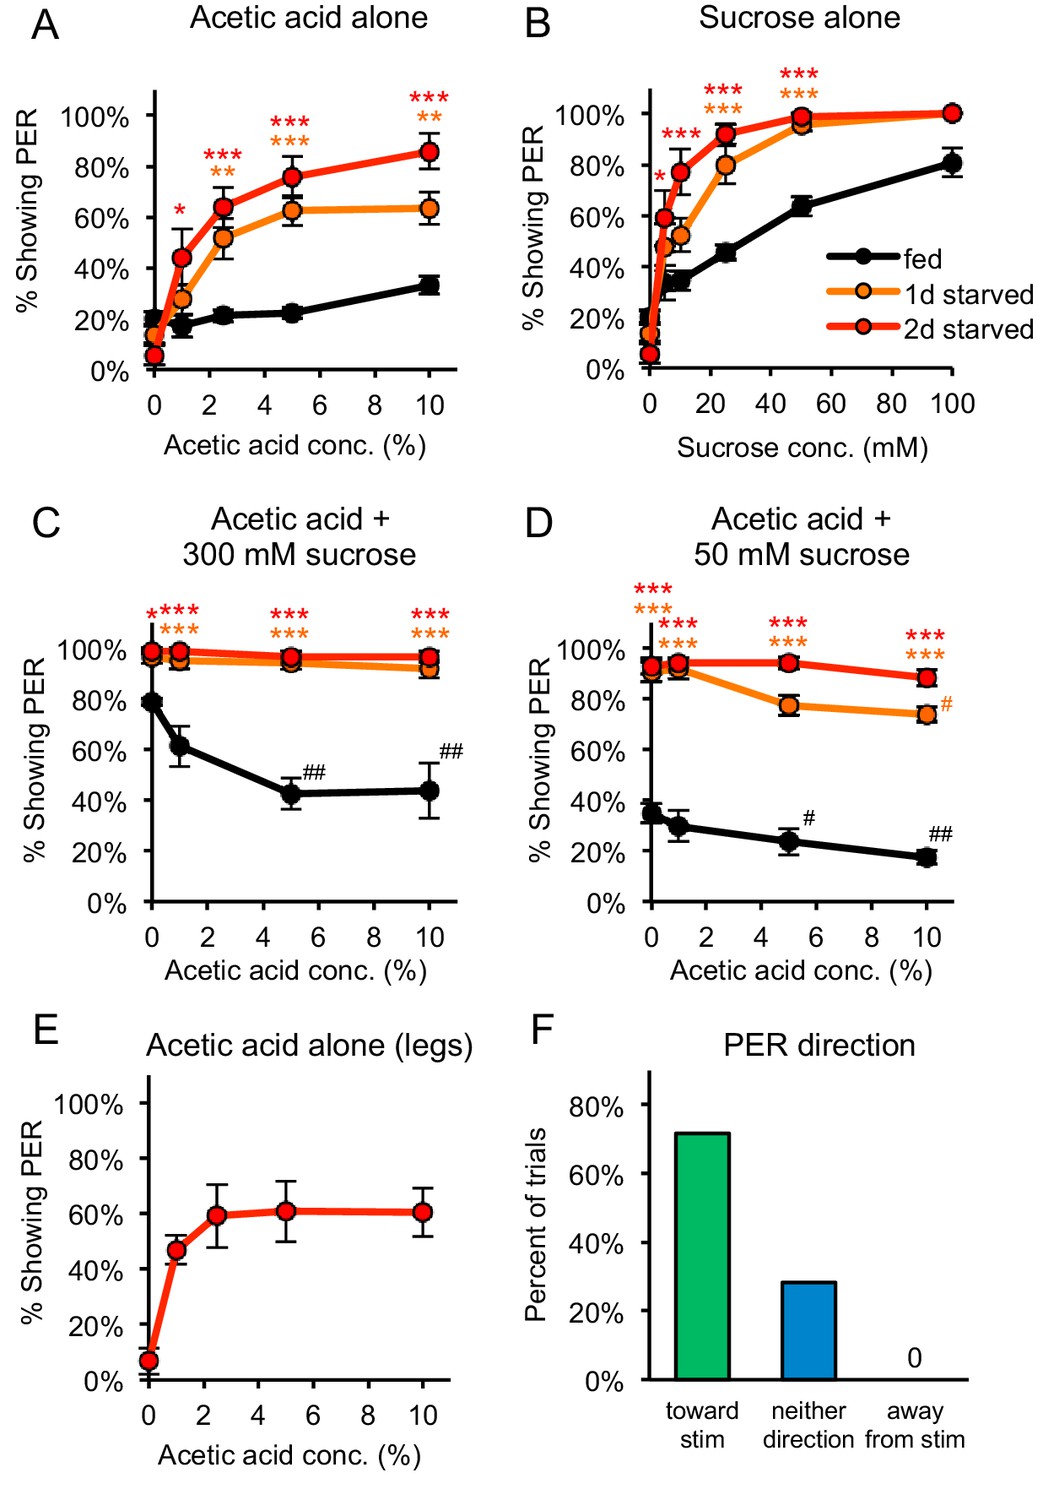
Acetic acid induces aversive or appetitive taste responses depending on hunger state.
(A) One-day or two-day starved flies, but not fed flies, showed strong PER to acetic acid applied to the labellum. PER at 0% acetic acid represents the baseline response to water. (B) Both fed and starved flies showed dose-dependent PER to sucrose applied to the labellum. (C) Acetic acid suppressed PER to 300 mM sucrose in fed flies but not in one-day or two-day starved flies. (D) Acetic acid suppressed PER to 50 mM sucrose in fed flies and had a small but significant effect in one-day starved flies, but not in two-day starved flies. (E) Two-day starved flies showed PER to acetic acid applied to the legs. (F) Two-day starved flies stimulated asymmetrically with 5% acetic acid on the legs tended to show PER toward the stimulus (n = 53 trials, nine flies). In panels A-D, fed and starved flies were compared using two-way repeated measures ANOVA followed by Bonferroni’s post-tests (*p<0.05, **p<0.01, ***p<0.001; orange or red asterisks correspond to one- or two-day starved flies, respectively). In panels C-D, responses within each group were compared to the response to 0% acetic acid using one-way repeated-measures ANOVA followed by Dunnett's post-tests (#p<0.05, ##p<0.01; symbols colored by group). Detailed statistical results for all experiments are reported in Supplementary file 1. For panels A-E, n = 3–5 sets of flies. See also Figure 1—figure supplements 1–3 and Videos 1 and 2.
-
Figure 1—source data 1
Raw data for Figure 1.
- https://doi.org/10.7554/eLife.47677.007
Figure 1—figure supplement 1

At low sucrose concentrations acetic acid enhances sucrose-evoked PER in two-day starved flies.
(A–B) When acetic acid was added to low concentrations of sucrose (10 mM in panel A and 5 mM in panel B), acetic acid enhanced sucrose-evoked PER in two-day starved flies (#p<0.05, ##p<0.01, one-way repeated-measures ANOVA followed by Dunnett's post-tests comparing responses to 0% acetic acid to responses to other concentrations). n = 4 sets of flies.
Figure 1—figure supplement 2
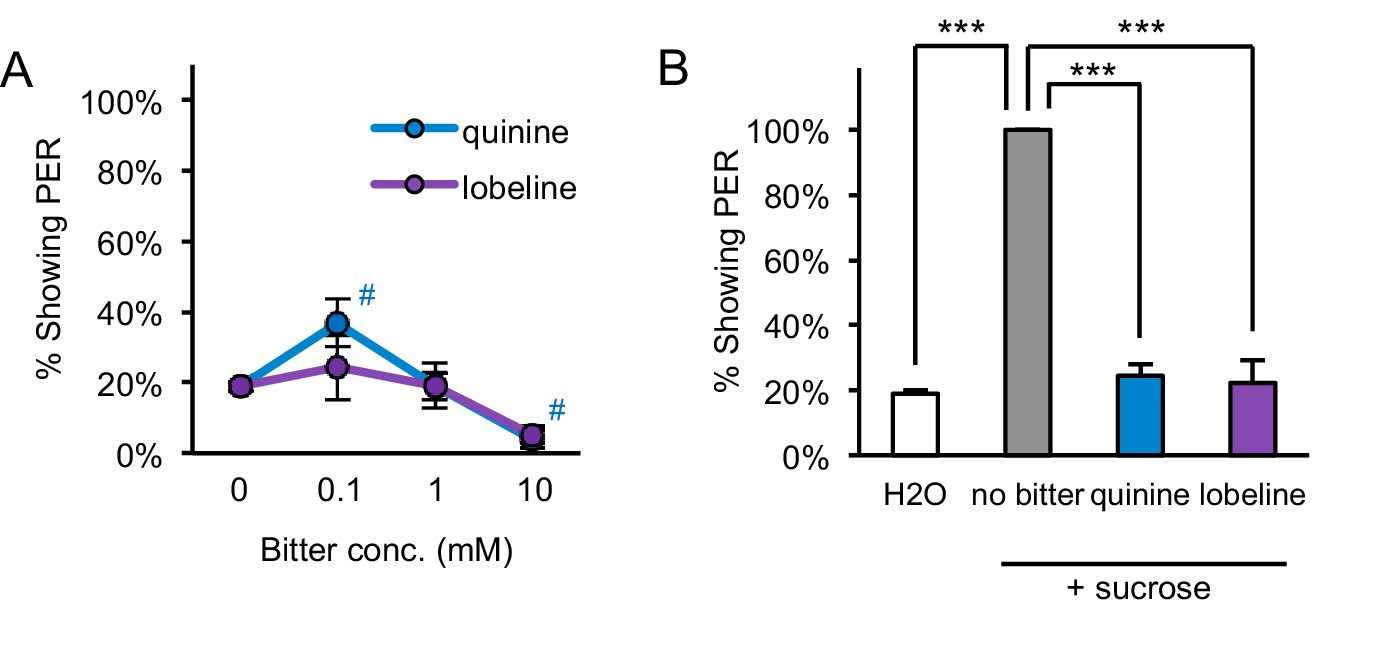
Starved flies show aversion to bitter compounds.
(A) Two-day starved flies did not show consistent or strong PER to the bitter compounds quinine or lobeline (#p<0.05, one-way repeated measures ANOVA followed by Dunnett's post-tests comparing bitter stimuli to water; symbols colored by group). (B) Two-day starved flies showed aversion to bitter compounds, since the addition of 10 mM quinine or 5 mM lobeline suppressed PER to 50 mM sucrose (***p<0.001, one-way repeated measures ANOVA followed by Bonferroni's post-tests). n = 5 sets of flies.
Figure 1—figure supplement 3
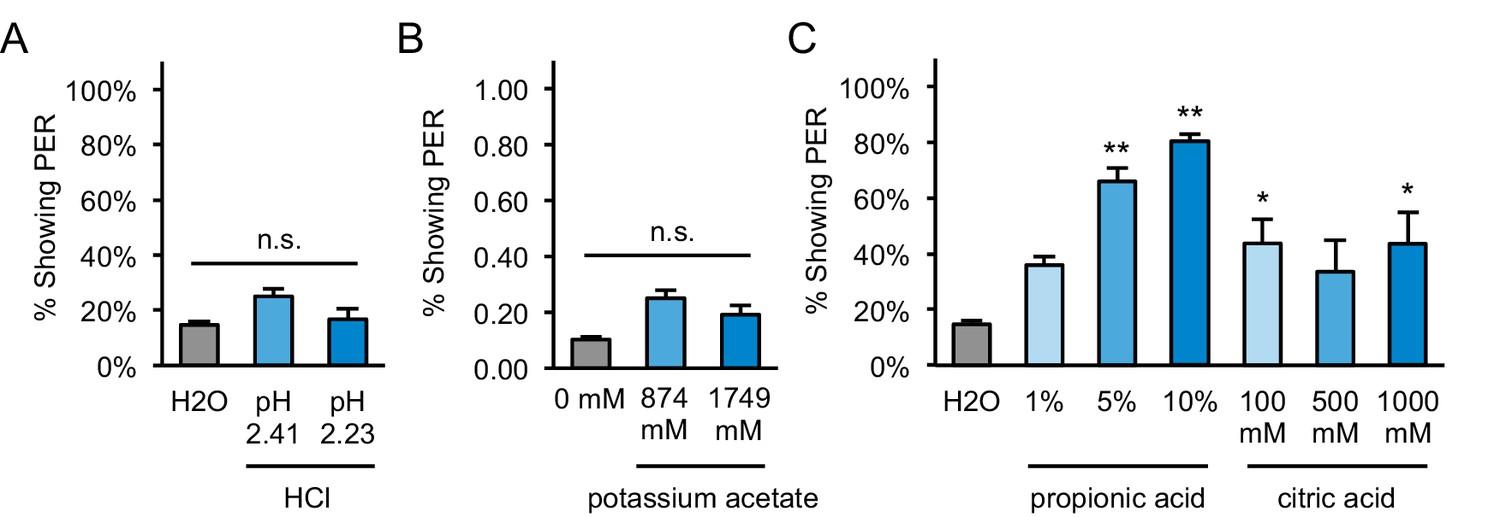
PER to other acids and acetate in starved flies.
(A) Two-day starved flies did not show significant PER to hydrochloric acid (HCl) solutions prepared at the same pH values as measured for 5% and 10% acetic acid (pH 2.41 and 2.23 respectively). (B) Two-day starved flies did not show significant PER to potassium acetate presented at the same molarities as 5% and 10% acetic acid (874 and 1749 mM, respectively). (C) Two-day starved flies showed moderate to strong PER to propionic and citric acid. For all panels: *p<0.05, **p<0.01, one-way repeated measures ANOVA followed by Dunnett's post-tests comparing each tastant to water. n = 4 sets of flies.
Figure 2
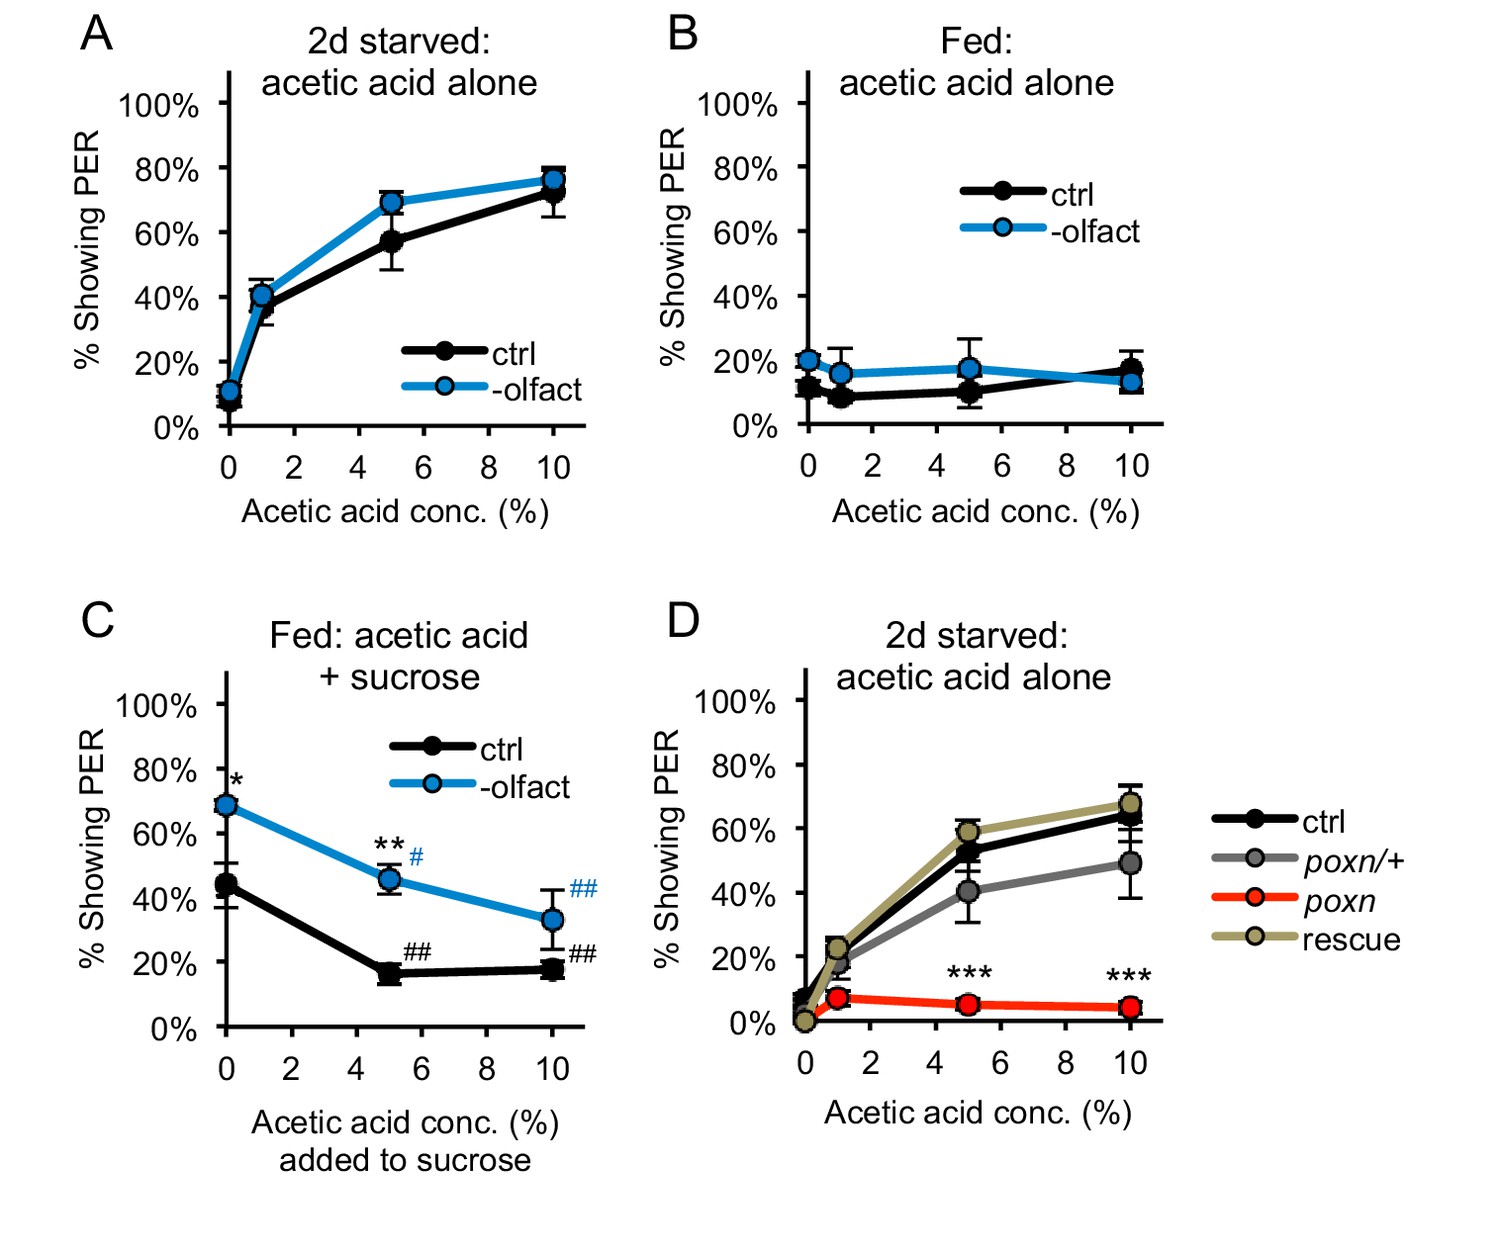
PER to acetic acid is mediated by the gustatory system, not the olfactory system.
(A–B) Removing the olfactory organs did not affect PER to acetic acid in two-day starved flies (A) or fed flies (B) (p>0.05). (C) Acetic acid aversion in fed flies, measured by suppression of PER to 50 mM sucrose, was observed in both control flies and flies lacking olfactory organs. Flies lacking olfactory organs were generally more responsive than control flies. (D) Two-day starved flies homozygous for the poxn∆M22-B5 mutation showed decreased PER to acetic acid as compared to wild-type controls, poxn∆M22-B5/+ heterozygotes, and poxn∆M22-B5 homozygotes carrying a rescue transgene. In all experiments different groups were compared by two-way repeated measures ANOVA followed by Bonferroni’s post-tests (*p<0.05, **p<0.01, ***p<0.001). In panel C, responses within each group were compared to the response to 0% acetic acid using one-way repeated-measures ANOVA followed by Dunnett's post-tests (#p<0.05, ##p<0.01; symbols colored by group). n = 3–5 sets of flies.
-
Figure 2—source data 1
Raw data for Figure 2.
- https://doi.org/10.7554/eLife.47677.011
Figure 3
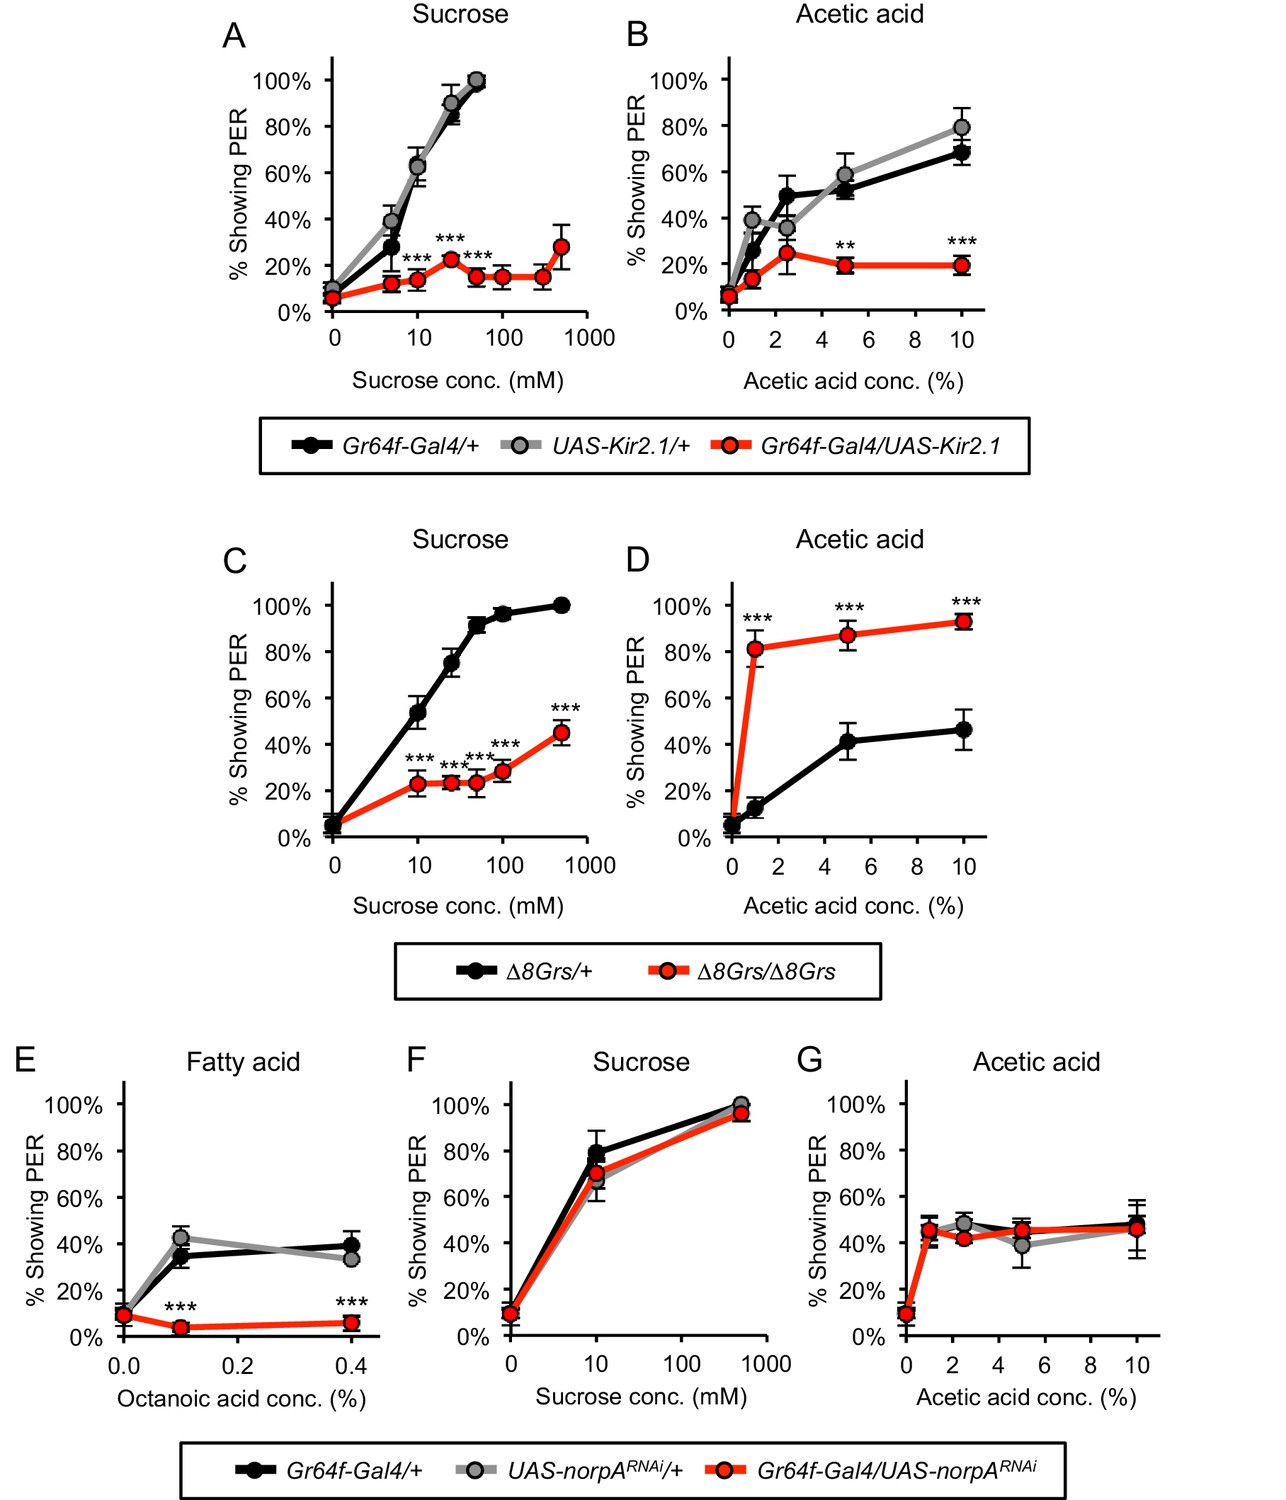
Sugar-sensing neurons mediate PER to acetic acid in starved flies.
(A–B) Silencing the activity of sugar-sensing neurons impaired PER to sucrose (A) and acetic acid (B) in two-day starved flies. (C–D) One-day starved homozygous mutant flies lacking all eight sugar receptors showed decreased PER to sucrose (C) but showed increased PER to acetic acid (D) relative to heterozygous controls. (E–G) RNAi knockdown of norpA, encoding PLCß, in sugar-sensing neurons abolished PER to fatty acid (E) but did not affect PER to sucrose (F) or acetic acid (G) in two-day starved flies. For all panels: **p<0.01, ***p<0.001, two-way repeated measures ANOVA followed by Bonferroni's post-tests comparing experimental group to each control group. In panel A, statistical analyses did not include the three highest sucrose concentrations because control flies were not tested at these concentrations. n = 3–5 sets of flies.
-
Figure 3—source data 1
Raw data for Figure 3.
- https://doi.org/10.7554/eLife.47677.013
Figure 4 with 2 supplements
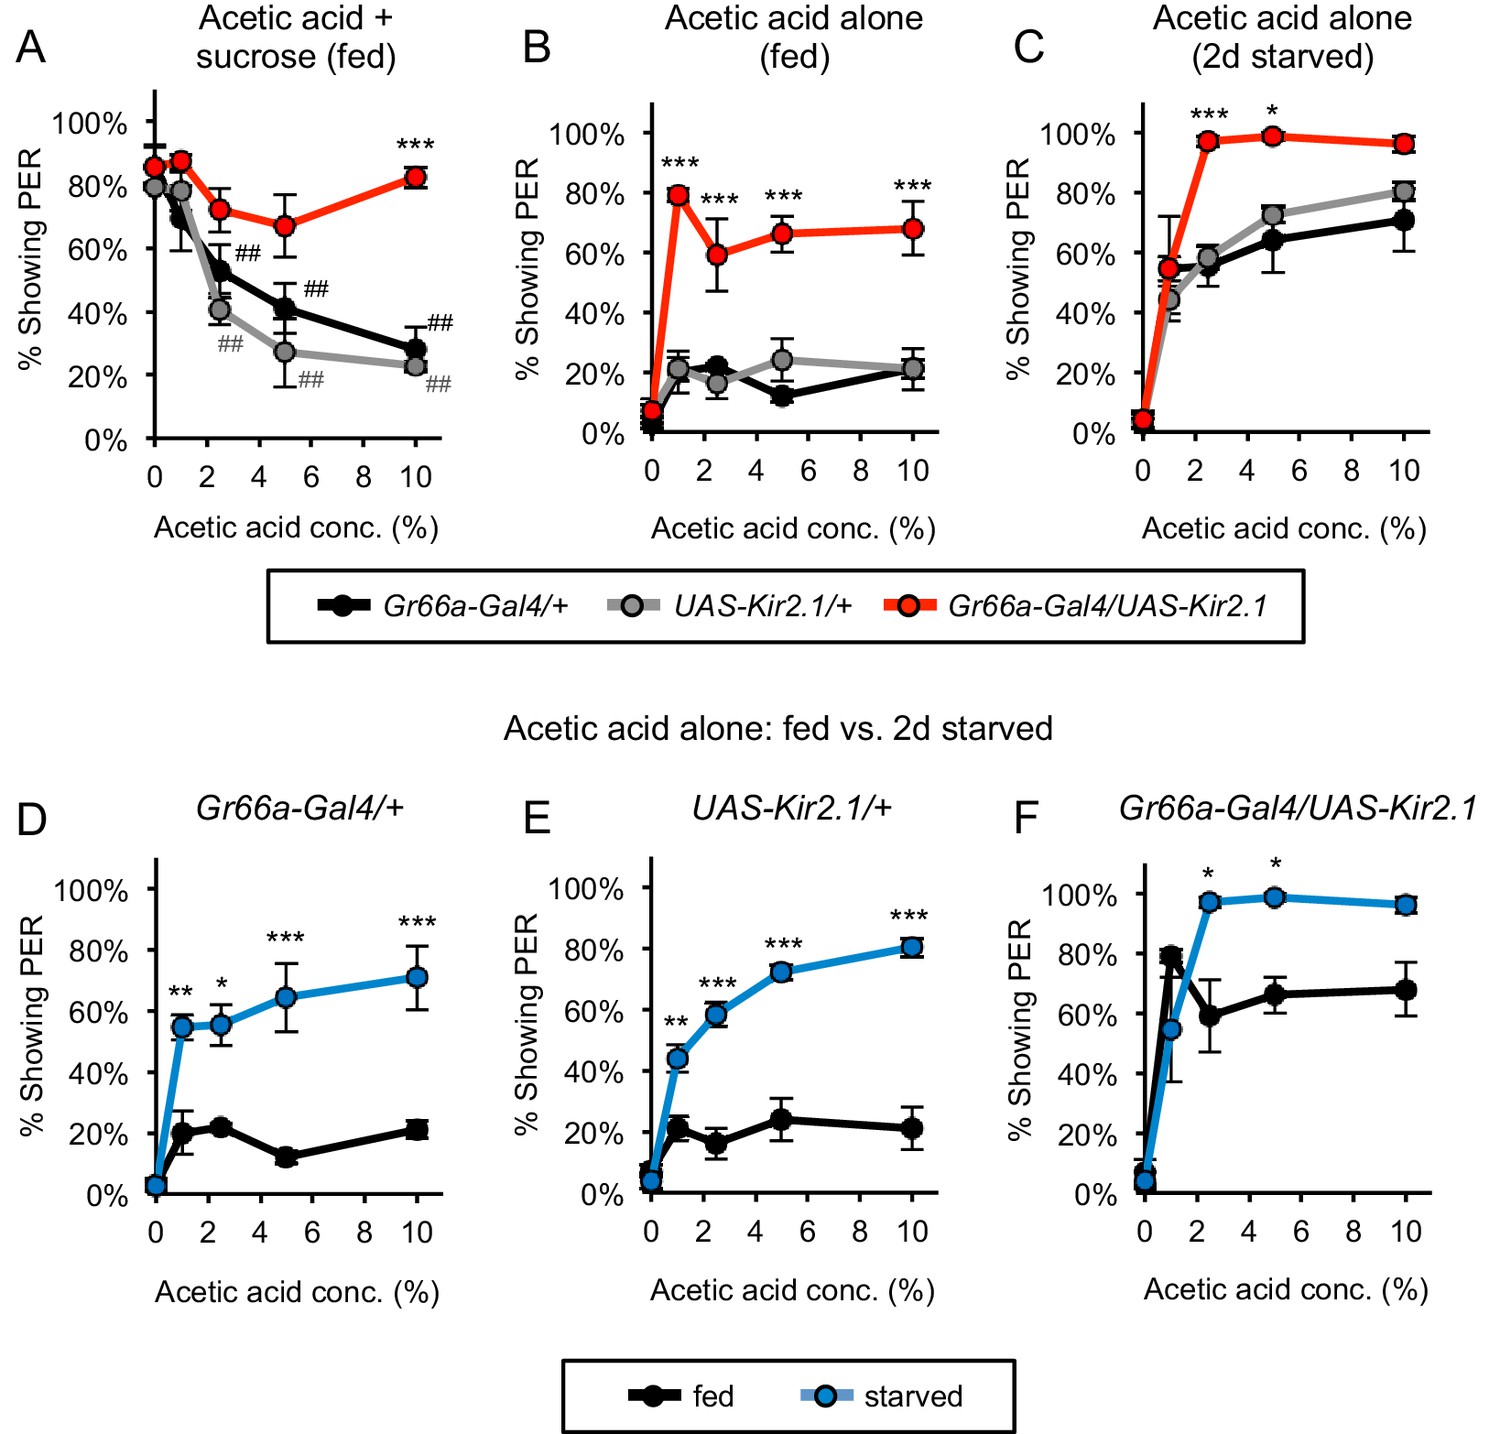
Bitter-sensing neurons suppress PER to acetic acid.
(A) Silencing bitter-sensing neurons strongly reduced aversion to acetic acid in fed flies. Aversion was measured as the suppression of PER to 100 mM sucrose containing acetic acid. Both sets of control flies showed significant aversion to acetic acid (##p<0.01; symbols colored by group), whereas experimental flies did not show significant aversion (one-way repeated-measures ANOVA followed by Dunnett's post-tests comparing responses to 0% acetic acid to responses at all other concentrations). (B–C) Silencing bitter-sensing neurons enhanced PER to acetic acid alone in fed flies (B) and two-day starved flies (C). (D–F) Comparing fed and starved flies of each genotype (same data as panels B and C) revealed that starvation enhanced PER in all genotypes. For all panels: *p<0.05, **p<0.01, ***p<0.001, two-way ANOVA (repeated measures for panels A-C) followed by Bonferroni's post-tests comparing experimental group to each control group. n = 3–4 sets of flies. See also Figure 4—figure supplements 1 and 2.
-
Figure 4—source data 1
Raw data for Figure 4.
- https://doi.org/10.7554/eLife.47677.017
Figure 4—figure supplement 1

Silencing bitter-sensing neurons impairs bitter aversion but does not affect PER to sugar.
(A–B) Silencing bitter-sensing neurons strongly reduced aversion to the bitter compounds quinine (A) and lobeline (B). Aversion was measured as the suppression of PER to 100 mM sucrose containing each of the bitter compounds. (C–D) Silencing bitter-sensing neurons did not affect PER to sucrose alone in fed flies (C) or two-day starved flies (D). For all panels: ***p<0.001, two-way repeated measures ANOVA followed by Bonferroni's post-tests comparing experimental group to each control group. n = 3 sets of flies.
Figure 4—figure supplement 2
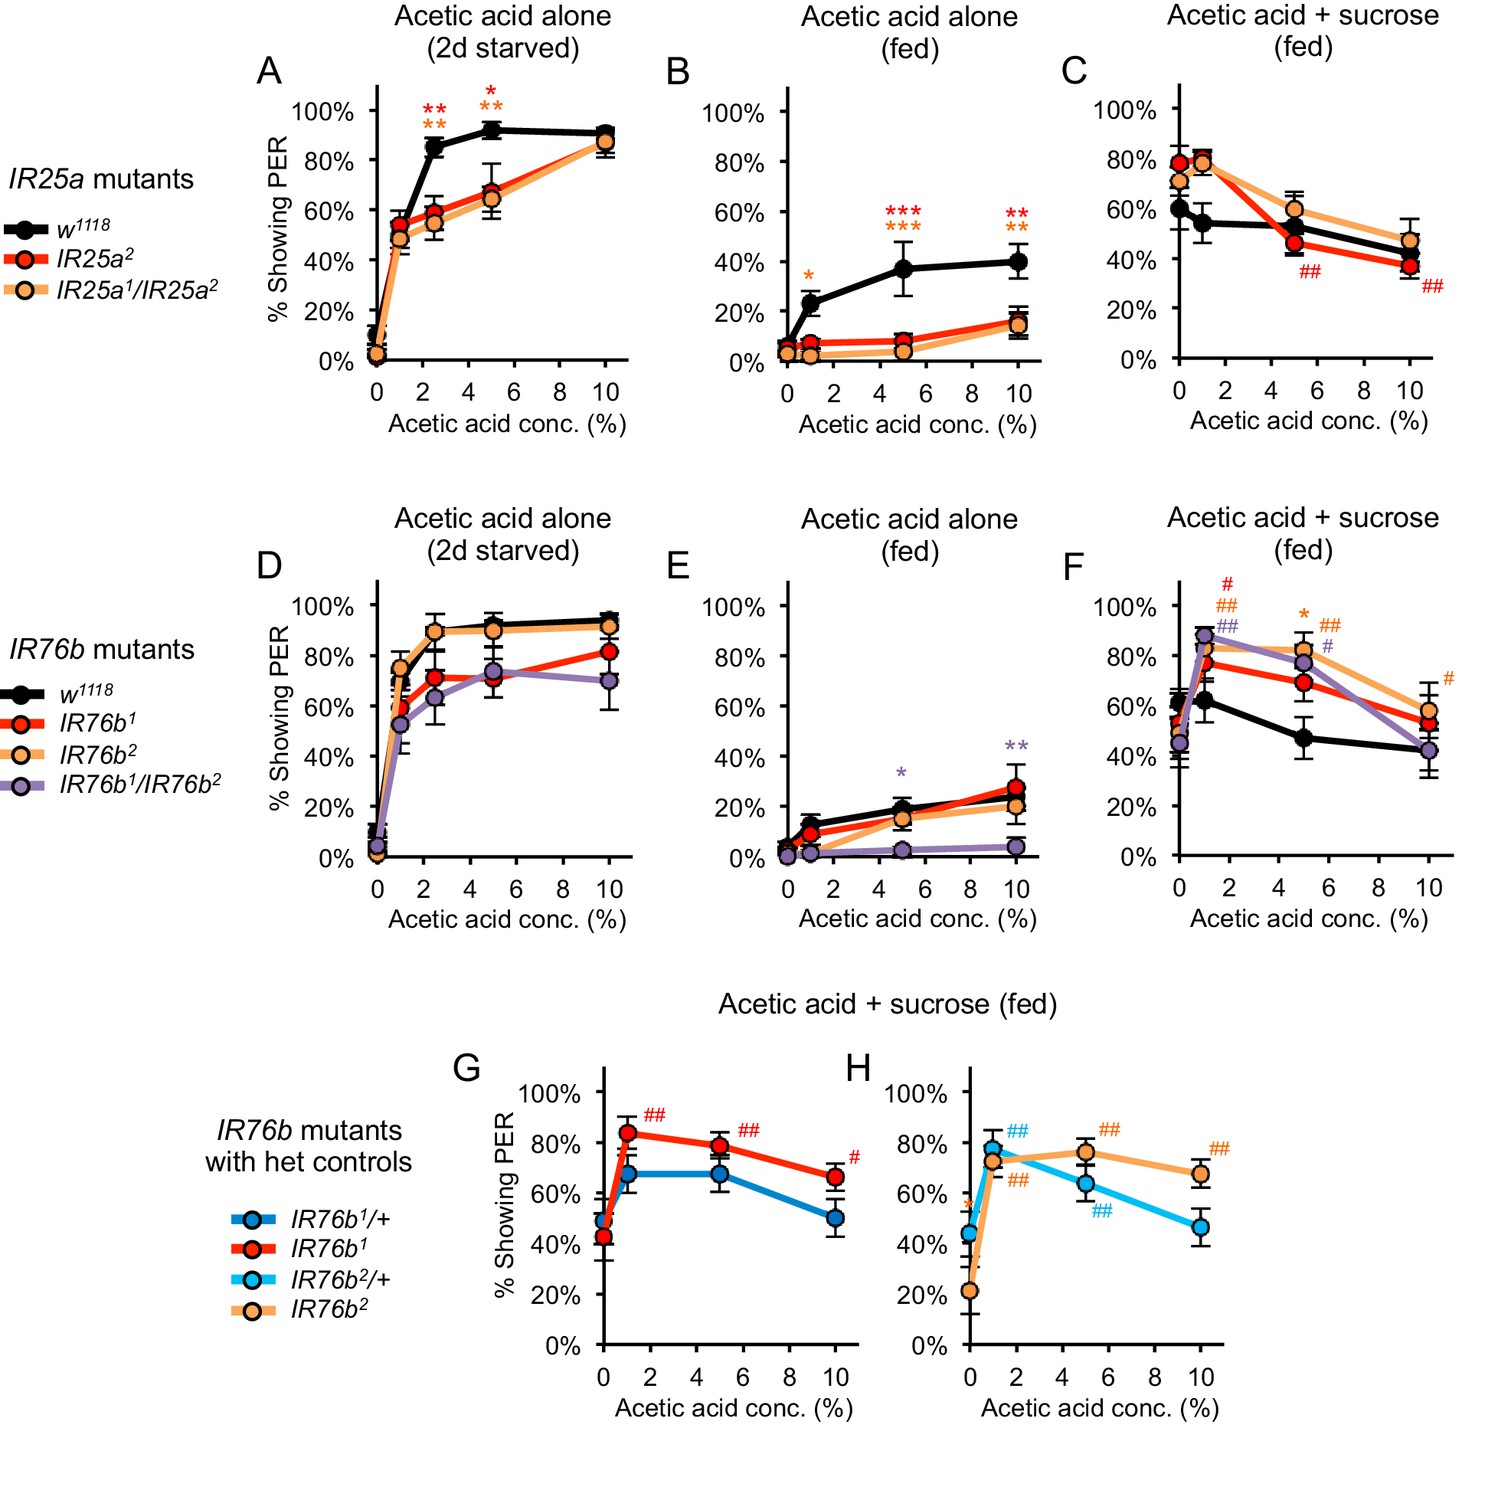
Acetic acid responses in fed and starved flies carrying mutations in IR25a or IR76b.
Acetic acid responses in flies carrying mutations in IR25a (A–C) or IR76b (D–H). (A, D) Two-day starved IR25a or IR76b mutant flies showed robust PER to acetic acid, although IR25a mutants showed a slightly lower response than w1118 controls at certain concentrations. (B, E) Fed IR25a or IR76b mutant flies showed similar or lower levels of PER to acetic acid alone as compared to control w1118 flies. (C) Acetic acid suppressed PER evoked by 100 mM sucrose in fed Ir25a mutant flies, which did not differ from w1118 controls (p>0.05). We note that w1118 flies showed weaker acetic acid suppression of sucrose-evoked PER than our usual wild-type strain 2U (see Figure 1C). (F) Fed IR76b mutant flies showed a dose-dependent decrease in PER when 1–10% acetic acid was added to 100 mM sucrose. However, IR76b mutant flies showed greater PER to sucrose containing 1% or 5% acetic acid compared to sucrose alone. (G–H) The enhancement of sucrose-evoked PER by low acetic acid concentrations in IR76b mutants (panel F) is likely due to the genetic background of IR76b mutant flies, not the IR76b mutation, since IR76b/+ heterozygotes also showed this effect. For all panels, each mutant was compared to the control using two-way repeated measures ANOVA followed by Bonferroni’s post-tests (*p<0.05, **p<0.01, ***p<0.001; asterisks colored by genotype). In panels C and F-H, responses within each genotype were analyzed using one-way repeated-measures ANOVA followed by Dunnett's post-tests comparing 0% acetic acid to other concentrations (#p<0.05, ##p<0.01; symbols colored by genotype). n = 4–5 sets of flies.
Figure 5 with 7 supplements
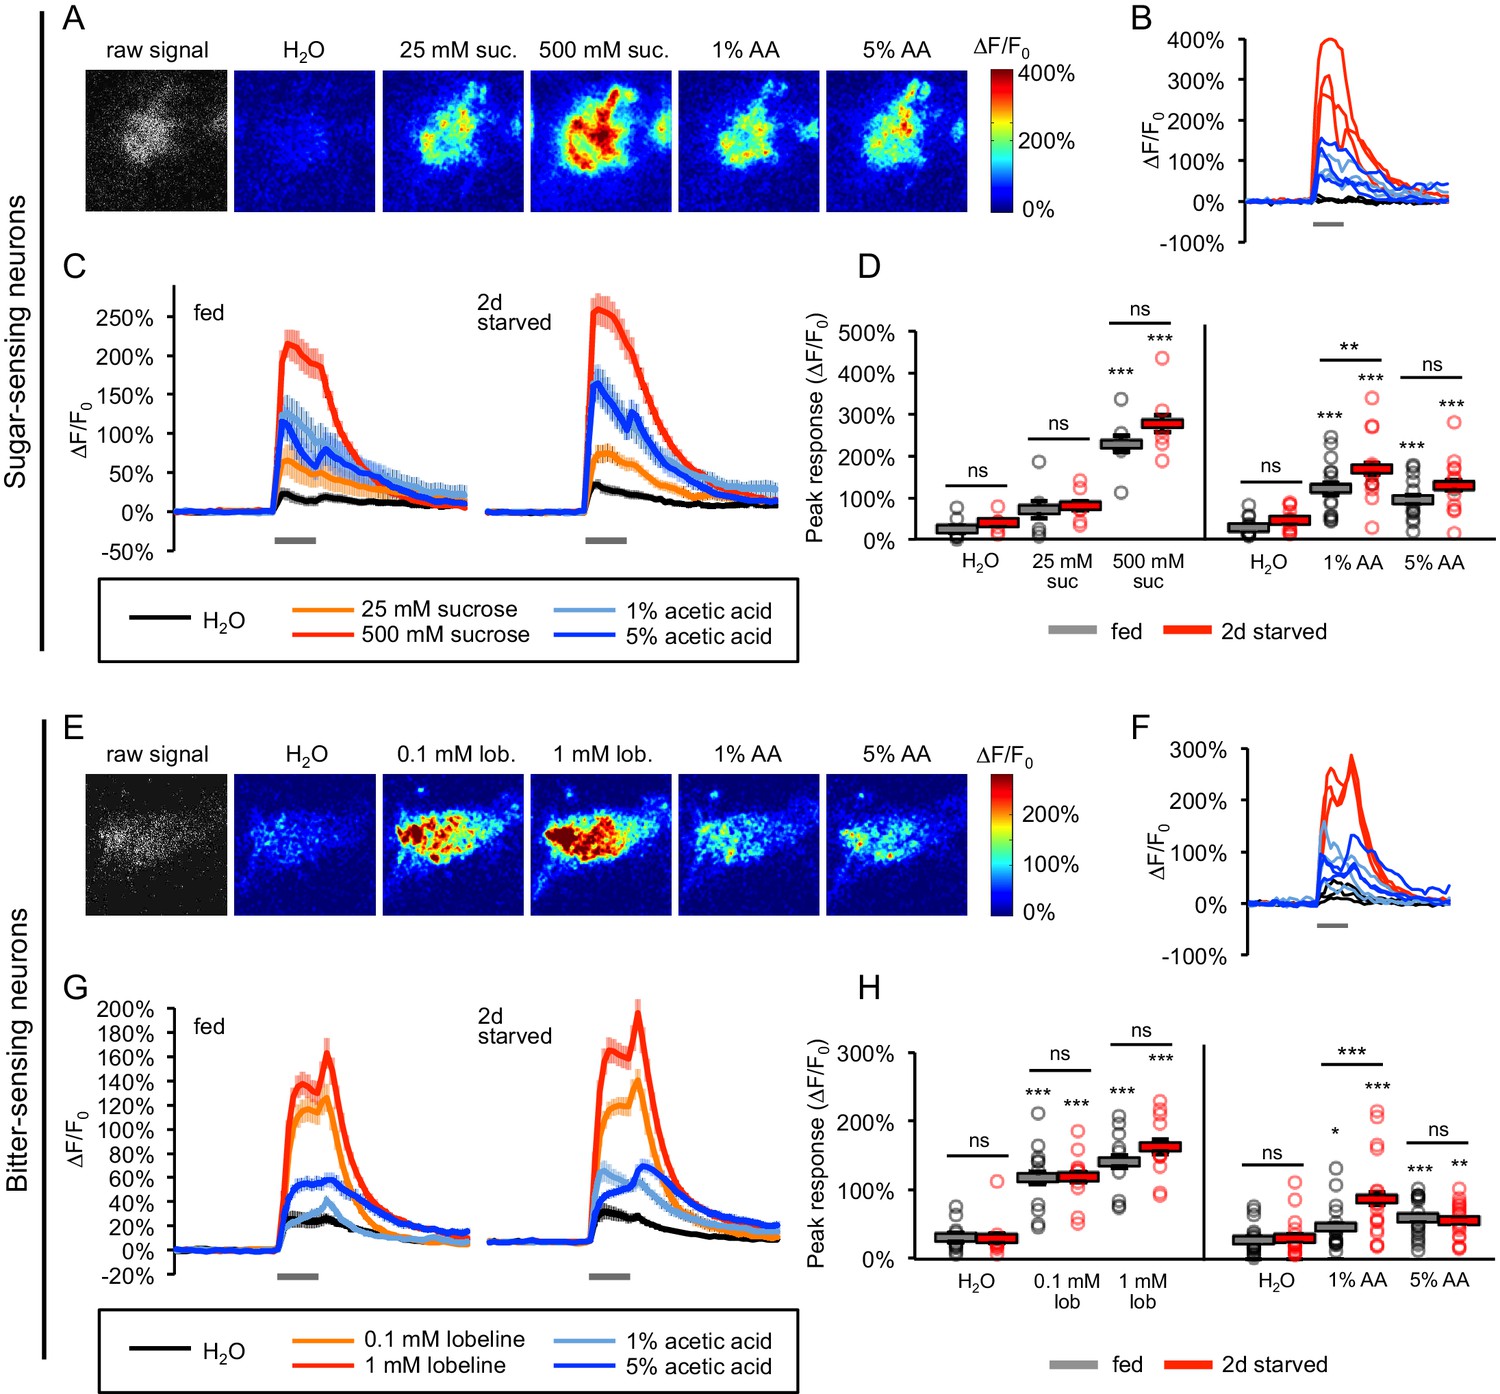
Acetic acid activates sugar- and bitter-sensing neurons.
(A–H) Calcium imaging of taste sensory neurons reveals that acetic acid (AA) activates sugar-sensing neurons (labeled with Gr64f-Gal4; panels A-D) and bitter-sensing neurons (labeled with Gr66a-Gal4; panels E-H) in both fed and two-day starved flies. (A, E) Spatial maps of GCaMP activation by each stimulus for individual flies (A, fed; E, starved). (B, F) Example ∆F/F0 traces for individual trials in the same flies shown in A and E, respectively. (C, G) Average GCaMP activation across all trials in all flies of each group. Gray bars indicate stimulus delivery (2 s). (D, H) Peak response to each stimulus averaged across all trials for each group. Circles represent individual fly averages. Within each group, responses to each stimulus were compared to responses to water, and fed and starved groups were also compared for each stimulus (*p<0.05, **p<0.01, ***p<0.001, two-way ANOVA followed by Bonferroni post-tests). Data shown in this figure represent n = 15–19 trials, six flies per group (sugar neurons, sucrose stimuli), n = 39–43 trials, 14 flies per group (sugar neurons, AA stimuli), n = 30 trials, 10 flies per group (bitter neurons, lobeline stimuli), or n = 54 trials, 18 flies (bitter neurons, AA stimuli). n values are larger for AA stimuli because we combined the results of two different datasets, but only the more recent dataset included the appropriate sucrose and lobeline stimuli. Only the more recent dataset is shown in panels C and G, whereas peak responses to AA stimuli for the combined dataset are analyzed in panels D and H. See also Figure 5—figure supplements 1–7.
-
Figure 5—source data 1
Raw data for Figure 5.
- https://doi.org/10.7554/eLife.47677.026
Figure 5—figure supplement 1
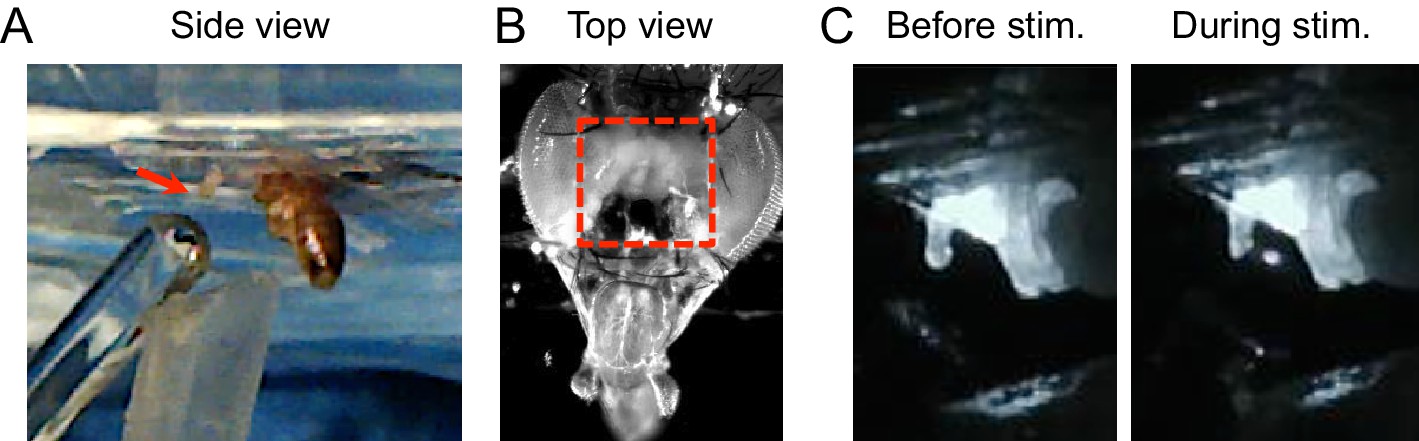
Calcium imaging setup for taste neuron imaging.
(A) Side view of fly. Wings and legs were taped to allow unobstructed stimulation of the labellum (arrow). Tastant droplets were delivered to the labellum via a glass microcapillary and removed by a vacuum line, both of which were controlled by MATLAB software. (B) Top view of fly. Red box shows area of cuticle removed to expose the ventral brain, which includes the SEZ. (C) Still frames from video showing tastant delivery during imaging.
Figure 5—figure supplement 2
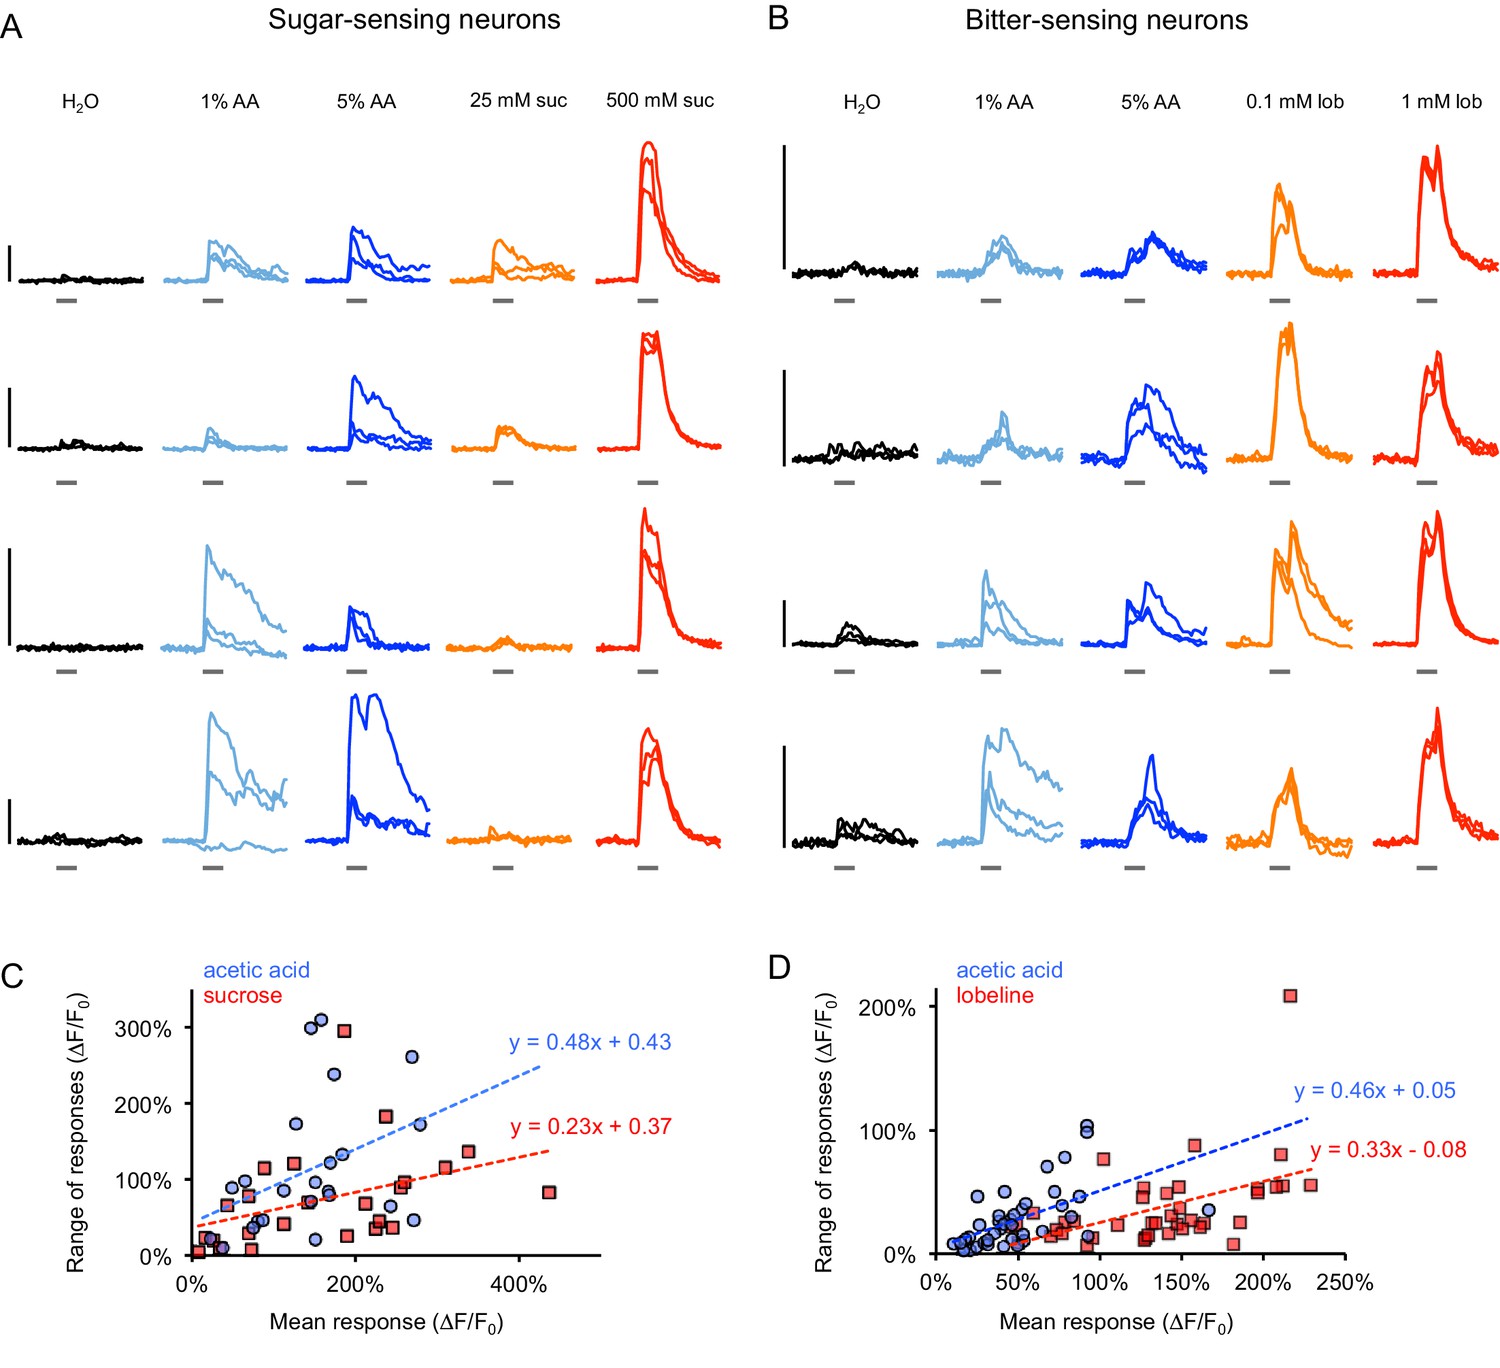
GCaMP responses in individual flies.
(A–B) Example GCaMP traces from sugar-sensing (A) or bitter-sensing (B) neurons of individual fed or starved flies for three trials of stimulation with each tastant. Sugar neurons were labeled with Gr64f-Gal4 and bitter neurons were labeled with Gr66a-Gal4. Each row represents responses from a different fly. Vertical scale bars (left) = 100% ∆F/F0. Within-fly variability often appeared greater for acetic acid responses than sugar or bitter responses, but some flies showed more trial-to-trial variability than others (e.g. compare top and bottom rows of each panel). The third row of panel A and first, third, and fourth rows of panel B are from two-day starved flies; all other rows are from fed flies. (C–D) Within-fly variability was quantified by calculating the range of peak responses (maximum - minimum) for each fly to each stimulus across three trials. For each fly, the range of response to each stimulus is plotted versus the fly’s mean response to the stimulus (blue = acetic acid, red = sugar or bitter) since the range tends to increase with the mean response. Lines represent a linear fit for acetic acid responses (blue) or sugar or bitter responses (red). For a given mean response, acetic acid tended to induce a greater range of responses than sugar or bitter, suggesting increased within-fly variability.
Figure 5—figure supplement 3
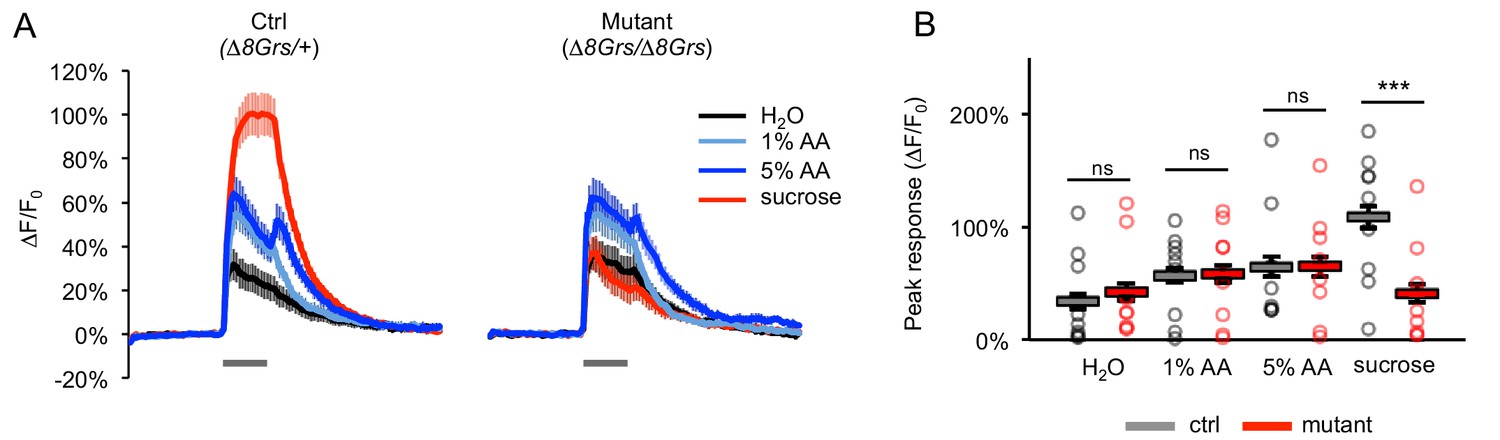
Acetic acid responses of sugar-sensing neurons in sugar receptor mutants are not affected.
(A) Average GCaMP activation of sugar-sensing neurons in fed control flies (∆8Grs/+) and mutant flies lacking all eight sugar Grs (∆8Grs/∆8Grs) in response to water, 100 mM sucrose, or acetic acid (AA). Both groups of flies were heterozygous for Gr61a-Gal4 and UAS-GCaMP6m to enable expression of GCaMP6m in sugar-sensing neurons. Gray bars indicate stimulus delivery (4 s). (B) Peak response to each stimulus averaged across all trials for each genotype; circles represent individual fly averages. Only the response to sucrose differed significantly between genotypes (***p<0.001, two-way ANOVA followed by Bonferroni post-tests). Not all flies responded to acetic acid, but there was no difference between genotypes: 6 of 9 control and mutant flies responded to at least one concentration of acetic acid. n = 36–37 trials, nine flies per genotype.
Figure 5—figure supplement 4

Acetic acid activates a subset of bitter-sensing neurons.
(A–D) GCaMP responses of bitter neuron subsets were imaged using Gal4 lines that label each of the four subclasses of bitter neurons (S–a, S–b, I–a, I–b) with complete or partial specificity, as noted in each panel. Fed flies were stimulated with water, bitter compounds (1 mM lobeline, 10 mM caffeine), and acetic acid (AA, 1% or 5%) for 3 s (gray bars). Relatively weak GCaMP expression in neurons labeled by Gr47a-Gal4 may account for their lower response magnitudes. (E) Peak GCaMP responses of each of the four bitter neuron subsets shown in panels A-D. Asterisks indicate responses that are significantly higher than the response to water (**p<0.01, one-way ANOVA followed by Dunnett's post-tests). Only neurons labeled by Gr22f-Gal4 showed a significant peak response to either concentration of acetic acid. Neurons labeled by Gr98d-Gal4 did not show a significant difference in the peak response to acetic acid versus water, but the GCaMP traces for 1% acetic acid and water show clear differences in their timecourse (A), suggesting that these neurons may also respond to acetic acid. n = 12–15 trials, 4–5 flies per genotype.
Figure 5—figure supplement 5
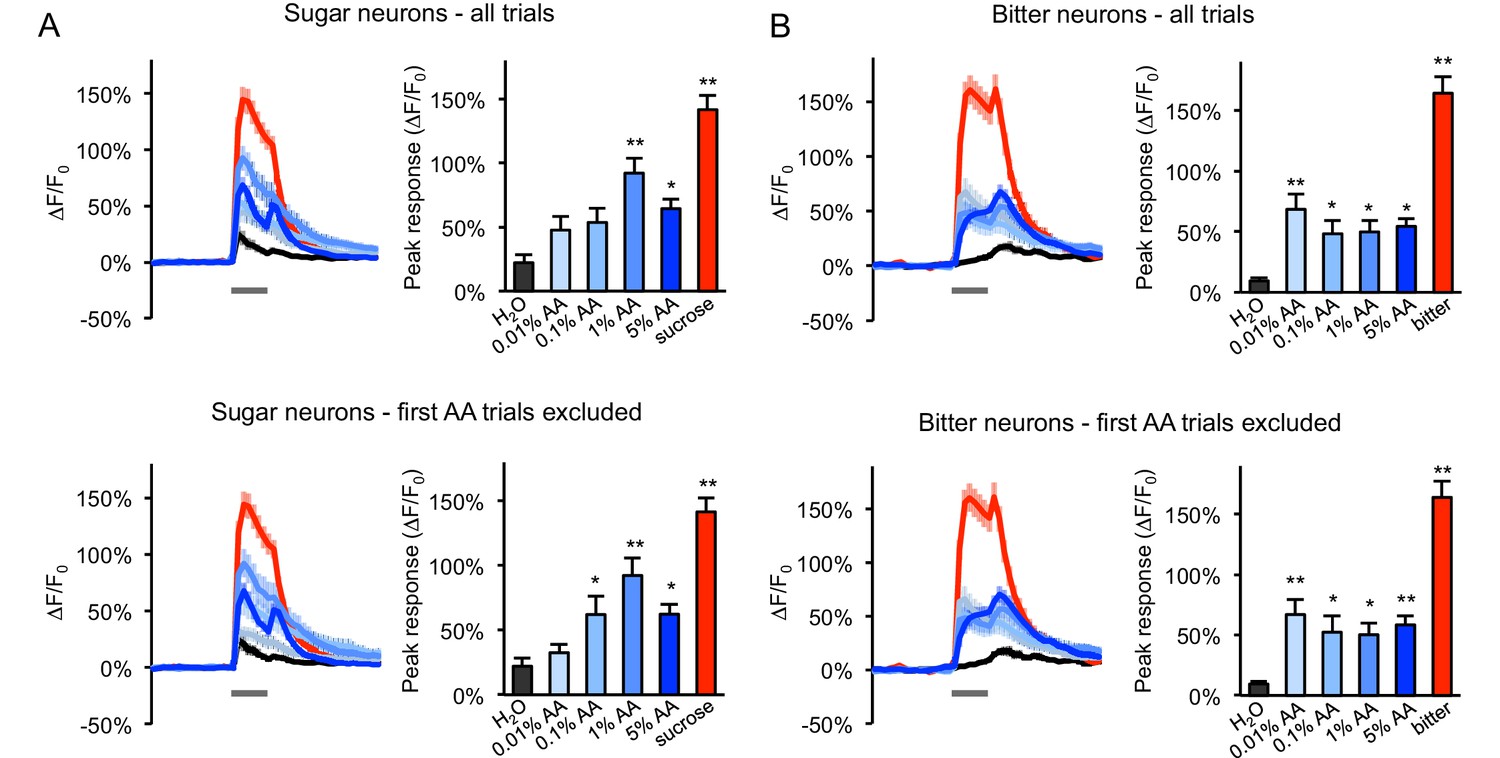
Responses of sugar- and bitter-sensing neurons to additional acetic acid concentrations.
(A–B) GCaMP responses of sugar neurons (A) or bitter neurons (B) in two-day starved flies were tested with a range of acetic acid (AA) concentrations in ascending order (n = 24–32 trials, eight flies). Responses were analyzed across all trials (top graphs) or for all trials after excluding the first trial of each AA stimulus (bottom graphs), since the initial exposure to acetic acid often evoked a much stronger response than subsequent trials, and this may obscure dose-response relationships because acetic acid concentrations were always tested in ascending order. Excluding the first trials revealed a clearer dose dependence in sugar neurons at 0.01–1% AA but not in bitter neurons. In all panels, line graphs show average GCaMP traces (gray bars indicate stimulus delivery, 2 s) and bar graphs show average peak responses. Asterisks indicate responses that were significantly higher than the response to water (*p<0.05, **p<0.01, one-way ANOVA followed by Dunnett's post-tests). Sugar neurons were labeled with Gr64f-Gal4 and bitter neurons were labeled with Gr66a-Gal4. 100 mM sucrose or 1 mM denatonium (‘bitter’) was used as a positive control for sugar and bitter neurons, respectively.
Figure 5—figure supplement 6
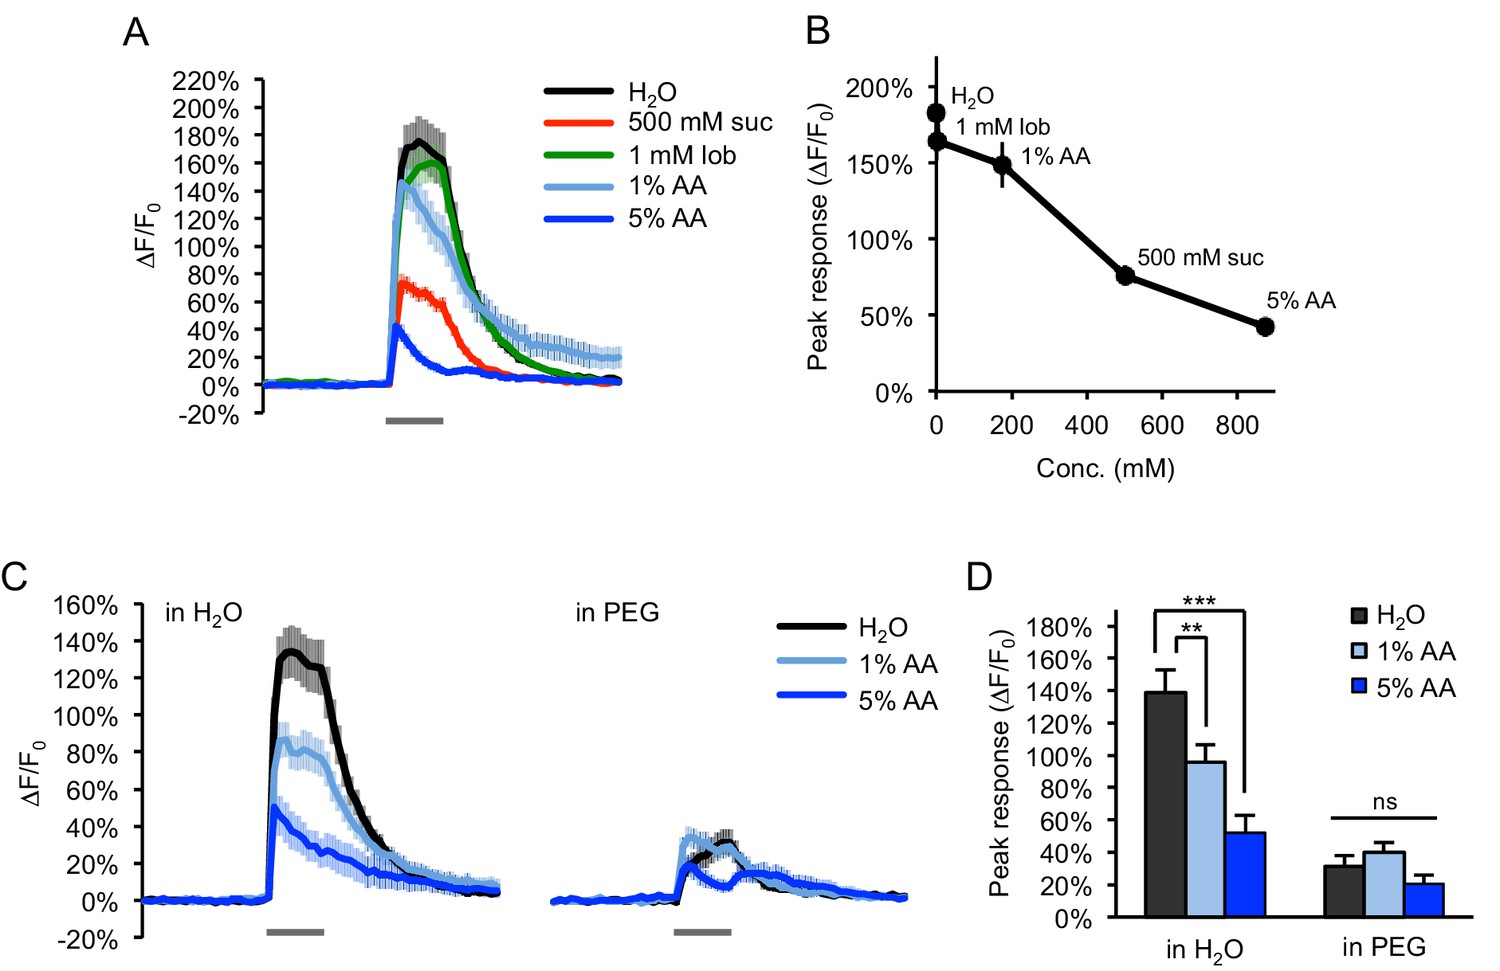
Water-sensing neurons are activated by acetic acid only in accordance with its osmolarity.
(A–B) Water-sensing neurons labeled with ppk28-Gal4 showed GCaMP responses to various taste stimuli (gray bar, 2 s), including water, sucrose (suc), lobeline (lob), and acetic acid (AA). Responses decreased with increasing tastant molarity (B). (C–D) Adding PEG (3350 g/mol) to each tastant solution (10% wt/vol) strongly diminished the response to both water and acetic acid (p<0.001, two-way ANOVA). Responses to acetic acid in PEG were reduced to the same level as that of PEG alone (p>0.05, two-way ANOVA). **p<0.01, ***p<0.001, two-way ANOVA followed by Bonferroni's post-tests. n = 24–27 trials, eight flies.
Figure 5—figure supplement 7

GCaMP-expressing flies show hunger-dependent changes in PER to acetic acid and sucrose.
(A–D) Fed and starved flies expressing GCaMP6f in sugar-sensing neurons (A–B) or bitter-sensing neurons (C–D) were tested for PER to acetic acid (A, C) and sucrose (B, D). Both genotypes showed hunger-dependent changes in the level of PER to acetic acid as well as sucrose. Fed and starved flies were compared using two-way ANOVA (repeated-measures for panels A and C) followed by Bonferroni’s post-tests (*p<0.05, **p<0.01, ***p<0.001; orange or red asterisks correspond to one- or two-day starved flies, respectively). n = 3–4 sets of flies.
Figure 6
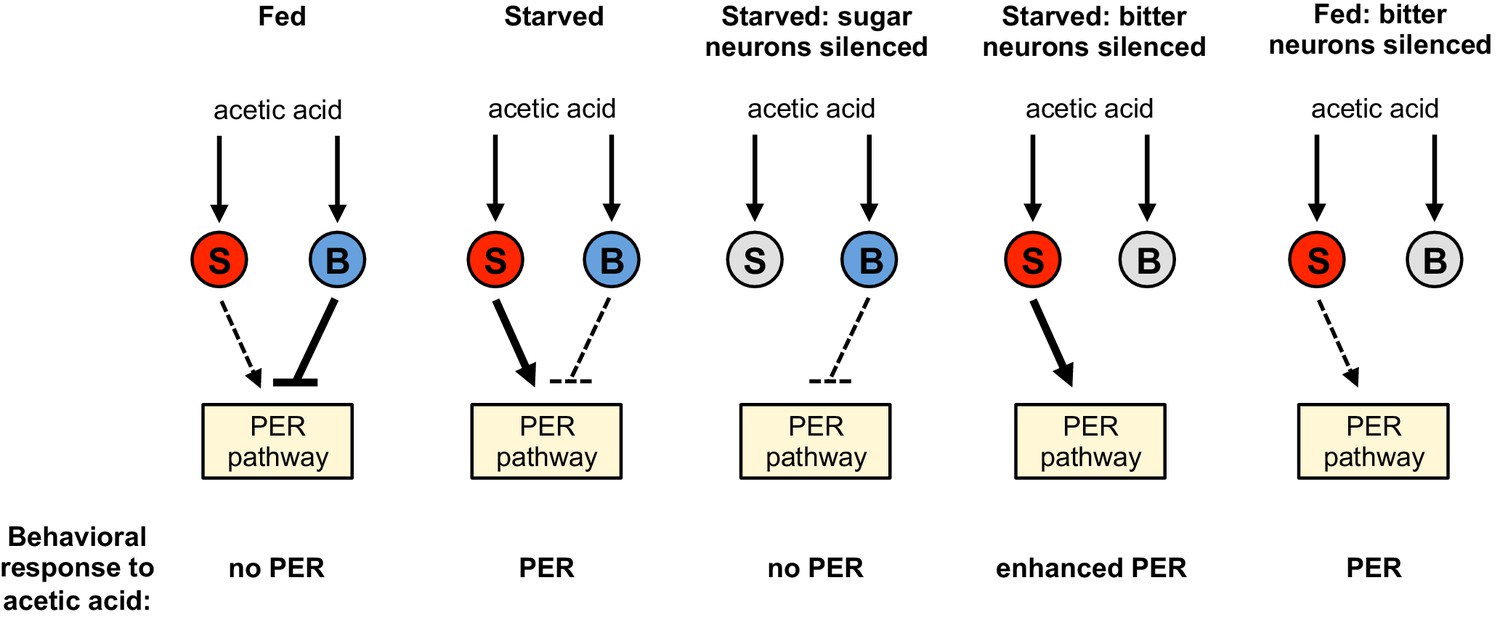
Model for a hunger-dependent switch in the behavioral response to acetic acid.
Acetic acid activates both sugar- and bitter-sensing neurons (‘S’ and ‘B’ respectively). Sugar-sensing neurons promote PER to acetic acid whereas bitter-sensing neurons suppress PER. The balance of these two pathways determines the behavioral response. Hunger both enhances the sugar pathway and suppresses the bitter pathway, most likely by primarily acting downstream of sensory neurons. Thus the bitter pathway dominates in the fed state to suppress PER and elicit aversion, whereas the sugar pathway dominates in the starved state to elicit appetitive PER behavior. Silencing the sugar or bitter neurons (gray) shifts the balance of the two pathways to alter the behavioral response, as shown in the three right schematics.
Videos
Video 1
Directional PER to acetic acid.
A Kimwipe containing 5% acetic acid was alternately applied to the left or right legs of a two-day starved fly. Four trials (two left and two right) are shown in this video. In each case the fly extended its proboscis toward the stimulus.
Video 2
Starved fly voluntarily consuming acetic acid.
A Kimwipe containing 5% acetic acid was applied to the legs of a two-day starved fly, which caused the fly to exhibit PER and ingest acetic acid from the Kimwipe for approximately 7 s.
Tables
Key resources table
| Reagent type (species) or resource | Designation | Source or reference | Identifiers | Additional information |
|---|---|---|---|---|
| Genetic reagent (Drosophila melanogaster) | wild-type control2U (isoCJ1) | Dubnau et al., 2001 | ||
| Genetic reagent (D. melanogaster) | poxn∆M22-B5 | Boll and Noll, 2002 | Flybase: FBal0144686 | |
| Genetic reagent (D. melanogaster) | poxn∆M22-B5 with SuperA (rescue) | Boll and Noll, 2002 | Flybase: FBal0144670 | |
| Genetic reagent (D. melanogaster) | ∆8Grs (R1, ∆Gr5a;; ∆Gr61a, ∆Gr64a-f) | Yavuz et al., 2014 | ||
| Genetic reagent (D. melanogaster) | R1, ∆Gr5a; Gr61a-Gal4, UAS-GCaMP6m; ∆Gr61a, ∆Gr64a-f | Yavuz et al., 2014 | ||
| Genetic reagent (D. melanogaster) | IR25a1 | Benton et al., 2009 | Flybase: FBst0041736 | |
| Genetic reagent (D. melanogaster) | IR25a2 | Benton et al., 2009 | Flybase: FBst0041737 | |
| Genetic reagent (D. melanogaster) | IR76b1 | Zhang et al., 2013 | Flybase: FBst0051309 | |
| Genetic reagent (D. melanogaster) | IR76b2 | Zhang et al., 2013 | Flybase: FBst0051310 | |
| Genetic reagent (D. melanogaster) | w1118 | Amrein lab | Flybase: FBst0003605 | |
| Genetic reagent (D. melanogaster) | Gr64f-Gal4 | Dahanukar et al., 2007 | Flybase: FBtp0057275 | |
| Genetic reagent (D. melanogaster) | Gr66a-Gal4 | Scott et al., 2001 | Flybase: FBtp0014661 | |
| Genetic reagent (D. melanogaster) | Gr98d-Gal4 | Weiss et al., 2011 | Flybase: FBst0057692 | |
| Genetic reagent (D. melanogaster) | Gr22f-Gal4 | Weiss et al., 2011 | Flybase: FBst0057610 | |
| Genetic reagent (D. melanogaster) | Gr59c-Gal4 | Weiss et al., 2011 | Flybase: FBst0057650 | |
| Genetic reagent (D. melanogaster) | Gr47a-Gal4 | Weiss et al., 2011 | Flybase: FBst0057638 | |
| Genetic reagent (D. melanogaster) | ppk28-Gal4 | Cameron et al., 2010 | Flybase: FBtp0054514 | |
| Genetic reagent (D. melanogaster) | UAS-Kir2.1 | Baines et al., 2001 | Flybase: FBtp0014166 | |
| Genetic reagent (D. melanogaster) | UAS-GCaMP6f | Chen et al., 2013 | Flybase: FBst0042747 | |
| Genetic reagent (D. melanogaster) | UAS-norpARNAi | Masek and Keene, 2013 | Flybase: FBst0031113 | |
| Chemical compound, drug | acetic acid | Sigma-Aldrich | 338826 | |
| Chemical compound, drug | sucrose | Sigma-Aldrich | S9378 | |
| Chemical compound, drug | lobeline hydrochloride | Sigma-Aldrich | 141879 | |
| Chemical compound, drug | quinine hydrochloride dihydrate | Sigma-Aldrich | Q1125 | |
| Chemical compound, drug | myristic acid | Sigma-Aldrich | M3128 | |
| Software, algorithm | Prism, version 4 | GraphPad | ||
| Software, algorithm | MATLAB | Mathworks | ||
| Other | two-photon laser scanning microscope | Ultima, Bruker | ||
| Other | Ti:S laser | Chameleon Vision, Coherent | ||
| Other | GaAsP detector | Hamamatsu Photonics |
Additional files
-
Supplementary file 1
Summary of statistical results.
Summary of all statistical results from this study.
- https://doi.org/10.7554/eLife.47677.028
-
Transparent reporting form
- https://doi.org/10.7554/eLife.47677.029
Download links
A two-part list of links to download the article, or parts of the article, in various formats.
Downloads (link to download the article as PDF)
Open citations (links to open the citations from this article in various online reference manager services)
Cite this article (links to download the citations from this article in formats compatible with various reference manager tools)
Acetic acid activates distinct taste pathways in Drosophila to elicit opposing, state-dependent feeding responses
eLife 8:e47677.
https://doi.org/10.7554/eLife.47677


