The representational space of observed actions
- Royal Holloway University of London, United Kingdom
- University of Trento, Italy
- University of Regensburg, Germany
Figures
Figure 1 with 1 supplement
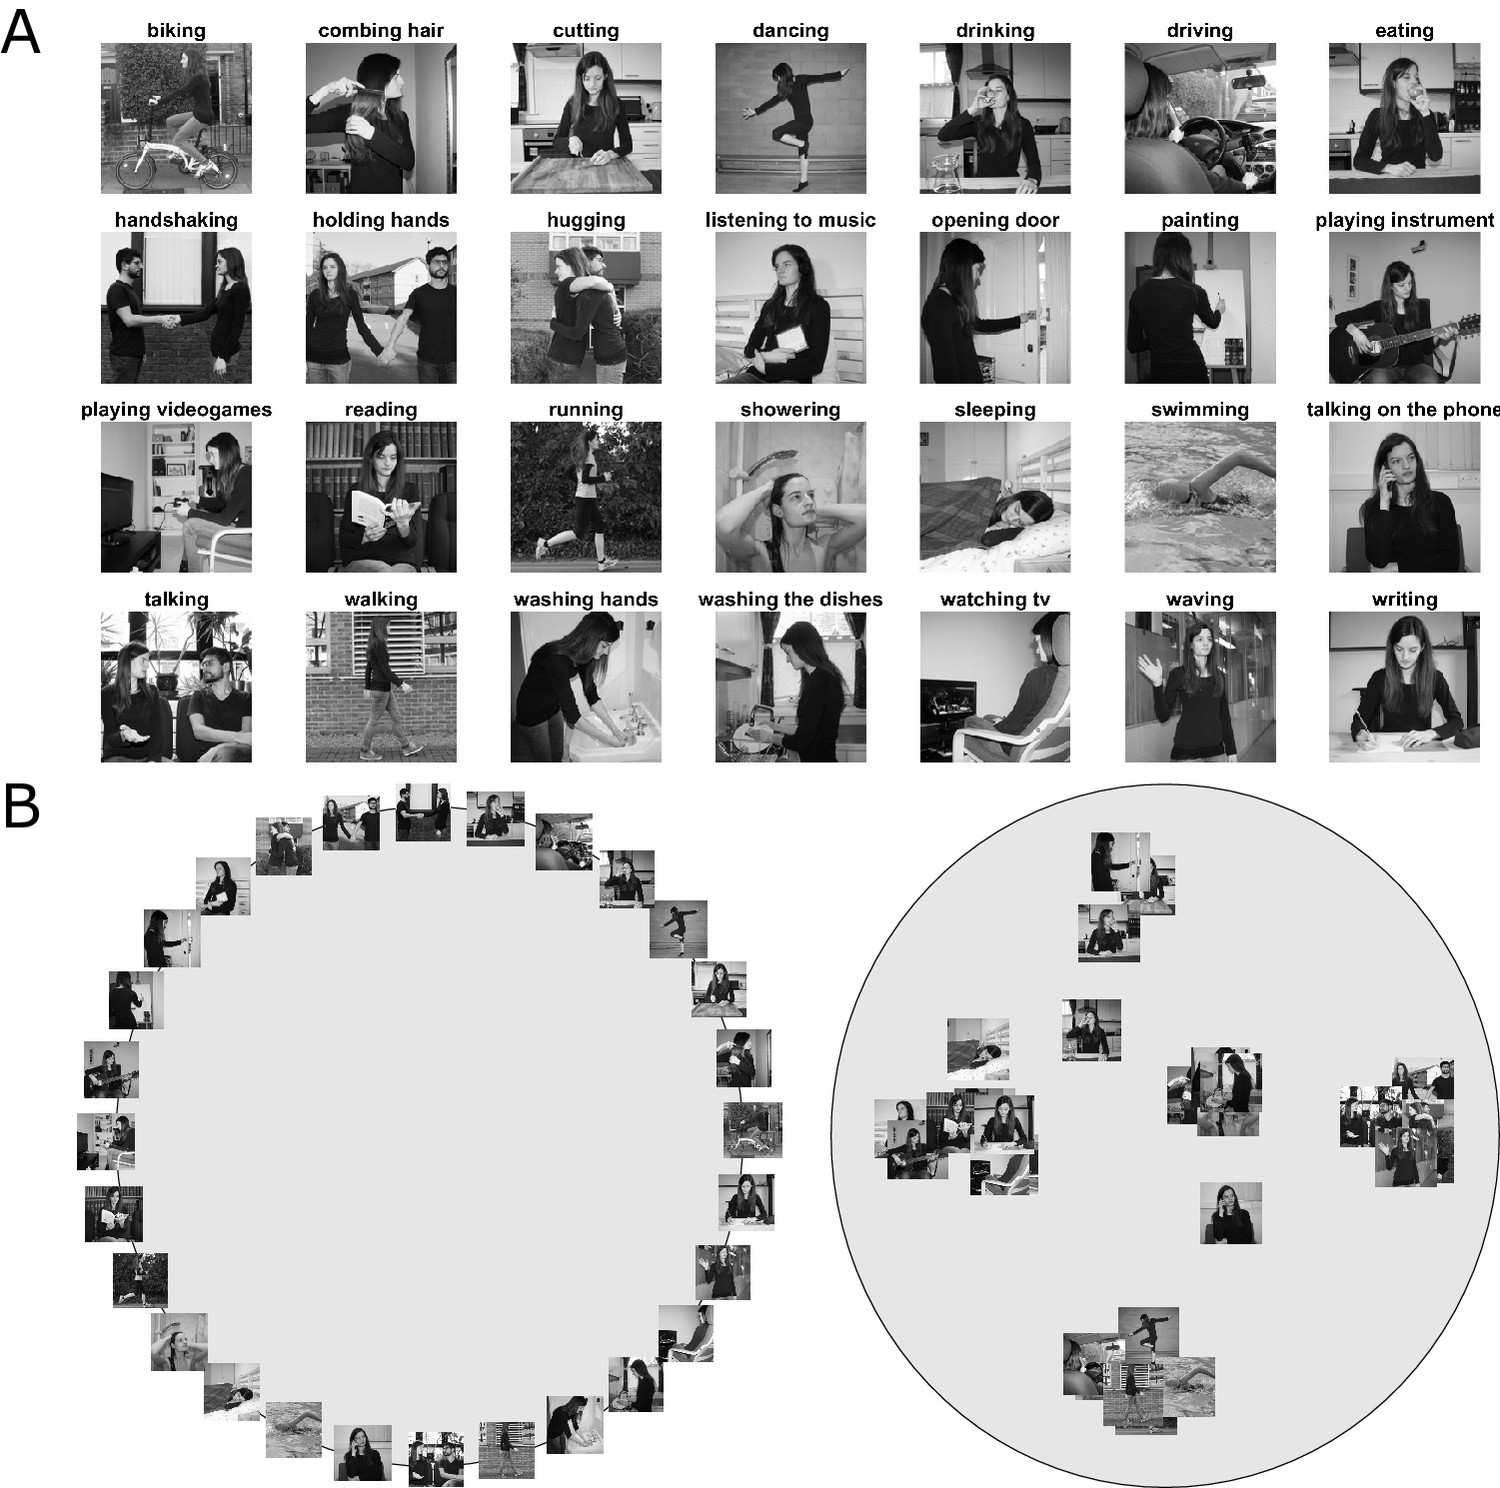
Stimuli and behavioral task.
(A) Stimuli used in the behavioral and the fMRI experiment, depicting static images of 28 everyday actions. To increase perceptual variability, actions were shown from different viewpoints, in different scenes, using two different actors (see text for details) and different objects (for actions involving an object). For a full set of stimuli used in the fMRI experiment, see Figure 1—figure supplement 1. (B) Illustration of the behavioral experiment used for inverse multidimensional scaling. In the first trial of the experiment, participants were presented with an array of images arranged on the circumference of a gray circle (left panel). In each subsequent trial, an adaptive algorithm determined a subset of actions that provided optimal evidence for the pairwise dissimilarity estimates (see Kriegeskorte and Mur, 2012 and Materials and methods, for details). In different parts of the experiment, participants were asked to rearrange the images according to their perceived similarity with respect to a specific aspect of the action, namely, their meaning (or semantics), the body part(s) involved, the scene/context in which the action typically takes place, movement kinematics, and objects involved in the action. Right panel: Example arrangement resulting from the semantic task of one representative participant. Using inverse multidimensional scaling, we derived a behavioral model (see Figure 2) from this arrangement, individually for each participant, that we then used for the representational similarity analysis to individuate those brain regions that showed a similar representational geometry (for details, see Materials and methods section).
Figure 1—figure supplement 1
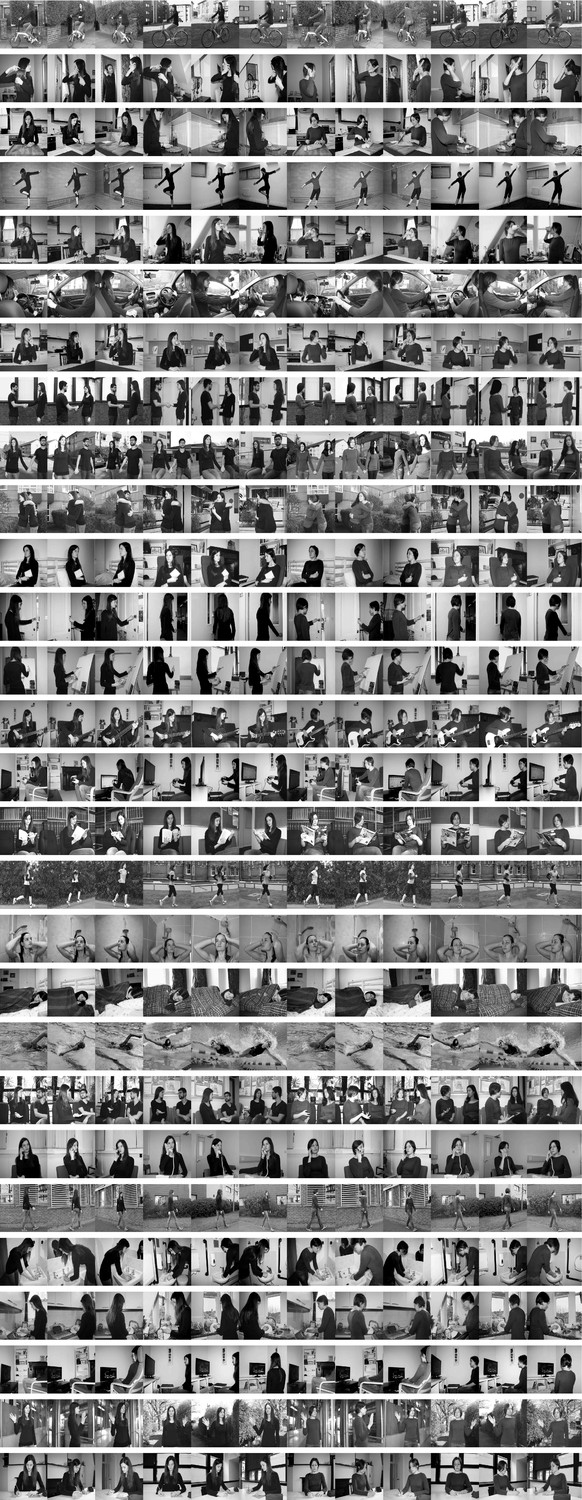
All images used in the fMRI experiment.
Different actions are depicted in rows (for corresponding labels, see words printed in bold font in Supplementary file 3). Different exemplars for each action are shown in the columns. Exemplars varied in terms of the actor (2), scene (2), and viewing angle (3).
Figure 2 with 1 supplement
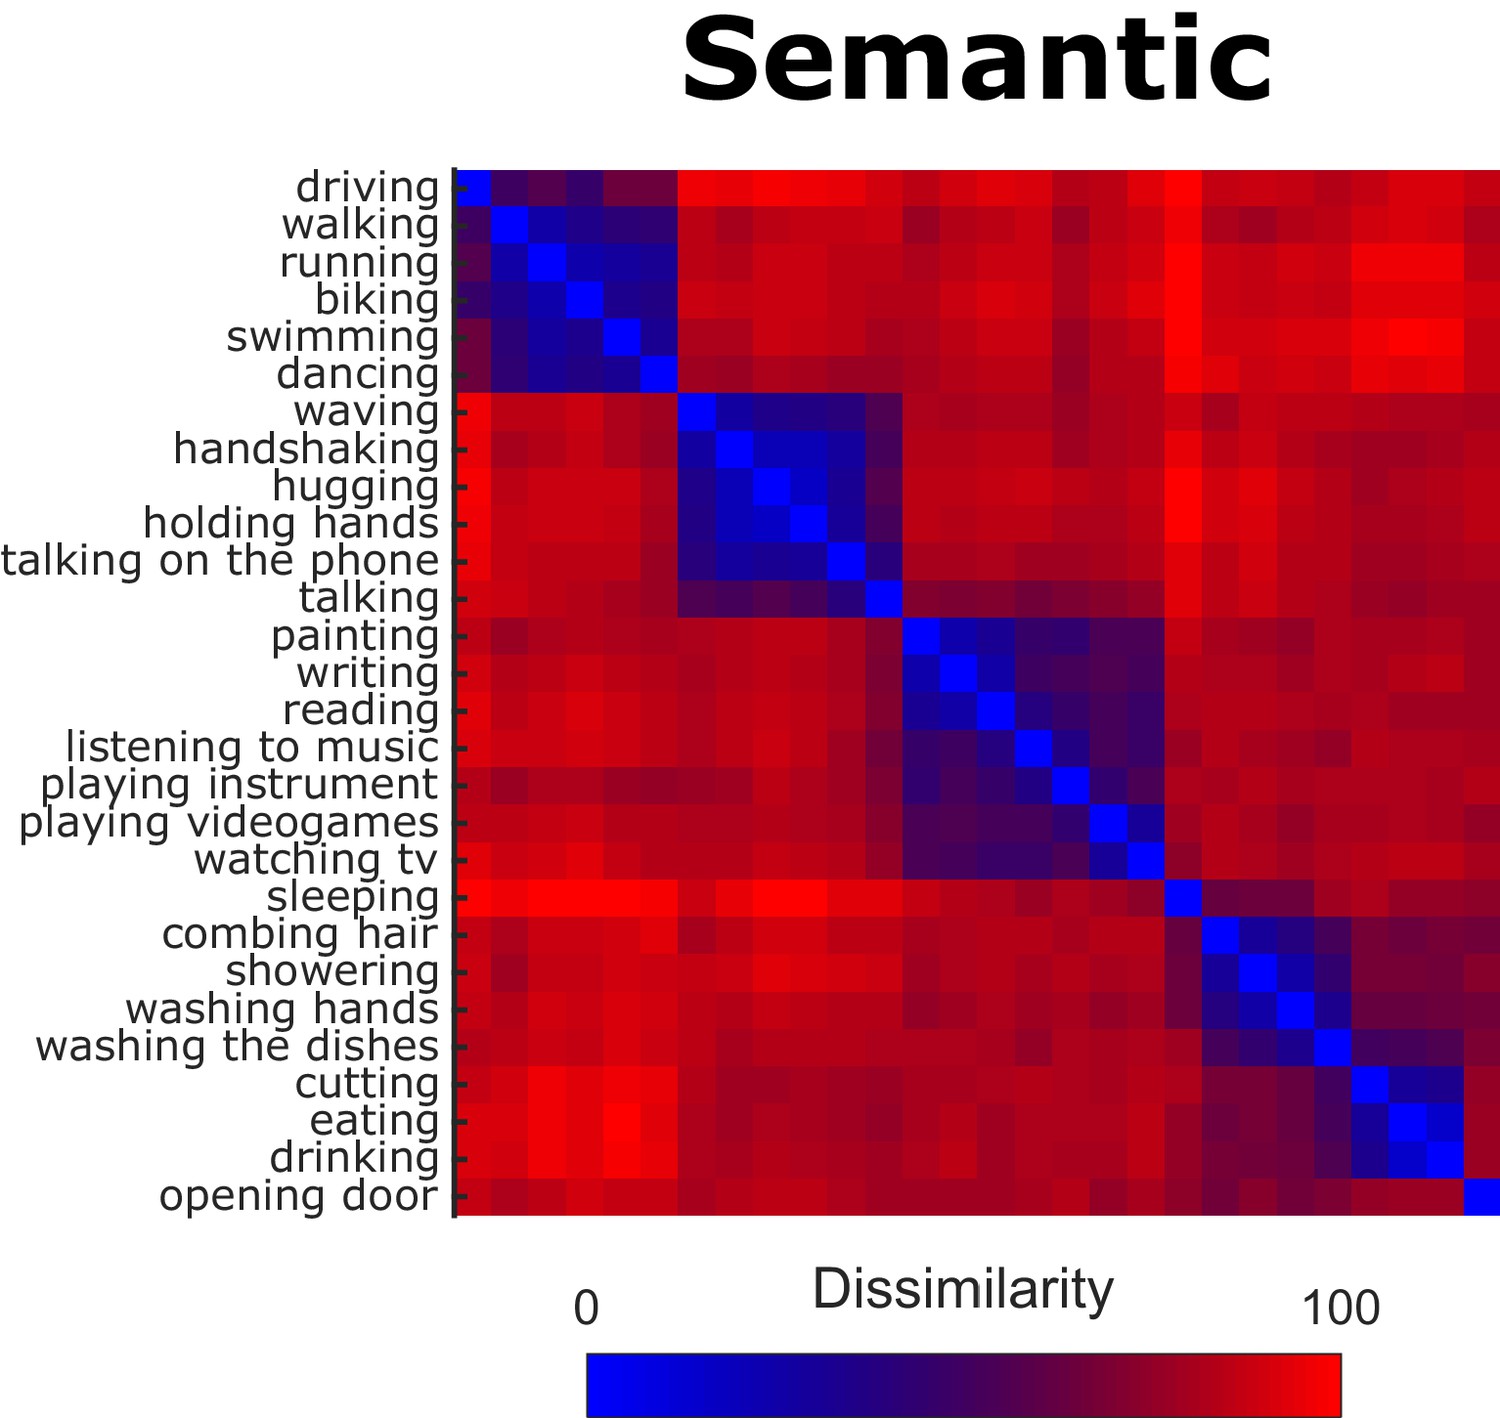
Behavioral Representational Dissimilarity Matrix for the semantic model.
Bluish colors indicate high similarity between pairwise combinations of actions, whereas reddish colors indicate high dissimilarity.
Figure 2—figure supplement 1
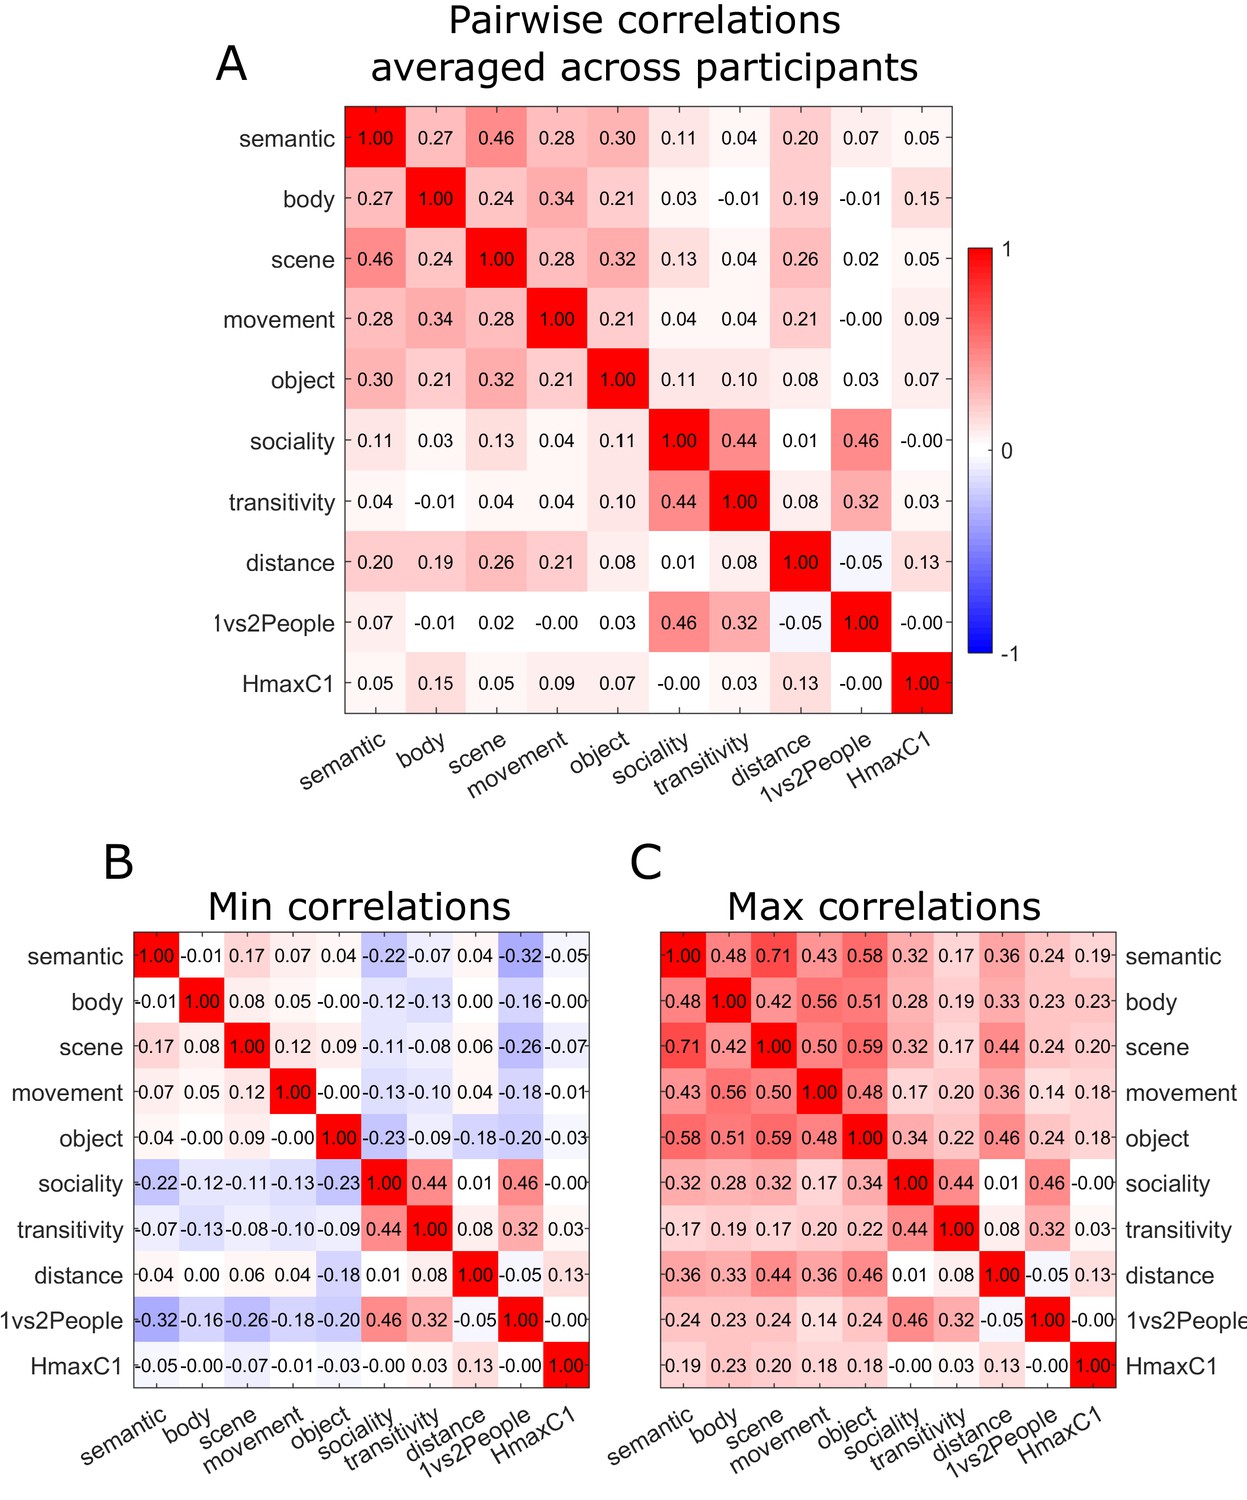
Pairwise cross-correlation matrix across models.
For each participant, we computed the pairwise cross-correlation matrix across models. We then computed (A) the averaged correlation values across participants; and reported (B) the maximum and (C) the minimum correlation values across participants. For a corresponding analysis of collinearity using the variance inflation factor, see Materials and methods, multiple regression RSA.
Figure 3 with 4 supplements
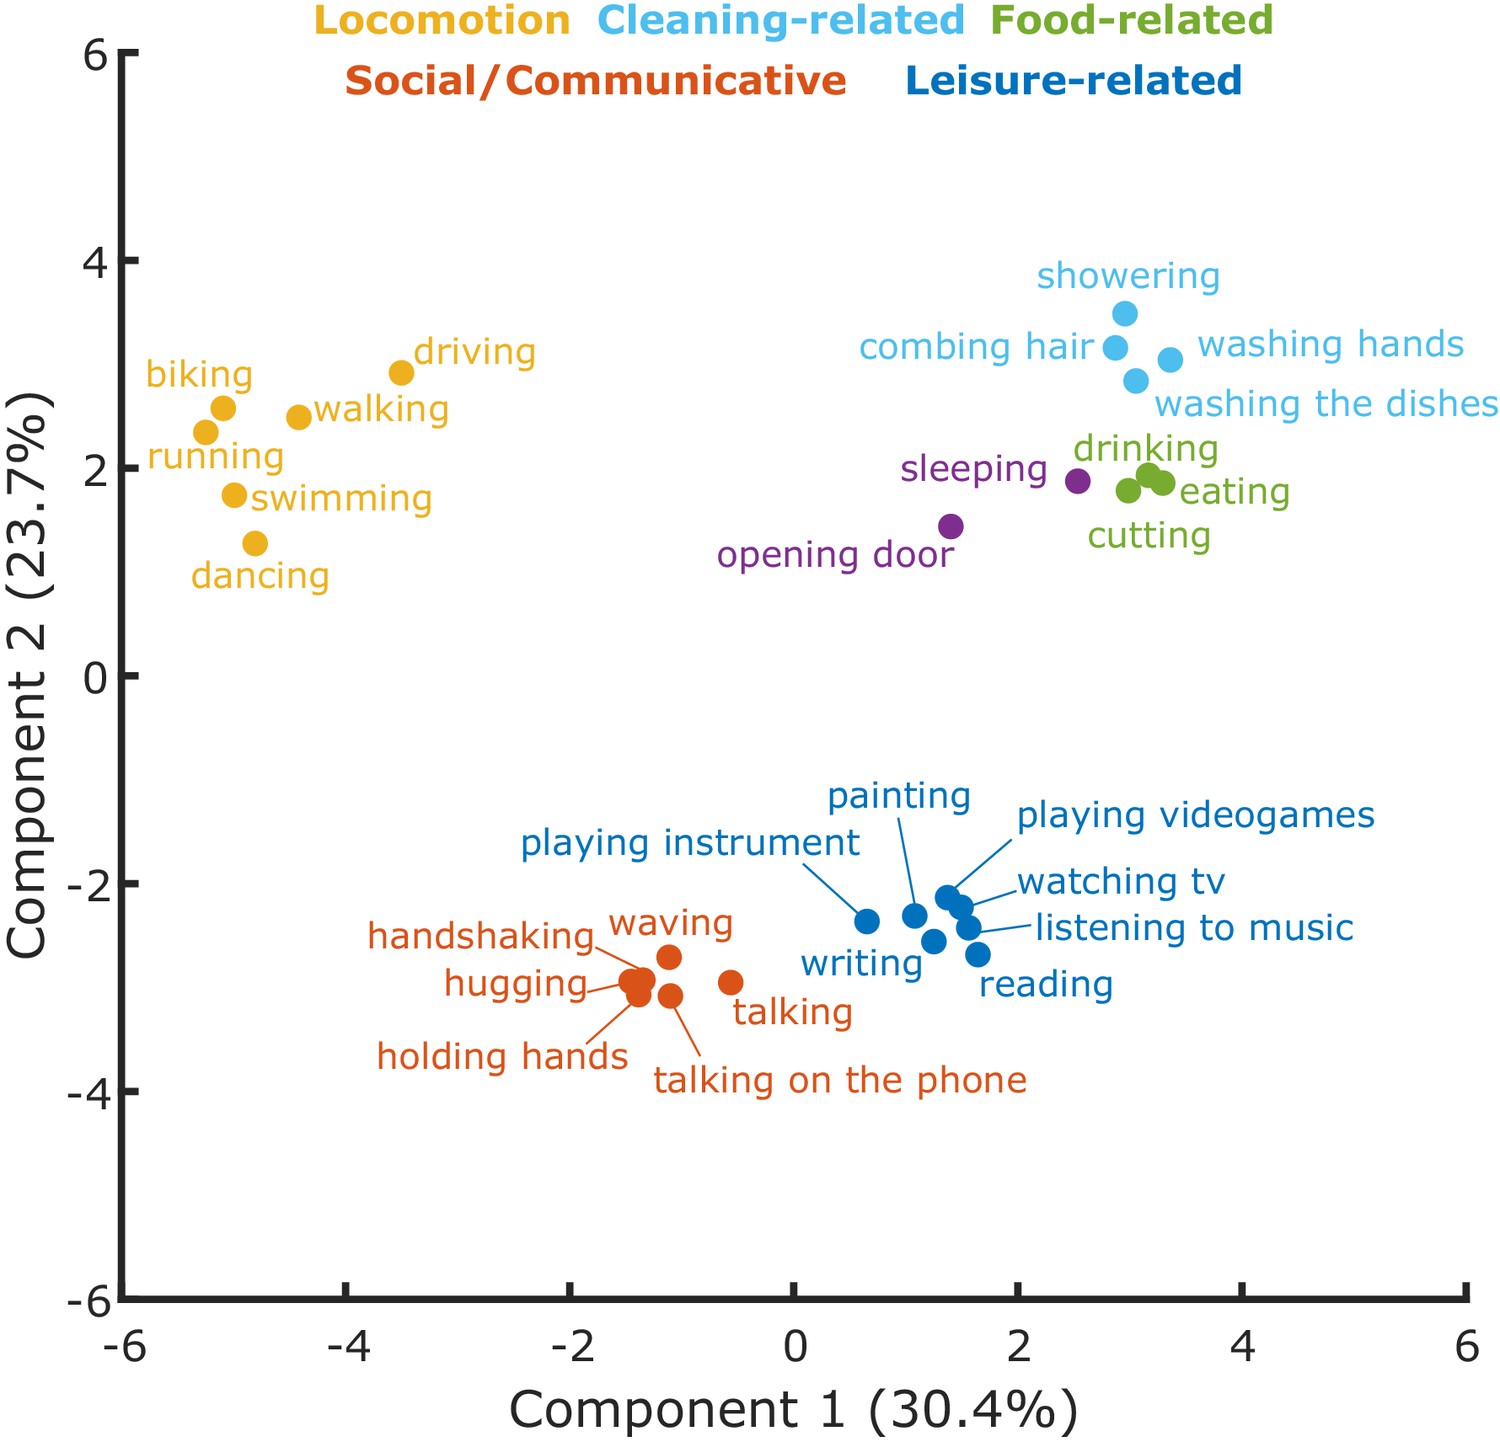
Cluster analysis.
Clusters resulting from the K-means clustering analysis for the semantic task. The 2D-plot shows component 1 and 2, the corresponding labels of individual actions and the suggested labels for the categories resulting from the K-means clustering. For a visualization of the organization of these actions along the third component, which explained 23.4% of the variance, please refer to Figure 3—figure supplement 3.
Figure 3—figure supplement 1
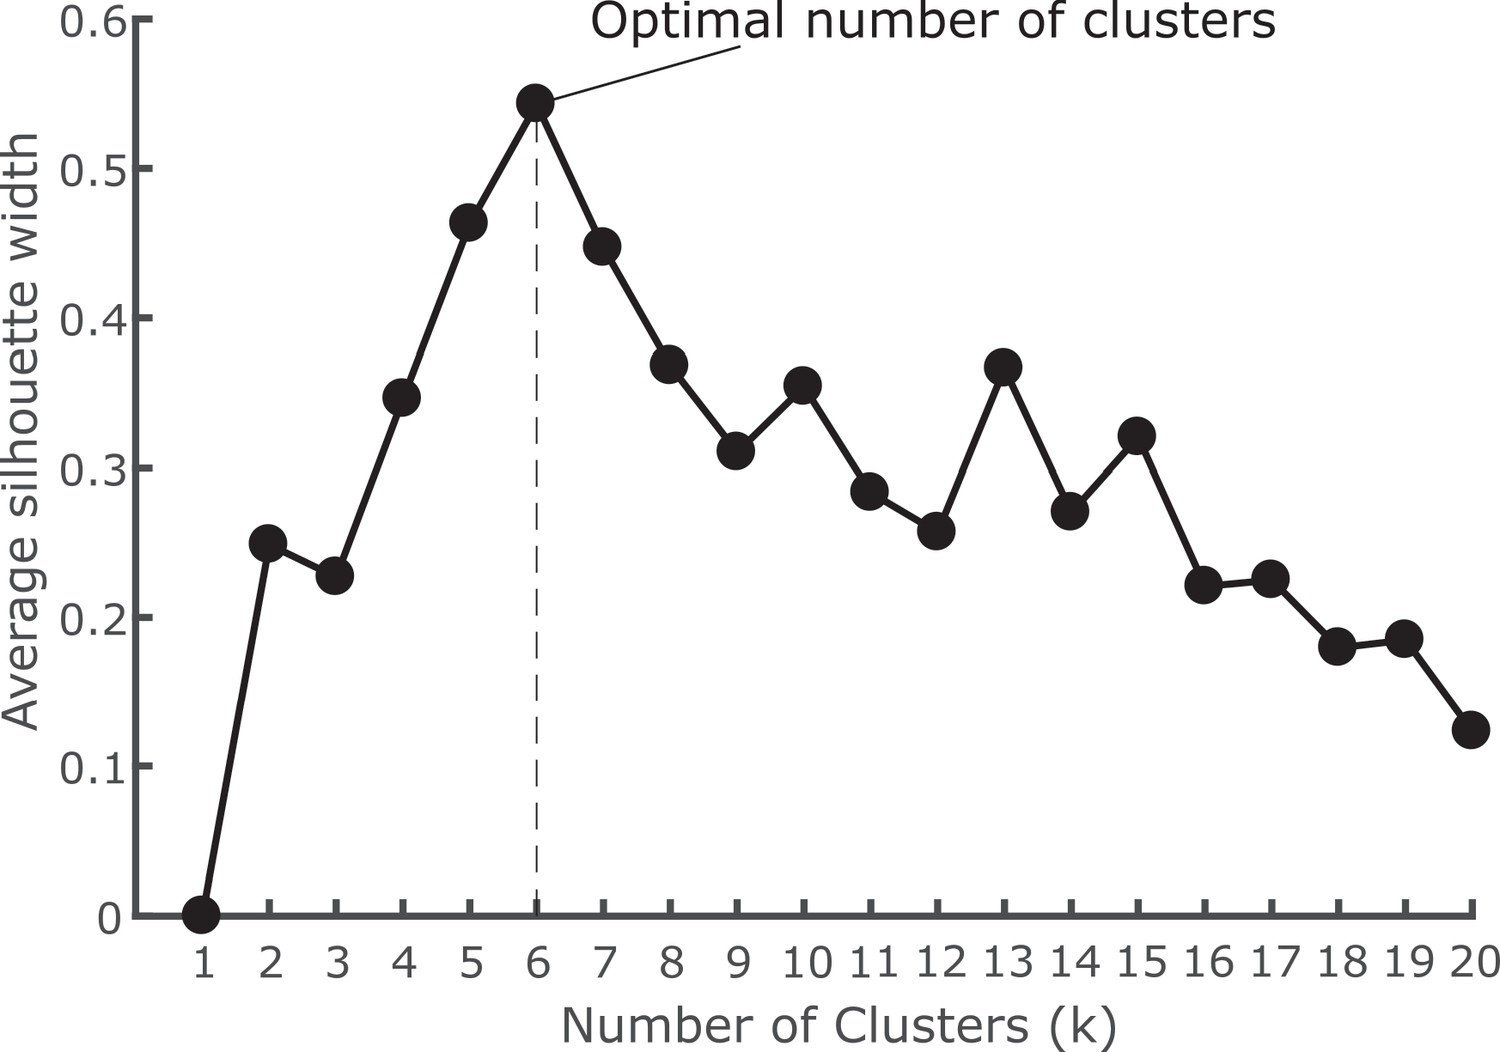
Results silhouette analysis.
Silhouette analysis revealed that the optimal number of clusters for the Semantic model was 6. The analysis was performed using the fviz_nbclust function of the R package ‘factoextra’. The silhouette width is a measure of how well each item fits within its cluster with higher values indicating better fit. The average silhouette width is the average of the all items. The algorithm computes the average silhouette width as a function of the number of clusters (k). The highest value of the average silhouette width is taken and the corresponding k is selected as the optimal number of clusters.
Figure 3—figure supplement 2
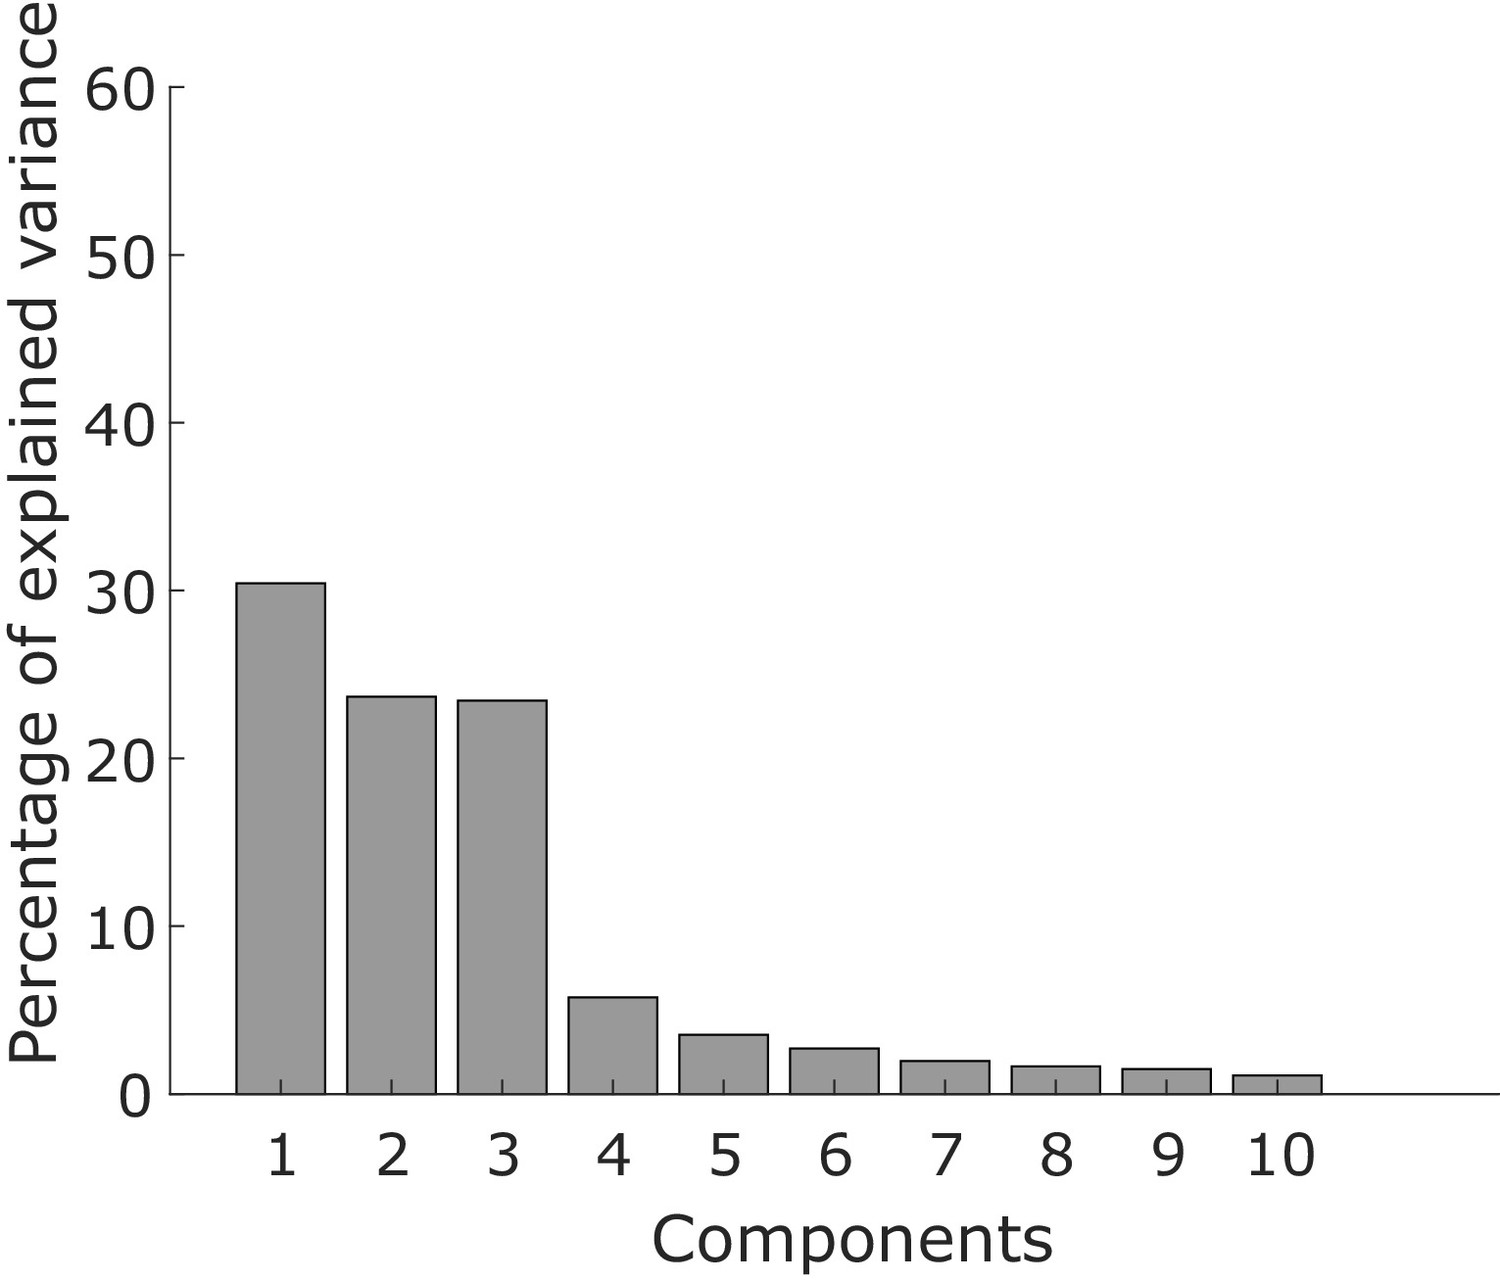
Eigenvalues obtained from the PCA of the semantic model.
The PCA shows that the first three components accounted for the largest amount of variance.
Figure 3—figure supplement 3
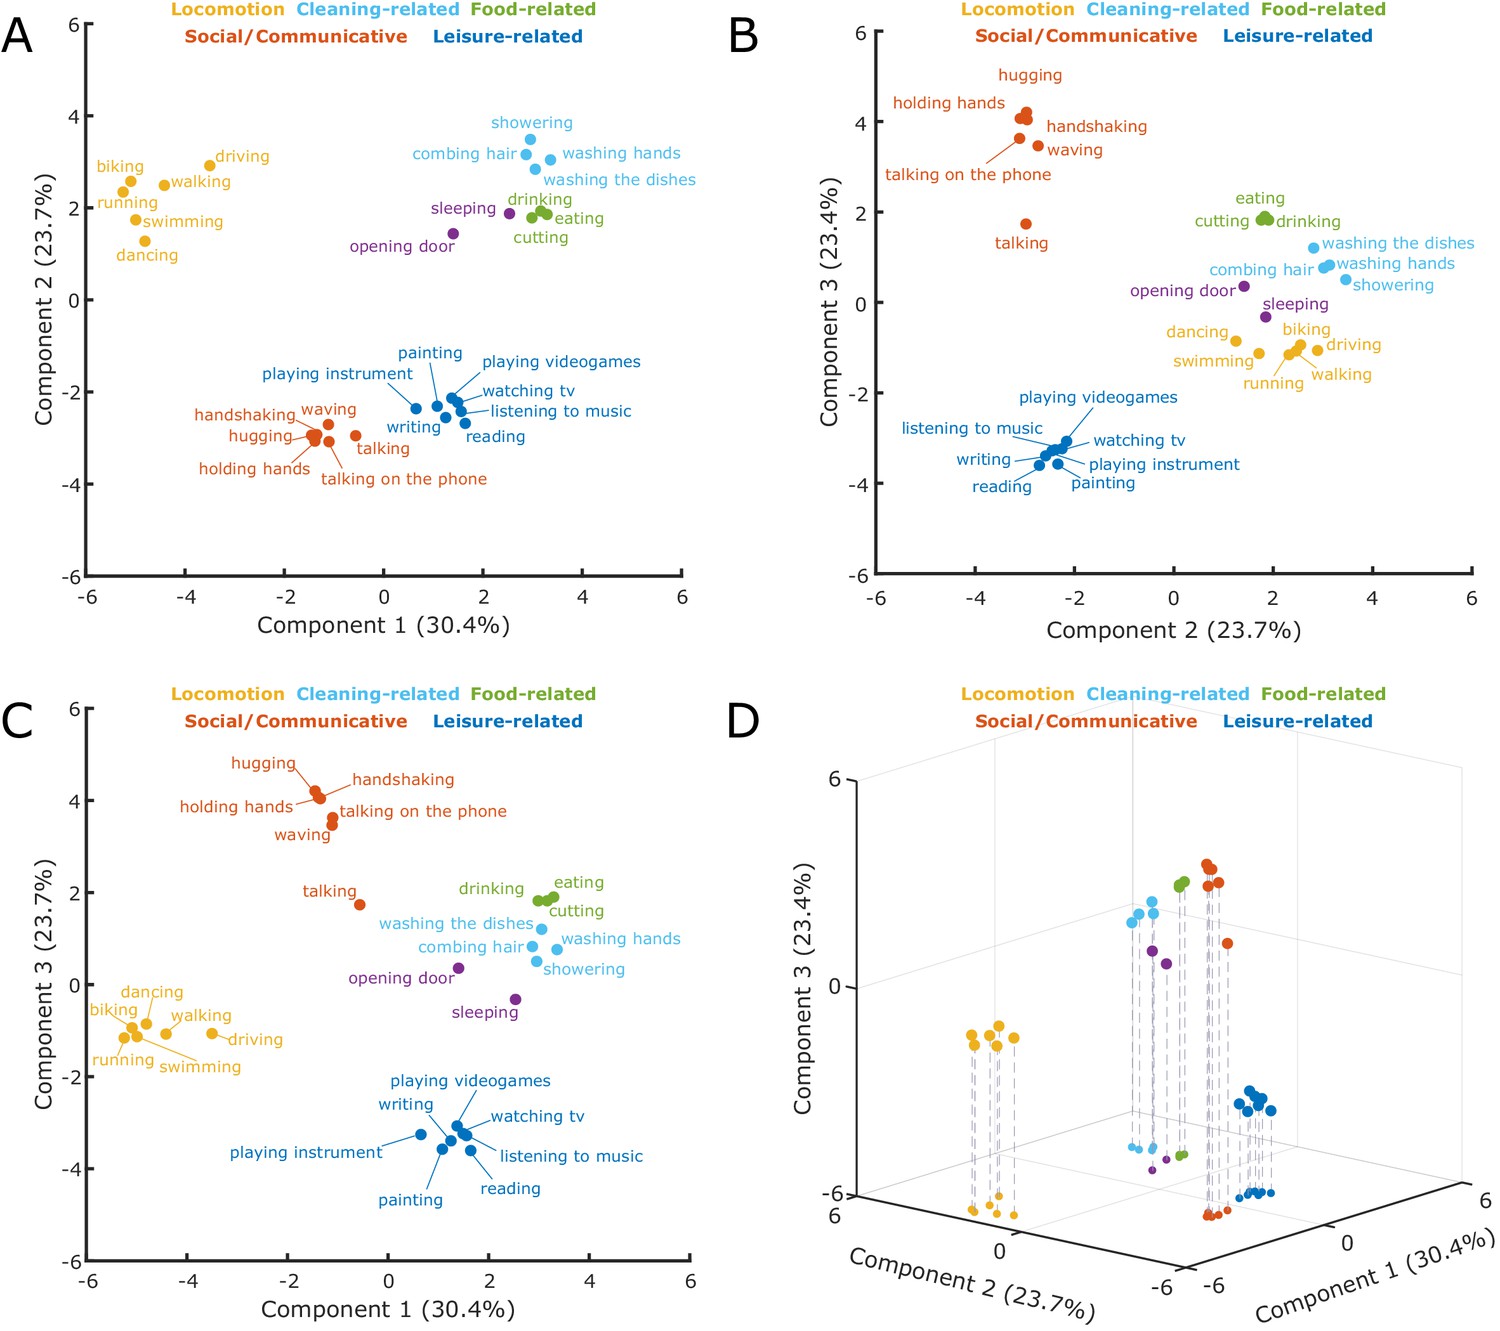
Results cluster analysis.
Clusters resulting from the K-means clustering analysis for the semantic model. (A) 2D-plot showing component 1 and 2, corresponding labels of individual actions and suggested labels for the categories resulting from the K-means clustering. (B) 2D-plot showing component 2 and 3. (C) 2D-plot showing component 1 and 3. (D) 3D-plot showing components 1–3.
Figure 3—figure supplement 4
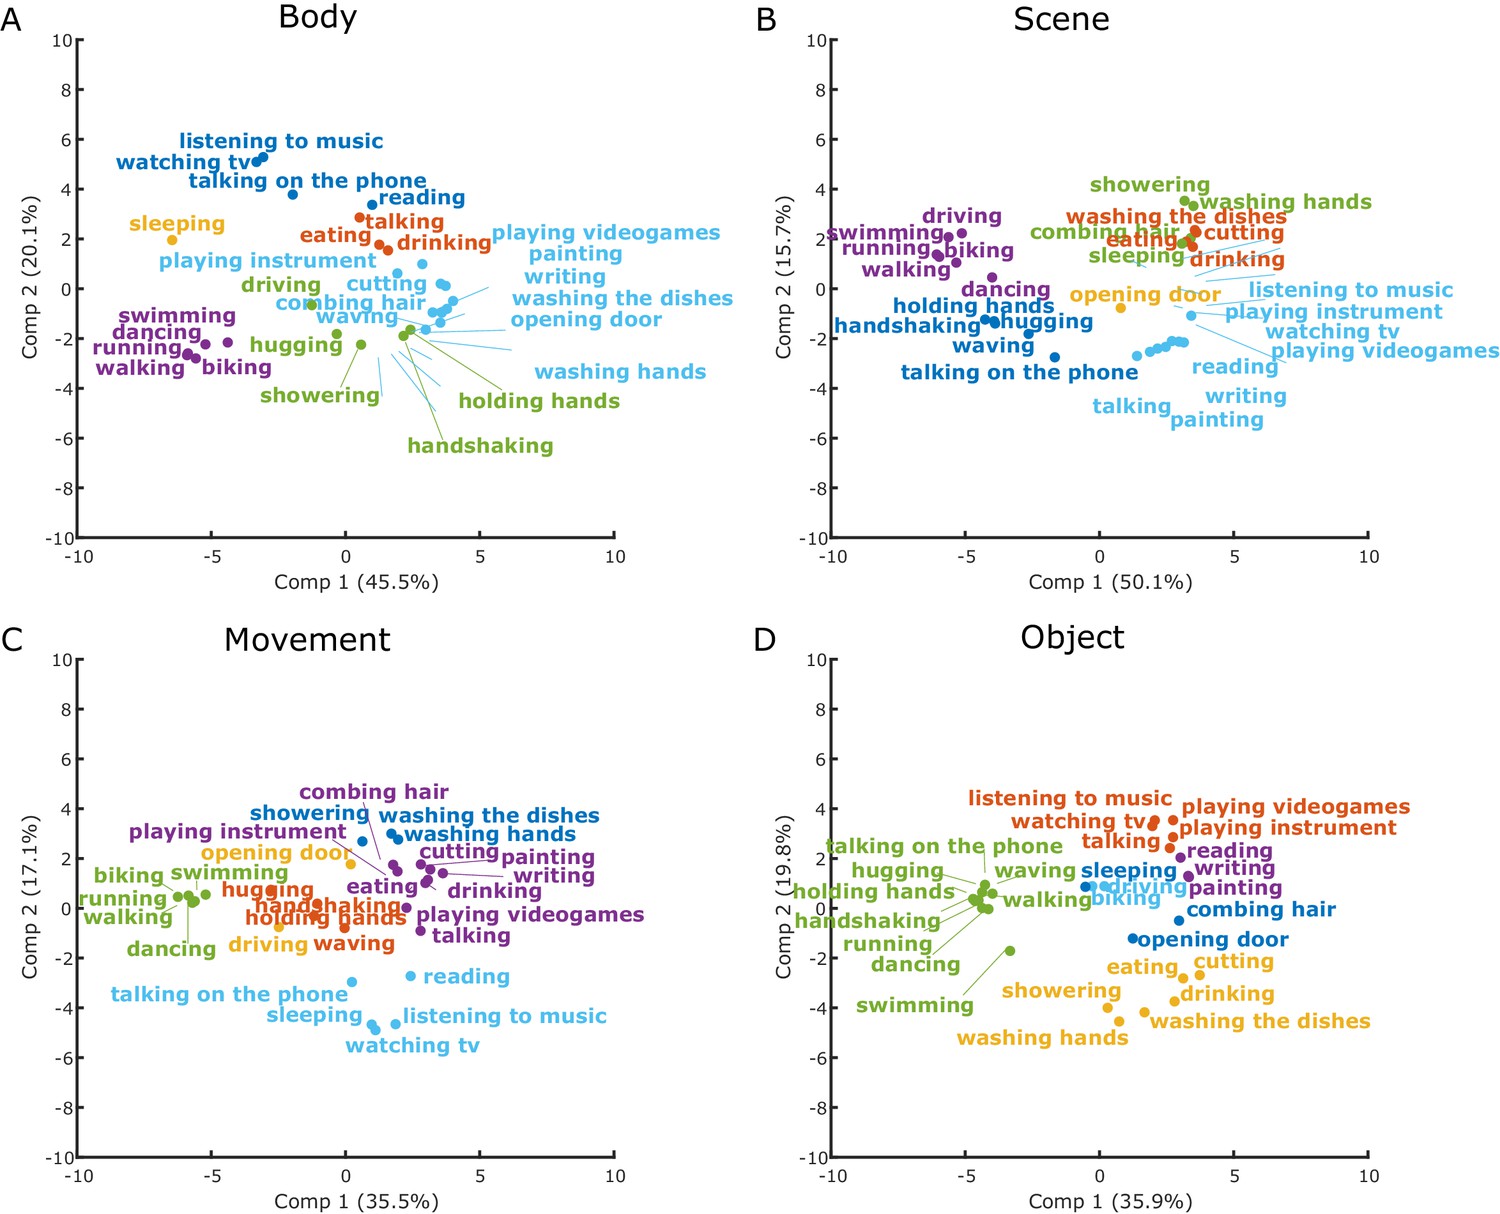
First two principal components of the control models.
Clusters were distinguished using K-means clustering as implemented in R. Number of clusters used as input were 6 (based on the Silhouette analysis of the semantic model; see Figure 3—figure supplement 1). Colors are used to distinguish between the six resulting clusters in each analysis.
Figure 4
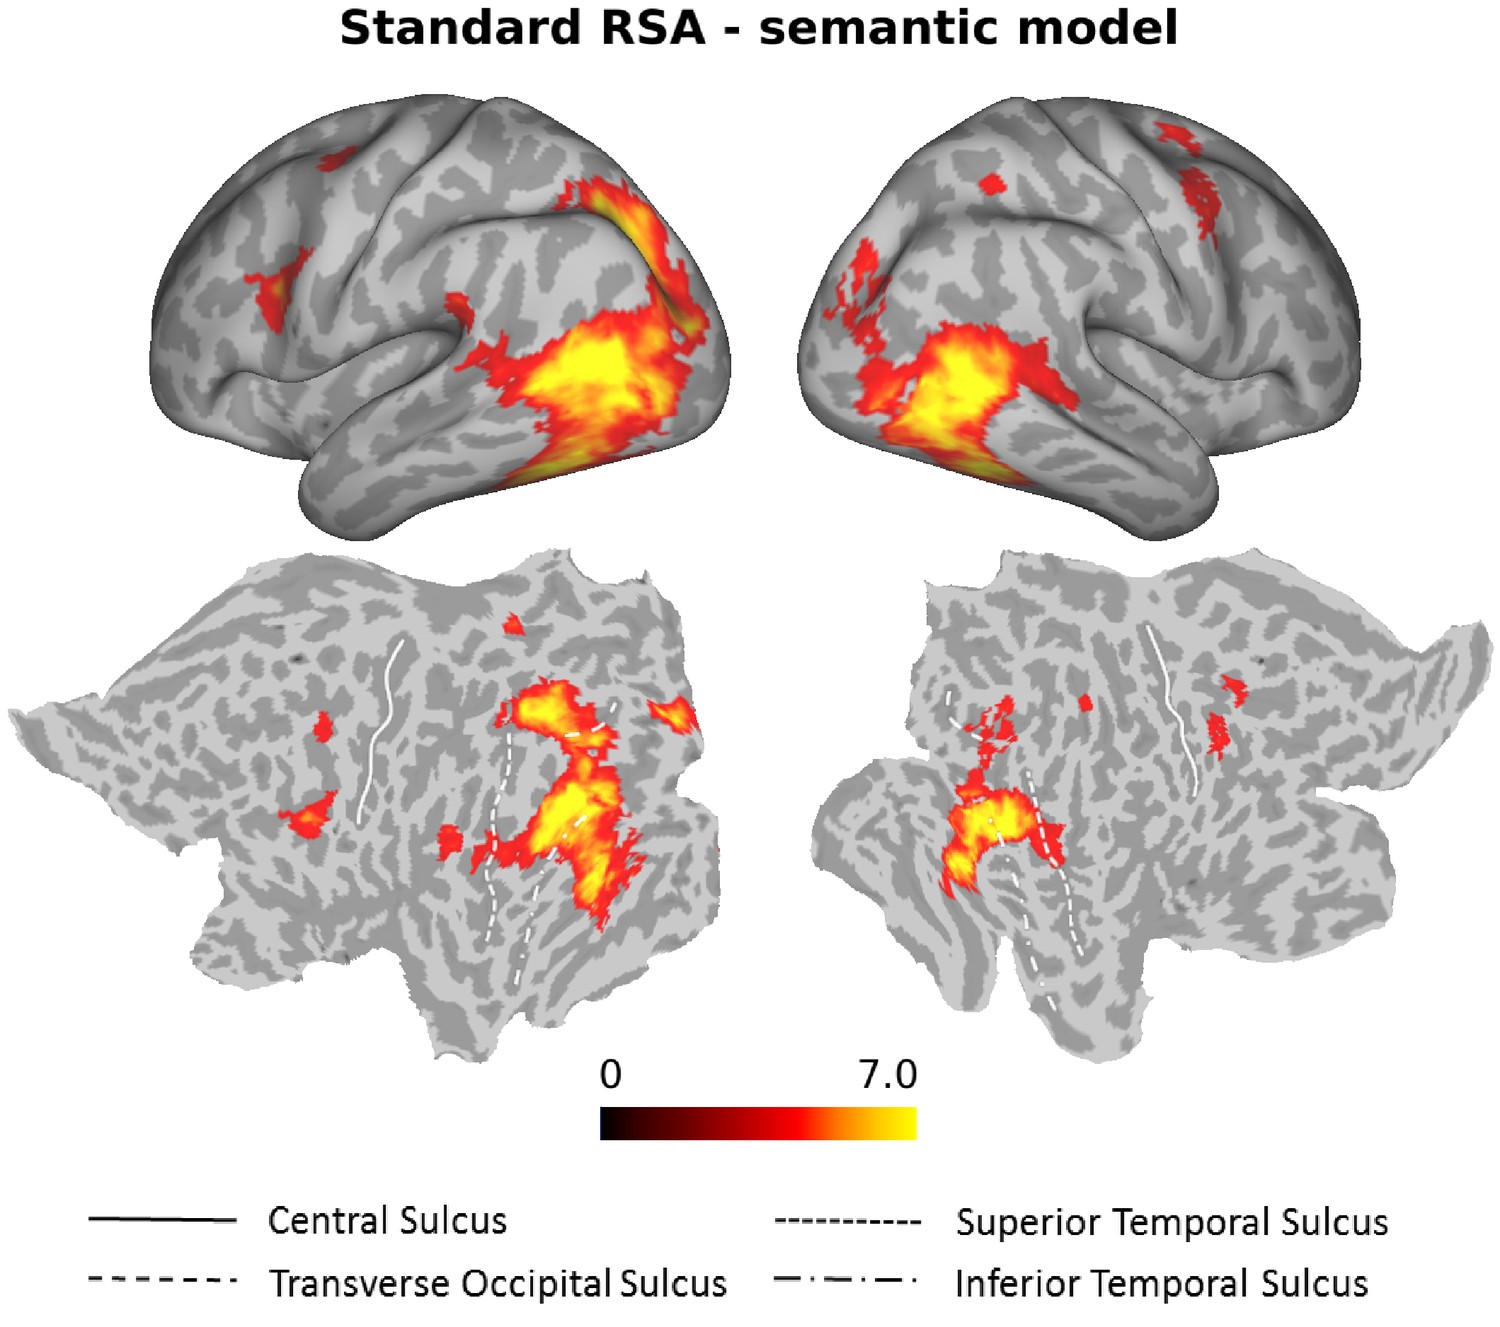
Standard RSA, Semantic model.
Group results of the searchlight-based RSA using the semantic model (standard RSA, that is second order correlation between neural data and behavioral model). Statistical maps only show the positive t values that survived a cluster-based nonparametric analysis with Monte Carlo permutation (cluster stat: max sum; initial pval <0.001; Stelzer et al., 2013). The resulting individual correlation maps were first Fisher transformed and then converted to t scores. After the correction, data were converted to z scores, and only values greater than 1.65 (one-tailed test) were considered as significant. This analysis revealed clusters in bilateral LOTC, bilateral IPL and bilateral precentral gyrus (see Supplementary file 1 for details).
Figure 5
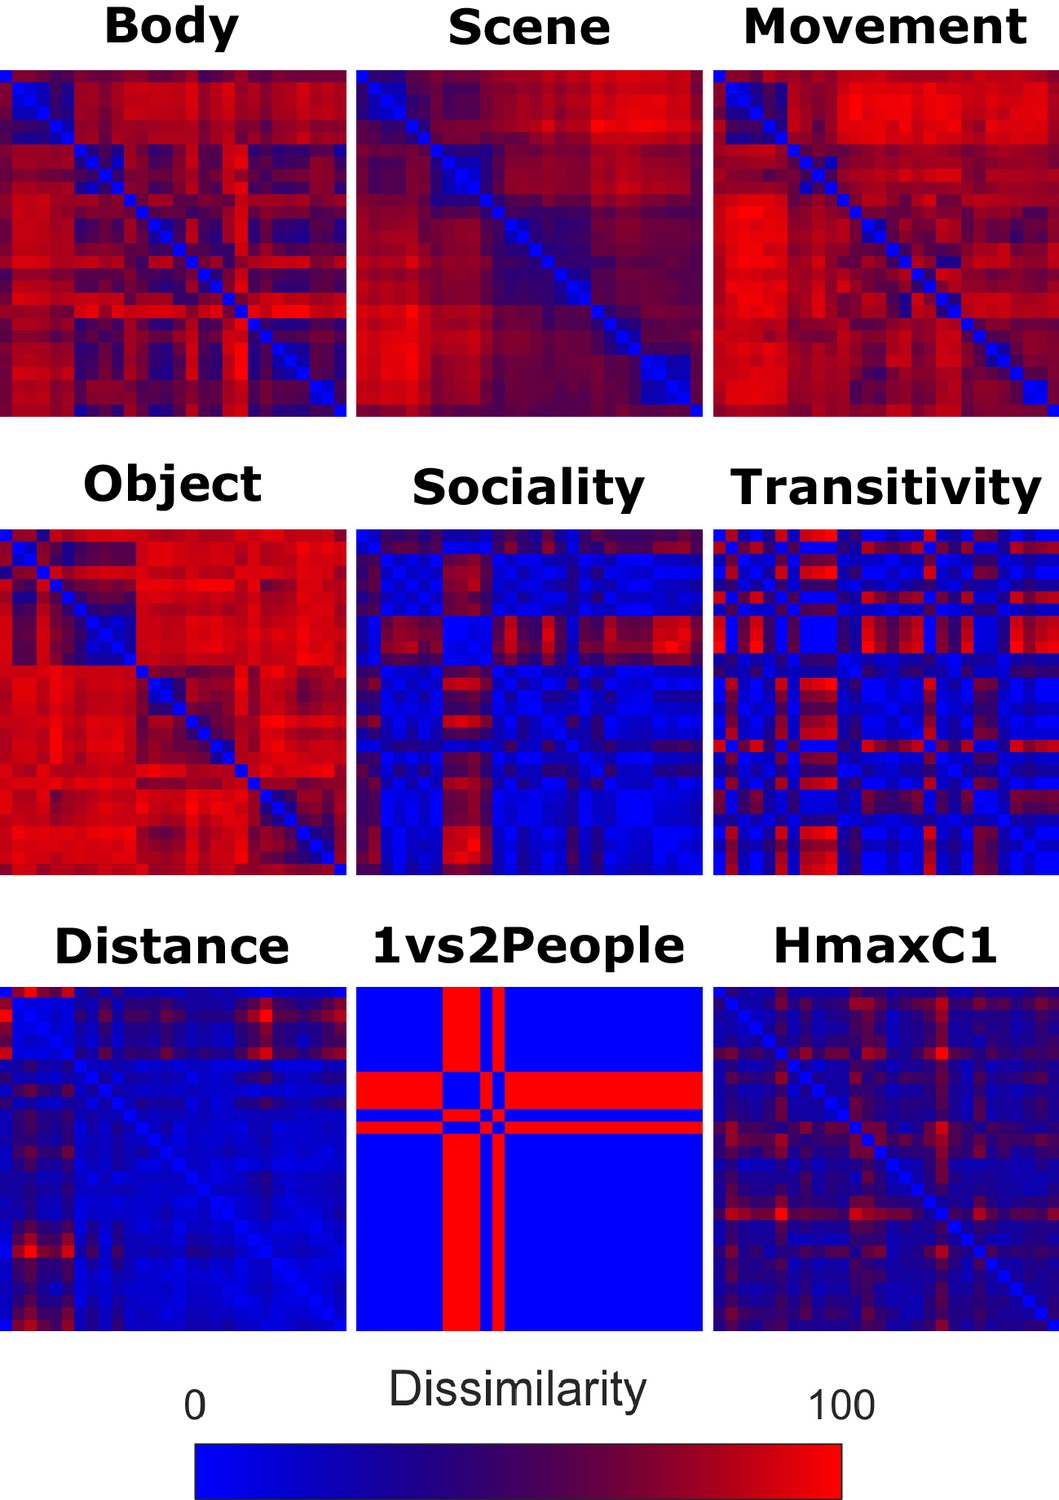
Model Representational Dissimilarity Matrices.
Group representational dissimilarity matrices for body, scene, movement, and object model, derived from inverse MDS carried out in the same group of participants after the fMRI experiment. The sociality, transitivity and distance model were based on ratings in a separate group of participants. For construction of the 1 vs 2 people and the HMAX-C1 model, and further details on the construction of the remaining models, see Materials and methods, section Construction of Representational Dissimilarity Matrices. Bluish colors indicate high similarity between pairwise combinations of actions, whereas reddish colors indicate high dissimilarity. For ease of comparison, we used the ordering of actions resulting from the semantic task (see Figure 2).
Figure 6 with 2 supplements
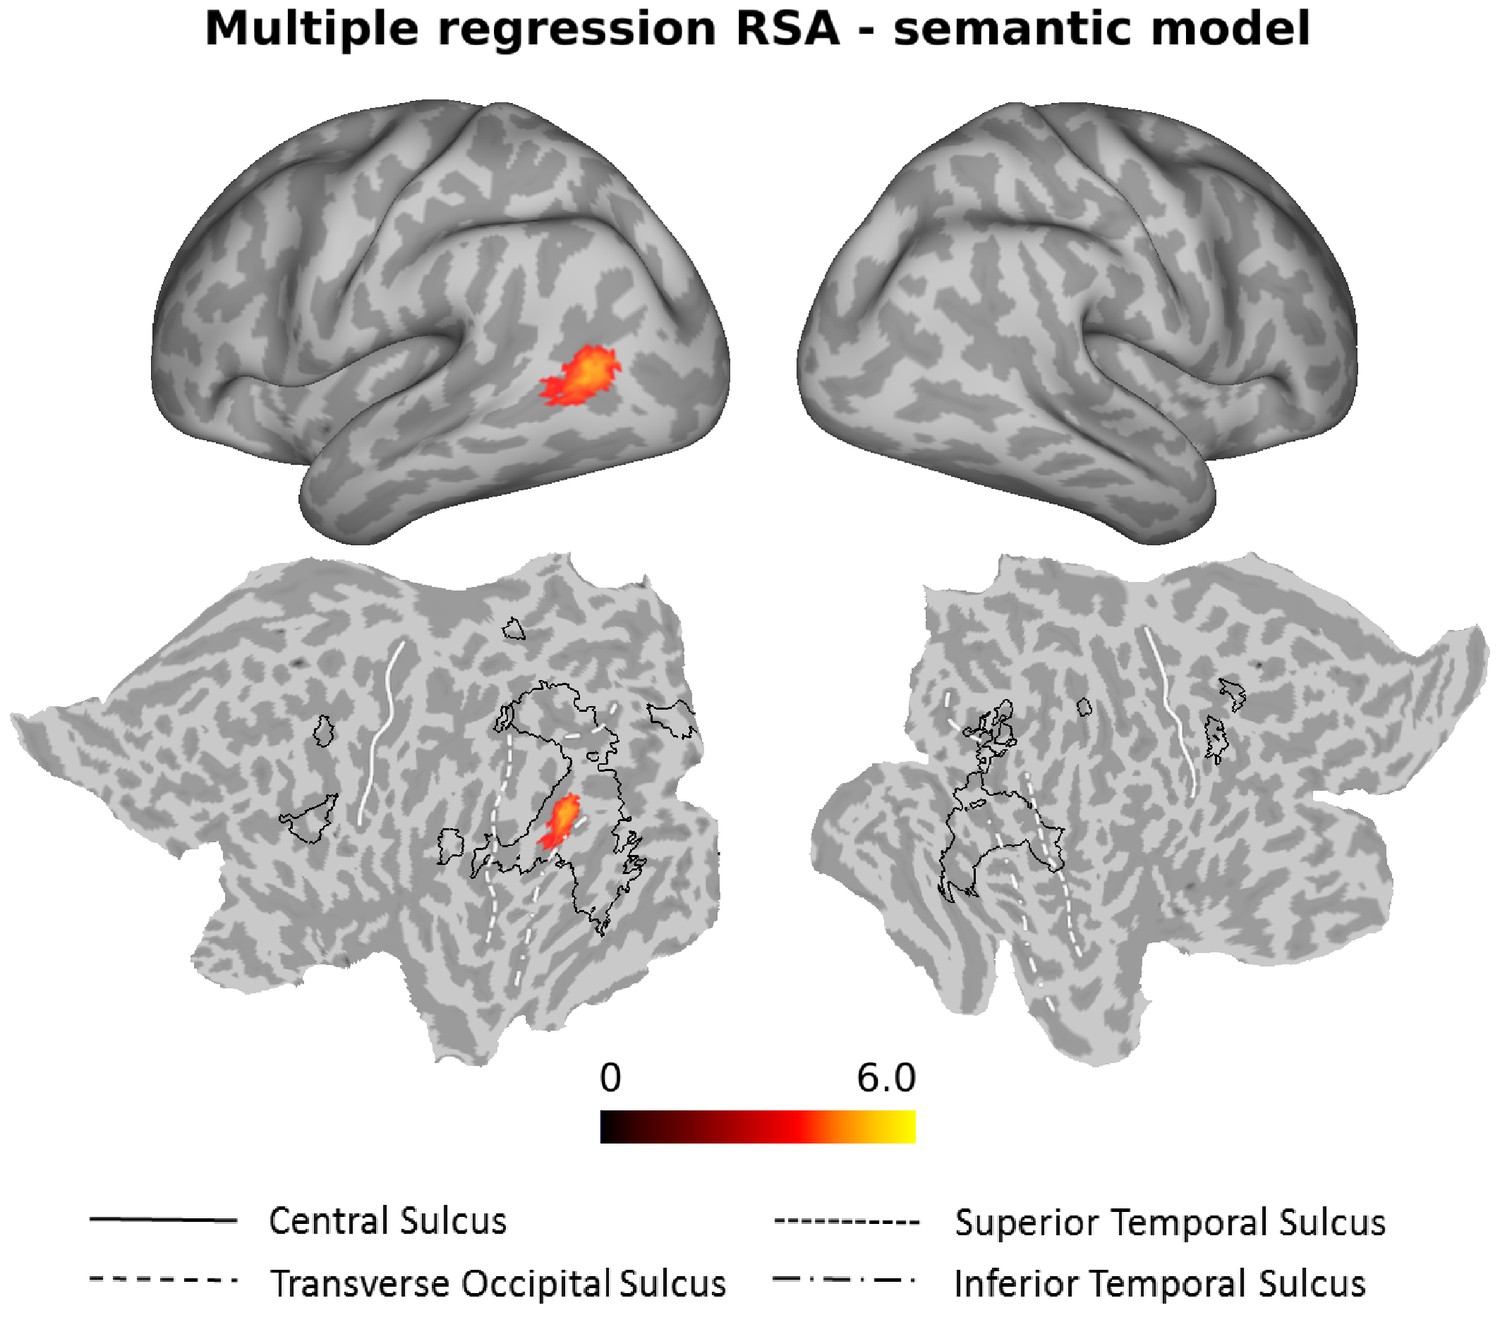
Multiple regression RSA (semantic model).
Group results of the searchlight-based multiple regression RSA, in which the ten different models (see Materials and methods, section Construction of Representational Dissimilarity Matrices, for details) were used as regressors in a multiple regression RSA conducted at the individual level. The resulting beta estimates were converted to t scores across participants and then corrected for multiple comparisons using cluster-based nonparametric permutation analysis (Stelzer et al., 2013) (see Materials and methods for details). Accounting for the behavioral (body, scene, movement, object, sociality, transitivity) and the control models (distance, 1 vs 2 People, HMAX-C1) in the multiple regression analysis, the semantic model explained observed variance in the left LOTC. For ease of comparison, the black outlines in the bottom part of the figure (flat maps) depict the clusters revealed by the standard RSA for the semantic model (Figure 4).
Figure 6—figure supplement 1

Multiple regression based RSA results, together with Glasser parcellation.
Significant clusters resulting from the searchlight multiple-regression RSA (see Figures 6 and 7), with Glasser brain parcellation (Glasser et al., 2016) superimposed on the statistical maps. The top panel shows the cluster revealed by the semantic model, and labels of ROIs as reported in Glasser et al. (2016). The remaining panels show the significant clusters explained by the other models.
Figure 6—figure supplement 2
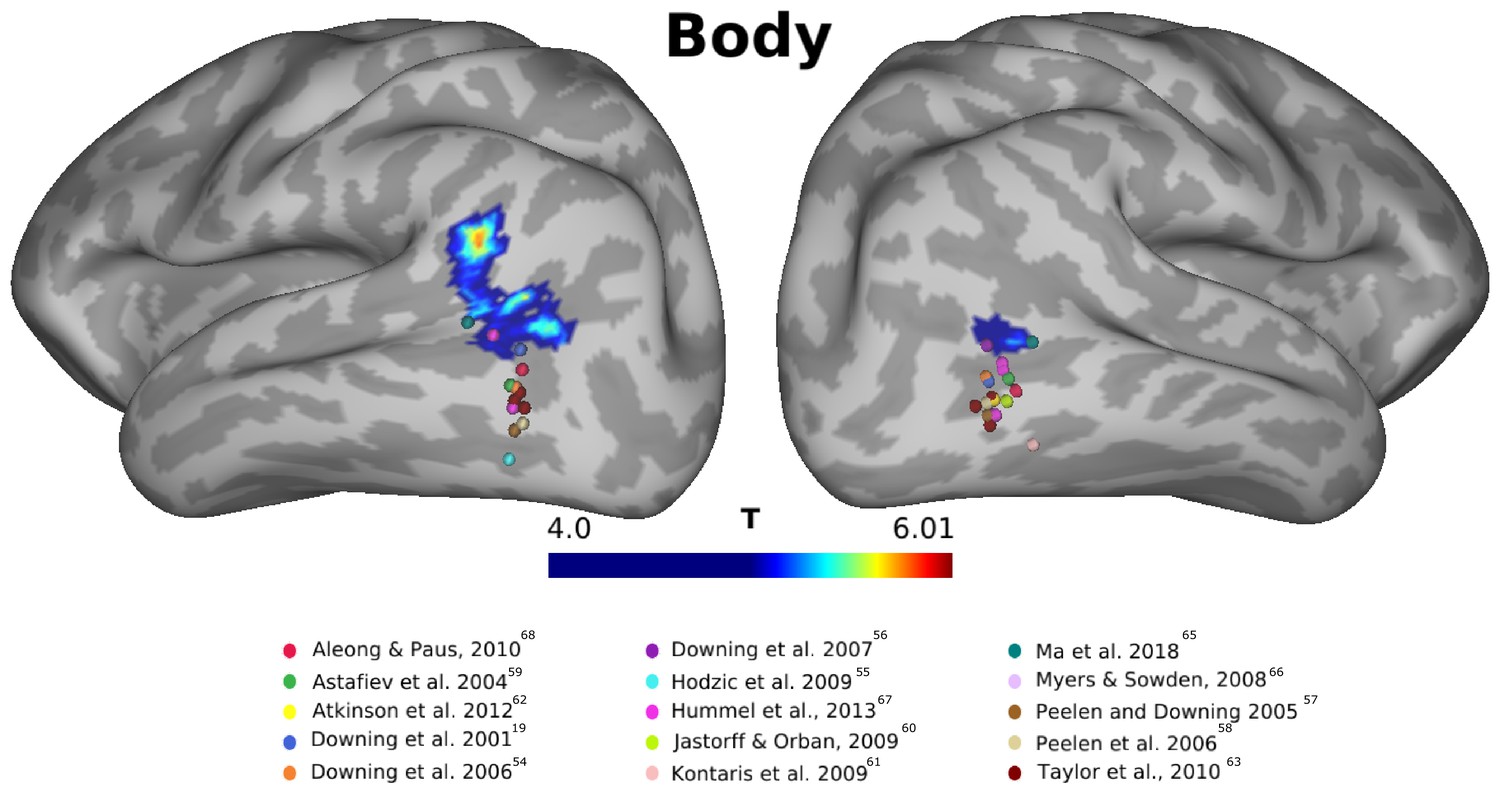
Results for the body model, together with EBA coordinates.
Cluster identified by the multiple regression-based RSA using the body model, with coordinates of the extrastriate body area (EBA) reported by a number of studies that used a functional localizer to identify this region. The coordinates for some studies (Downing et al., 2001; Downing et al., 2006; Hodzic et al., 2009; Downing et al., 2007; Peelen and Downing, 2005; Peelen et al., 2006; Astafiev et al., 2004; Jastorff and Orban, 2009; Kontaris et al., 2009; Atkinson et al., 2012; Taylor et al., 2010) were taken from Ferri et al. (2013). The remaining foci were taken from Ma et al. (2018), Myers and Sowden (2008), Hummel et al. (2013) and Aleong and Paus (2010). As shown on the inflated maps, EBA in both hemispheres is typically reported in a region of the posterior LOTC which is more ventral than the cluster that we observed in our study. However, In the left hemisphere, three of the selected studies (Downing et al., 2001; Ma et al., 2018 and Myers and Sowden, 2008) reported the EBA foci within or near the dorsal sector of the cluster reported in the current study. Furthermore, in the right hemisphere, two of the selected studies (Downing et al., 2007 and Ma et al., 2018) also reported coordinates for EBA within the right cluster found in the current study.
Figure 7
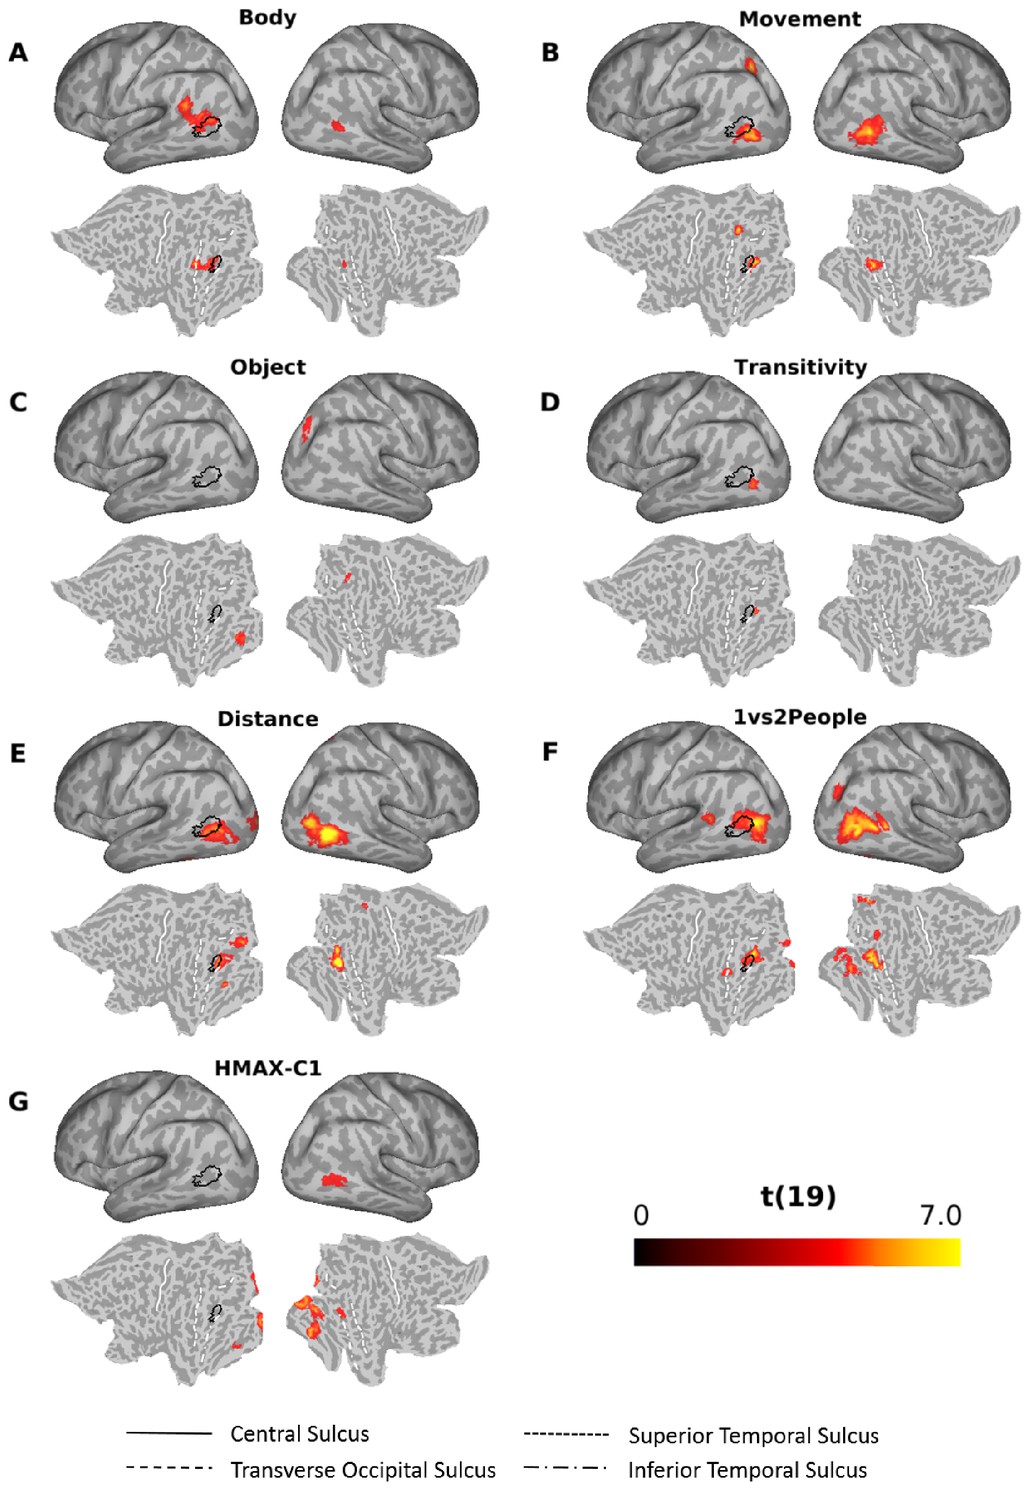
Searchlight-based multiple regression RSA.
Searchlight-based multiple regression RSA results for the body (A), movement (B), object (C), transitivity (D), distance (E), 1 vs 2 people (F) and the HMAX-C1 (G) model. The resulting beta estimates were converted to t scores across participants and then corrected for multiple comparisons using cluster-based nonparametric permutation analysis (Stelzer et al., 2013) (see Materials and methods for details). Results for the scene and the sociality model did not survive corrections for multiple corrections and thus are not shown here. Black outlines on the inflated brains and the flat maps depict significant clusters revealed by the multiple regression RSA for the semantic mode (Figure 6).
Figure 8
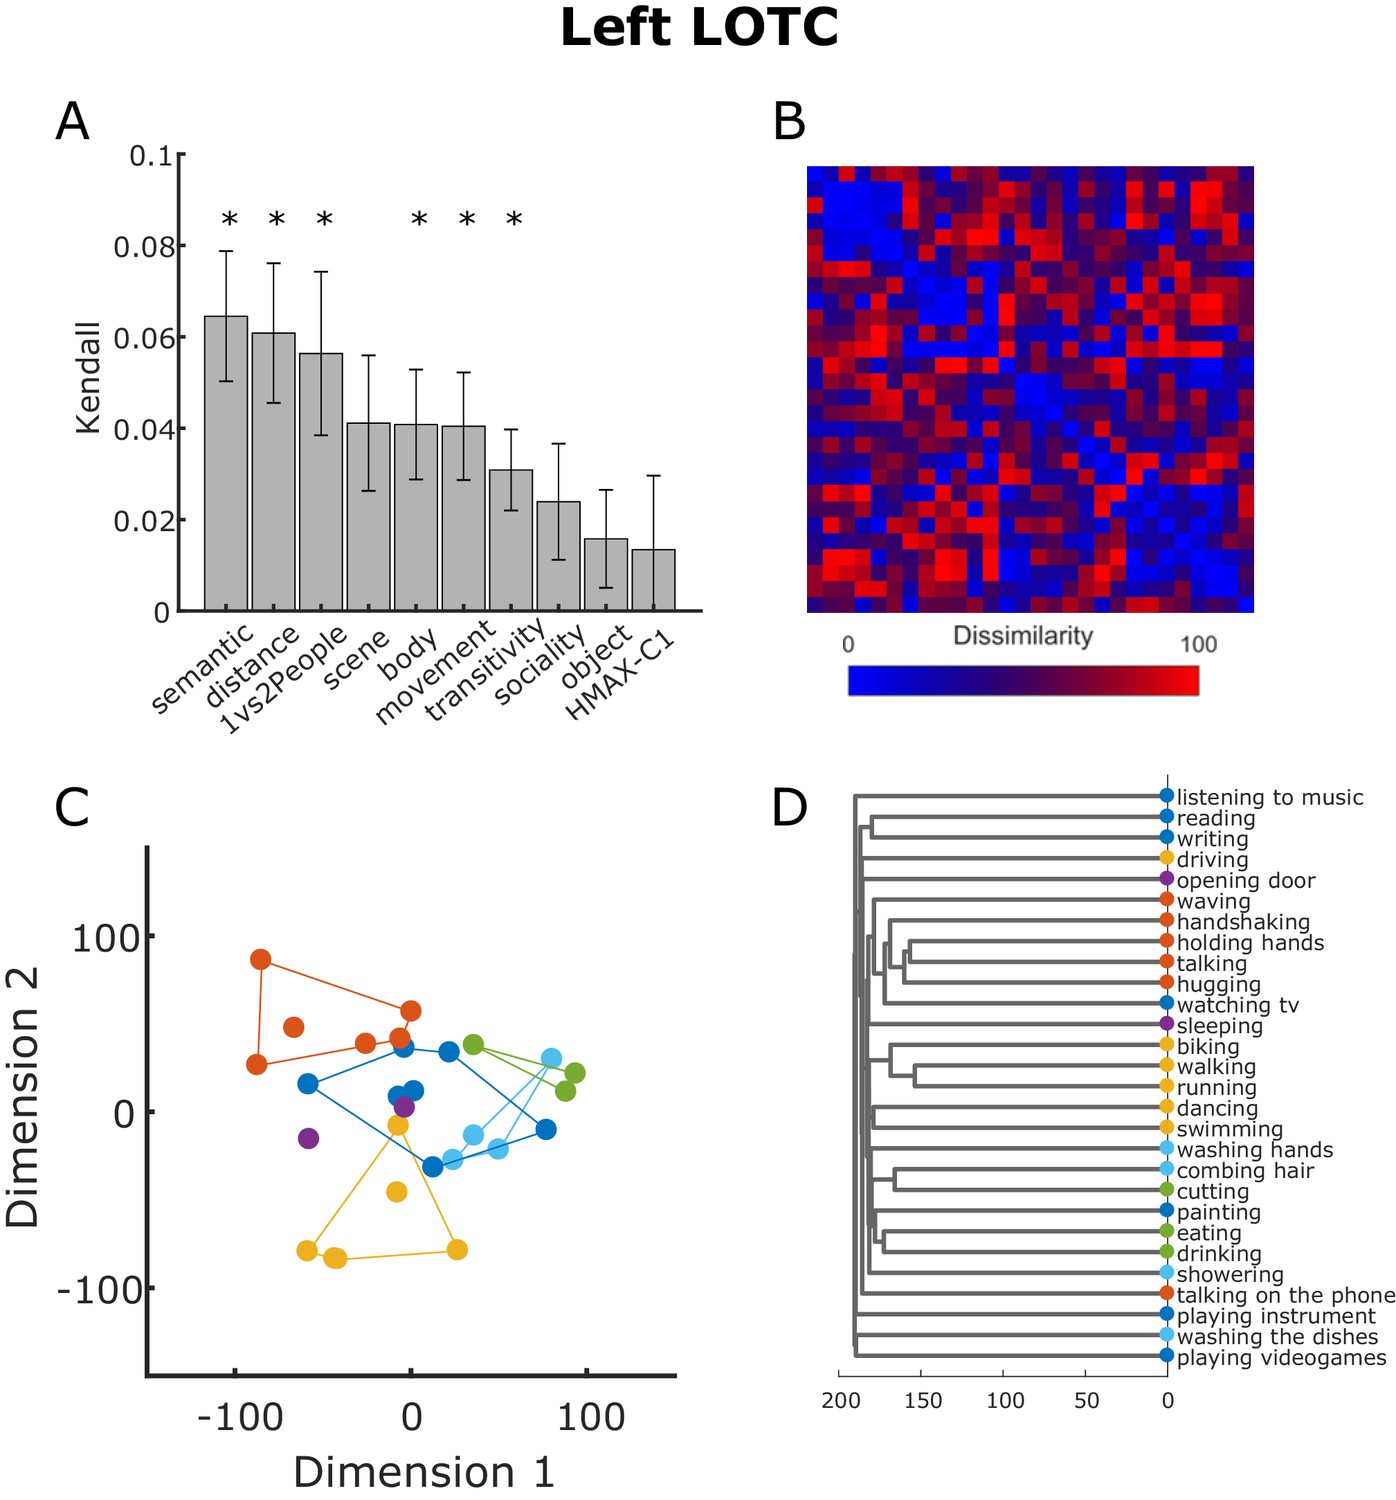
Neural RDM from LOTC.
(A) Kendall rank correlation coefficient between neural and model RDMs in the cluster in the LOTC revealed by the multiple regression RSA using the semantic model (see Figure 6). Error bars depict the standard error of the mean. Asterisks indicate that the correlation was greater than zero (one-tailed t-test, FDR corrected). (B) Neural RDM from the LOTC used for the analysis shown in panel (A). Values were separately rank-transformed and then rescaled to values between 0 and 100, as suggested in Nili et al. (2014). (C) Two-dimensional visualization of the beta patterns of the cluster in the LOTC resulting from classical MDS. Actions were assigned to the clusters resulting from the behavioral analysis as shown in Figure 3. (D). Dendrogram resulting from the hierarchical clustering analysis.
Author response image 1
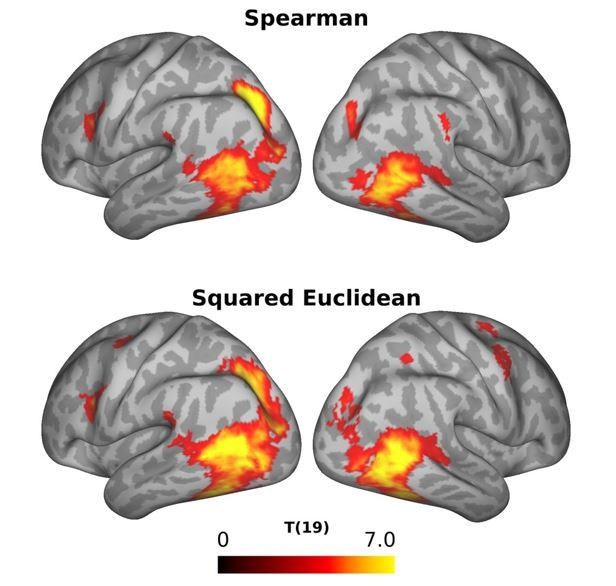
Comparison of the results of the standard RSA using Spearman correlation (top panel) and squared Euclidian distance (right panel) as distance metric.
Additional files
-
Supplementary file 1
Cluster table standard RSA (semantic model).
Cluster table standard RSA (semantic model). List of clusters resulting from the standard RSA for the semantic model which survived correction for multiple comparisons (cluster p-value<0.05; see Materials and methods and Figure 4). Coordinates are in MNI space. Labels are based on MRI scans that originated from the OASIS project (http://www.oasis-brains.org/) and were provided by Neuromorphometrics, Inc (http://www.neuromorphometrics.com/) under academic subscription provided in SPM12 and Glasser’s surface-based atlas (Glasser et al., 2016).
- https://cdn.elifesciences.org/articles/47686/elife-47686-supp1-v1.docx
-
Supplementary file 2
Cluster table multiple regression RSA.
Cluster table multiple regression RSA. List of clusters resulting from the multiple regression RSA for the eight different models (semantic, body, movement, object, transitivity, distance, 1 vs 2 people, HMAX-C1) which survived correction for multiple comparisons (cluster p-value<0.05; see Materials and methods and Figure 6 and Figure 6—figure supplement 1). Coordinates are in MNI space. Labels are based on MRI scans that originated from the OASIS project (http://www.oasis-brains.org/) and were provided by Neuromorphometrics, Inc (http://www.neuromorphometrics.com/) under academic subscription provided in SPM12 and Glasser’s surface-based atlas (Glasser et al., 2016).
- https://cdn.elifesciences.org/articles/47686/elife-47686-supp2-v1.docx
-
Supplementary file 3
List of actions identified using the online survey.
We initially kept actions that were mentioned by at least 20% of the participants. The final selected twenty-eight actions used for the study are the ones highlighted. See Materials and methods section for the procedure used to select these actions.
- https://cdn.elifesciences.org/articles/47686/elife-47686-supp3-v1.docx
-
Transparent reporting form
- https://cdn.elifesciences.org/articles/47686/elife-47686-transrepform-v1.pdf
Download links
A two-part list of links to download the article, or parts of the article, in various formats.
Downloads (link to download the article as PDF)
Open citations (links to open the citations from this article in various online reference manager services)
Cite this article (links to download the citations from this article in formats compatible with various reference manager tools)
The representational space of observed actions
eLife 8:e47686.
https://doi.org/10.7554/eLife.47686


