Mechanisms of iron- and O2-sensing by the [4Fe-4S] cluster of the global iron regulator RirA
- University of East Anglia, United Kingdom
- University of Essex, United Kingdom
Figures
Figure 1 with 1 supplement
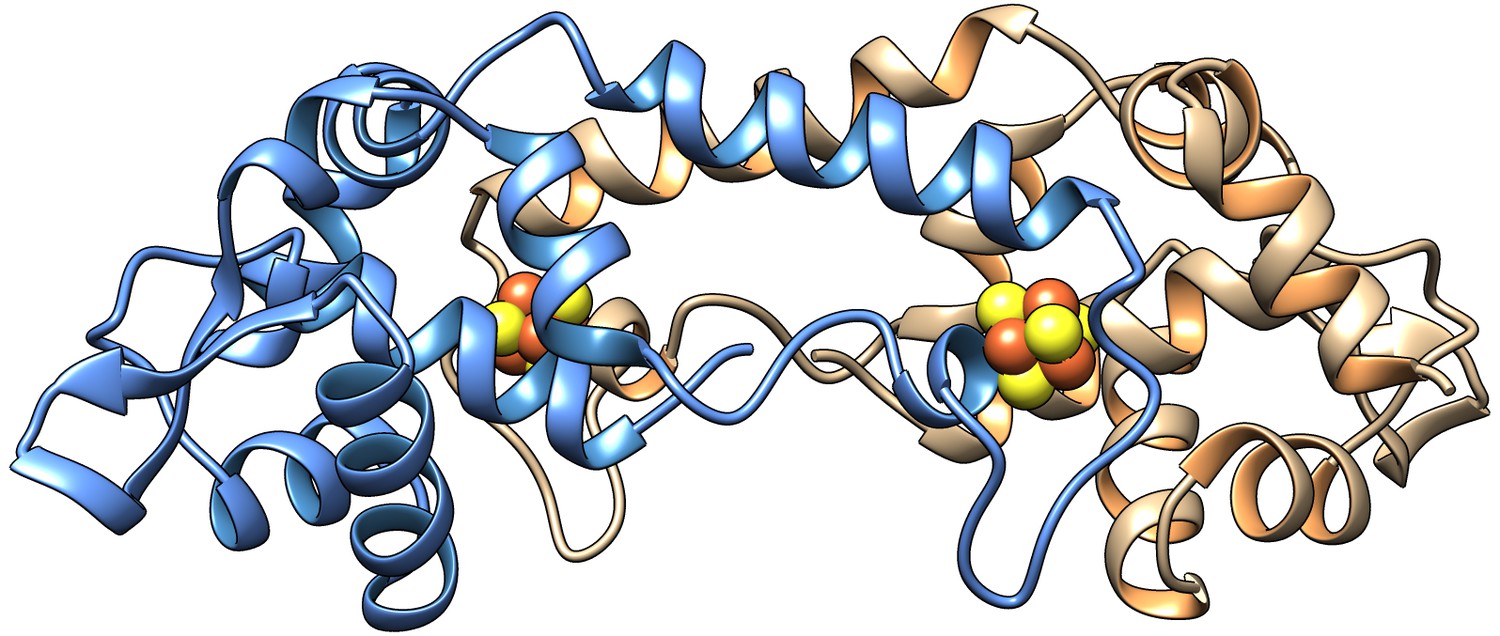
Model of the homodimer form of [4Fe-4S] RirA.
Cartoon ribbon representation showing one protomer in blue and the other in beige, with iron and sulphide ions in brown and yellow, respectively. The model was generated using Swiss-Model (Bienert et al., 2017; Pettersen et al., 2004) based on the structure of Streptomyces coelicolor [4Fe-4S] NsrR (PDB: 5N07) (Volbeda et al., 2017). An amino acid residue alignment between RirA and NsrR is shown in Figure 1—figure supplement 1.
Figure 1—figure supplement 1
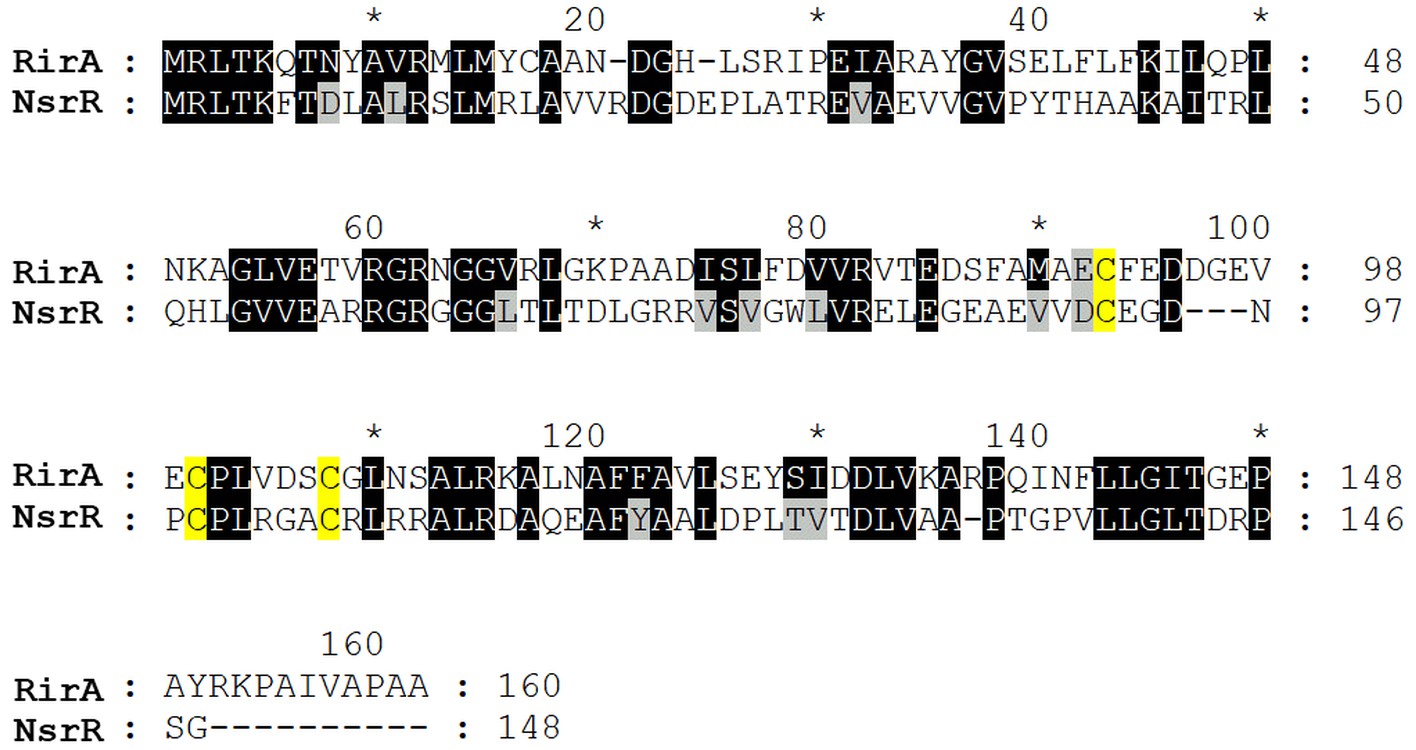
Amino acid residue alignment of R. leguminosarum RirA and S. coelicolor NsrR.
Identical and similar residues are indicated by black and grey backgrounds, respectively. Predicted cluster-coordinating Cys residues are highlighted in yellow. SWISS-Model, which was used to generate a homology model of RirA based on the structure of NsrR (PDB: 5n07), reported 39.6% identity between the two proteins. Note that the fourth ligand to the NsrR [4Fe-4S] cluster (in addition to the three highlighted Cys residues) is Asp8, which is not conserved in RirA.
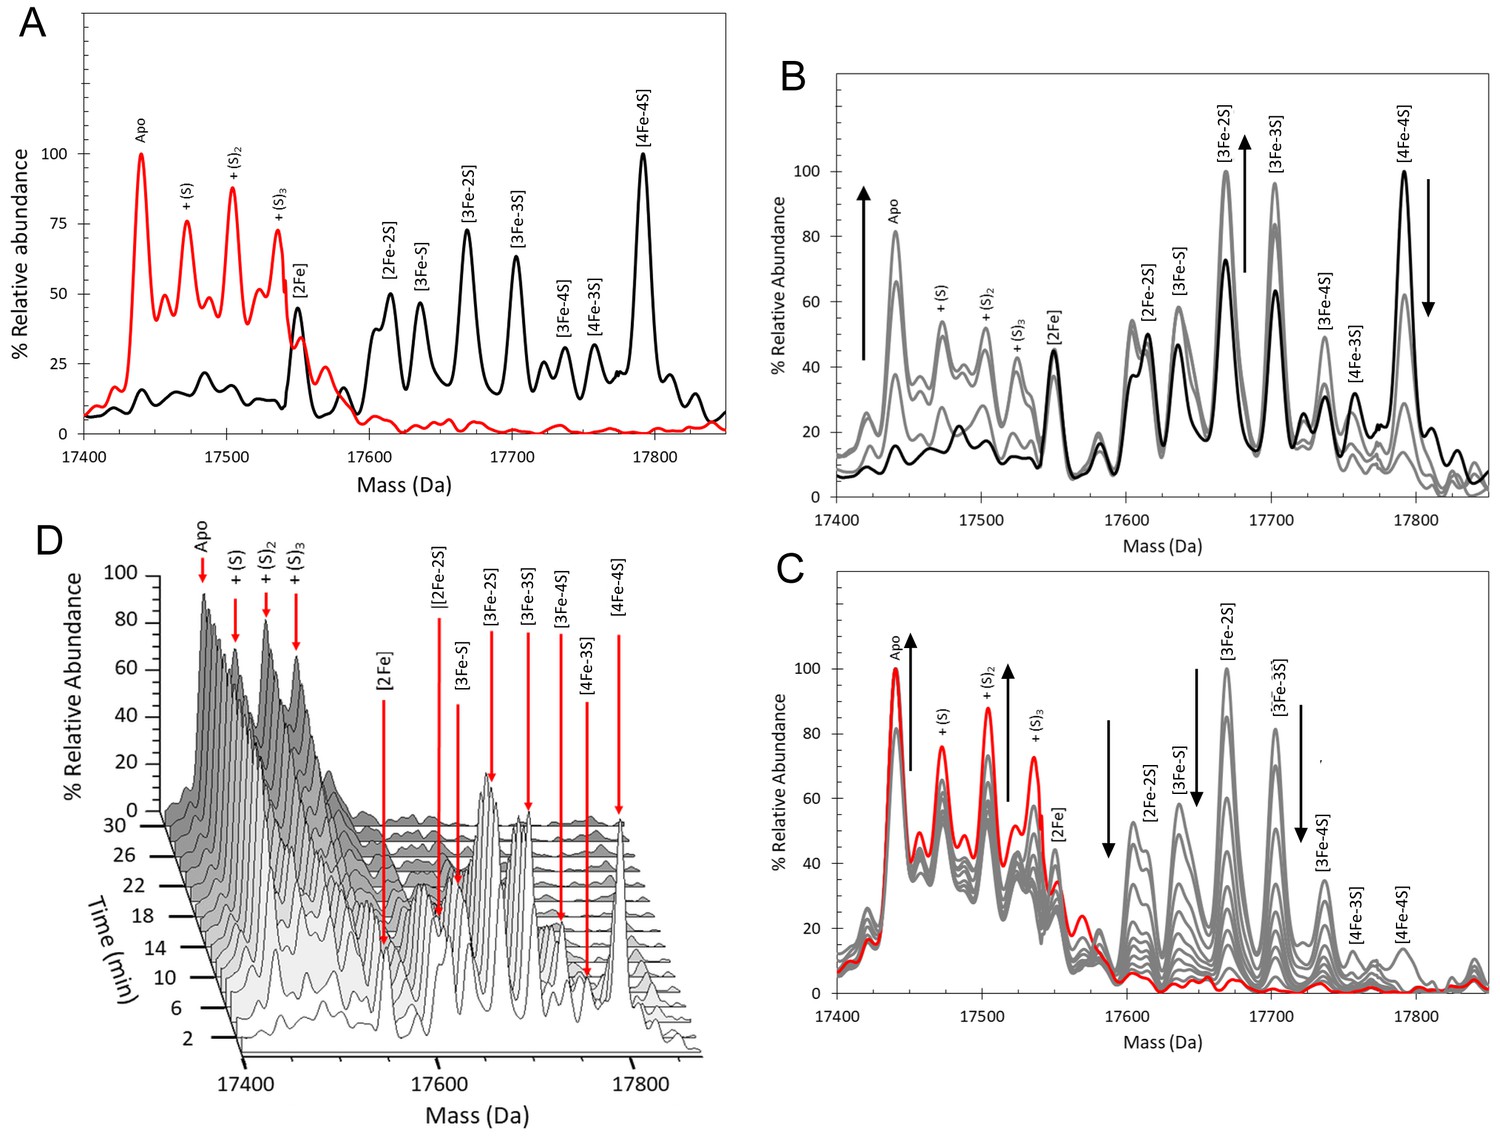
Figure 2 with 1 supplement
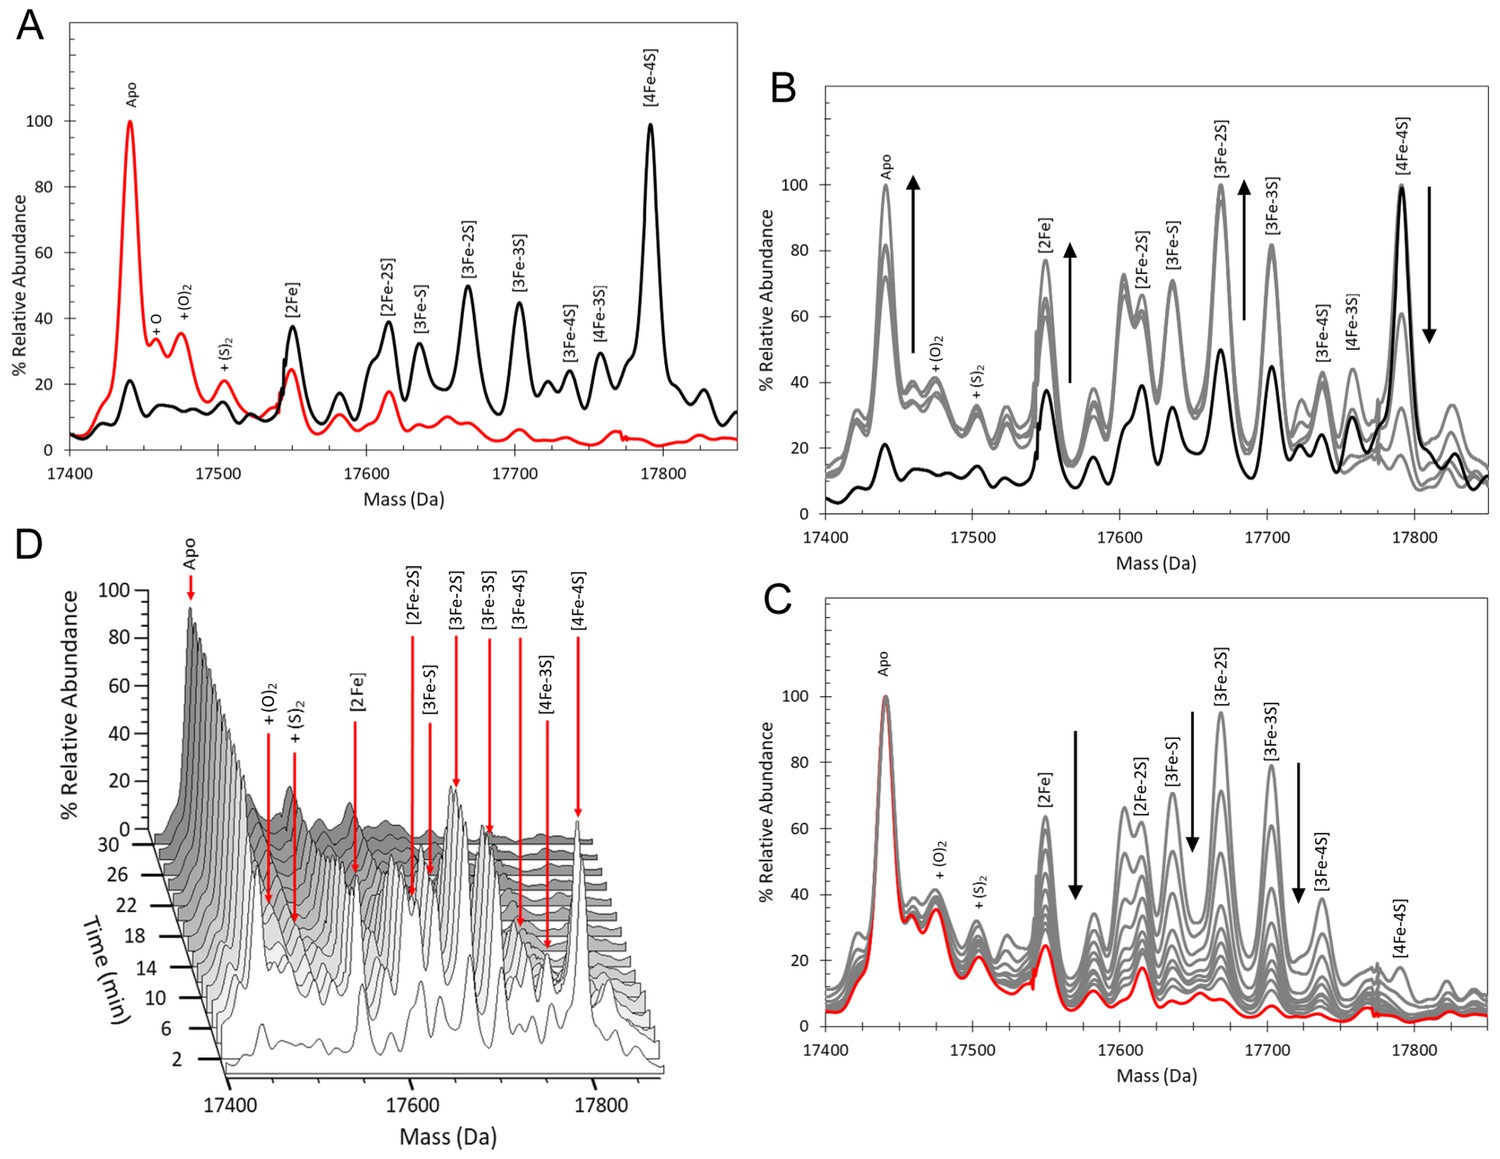
ESI-MS analysis of [4Fe-4S] RirA cluster conversion under anaerobic, low iron conditions.
(A) Deconvoluted (to neutral mass) mass spectrum of [4Fe-4S] RirA prior to the addition of 250 µM EDTA (t = 0, black line) and 30 min after the addition at 37°C (t = 30, red line). (B) and (C) Deconvoluted mass spectra measured at intervening times: 0–8 min (from the point of EDTA addition, spectra recorded at 2 min intervals) (B) and 8–30 min (C). Starting and endpoint spectra are in black and red, respectively (corresponding to the data in (A). (D) 3D plot of time dependent changes in the ESI-MS spectrum showing the formation and decay of RirA cluster intermediates and formation of apo-RirA products. [4Fe-4S] RirA (~25 µM) was in anaerobic 250 mM ammonium acetate pH 7.3. Low iron conditions were generated by the addition of 250 µM EDTA and cluster conversion/degradation was followed at 37°C.
Figure 2—figure supplement 1
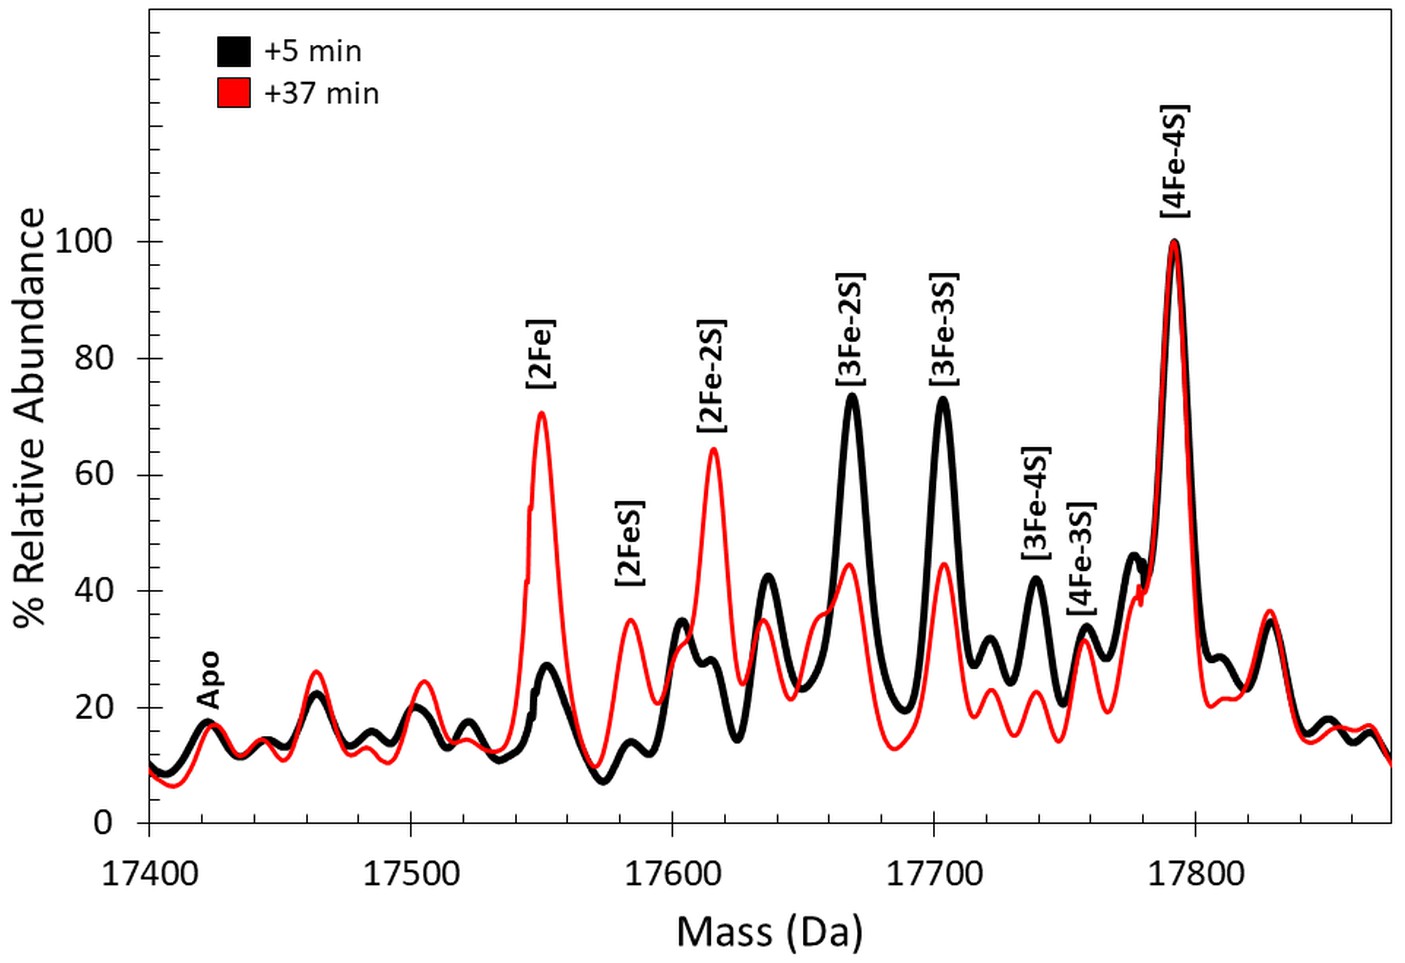
Analysis of RirA [4Fe-4S] cluster breakdown species in the absence of an Fe2+ chelator.
Deconvoluted mass spectra of RirA in the absence of an Fe2+ chelator. As isolated [4Fe-4S] RirA was exchanged into 250 mM ammonium acetate pH 7.3 and infused into the mass spectrometer. Spectra shown were recorded at 5 and 37 min after infusion began, as indicated. The 5 min spectrum reflects some degradation of the cluster upon exchange into the ammonium acetate buffer for ESI-MS measurements. After 37 min, the [3Fe-2S] and [3Fe-3S] peaks were observed at reduced abundance, while the [2Fe] and [2Fe-2S] increased, indicating that these part-degraded clusters continued to degrade. There was no apparent loss of [4Fe-4S] and only minor increases in apo-forms, indicating that the [4Fe-4S] form that survived the buffer exchange was stable in the absence of an Fe2+ chelator.
Figure 3 with 1 supplement
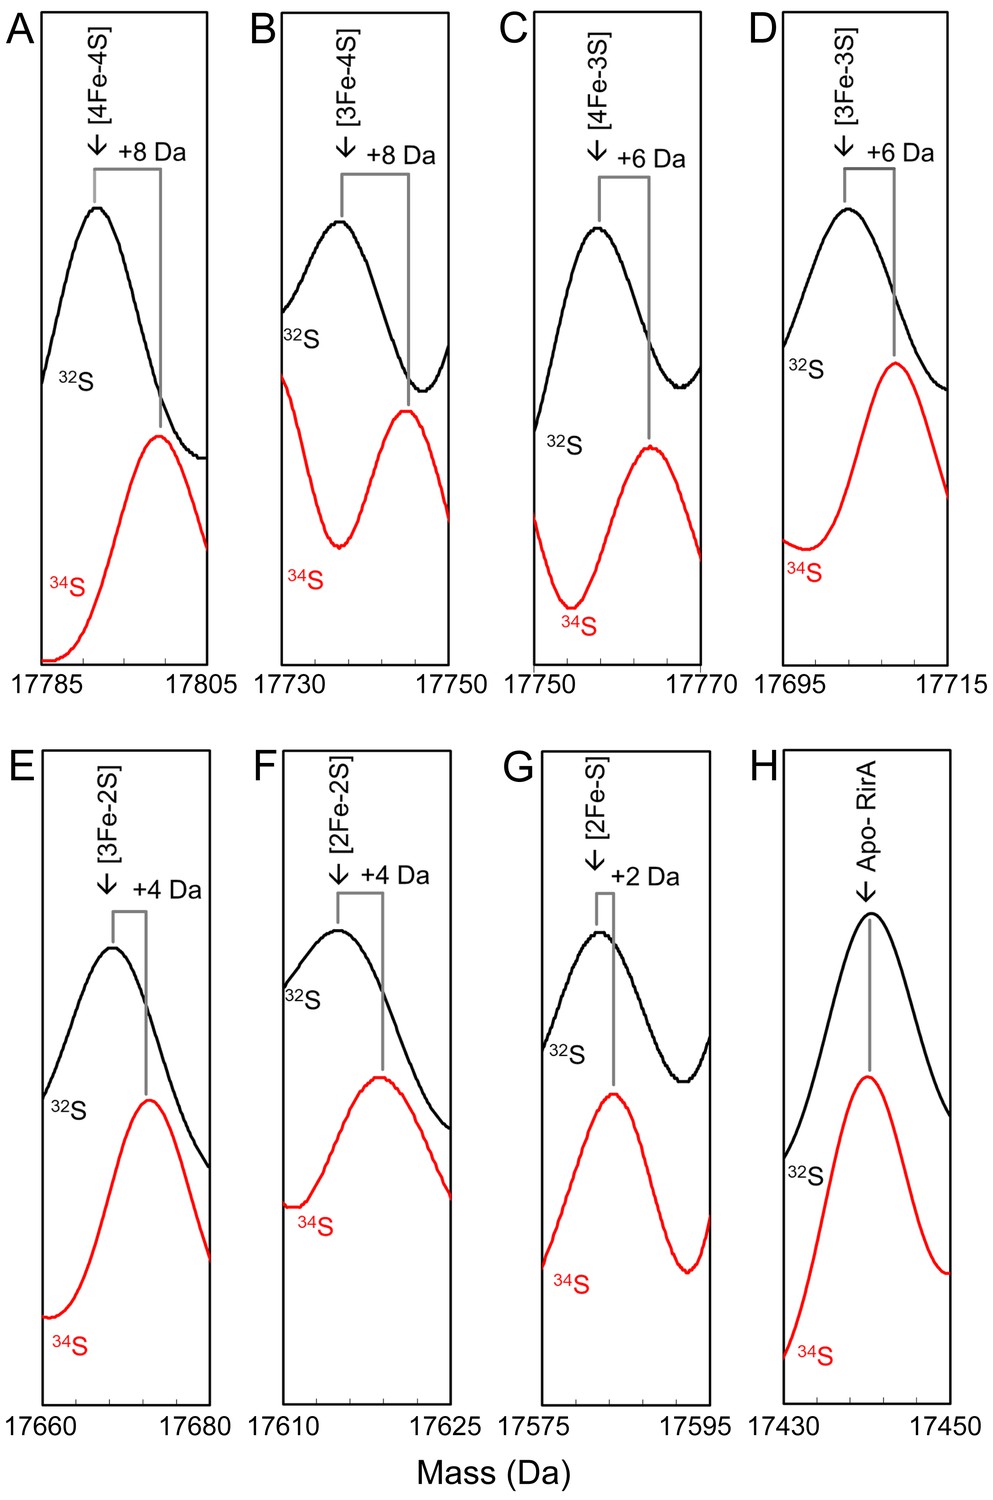
Mass shifts observed for the RirA [4Fe-4S] cluster, conversion intermediates and cluster products upon 34S substitution of cluster sulphides.
(A–G) Deconvoluted mass spectra of natural abundance sulphur [4Fe-4S] RirA and cluster conversion intermediates (black lines) and the equivalent 34S-substituted forms (red lines), as indicated. (H) As in A) except spectra show peaks due to apo-RirA resulting from natural abundance and 34S [4Fe-4S] RirA samples, as indicated. Predicted mass shifts for the assigned species are indicated. Note that the ESI-MS data for natural abundance and 34S-substituted [4Fe-4S] RirA were previously published (Crack et al., 2019); see also Supplementary file 1.
Figure 3—figure supplement 1
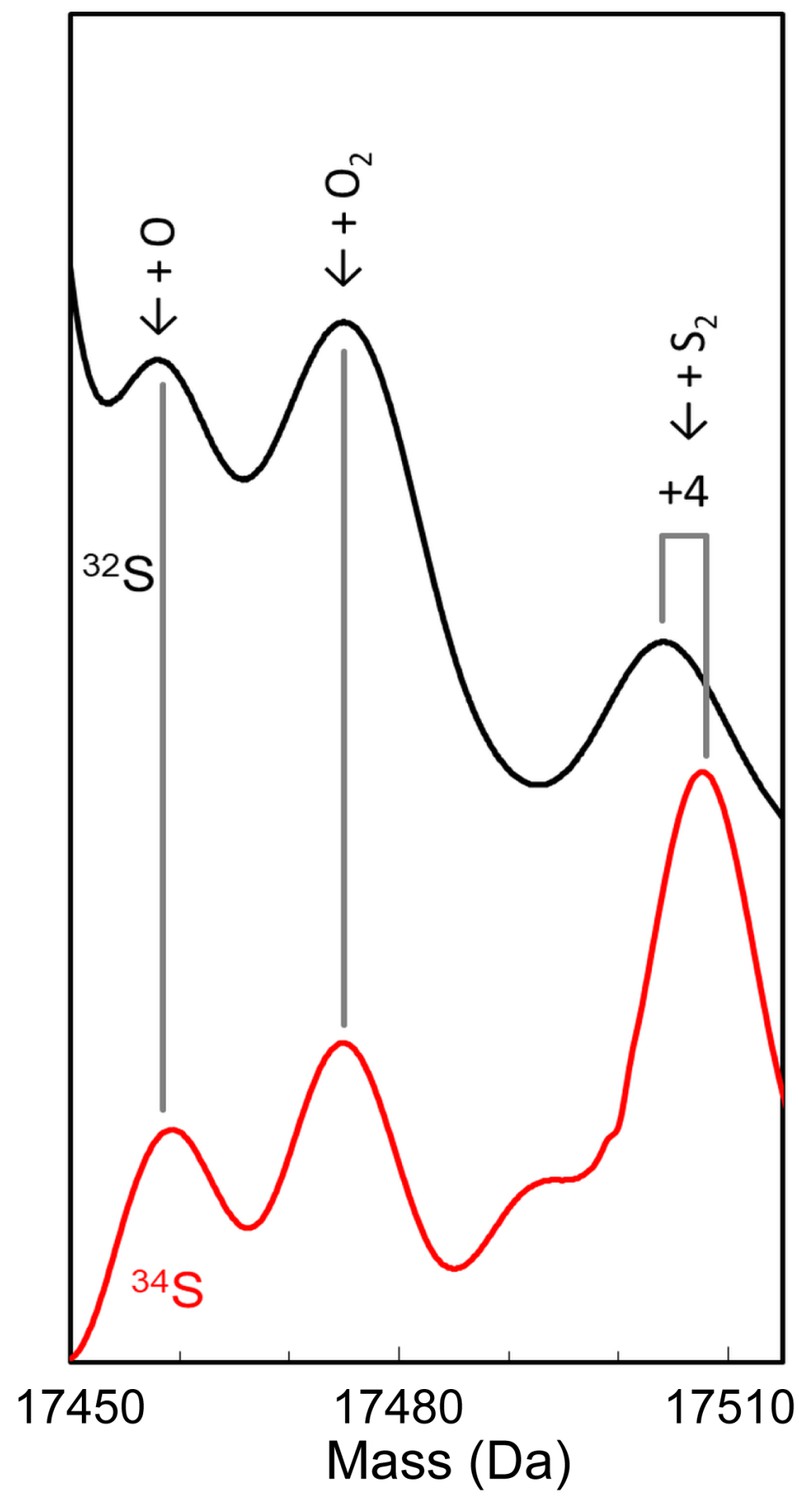
Assignment of apo-RirA adduct species using isotope substitution following degradation of the [4Fe-4S] cluster under low iron/anaerobic conditions.
Deconvoluted mass spectra of natural abundance and 34S-substituted [4Fe-4S] RirA following cluster degradation under low iron/anaerobic conditions, as indicated. Adducts of sulphur and oxygen are indicated along with the predicted mass shifts for the assigned species. Lower mass adducts at +16 and +32 Da are not shifted, indicating that these are most likely O adducts. The peak at +64 Da is shifted by +4 Da, consistent with a double sulphur adduct.
Figure 4

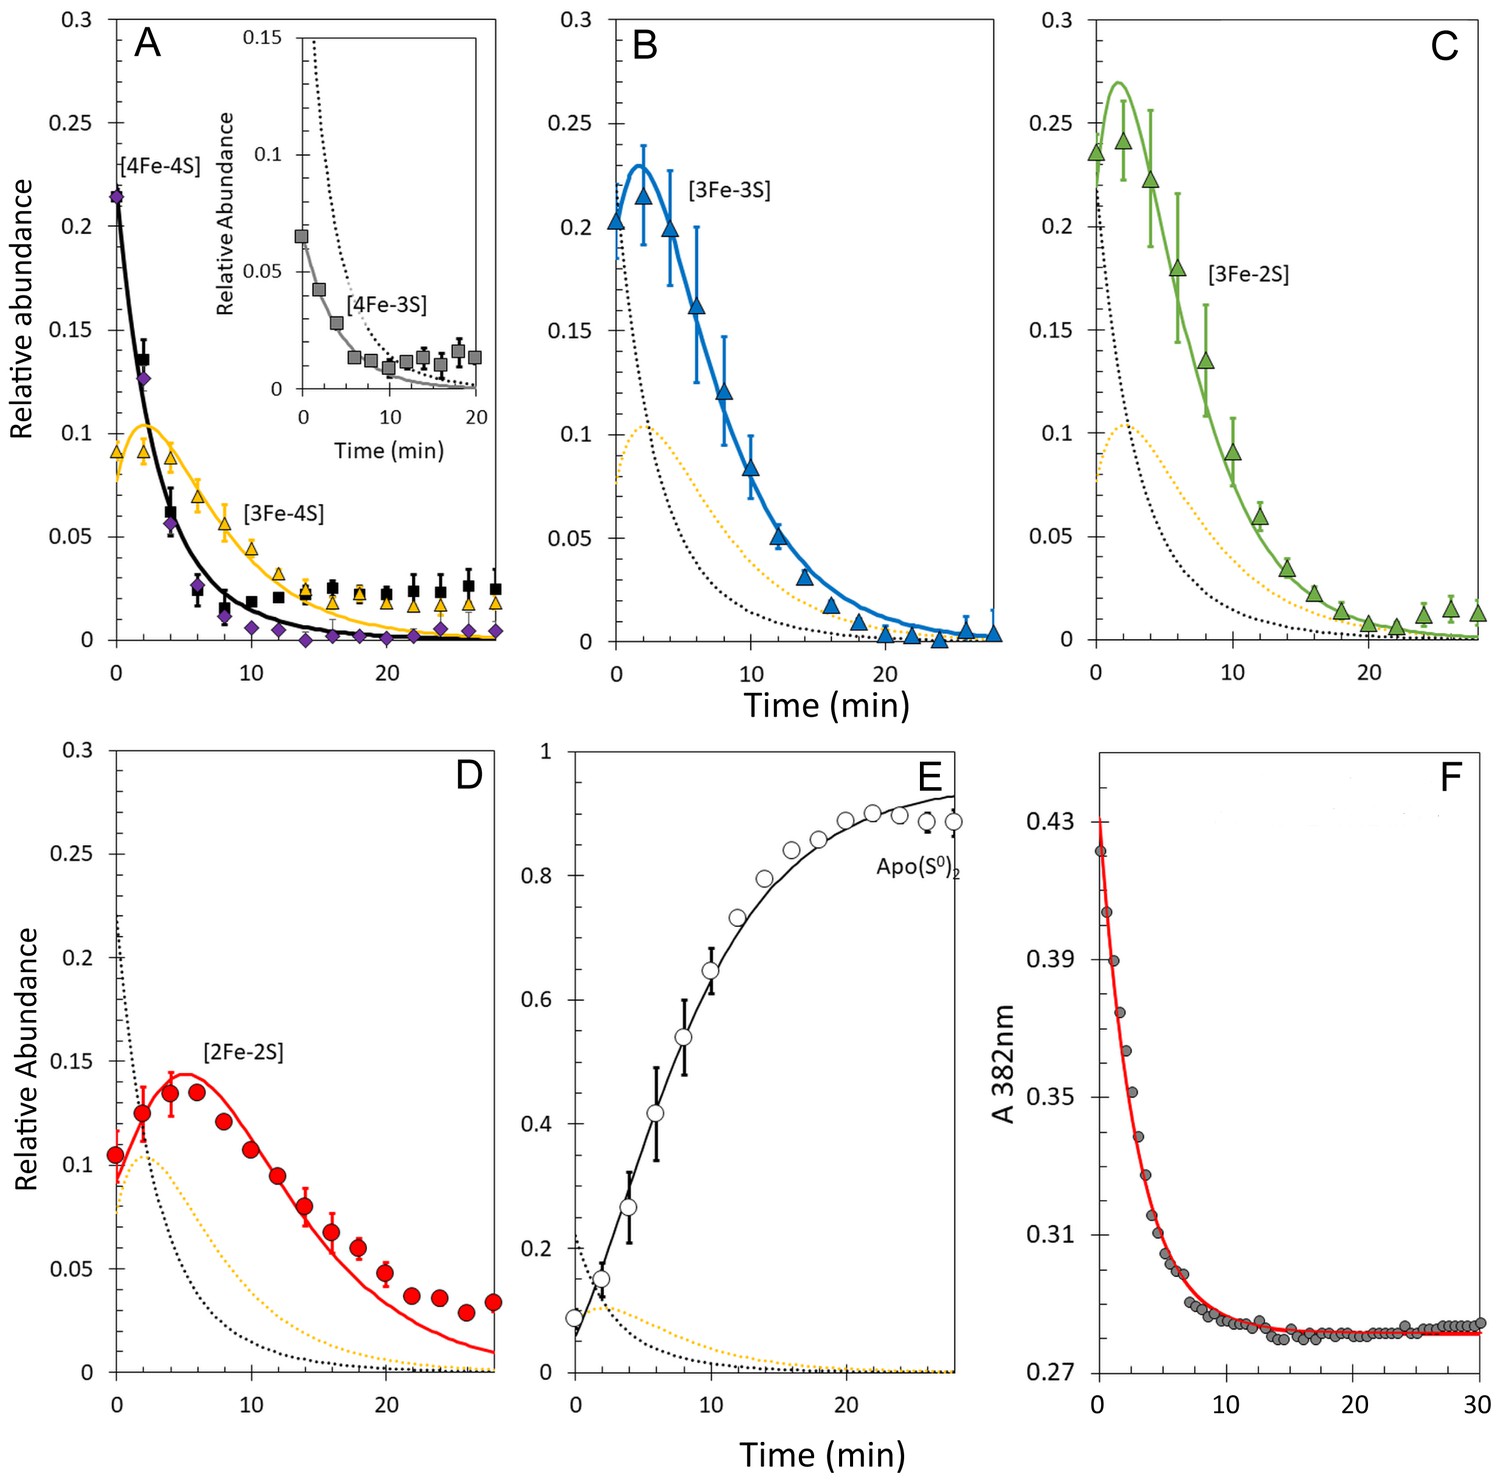
Kinetic analysis of [4Fe-4S] RirA cluster conversion/degradation.
(A) Plots of relative abundances of [4Fe-4S] cluster (black) and [3Fe-4S] (yellow) species as a function of time following exposure to 250 µM EDTA at 37° C. Inset is a plot of relative abundances of the [4Fe-3S] cluster, illustrating that it is likely formed during ionisation. (B) – (E) As in (A) but showing [3Fe-3S] (B), [3Fe-2S] (C), [2Fe-2S] (D) and apo- (E) forms of RirA. Fits of the data, generated by a global analysis of the experimental data based on the reaction scheme depicted in Figure 5, are shown as solid lines. Broken lines correspond to the kinetic profile of the cluster species associated with that colour and are included to permit easy comparison between intermediates. Error bars show standard error for ESI-MS datasets (n = 4, derived from one biological replicate and three technical replicates). (F) Plot of A382 nm versus time following addition of 250 µM EDTA to [4Fe-4S] RirA (30 µM in cluster in 250 mM ammonium acetate, 500 µM glutathione, pH 7.3) at 37° C. The red line indicates a fit of the data generated using a bi-exponential function. We note that significant A382 nm remains after 30 min, where ESI-MS indicates that the majority of the protein is in an apo-form. The residual absorbance most likely arises from Fe/S species present in the cuvette, either attached to the protein, or in solution/suspension, for example as iron sulphide or iron acetate (Pellicer Martinez et al., 2017).
Figure 5
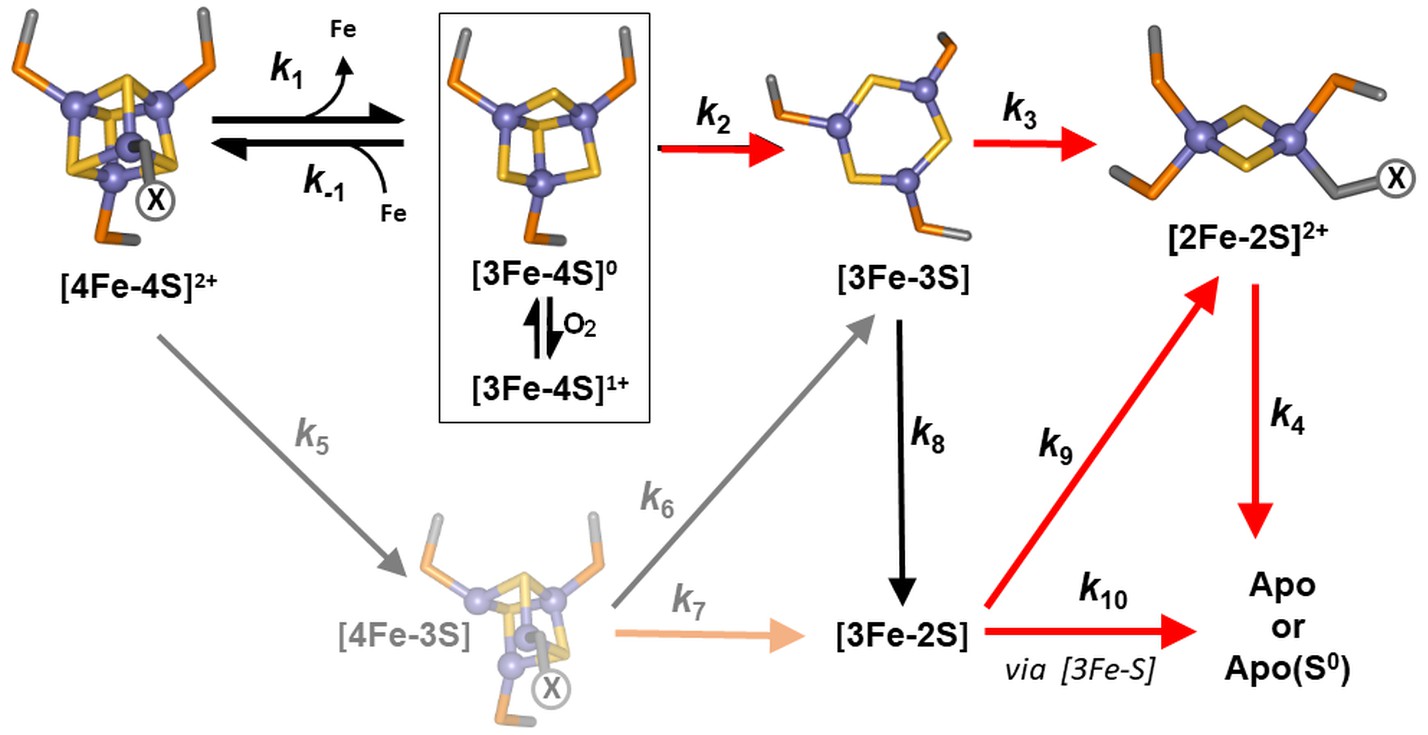
Proposed reaction scheme for [4Fe-4S] RirA cluster conversion/degradation.
Reaction scheme used to fit time-resolved ESI-MS data for [4Fe-4S] RirA. Values of rate constants (k) are given in Table 1. Note that the ESI-MS data cannot distinguish between [3Fe-4S]1+ and [3Fe-4S]0 forms (boxed), so these are treated only as [3Fe-4S] in the kinetic model. They can be distinguished by EPR, however (see below), and the kinetic EPR data support the proposal that [3Fe-4S]0 is susceptible to oxidation to [3Fe-4S]1+ in the presence of O2. Reactions that are enhanced in rate (i.e. have increased associated rate constants) in the presence of O2 are indicated by red arrows. The initial [4Fe-4S] cluster is coordinated by three Cys residues and one unknown ligand, illustrated in the figure as ‘X’. The structure of the [3Fe-3S] species proposed here is based on the recently reported small molecule [3Fe-3S] species in which iron and sulphur form a hexagonal ring (Lee et al., 2016). The faded portion of the figure (involving steps marked k5, k6 and k7) represents a minor pathway that most likely arises from ionisation-induced damage.
Figure 6 with 1 supplement
ESI-MS analysis of [4Fe-4S] RirA cluster conversion under aerobic, low iron conditions.
(A) Deconvoluted mass spectrum of [4Fe-4S] RirA prior to the addition of 250 µM EDTA (black line) and 30 min after the addition at 37°C (red line). (B) and (C) Deconvoluted mass spectra measured at intervening times: 0–6 min (relative to the addition of EDTA/O2, spectra recorded at 2 min intervals) (B) and 6–30 min (C). Starting and endpoint spectra are in black and red, respectively (corresponding to the data in (A). (D) 3D plot of time-dependent changes in the ESI-MS spectrum showing the formation and decay of RirA cluster intermediates and formation of apo-RirA products. [4Fe-4S] RirA (~25 µM) was in aerobic (~228 µM O2) 250 mM ammonium acetate pH 7.3. Low iron conditions were generated by the addition of 250 µM EDTA and cluster conversion/degradation was followed at 37°C.
Figure 6—figure supplement 1
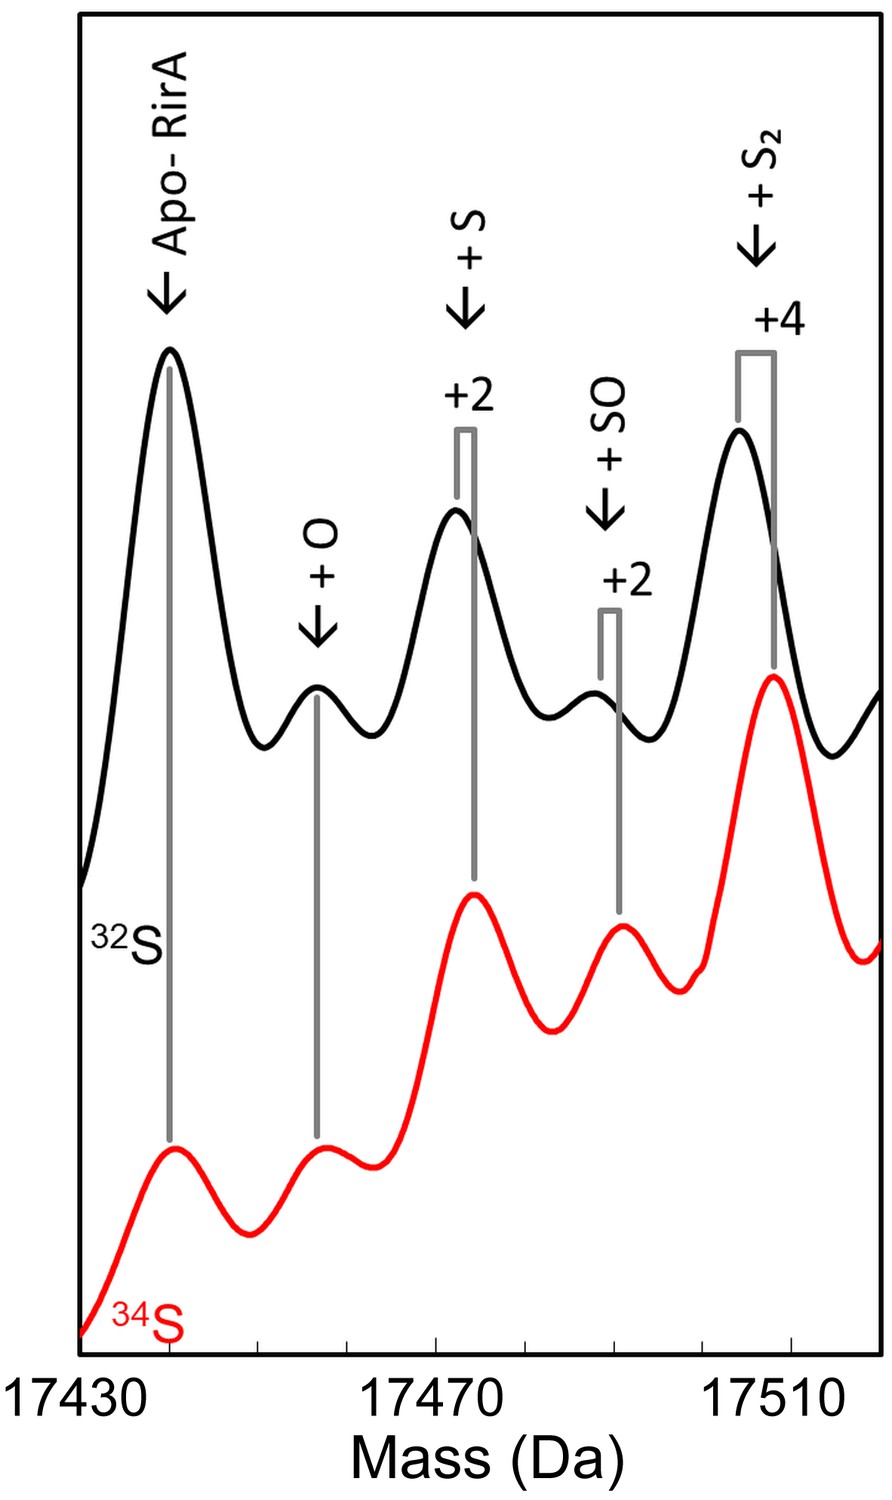
Assignment of apo-RirA adduct species using isotope substitution following degradation of the [4Fe-4S] cluster under low iron/aerobic conditions.
Deconvoluted mass spectra of natural abundance and 34S-substituted [4Fe-4S] RirA following cluster degradation under low iron/aerobic conditions, as indicated. Adducts of sulphur and oxygen are indicated along with the predicted mass shifts for the assigned species. The low intensity oxygen adduct is not shifted, but the first sulphur adduct is shifted +2 Da. The peak marked ‘SO’ corresponds to RirA containing sulphur and oxygen adducts and is shifted by +2 Da. The double sulphur adduct is shifted +4 Da.
Figure 7
Kinetic analysis of [4Fe-4S] RirA cluster conversion/degradation in the presence of O2.
(A) Plots of relative ESI-MS abundances of [4Fe-4S] cluster (black) and [3Fe-4S] (yellow) species as a function of time following exposure to 250 µM EDTA and 228 µM O2 at 37° C, as shown in Figure 6. Normalised A382 nm data (see panel F) are plotted in purple, revealing the close correspondence between the absorbance and [4Fe-4S] decay. Inset is a plot of ESI-MS data for the [4Fe-3S] species. (B) – (D) As in (A) but showing plots of relative abundances of [3Fe-3S] (B), [3Fe-2S] (C), and [2Fe-2S] (D) cluster intermediates. (E) Plot of relative abundance of the double sulphur adduct of apo-RirA. Fits of the data generated by a global analysis of the ESI-MS data, based on the reaction scheme depicted in Figure 5, are shown as solid lines. Broken lines correspond to the kinetic profile of the cluster species associated with that colour and are included to permit easy comparison between intermediates. Error bars show standard error for ESI-MS datasets (n = 2 derived from two technical replicates). (F) Plot of A382 nm versus time following addition of 250 µM EDTA and 228 µM O2 to [4Fe-4S] RirA (30 µM in cluster) at 37° C. The red line indicates a fit of the data generated using a single exponential function. The origin of the residual A382 nm at 30 min, discussed in the legend of Figure 4, may be somewhat different in the presence of O2, where significantly more sulphide undergoes oxidation.
Figure 8 with 2 supplements
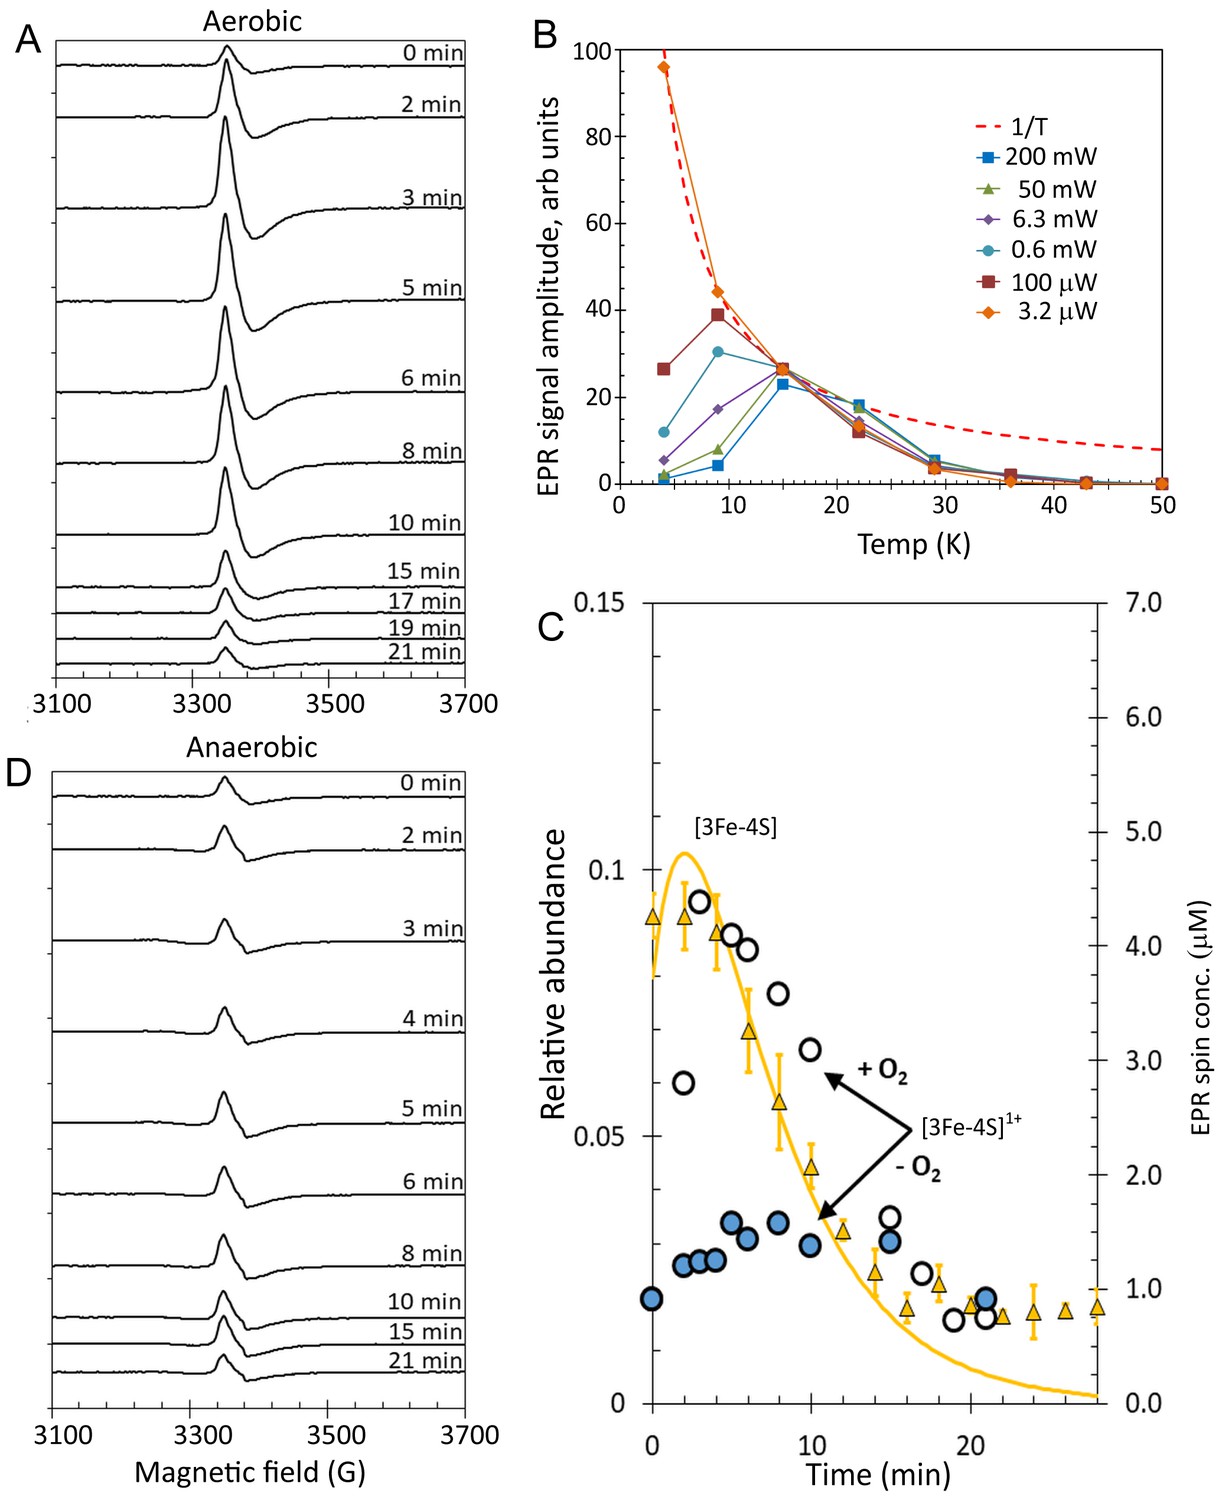
EPR analysis of [4Fe-4S] RirA cluster conversion under aerobic and anaerobic low iron conditions.
(A) EPR spectra of [4Fe-4S] RirA at specified time points following the addition of 250 µM EDTA under aerobic conditions at 37°C. (B) Plot of g = 2.01 EPR signal intensity dependence on temperature at a range of microwave powers. The dashed red line represents a hyperbolic 1/T function plotted in arbitrary units to represent the Curie law (when no saturation effects take place). All experimental dependences are individually scaled so that each meets the hyperbola via at least one data point, with remaining data points lying below the hyperbola (indicating that the signal saturates). (C) Plot of ESI-MS relative abundances of RirA [3Fe-4S] cluster as a function of time following exposure of RirA [4Fe-4S] to 250 µM EDTA at 37° C and aerobic conditions (yellow triangles) and RirA [3Fe-4S]1+ cluster determined under identical condition by EPR under aerobic (+O2, white-filled circles) and anaerobic (-O2, blue-filled circles) conditions. The solid yellow line represents the global fit to the ESI-MS data (as shown in Figure 7). (D) As in (A) but under anaerobic conditions. [4Fe-4S] RirA (~25 µM) was in aerobic (~228 µM O2) 250 mM ammonium acetate pH 7.3.
Figure 8—figure supplement 1
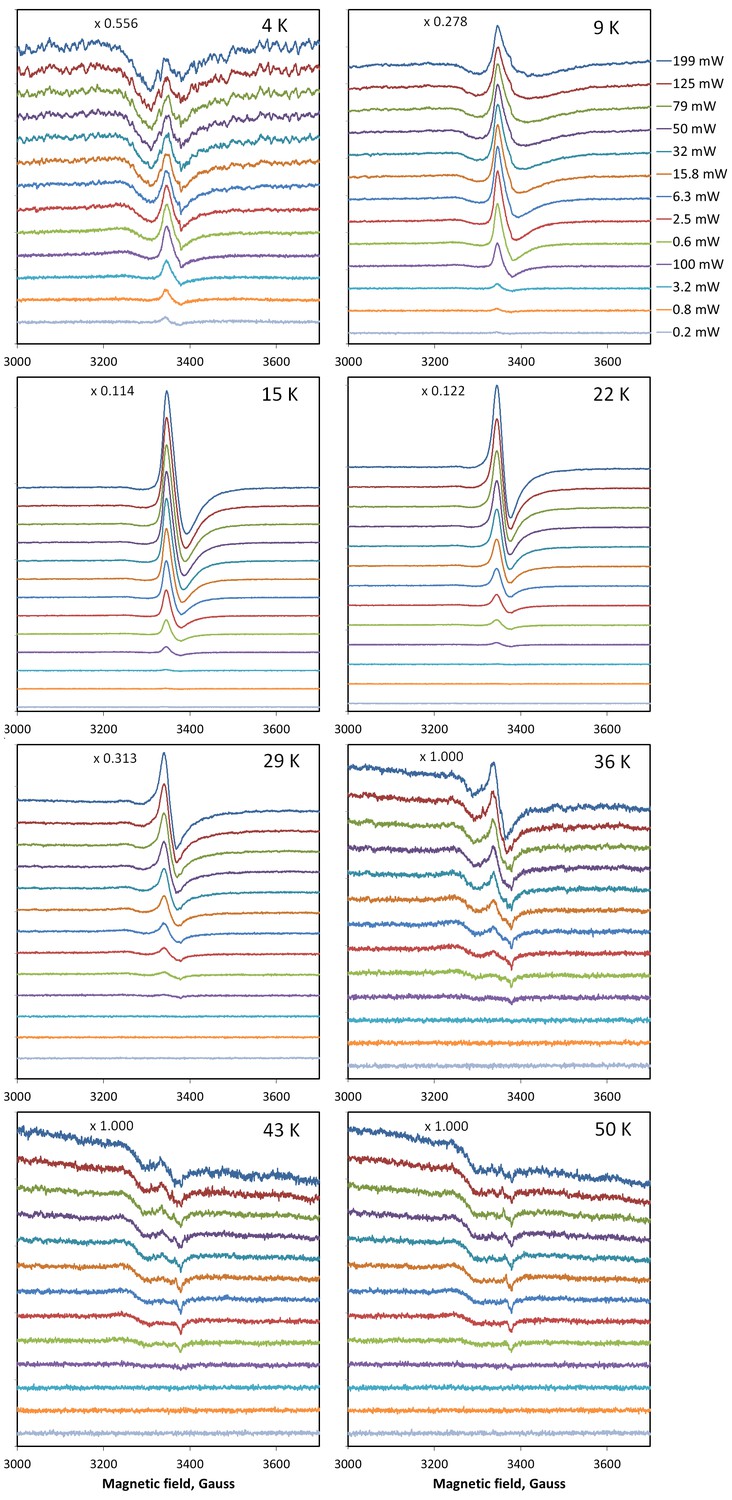
EPR saturation characteristics of the RirA EPR signal.
A complete temperature/microwave power saturation map of the RirA EPR signal (at 3 min after aerobic addition of EDTA to RirA). All spectra within each panel are plotted at the same receiver gain, and the relative gain between panels is indicated by the ‘x’ symbol. The broad line at g = 2.05 (to the left from the main signal) results from a minor baseline copper EPR signal. Instrumental settings were as follows: microwave frequency νMW = 9.4647 GHz; modulation frequency νm = 100 kHz; modulation amplitude Am = 3 G; time constant τ = 41 ms; scan rate v = 8.34 G/s.
Figure 8—figure supplement 2
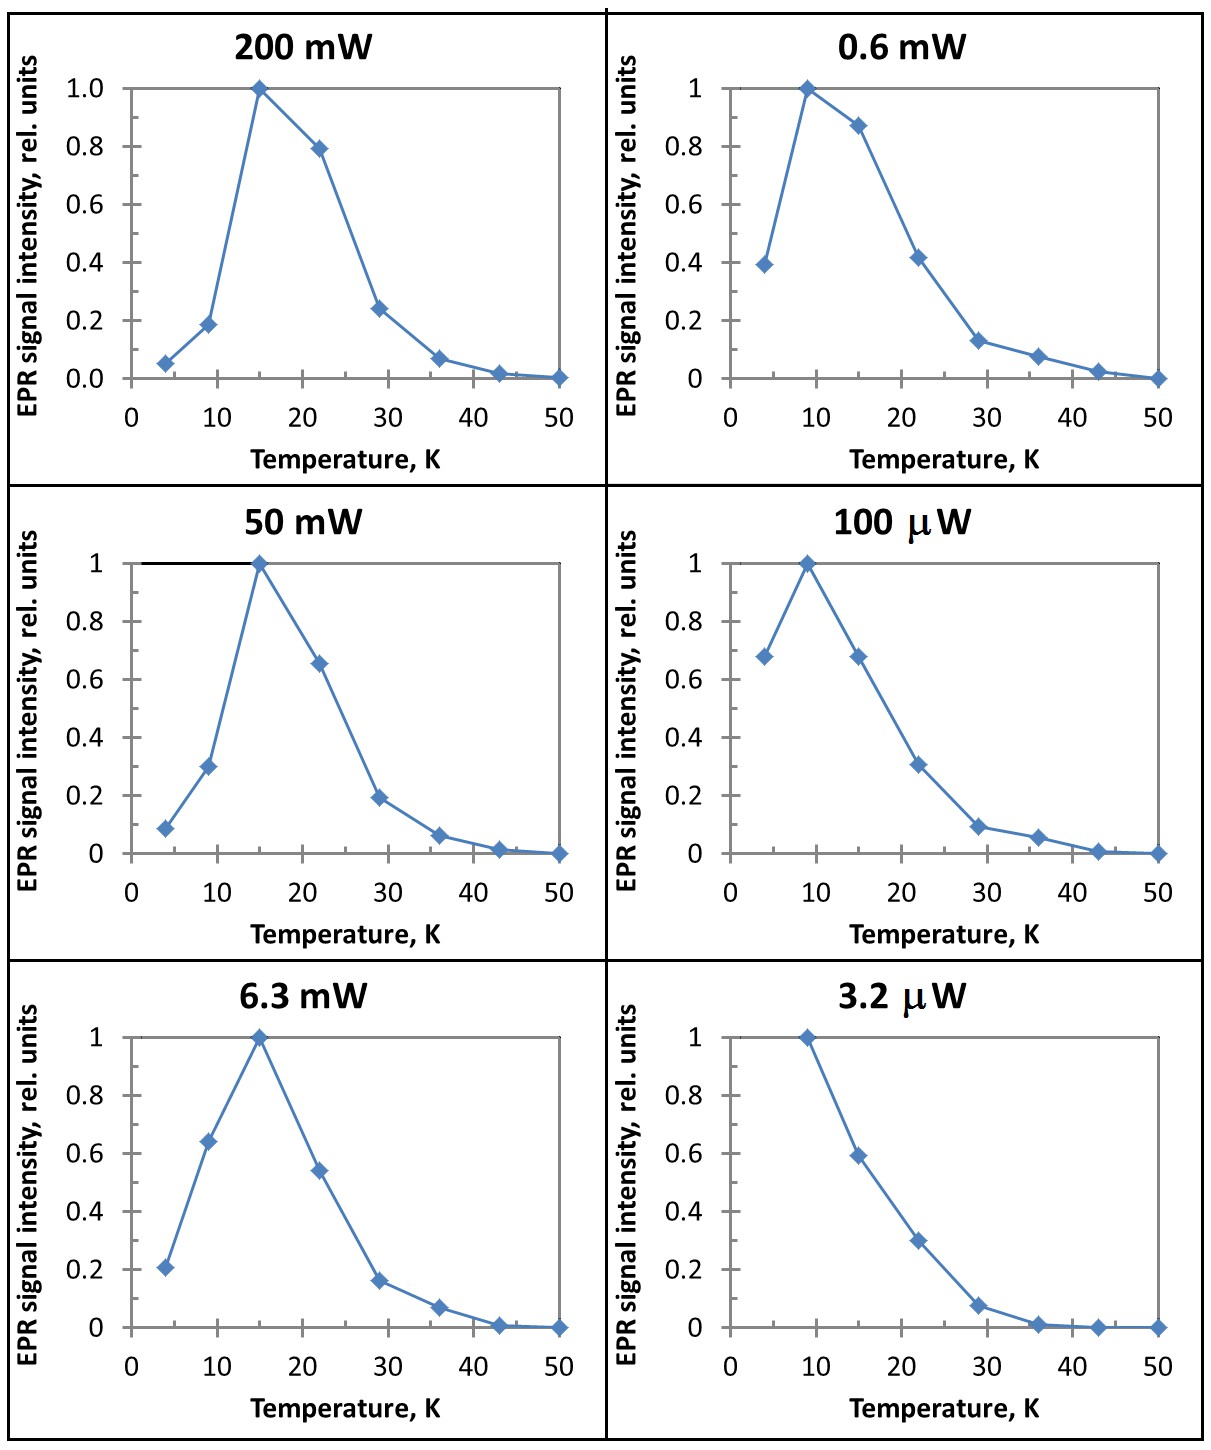
Temperature dependences of the RirA EPR signal at different microwave powers.
Plots of relative intensity (as determined from signals’ first integral maximal value which were normalised to signal intensity of 1.00) at six selected values of microwave power, as indicated.
Figure 9
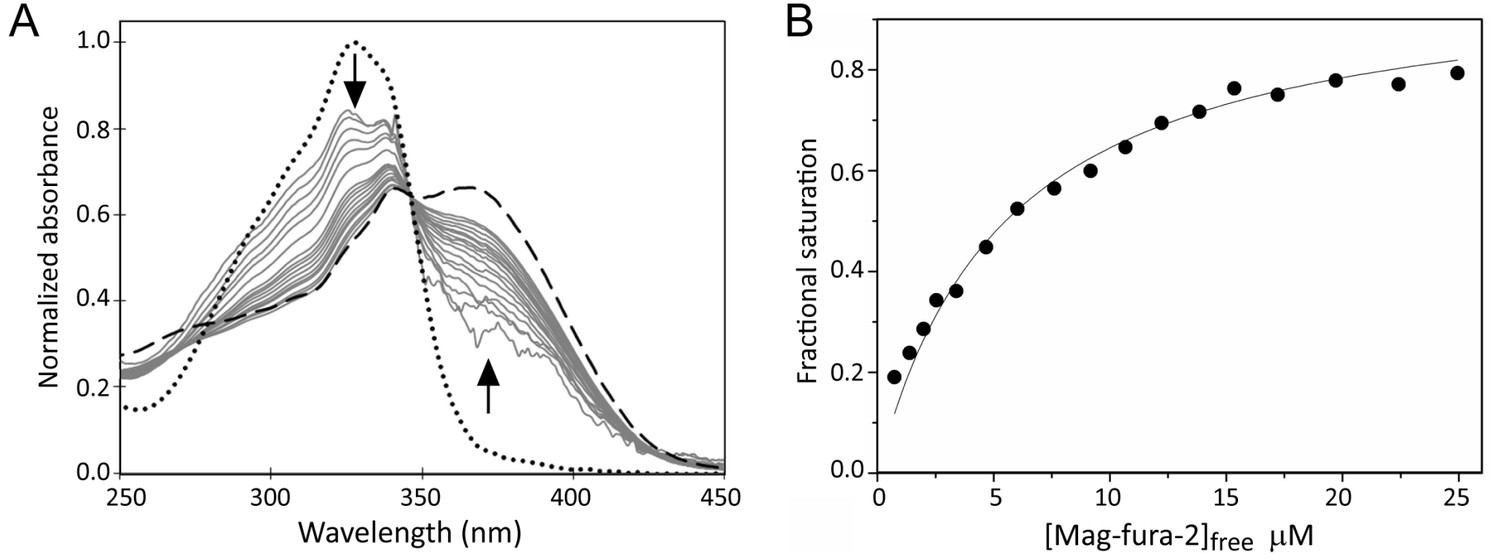
Determination of the binding affinity of the fourth iron of the RirA [4Fe-4S] cluster.
(A) Normalised UV-visible absorbance spectra showing the ratio of apo- and Fe2+-bound mag-fura-2 upon addition of increasing concentrations of mag-fura-2 to [4Fe-4S] RirA (7 µM) was in 25 mM HEPES, 50 mM NaCl, 750 mM KCl, pH 7.5. In addition to the titration spectra (solid grey lines), spectra of fully apo- (dashed line) and Fe2+-bound (dotted line) forms of mag-fura-2 are shown. Arrows denote the direction of absorbance change upon increasing concentration of mag-fura-2. (B) Plot of extent of Fe2+-mag-fura-2 complex formation (determined from data at 366 nm and expressed as fractional saturation, where one equals one Fe2+ per initial [4Fe-4S] cluster) as a function of concentration of free mag-fura-2. The data were fitted using a simple binding isotherm, giving an apparent Kd, which reflects the competition between mag-fura-2 and RirA for iron. From this, the Kd for binding of the fourth iron to the RirA cluster was determined as ~3 µM as described in Materials and methods.
Figure 10 with 3 supplements
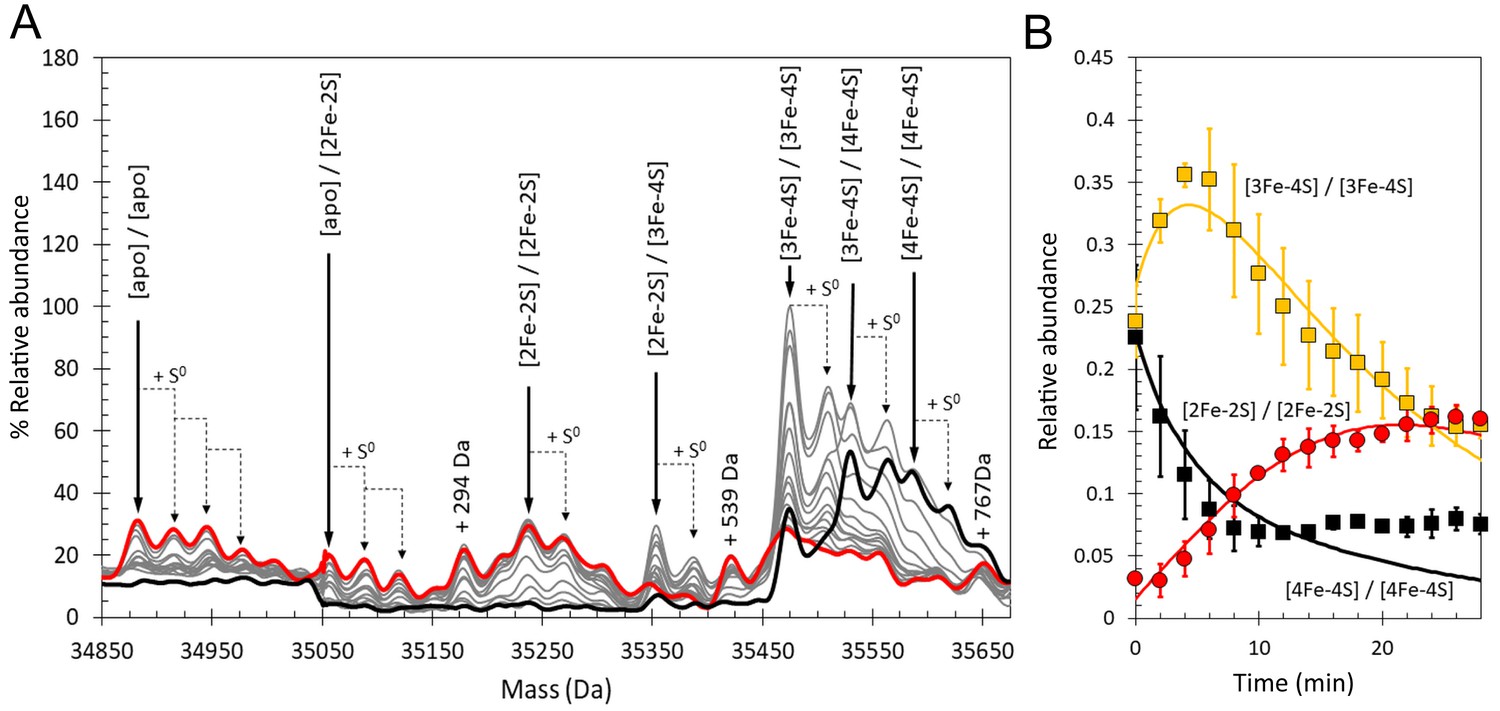
Time-resolved ESI-MS analysis of dimeric RirA cluster conversion under anaerobic, low iron conditions.
(A) Deconvoluted mass spectrum of [4Fe-4S] RirA prior to the addition of 250 µM EDTA (black line) and 30 min after the addition at 37°C (red line) and at intervening time points (grey lines). [4Fe-4S] RirA (~25 µM) was in aerobic 250 mM ammonium acetate pH 7.3. Low iron conditions were generated by the addition of 250 µM EDTA and cluster conversion/degradation was followed at 37°C. The peak at +294 Da could represent an EDTA adduct of the apo-RirA dimer. (B) Plots of relative ESI-MS abundances of [4Fe-4S]/[4Fe-4S] (black), [3Fe-4S]/[3Fe-4S] (yellow), and [2Fe-2S]/[2Fe-2S] (red) forms of RirA as a function of time following exposure to 250 µM EDTA at 37° C. Fits of the data generated by a global analysis of the ESI-MS data based on the reaction scheme depicted in Figure 10—figure supplement 1 are shown as solid lines. Error bars show standard error for ESI-MS dataset (n = 2 derived from two biological replicates).
Figure 10—figure supplement 1
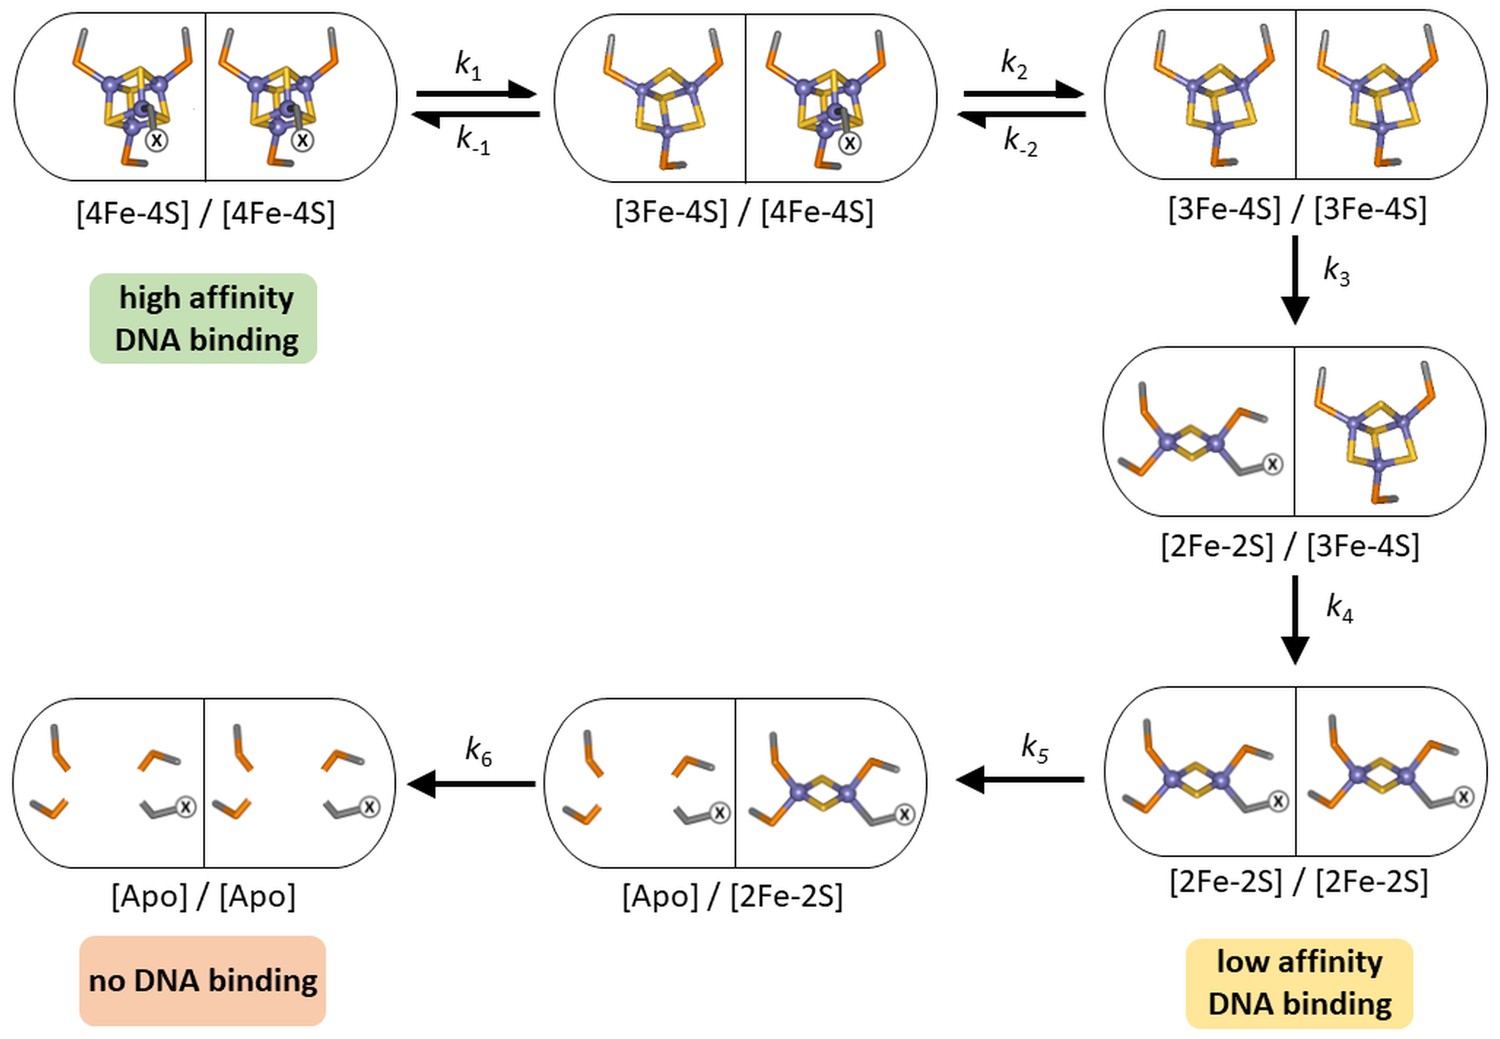
Proposed reaction scheme for dimeric [4Fe-4S] RirA cluster conversion/degradation.
Reaction scheme used to fit time resolved ESI-MS data for dimeric [4Fe-4S] RirA. Values of rate constants (k) are given in Supplementary file 2. Note that in some cases the ESI-MS data cannot unambiguously determine the identity of the intermediate species because the distribution of iron and sulphurs between two RirA monomers is unknown. However, a global fit of the data based on the illustrated mechanism is reasonable. The initial RirA [4Fe-4S] cluster is coordinated by three Cys residues and one unknown ligand, illustrated in the figure as ‘X’.
Figure 10—figure supplement 2
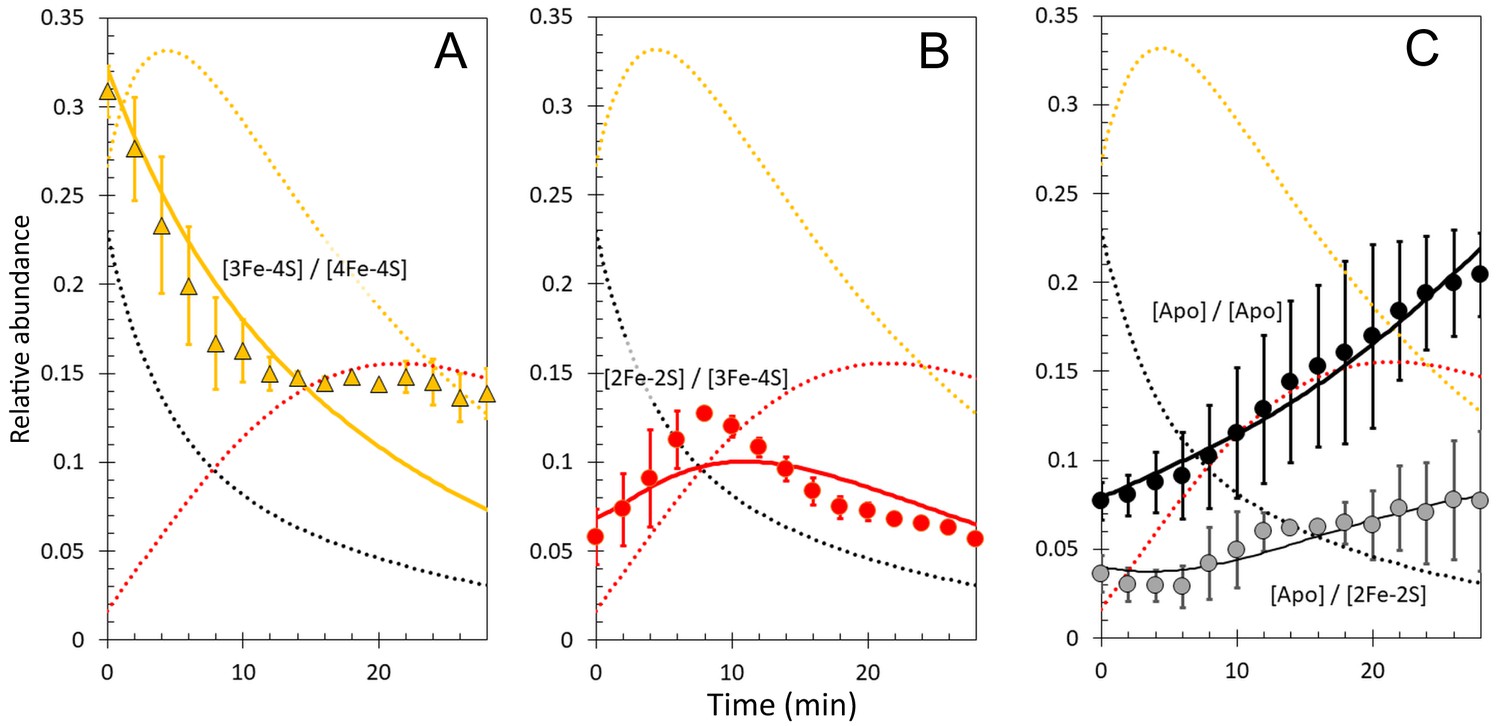
Kinetic analysis of dimeric [4Fe-4S] RirA cluster conversion/degradation.
Plots of relative ESI-MS abundance of [3Fe-4S]/[4Fe-4S] (A), [2Fe-2S]/[3Fe-4S] (B) and [apo]/[2Fe-2S] and [apo]/[apo] (C) RirA as a function of time following exposure to 250 µM EDTA at 37° C, Fits of the data generated by a global analysis of the ESI-MS data based on the reaction scheme depicted in Figure 10—figure supplement 1 are shown in solid lines. Broken lines correspond to the kinetic profile of the species associated with that colour (see Figure 10 of the main paper) and are included to permit easy comparison between intermediates. Error bars show standard error for average MS dataset (n = 2).
Figure 10—figure supplement 3
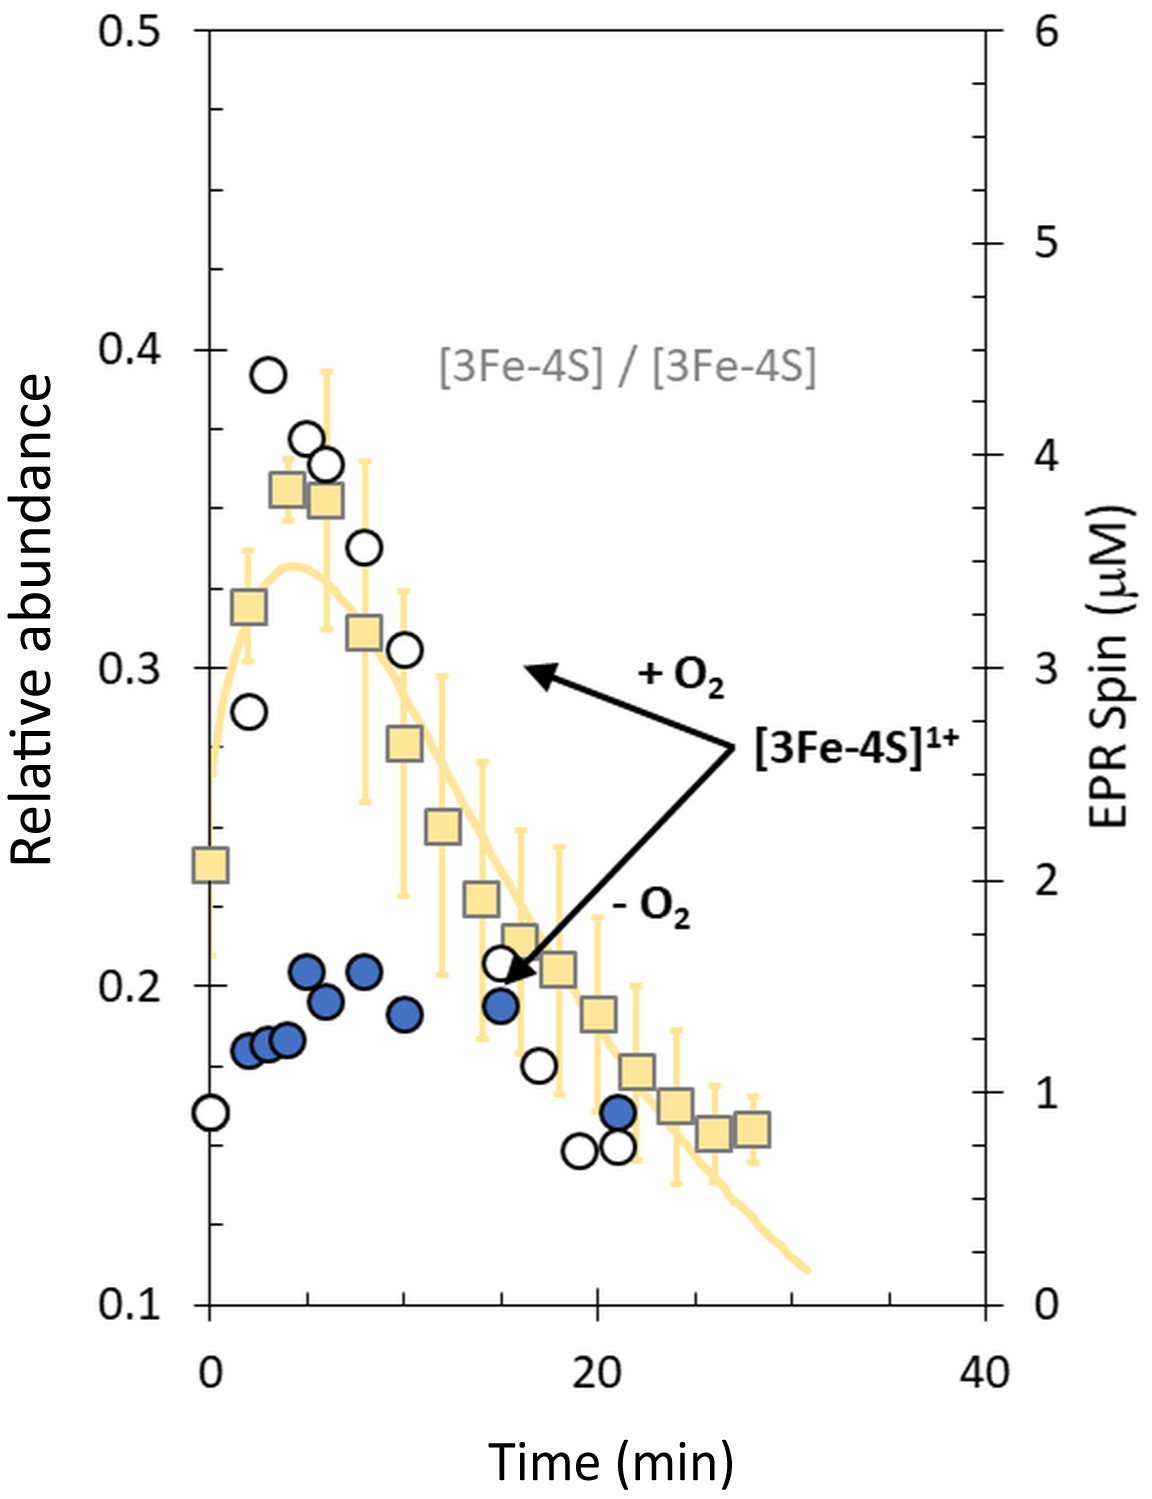
Plot of ESI-MS relative abundances of [3Fe-4S]/[3Fe-4S].
RirA species as a function of time following exposure of RirA [4Fe-4S] to 250 µM EDTA at 37° C and aerobic conditions (yellow squares) and RirA [3Fe-4S]1+ cluster determined under identical condition by EPR under aerobic (+O2, white-filled circles) and anaerobic (-O2, blue-filled circles) conditions (see Figure 8). The solid yellow line represents the global fit to the ESI-MS data (as shown in Figure 7). [4Fe-4S] RirA (~25 µM) was in aerobic (~228 µM O2) 250 mM ammonium acetate pH 7.3.
Tables
Table 1
Rate constants resulting from global fit of experimental ESI-MS data using the model shown in Figure 5.
https://doi.org/10.7554/eLife.47804.011| Reaction step | Rate constant (min−1)*,† | Reaction step | |
|---|---|---|---|
| Anaerobic (-O2) | Aerobic (+O2) | ||
| k1 | 0.300 ± 0.010 | 0.320 ± 0.020 | [4Fe-4S] → [3Fe-4S] + Fe |
| k-1 | 4.67 ± 0.33 × 10³ | 4.67 ± 0.43 × 10³ | [3Fe-4S] + Fe → [4Fe-4S] |
| k2 | 0.090 ± 0.002 | 0.230 ± 0.010 | [3Fe-4S] → [3Fe-3S] |
| k3 | 0.500 ± 0.010 | 1.200 ± 0.050 | [3Fe-3S] → [2Fe-2S] |
| k4 | 0.070 ± 0.001 | 0.200 ± 0.005 | [2Fe-2S] → apo |
| k5 | 0.008 ± 0.002 | 0.007 ± 0.002 | [4Fe-4S] → [4Fe-3S] |
| k6 | 0.087 ± 0.003 | 0.087 ± 0.008 | [4Fe-3S] → [3Fe-3S] |
| k7 | 0.083 ± 0.001 | 0.150 ± 0.008 | [4Fe-3S] → [3Fe-2S] |
| k8 | 0.030 ± 0.001 | 0.026 ± 0.020 | [3Fe-3S] → [3Fe-2S] |
| k9 | 0.044 ± 0.004 | 0.140 ± 0.002 | [3Fe-2S] → [2Fe-2S] |
| k10 | 0.160 ± 0.004 | 0.300 ± 0.010 | [3Fe-2S] → apo |
-
*With the exception of k-1, which is a second order rate constant with units of M−1 min−1.
†Standard errors are indicated.
Key resources table
| Reagent type (species) or resource | Designation | Source or reference | Identifiers | Additional information |
|---|---|---|---|---|
| Gene (Rhizobium leguminosarum strain 8401) | rirA | NA | CAC35510 | |
| Peptide, recombinant protein | R. leguminosarum RirA | Pellicer Martinez et al., 2017 | ||
| Peptide, recombinant protein | Azotobacter vinelandii NifS | Crack et al., 2014b | The nifS plasmid was a kind gift from Prof. Dennis Dean (Virginia Tech) | |
| Chemical compound, drug | 34S L-cysteine | Crack et al., 2019 | ||
| Software, algorithm | Origin | Origin Lab | Version 8 | |
| Software, algorithm | DynaFit | BioKin Ltd; Kuzmic, 1996 | RRID:SCR_008444 | Version 4 |
Additional files
-
Supplementary file 1
Predicted and observed masses for apo- and cluster-bound forms of RirA.
- https://doi.org/10.7554/eLife.47804.023
-
Supplementary file 2
Rate constants resulting from global fit of experimental ESI-MS data for RirA dimer using the model shown in Figure 10—figure supplement 1.
- https://doi.org/10.7554/eLife.47804.024
-
Transparent reporting form
- https://doi.org/10.7554/eLife.47804.025
Download links
A two-part list of links to download the article, or parts of the article, in various formats.
Downloads (link to download the article as PDF)
Open citations (links to open the citations from this article in various online reference manager services)
Cite this article (links to download the citations from this article in formats compatible with various reference manager tools)
Mechanisms of iron- and O2-sensing by the [4Fe-4S] cluster of the global iron regulator RirA
eLife 8:e47804.
https://doi.org/10.7554/eLife.47804


