Altered gating of Kv1.4 in the nucleus accumbens suppresses motivation for reward
- University of Kentucky, United States
- University of South Carolina, United States
Figures
Figure 1 with 1 supplement
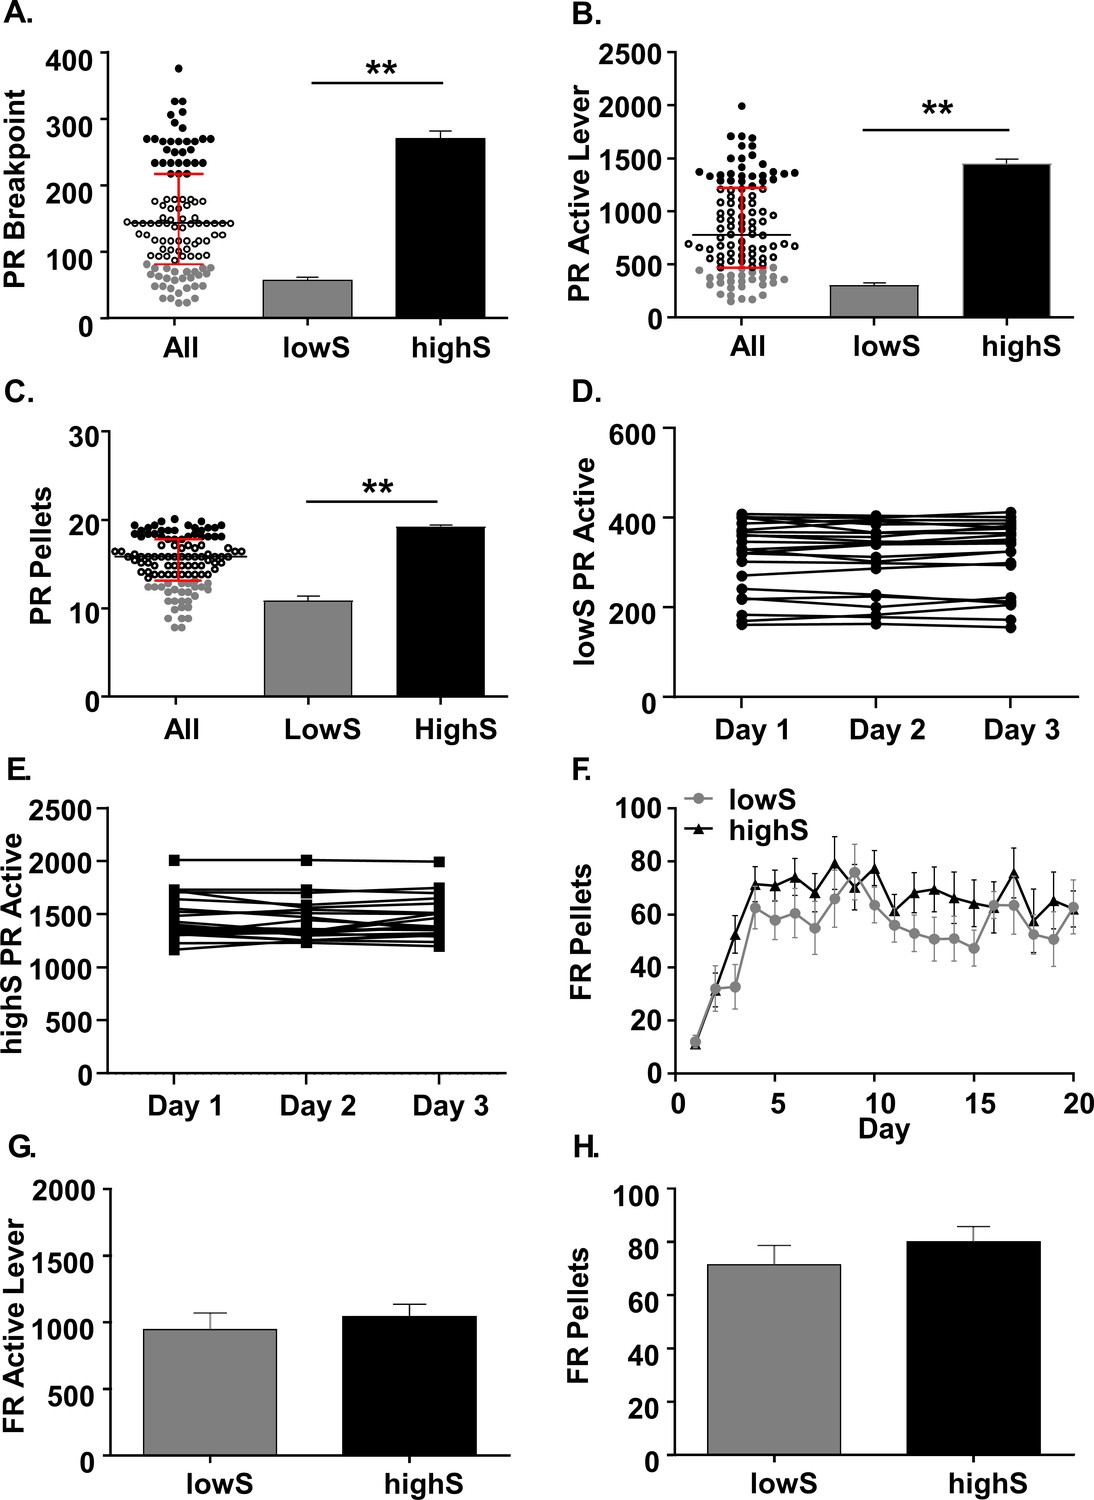
Characterization of behavioral variability on a progressive ratio task.
(A) Scatterplot: Individual breakpoints of rats tested on the PR schedule of reinforcement (N = 111. Black bar: median. Red bars: upper and lower interquartile ranges. Bar histograms: Breakpoints were significantly different between rats in the lowest breakpoint quartile (lowS, N = 23) and rats in the highest breakpoint quartile (highS, N = 21). (B) Averaged over the last three days of the PR schedule, the rats in the lowS group pressed the active lever significantly fewer times and (C) earned significantly fewer pellets. (D) Stability of active lever presses in lowS rats over last 3 days on PR schedule. (E) Stability of active lever presses in highS over last 3 days on PR schedule. (F) Rats in the lowS and highS groups acquired the sucrose self-administration task (FR1→FR3→FR10 schedule) at a similar rate. (G) Mean active lever presses over the last three days of FR10 schedule were not different between groups. (H) Mean pellets earned over the last three days of FR10 schedule were not different between groups. **, p<0.01.
Figure 1—figure supplement 1
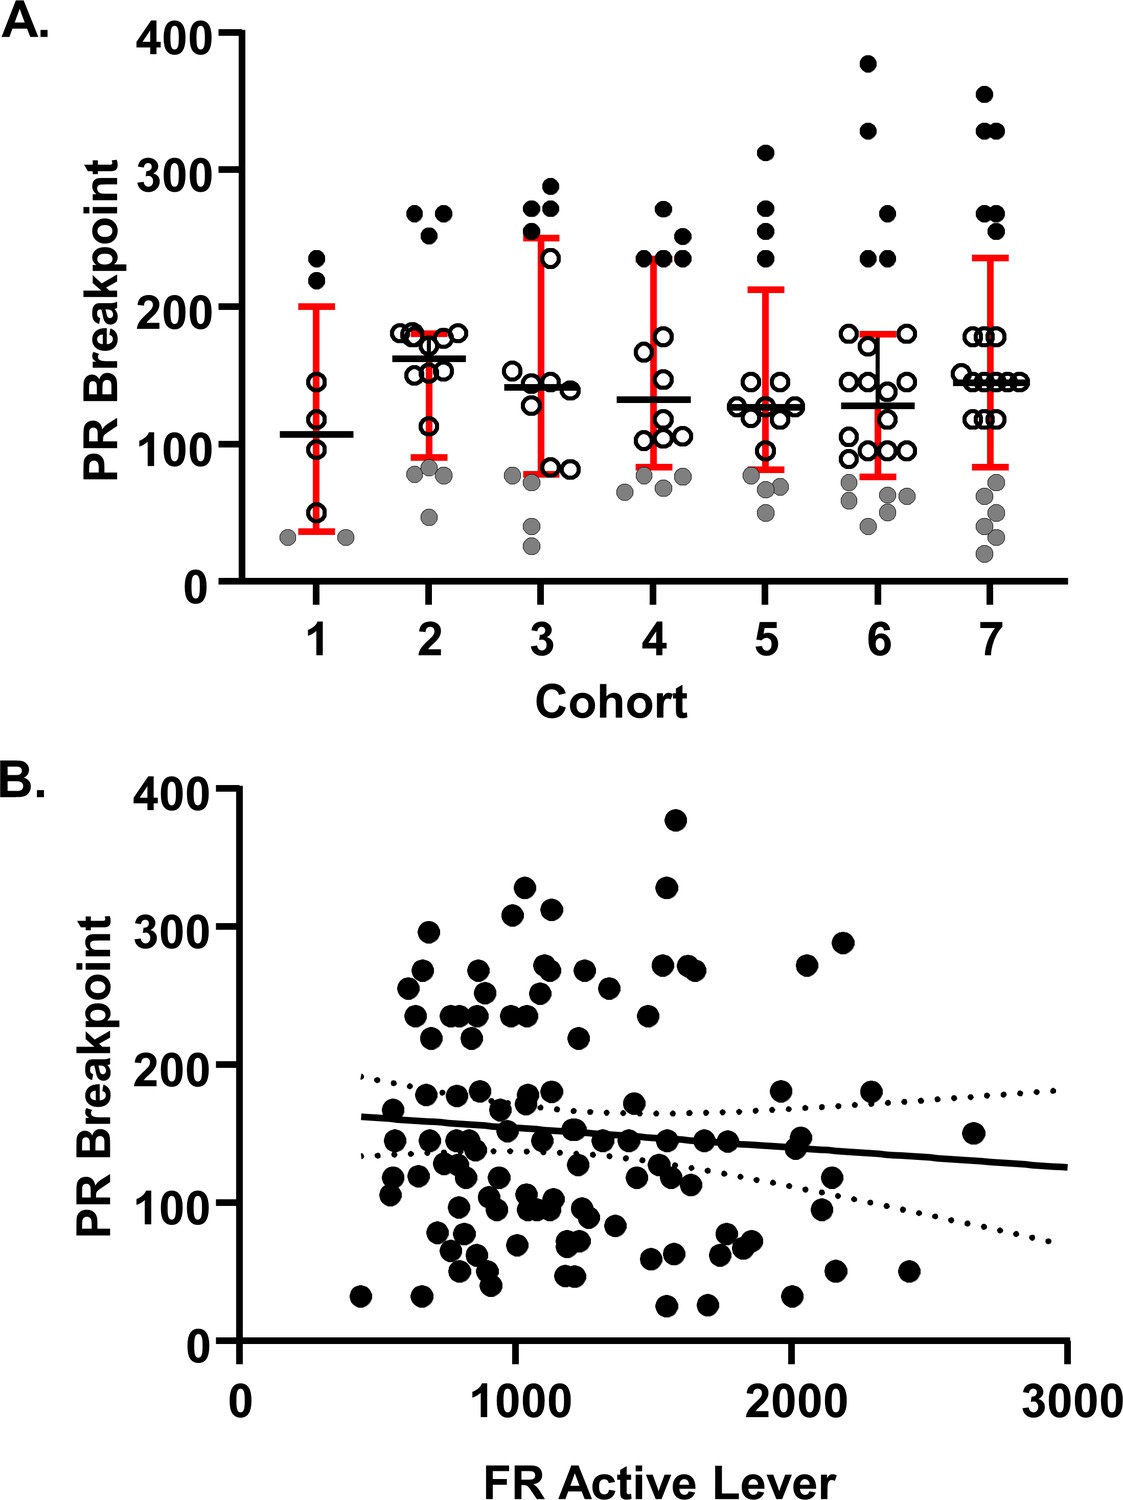
Cohort to cohort variability and FR-PR correlation.
(A) Seven cohorts of rats were used in the study. Cohort size was 8, 16 or 24 subjects. For each cohort, the highS group was identified as the top quartile of the interquartile distribution and lowS as the bottom quartile of the interquartile distribution. Animals for individual experiments were drawn from these cohorts as follows: Corticosterone assay: cohort 5; RNA-seq: cohort 5; Electrophysiology: cohorts 1–6; UK-78,282 microinjections: cohort 7. Note that across cohorts, behavioral performance of every lowS animal was dramatically different from behavior of every highS animal. Note also that across cohorts, there was some overlap in breakpoint values between midS and highS values (e.g. highS in cohort one and midS in cohort 3) as well as midS and lowS values (e.g. lowS in cohort two and midS in cohort 3). (B) There was no correlation between FR active lever presses on FR10 and PR breakpoint (Pearson’s r2 = −0.089, p=0.35).
Figure 2
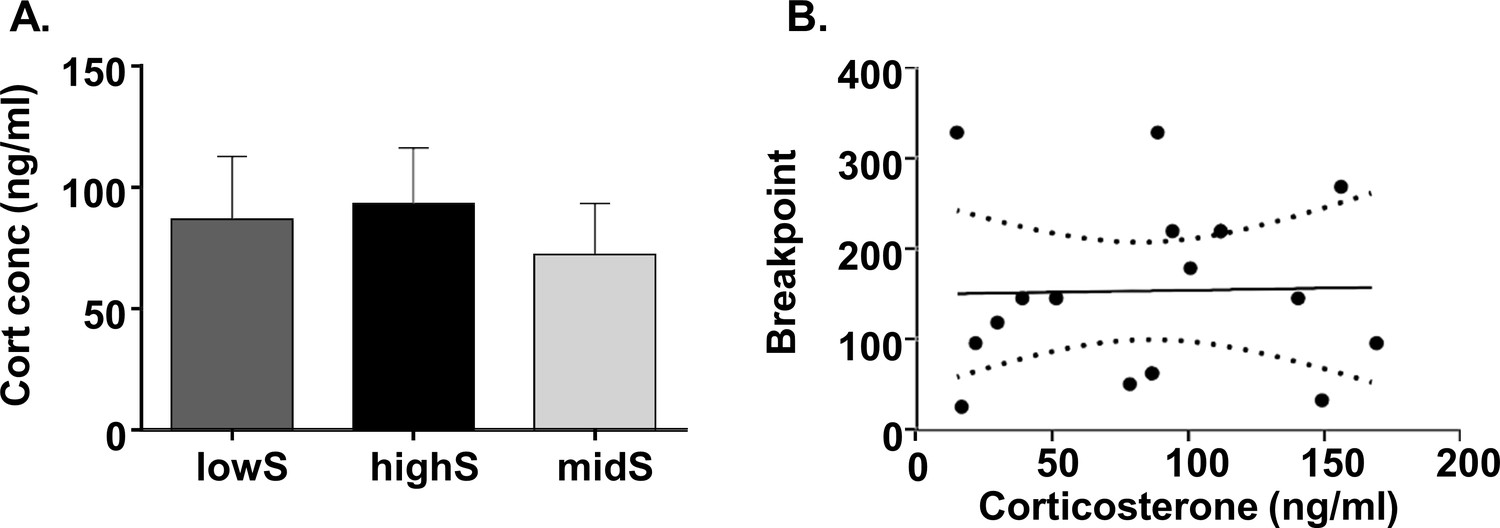
Progressive ratio performance does not depend on individual stress levels.
(A) Plasma corticosterone levels do not differ between lowS, highS, and intermediate performance (midS) rats. (B) Breakpoint values on the PR schedule do not correlate with plasma corticosterone levels (N = 5/group).
Figure 3
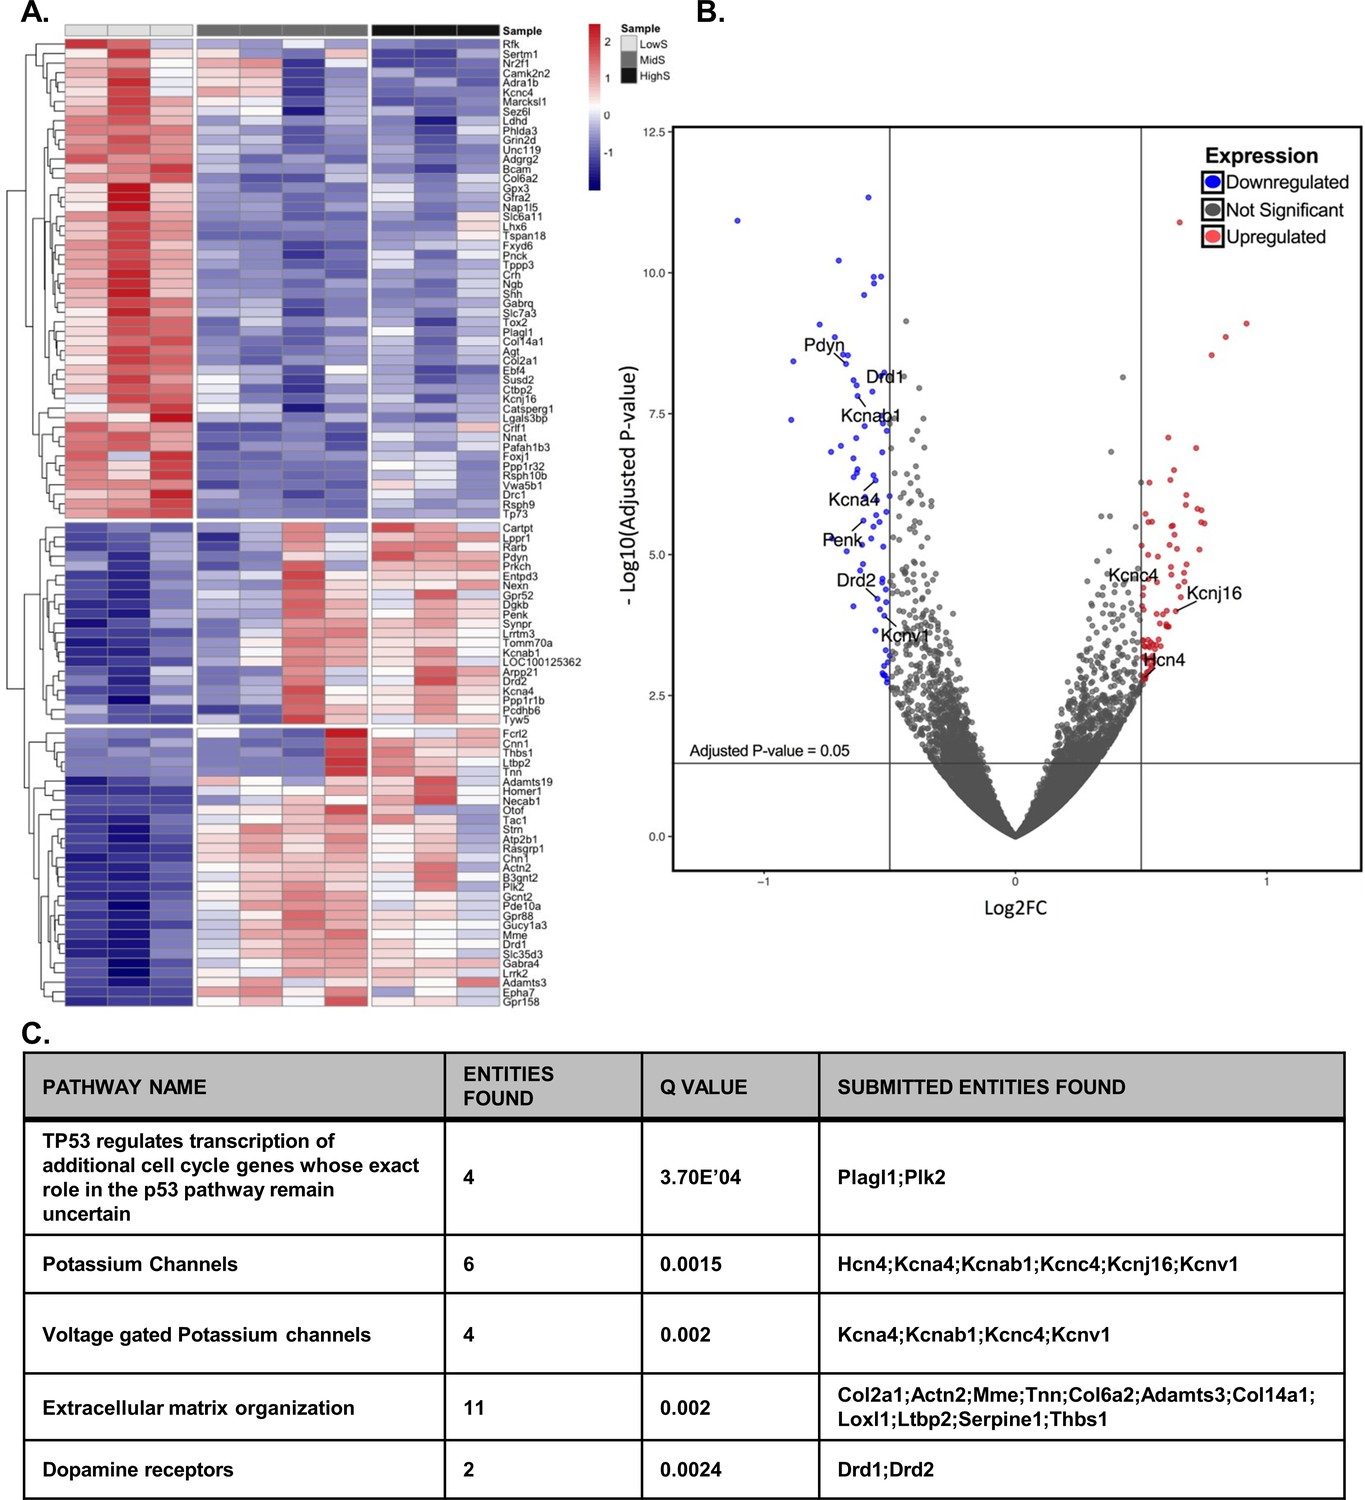
Divergent transcriptome profile in lowS and highS rats.
(A) A clustergram summary of top differentially expressed genes (DEGs) between lowS, highS, and midS rats. Each column represents RNA sequencing of NAc tissue from a single animal. Log2fold values are color coded red for upregulated genes and blue for downregulated genes. (B) Volcano plot highlighting genes related to K+ channel activity and dopamine signaling in lowS versus highS transcriptome. (C) Pathway analysis showing top mechanistic networks related to divergent motivation for sucrose in lowS and highS rats (N = 3, 4 and 3 for lowS, midS and highS, respectively).
-
Figure 3—source data 1
Divergent transcriptome profile in highS and lowS rats.
Full gene list of DEGs between lowS vs highS, and lowS vs midS groups, including log2fold change values, p-values, and q-value (p-value adjusted to FDR). Genes with log2fold change of ≥0.5 and FDR < 0.05 and those with log2fold change of ≤0.5 and FDR < 0.05 were considered differentially expressed. Negative log2fc values indicate transcripts that were downregulated in the highS or midS groups relative to the lowS group. Positive log2fc values indicate transcripts that were upregulated in the highS or midS groups relative to the lowS group.
- https://doi.org/10.7554/eLife.47870.006
Figure 4 with 2 supplements
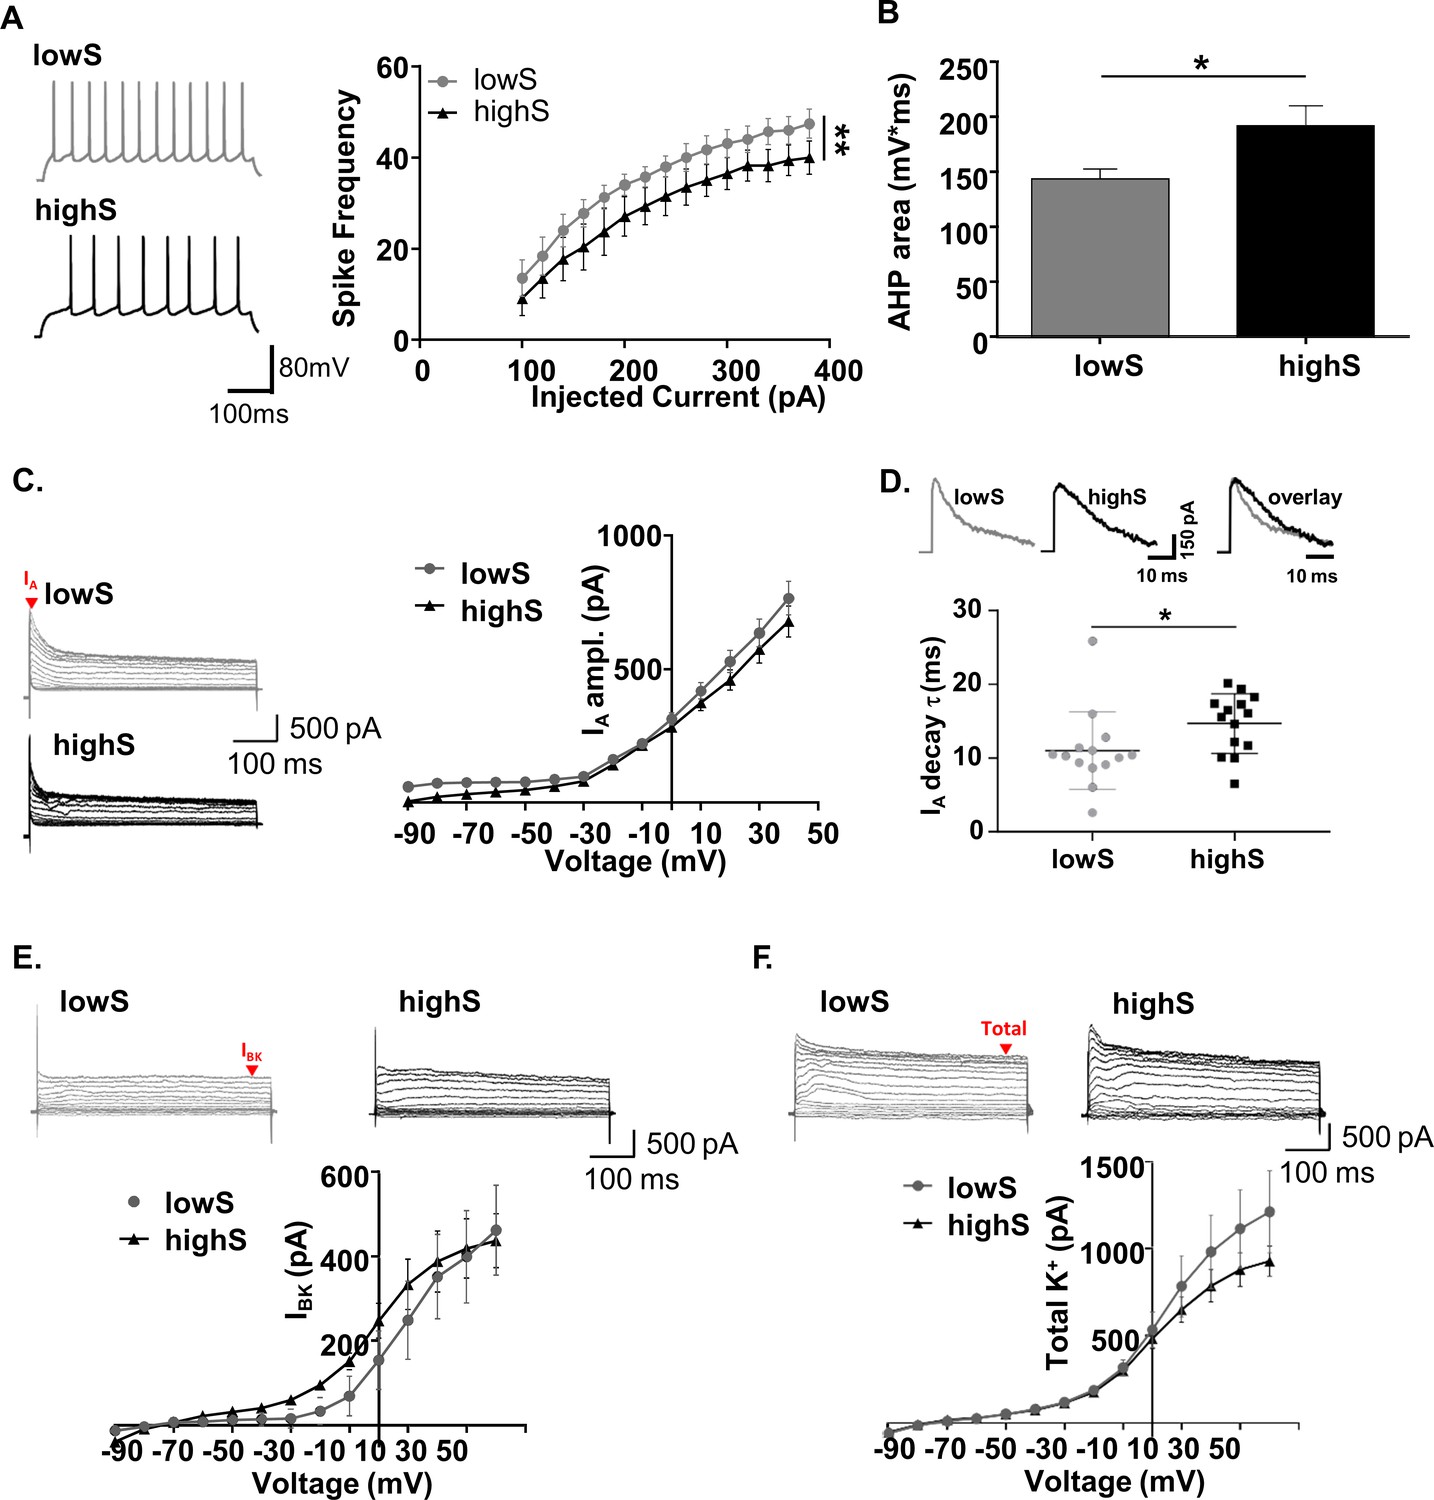
Low motivation for sucrose is associated with increased SPN excitability.
(A) Left, representative traces from NAc SPNs in lowS and highS animals at a depolarizing (+200 mV) current step. Right, action potential output across a range of injected current steps is significantly elevated in the lowS group (**, p<0.01, n = 9 N = 5/group). (B) Decreased afterhyperpolarization area in SPNs from lowS animals is consistent with increased action potential firing (n = 9, N = 5/group; *, p<0.05). (C) Left, representative traces of A-type (IA) currents in lowS and highS rats (n = 16 and 14 for lowS and highS, respectively; N = 5/group). Current amplitude was measured at the peak (red arrow). Right, Current-voltage relationship for IA is similar between groups. (D) Top, representative IA traces from lowS and highS animals are amplitude-scaled and overlaid to highlight differences in inactivation kinetics. Bottom, faster IA inactivation kinetics in the lowS animals in a scatterplot of decay times measured from the largest depolarizing peak in each group. (E) Top, representative traces of IBK currents isolated by paxilline. Current amplitude was measured at steady-state (red arrow). Bottom, there is no difference in IBK current-voltage relationship between lowS and highS animals (n = 7, N = 4/group). (F) Top, representative traces of total K+ current blocked by combination of 4-AP and TEA. Bottom, there is no difference in current-voltage relationship for total K+ current amplitude between lowS and highS animals (n = 7, N = 4/group).
Figure 4—figure supplement 1
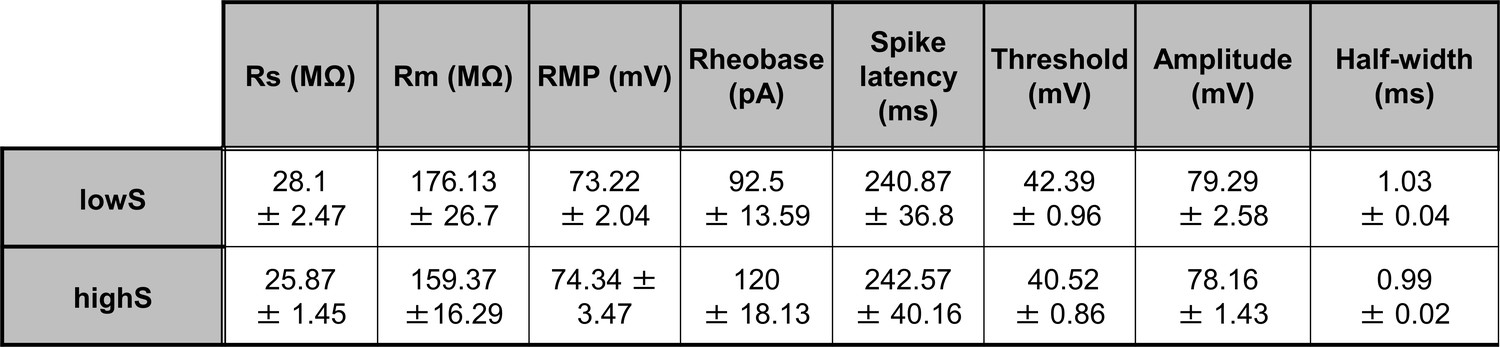
Membrane excitability measures do not differ between lowS and highS groups.
There were no significant differences in: membrane resistance (Rm, t(16)=0.54, p=0.6), resting membrane potential (RMP, t(16)=0.28, p=0.78), rheobase (t(16)=1.18, p=0.26), spike threshold (t(16)=1.4, p=0.18), spike amplitude (t(16)=0.38, p=0.7), spike half-width (t(16)=0.9, p=0.38), and latency to first spike (spike latency, t(16)=0.03, p=0.97) as measured by unpaired Student’s t-test. Series resistance (Rs) values are included for reference and were not different between groups (t(16)=1.26, p=0.23, unpaired Student’s t-test).
Figure 4—figure supplement 2
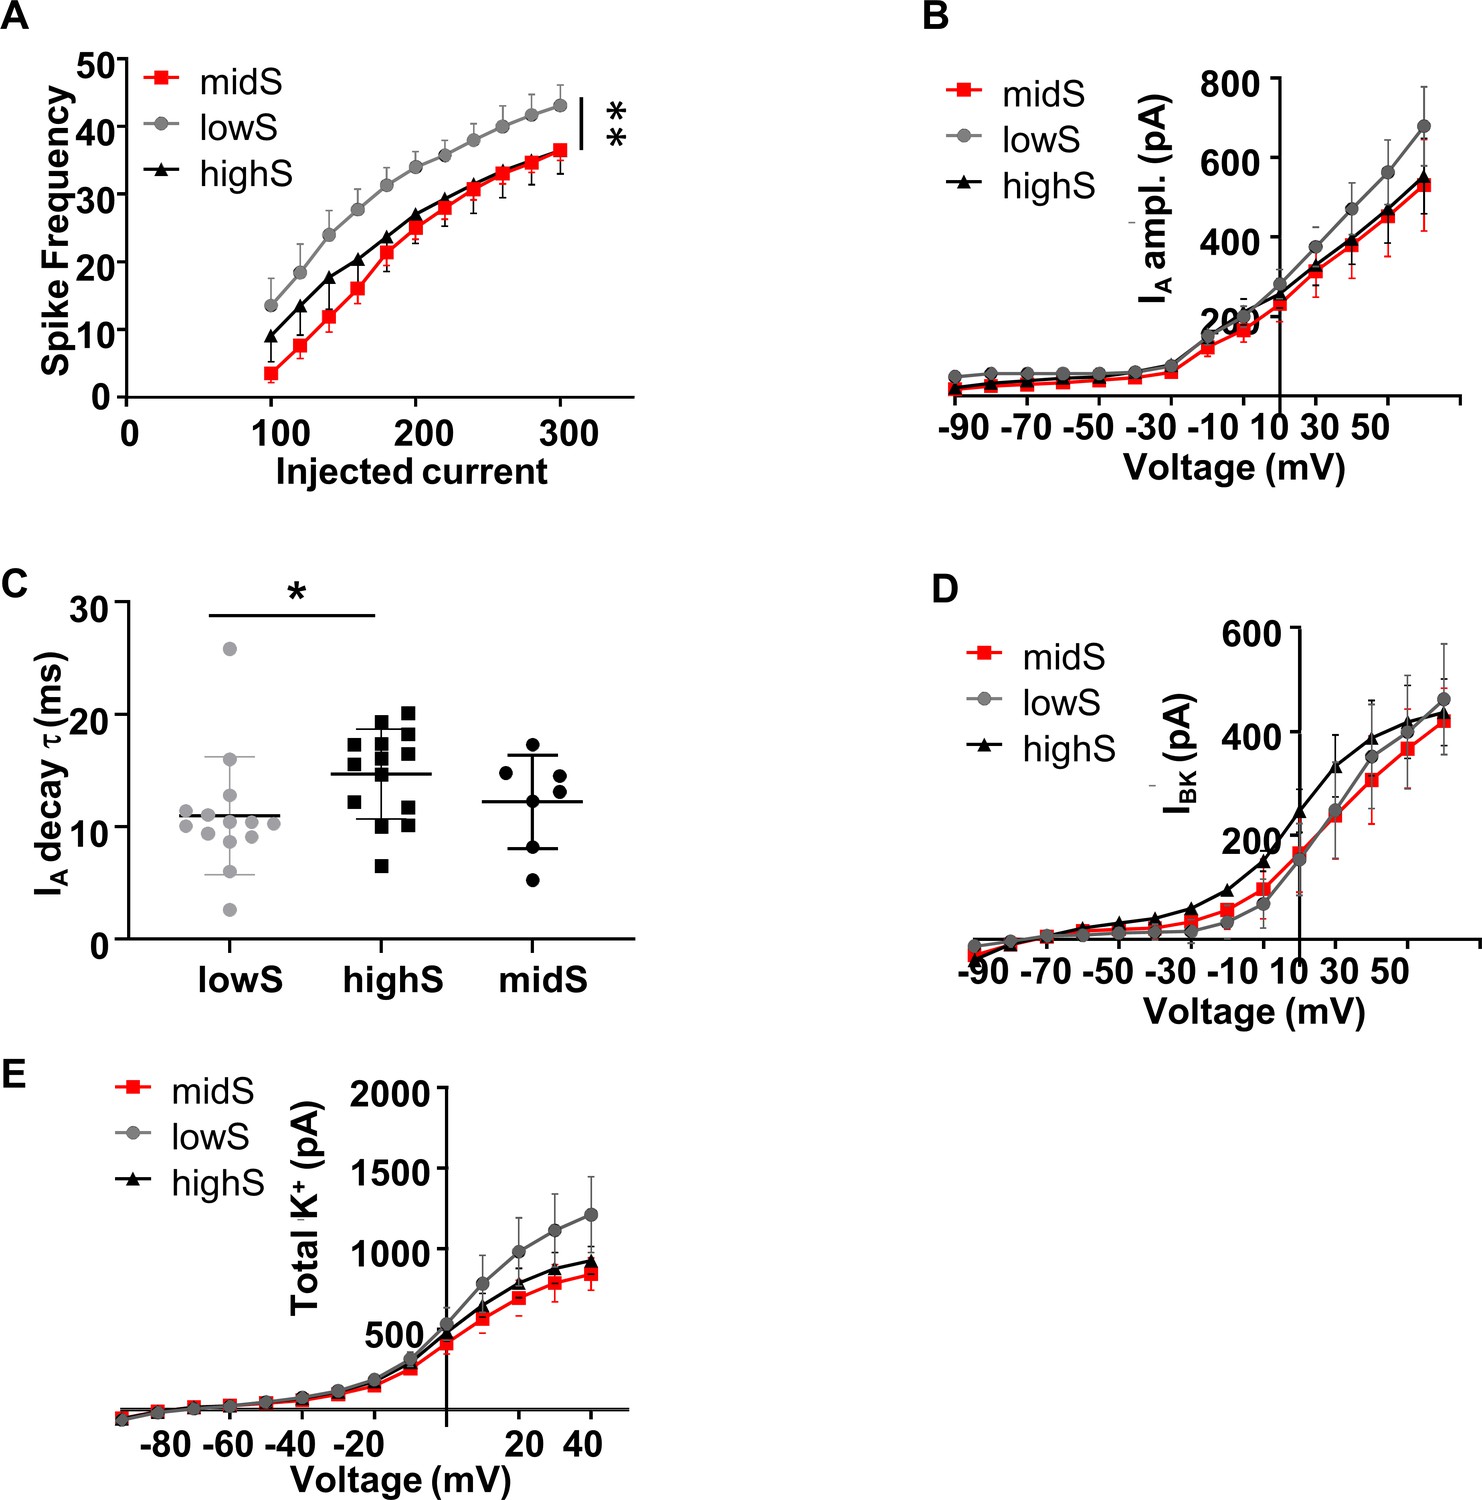
Spike output and K+ currents in midS animals align closely with the highS group.
All highS and lowS data are duplicated from Figure 5 for comparison. (A) Action potential output of NAc shell SPN from midS animals (n = 7, N = 4) is significantly lower than in lowS animals (**p<0.01 midS vs lowS; two-way ANOVA), but not significantly different from the highS animals. (B) There were no significant differences between any groups in IA peak amplitude. (C) IA decay time in midS group was not different from values in either lowS or highS groups. There were no significant differences between any groups in: (D) BK current amplitude, or (E) Amplitude of the total TEA and 4-AP sensitive K+ current.
Figure 5 with 2 supplements
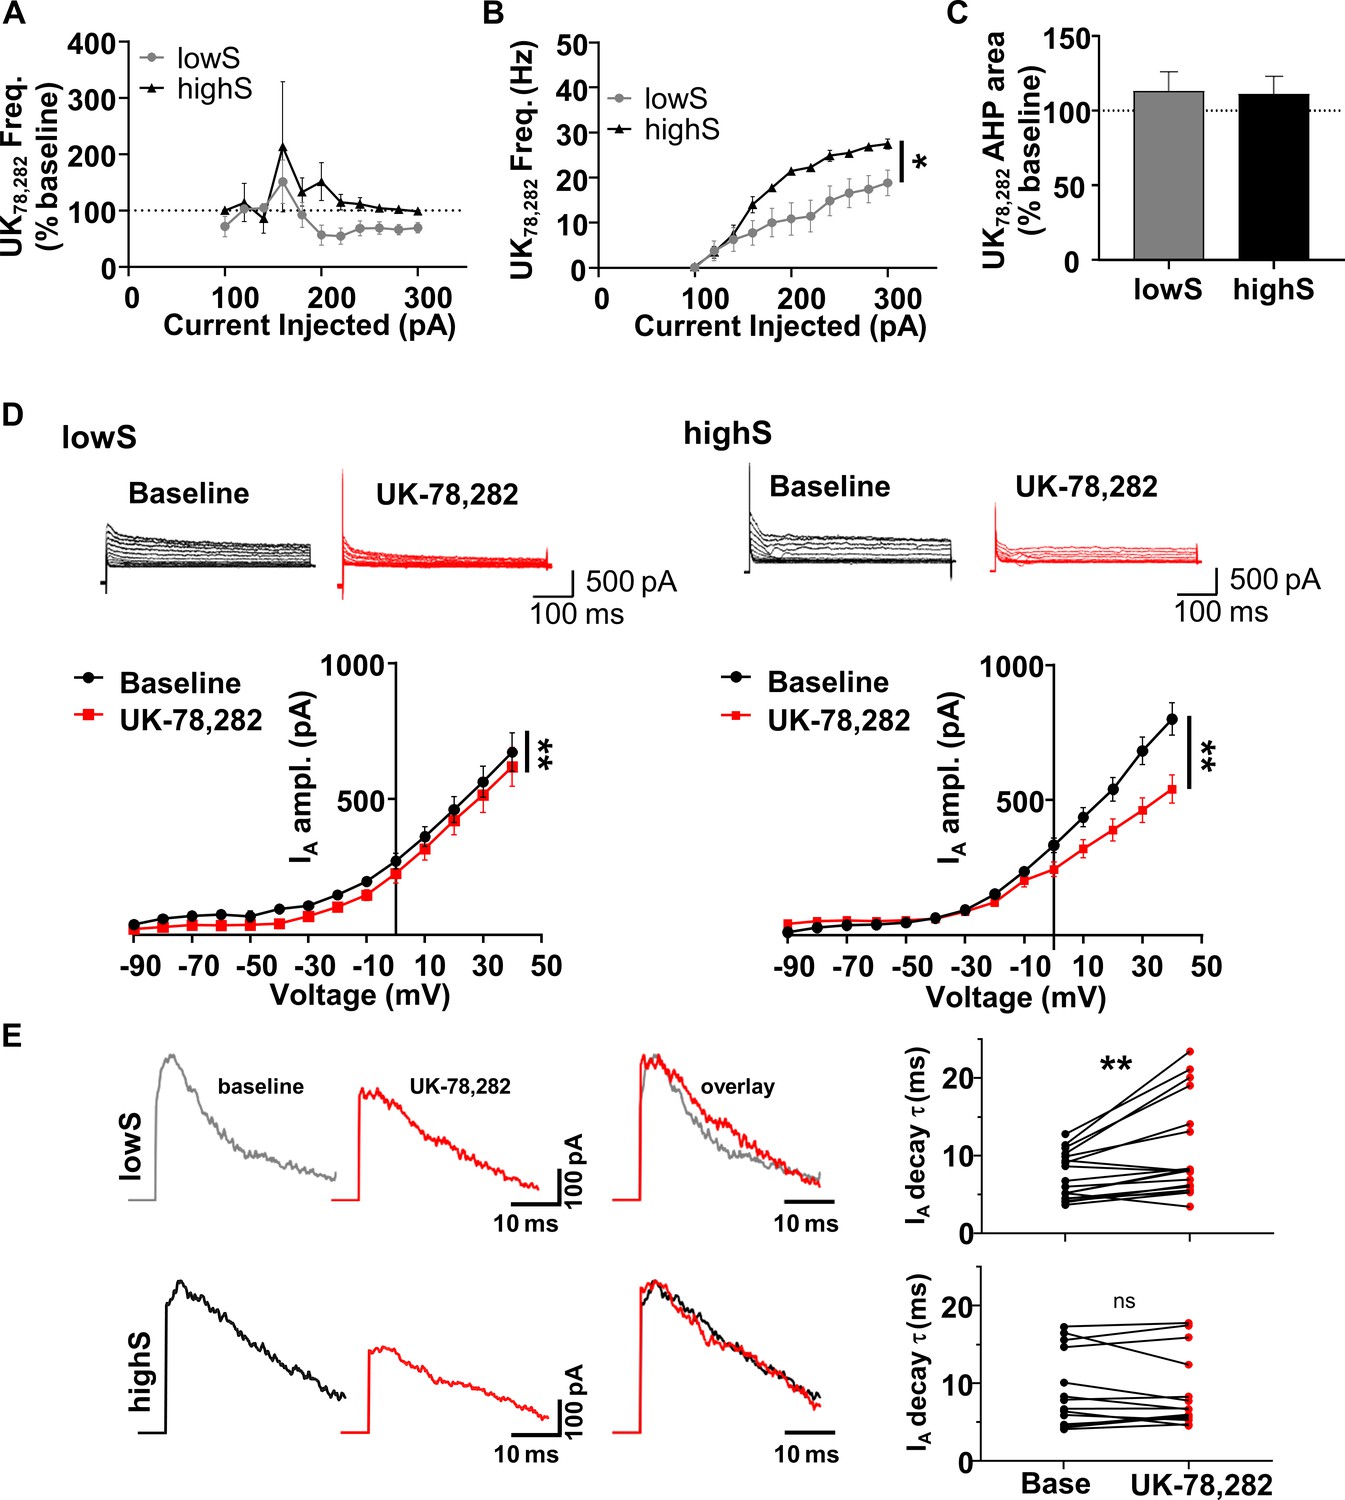
NAc neurons from lowS animals are uniquely sensitive to Kv1.4 antagonist, UK-78,282.
(A) Action potential frequency was measured after application of UK-78,282 (100 nM) and expressed as percent change from frequency before UK-78,282 in the same cell (n = 7, N = 4/group). UK-72,282 suppresses firing in the lowS group to levels significantly different from baseline (Main drug effect: F(1,6) = 3.7, p=0.024, two-way RM ANOVA). In the highS group, firing after UK-72,282 application is not significantly different from baseline (Main drug effect: F(1,6) = 0.99, p=0.36, two-way RM ANOVA). (B) Firing frequency-current relationship highlights decreased action potential output in the lowS group after UK-78,282 application (*, p<0.05, two-way RM ANOVA). (C) UK-78,282 did not have an effect on AHP area in neurons from either the lowS or the highS groups. (D) Top, Representative traces of IA before and after UK-78,282 (100 nM) application in lowS (left, n = 13, N = 6) and highS (right, n = 14, N = 6) animals. Bottom, Current-voltage relationships indicate suppression of IA current amplitude by UK-78,282 in both groups (**, p<0.01, two-way RM ANOVA). (E) Left, representative IA traces before (baseline) and during UK-78,282 are amplitude-scaled and overlaid to highlight UK-78,282 effect on inactivation kinetics. Right, UK-78,282 increases IA inactivation time constant (τ) in lowS (top, n = 18, N = 6), but not highS (bottom, n = 16, N = 6), group. **, p<0.01, paired Student’s t-test; ns, not significant. The highS data excludes two cells where UK-78,282 increased decay times to anomalous levels (cell 1: from 20.1 ms to 34 ms; cell 2: from 17.4 ms to 49.8 ms). Including these two cells in the analysis did not change statistical interpretation (p=0.23, paired Student’s t-test).
Figure 5—figure supplement 1
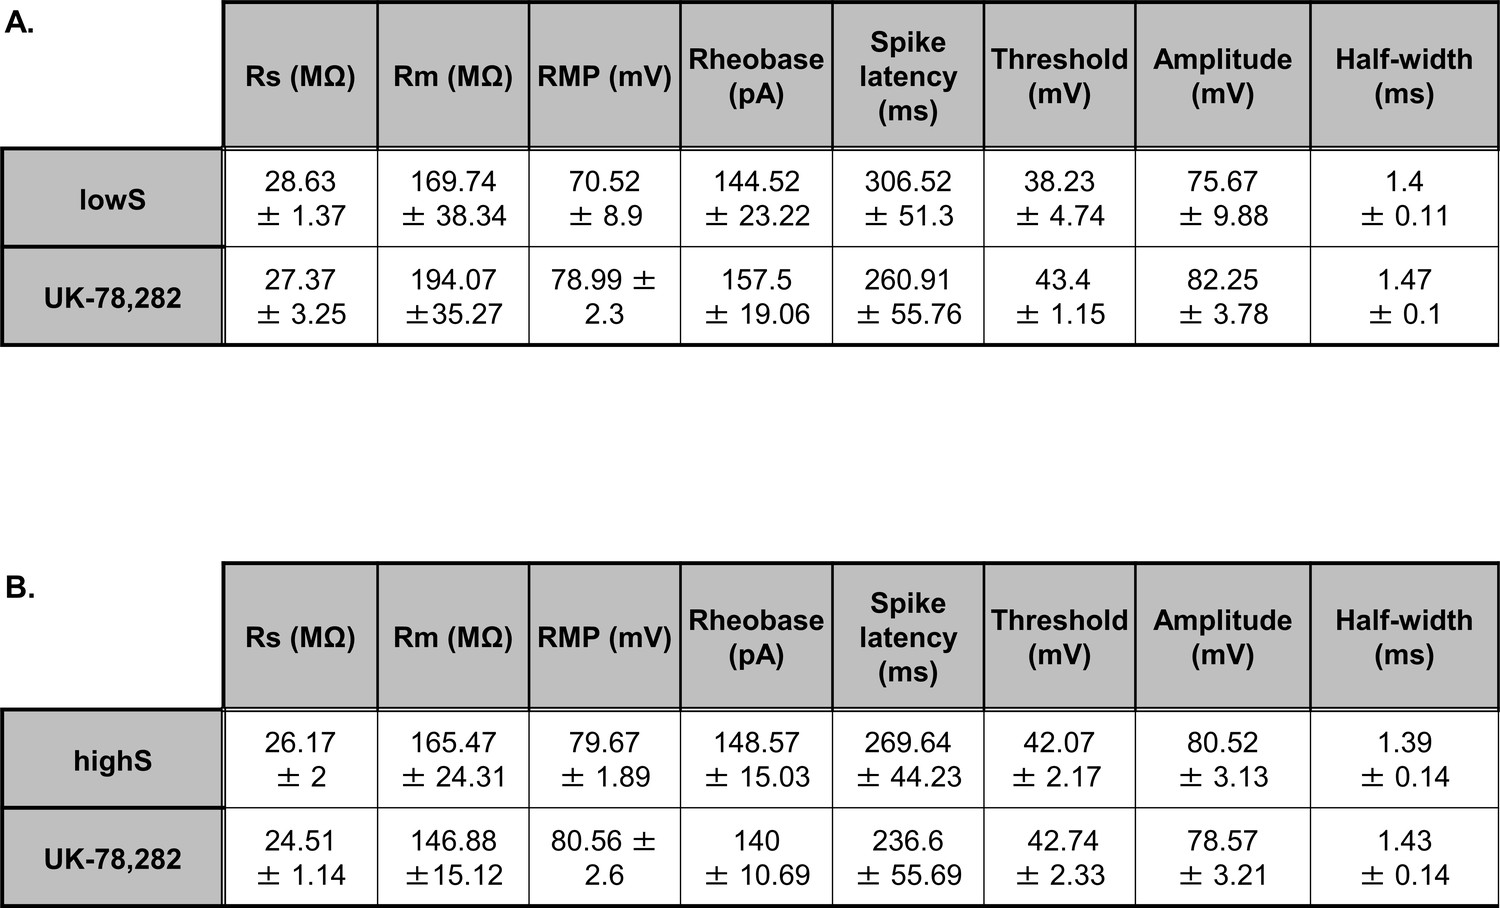
UK-78,282 effects on membrane excitability measures.
(A) In the lowS group, UK-78,282 (100 nM) application had no significant effect on: membrane resistance (Rm, t(6)=0.61, p=0.85), resting membrane potential (RMP, t(6)=0.2, p=0.85), rheobase (t(6)=0.3, p=0.77), spike threshold (t(6)=0.62, p=0.56), spike amplitude (t(6)=2.08, p=0.08), spike half-width (t(6)=0.45, p=0.67), and latency to first spike (spike latency, t(6)=1.16, p=0.28) as measured by paired Student’s t-test. (B). In the highS group, UK-78,282 (100 nM) application had no significant effect on: membrane resistance (Rm, t(6)=0.69, p=0.53), resting membrane potential (RMP, t(6)=0.87, p=0.41), rheobase (t(6)=0.89, p=0.41), spike threshold (t(6)=0.43, p=0.68), spike amplitude (t(6)=1.41, p=0.21), spike half-width (t(6)=1.26, p=0.25), and latency to first spike (spike latency, t(6)=0.84, p=0.43) as measured by unpaired Student’s t-test. Series resistance (Rs) values are included for reference and were not different between groups lowS: t(6)=0.36, p=0.72; highS: t(6)=0.72, p=0.51, paired Student’s t-tests).
Figure 5—figure supplement 2
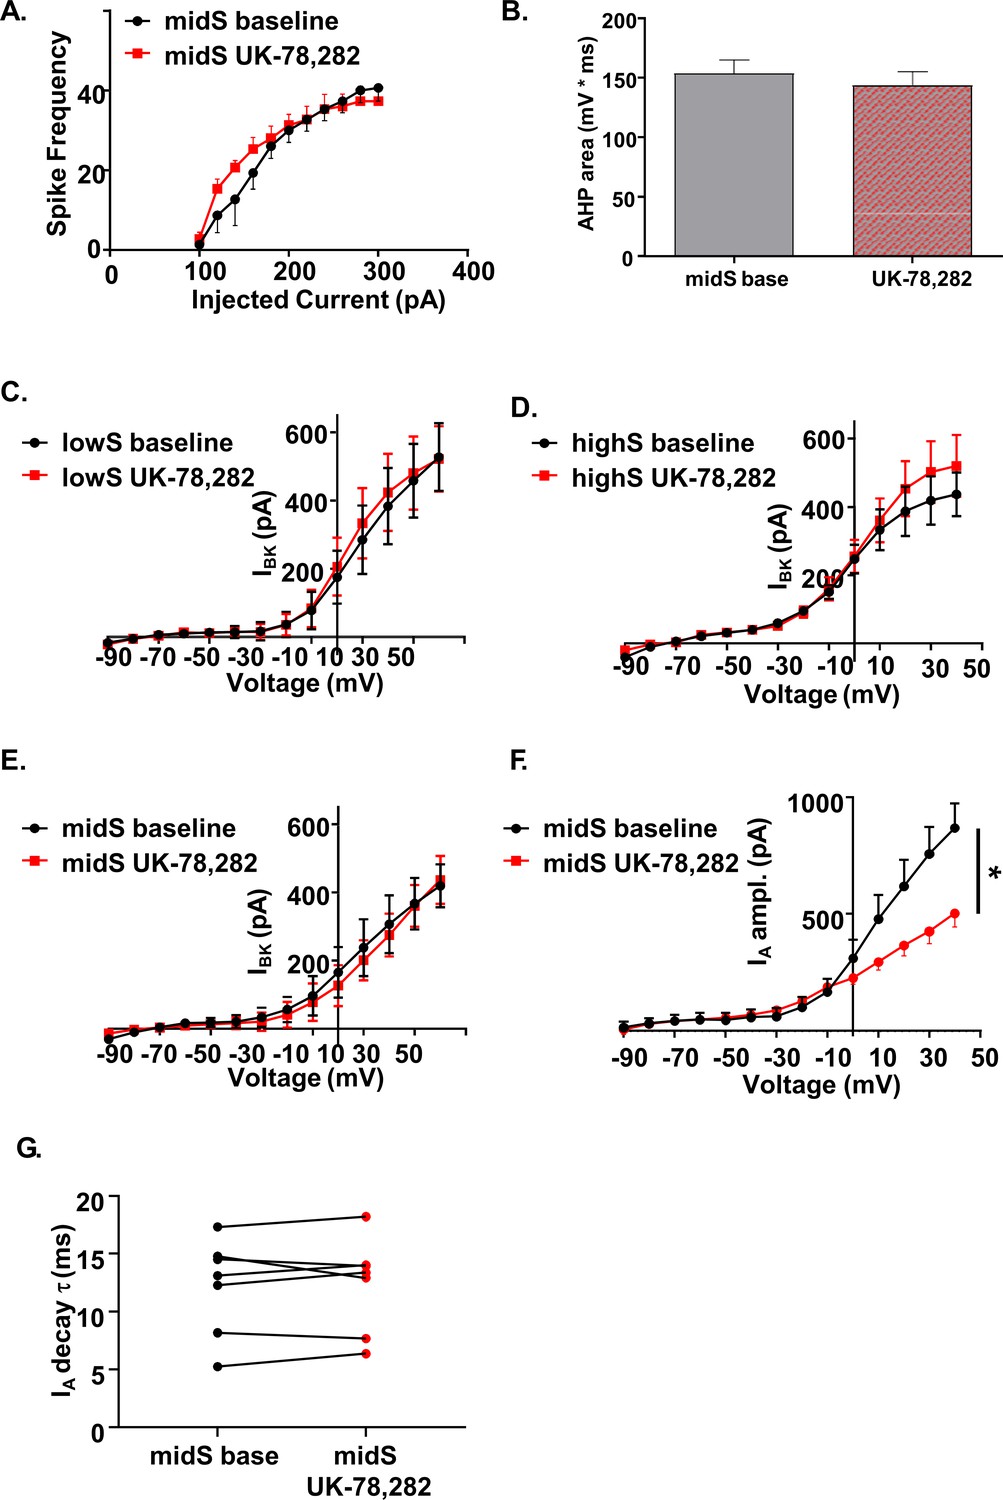
UK-78,282 effects on spike output, AHP, and potassium channel currents.
(A) UK-78,282 (100nM) application had no significant effect on action potential output or (B) afterhyperpolarization area in midS animals (n = 8, N = 4). (C) UK-78,282 (100 nM) had no significant effect on BK current amplitude in lowS, (D) highS, or (E) midS rats (n = 6, N = 4 per group). (F) UK-78,282 (100 nM) application reduced IA current amplitude in midS animals (Main drug effect: F(1,6)=6.39, *p=0.045, two-way RM ANOVA; n = 7, N = 4). (G) UK-78,282 (100 nM) application had no effect on IA decay time in midS animals.
Figure 6 with 1 supplement
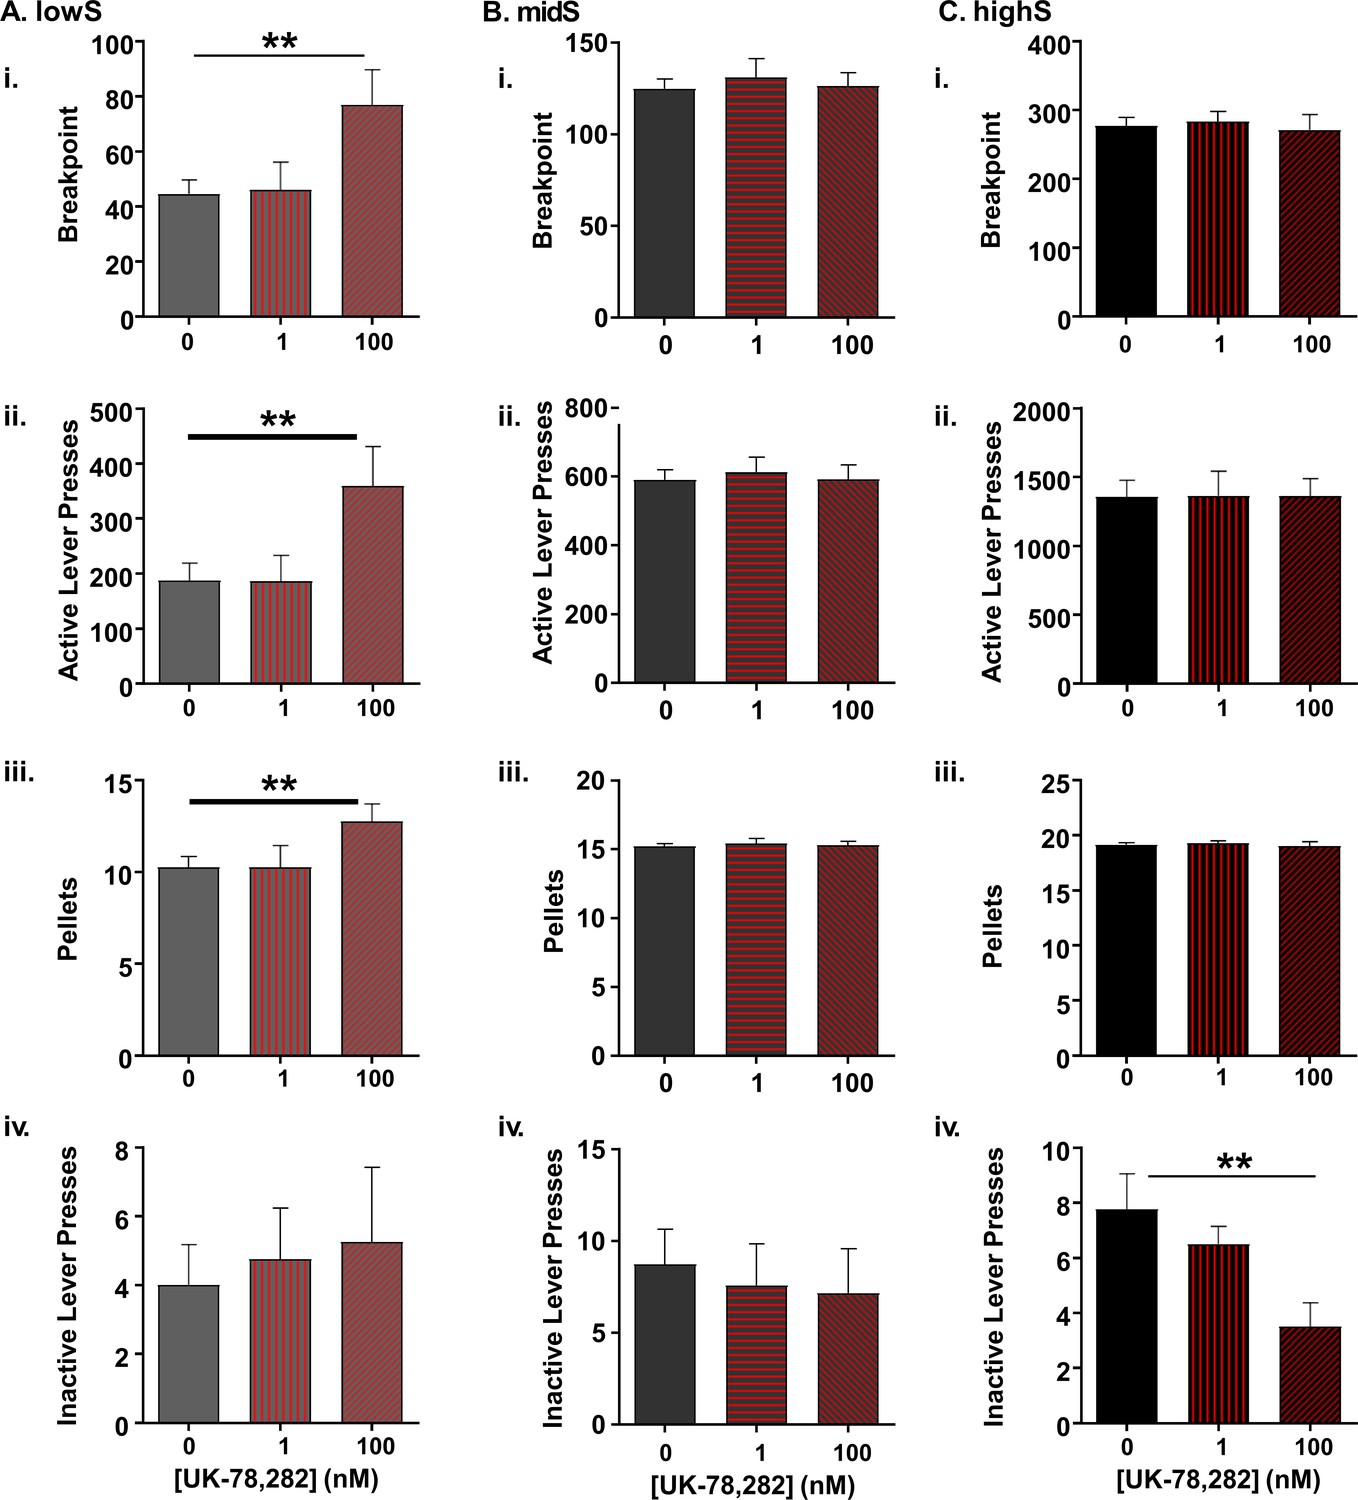
Selective effect of Kv1.4 antagonism on PR performance in lowS animals.
(A) In lowS animals (N = 6), microinjection of UK-78,282 into the NAc shell dose-dependently increased: i) breakpoints, ii) active lever presses and iii) pellets earned, but not iv) inactive lever presses. (B) In midS animals (N = 7) neither 1 nM nor 100 nM concentration of UK-78,282 had an effect on i) breakpoints, ii) active lever presses, iii) pellets earned or iv) inactive lever presses following 100 nM UK-78,282 microinjection. (C) In highS animals (N = 6) neither 1 nM nor 100 nM concentration of UK-78,282 had an effect on i) breakpoints, ii) active lever presses, or iii) pellets earned. There was a significant reduction in iv) inactive lever presses following 100 nM UK-78,282 microinjection. **, p<0.01, one-way ANOVAs.
Figure 6—figure supplement 1
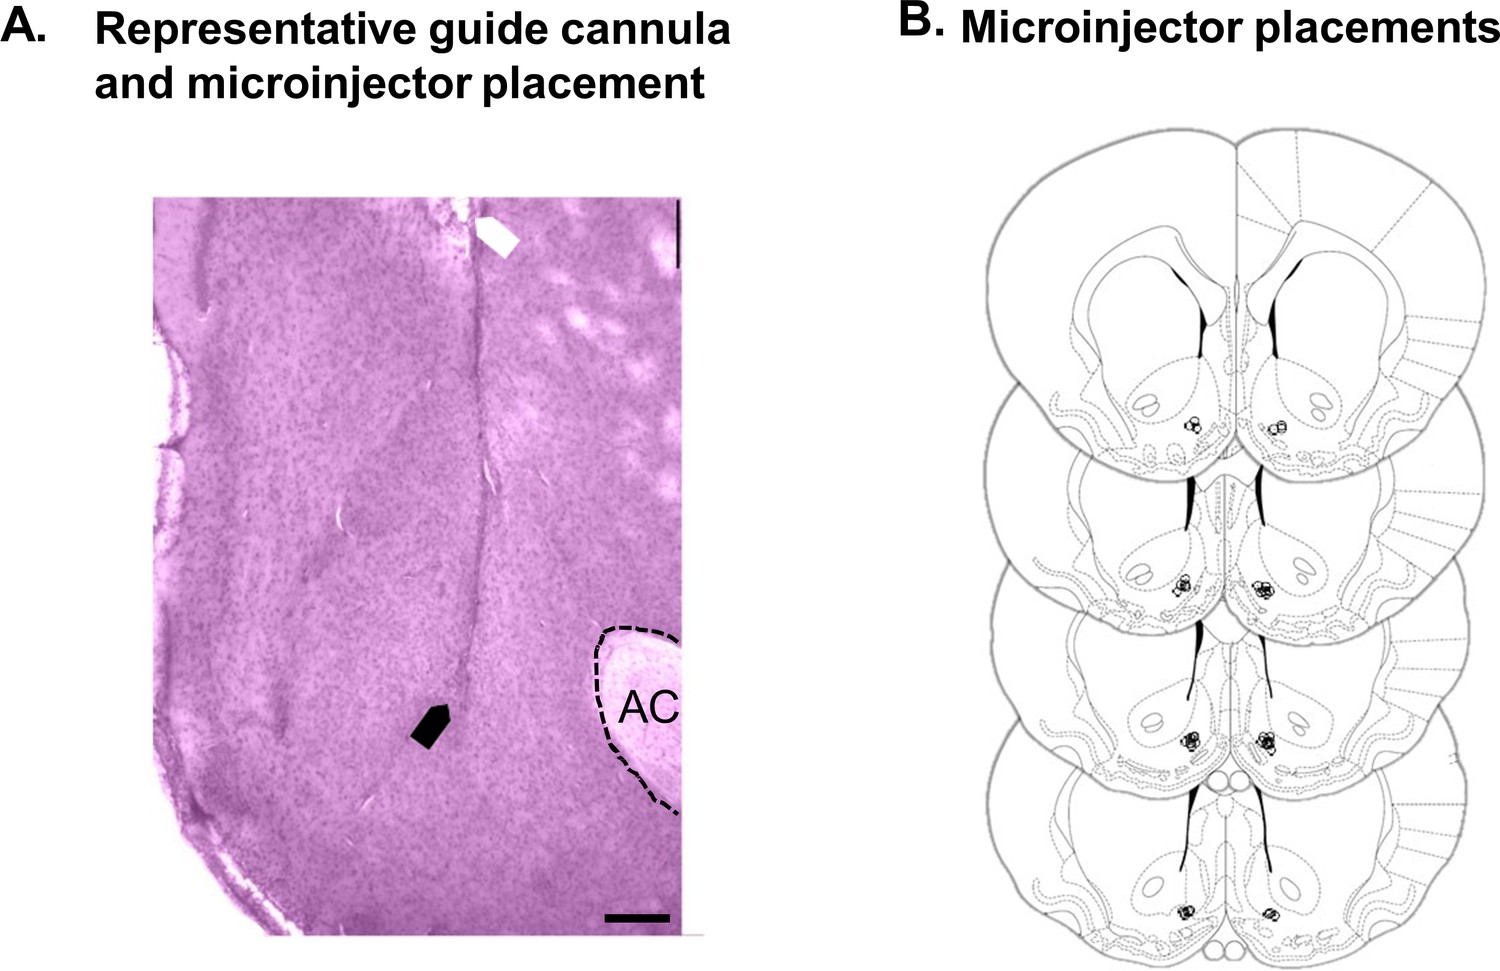
Histological verification of placements for UK-78,282 microinjection experiments.
(A) Photomicrograph of cresyl violet-stained coronal section (150 µM thick) showing a representative placement of the tip of the guide cannula (white arrow) and microinjector (black arrow) in the NAc shell (AC, anterior commissure, scale bar = 250 µm). (B) Diagram of coronal sections showing microinjector placements in NAc shell in 19 rats (lowS N = 6, midS N = 7, highS N = 6) used for UK-78,282 behavioral experiments. Section diagrams are from ‘The Rat Brain in Stereotaxic Coordinates, 7th Edition’ by Paxinos and Watson.
Additional files
-
Transparent reporting form
- https://doi.org/10.7554/eLife.47870.015
Download links
A two-part list of links to download the article, or parts of the article, in various formats.
Downloads (link to download the article as PDF)
Open citations (links to open the citations from this article in various online reference manager services)
Cite this article (links to download the citations from this article in formats compatible with various reference manager tools)
Altered gating of Kv1.4 in the nucleus accumbens suppresses motivation for reward
eLife 8:e47870.
https://doi.org/10.7554/eLife.47870


