Single-cell transcriptomic evidence for dense intracortical neuropeptide networks
- Allen Institute for Brain Science, United States
- Neuroscience Paris Seine, Sorbonne Université, France
Figures
Figure 1
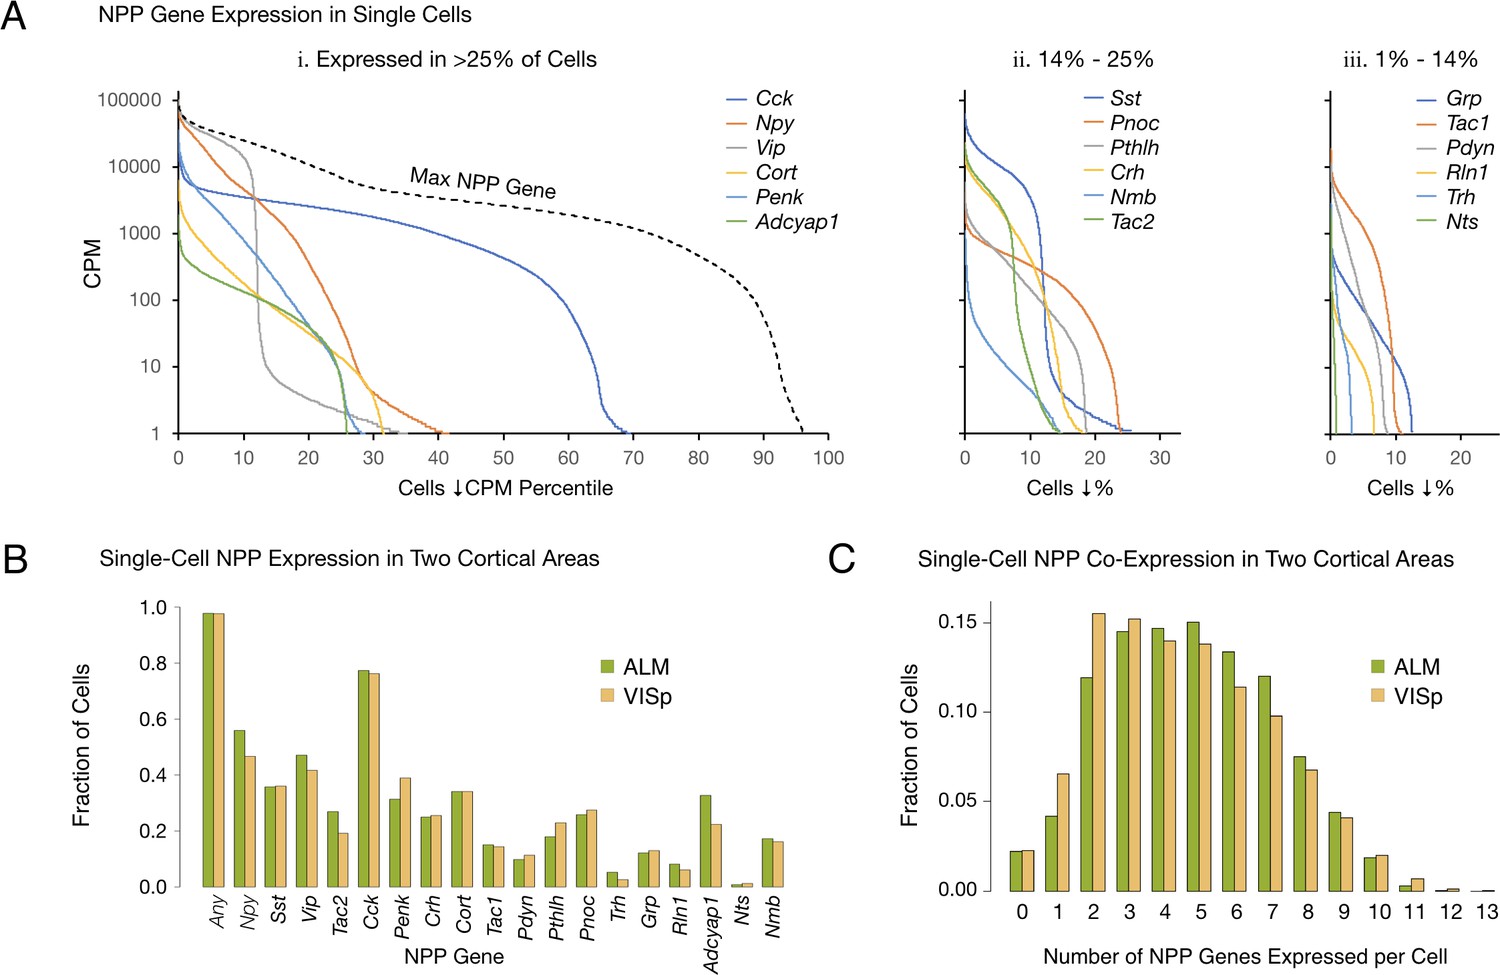
Single-cell NPP gene expression and co-expression statistics for distant neocortical areas VISp and ALM show that expression patterns for 18 NPP genes are highly differential within both neocortical areas but highly conserved between areas.
(A) Different NPP genes show very different expression level distributions across the 22,439 VISp+ALM neurons sampled. Color-coded solid curves plot single-cell CPM values for the specified individual NPP genes in descending order along a cell population percentile axis. The 18 curves are segregated for clarity into three panels (I, ii, iii) sorted by cell population percentiles at which CPM values fall below 1. Large differences in fractions of cells expressing different NPP genes are evident. The dashed curve labeled ‘Max NPP Gene’ in panel A.i was generated by plotting CPM values of for the most abundant NPP transcript in each individual cell in descending order. (B) Fractions of cells expressing each NPP genes represented separately for 13,491 VISp neurons and 8,948 ALM neurons, showing conservation between areas of the patterning of NPP expression fractions detailed in panel A. (C) Histograms illustrating frequencies of various multiples of NPP genes co-expressed in individual neurons, represented separately for VISp and ALM neurons. The paired vertical bars show strong conservation of co-expression patterns between the two areas.
-
Figure 1—source data 1
Sorted NPP CPM distributions for all neurons.
- https://cdn.elifesciences.org/articles/47889/elife-47889-fig1-data1-v2.csv
-
Figure 1—source data 2
Single-cell NPP CPM expression table.
- https://cdn.elifesciences.org/articles/47889/elife-47889-fig1-data2-v2.csv
Figure 2 with 1 supplement
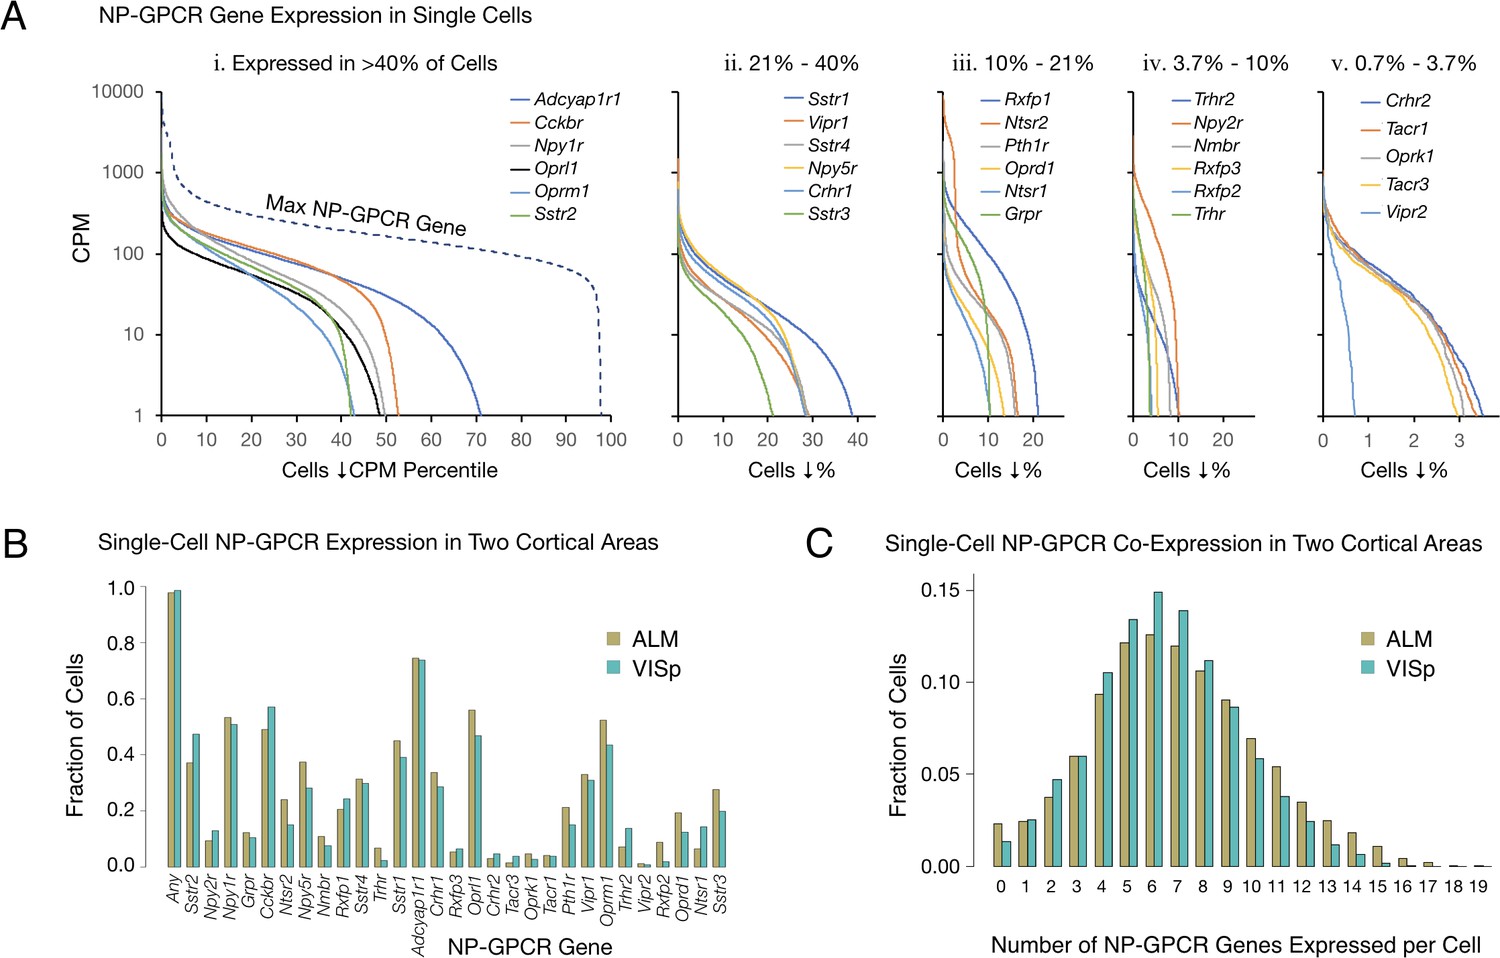
Single-cell NP-GPCR gene expression and co-expression statistics for distant neocortical areas VISp and ALM show that expression patterns for 29 NP-GPCR genes are highly differential within neocortical areas but conserved between areas.
(A) Different NP-GPCR genes show very different expression level distributions across the 22,439 VISp+ALM neurons sampled. Color-coded solid curves plot single-cell CPM values for the specified individual NP-GPCR genes in descending order along a cell population percentile axis. The 29 curves are segregated for clarity into five panels (i-v) sorted by cell population percentiles at which CPM values fall below 1. Large differences in fractions of cells expressing different NP-GPCR genes are evident. Dashed curve labeled ‘max NP-GPCR Gene’ in panel A. i was generated by plotting CPM values of the highest CPM NP-GPCR gene for each individual cell in descending order. (B) Fractions of cells expressing each NP-GPCR genes represented separately for 13,491 VISp neurons and 8,948 ALM neurons, showing strong conservation between areas of the patterning of NP-GPCR expression fractions documented in panel A. (C) Histograms illustrating frequencies of various multiples of NP-GPCR gene co-expression in individual neurons, represented separately for VISp and ALM neurons. The paired vertical bars illustrate strong conservation of co-expression patterns between the two cortical areas.
-
Figure 2—source data 1
Sorted NP-GPCR CPM distributions for all neurons.
- https://cdn.elifesciences.org/articles/47889/elife-47889-fig2-data1-v2.csv
-
Figure 2—source data 2
Single-cell NP-GPCR CPM expression table.
- https://cdn.elifesciences.org/articles/47889/elife-47889-fig2-data2-v2.csv
Figure 2—figure supplement 1
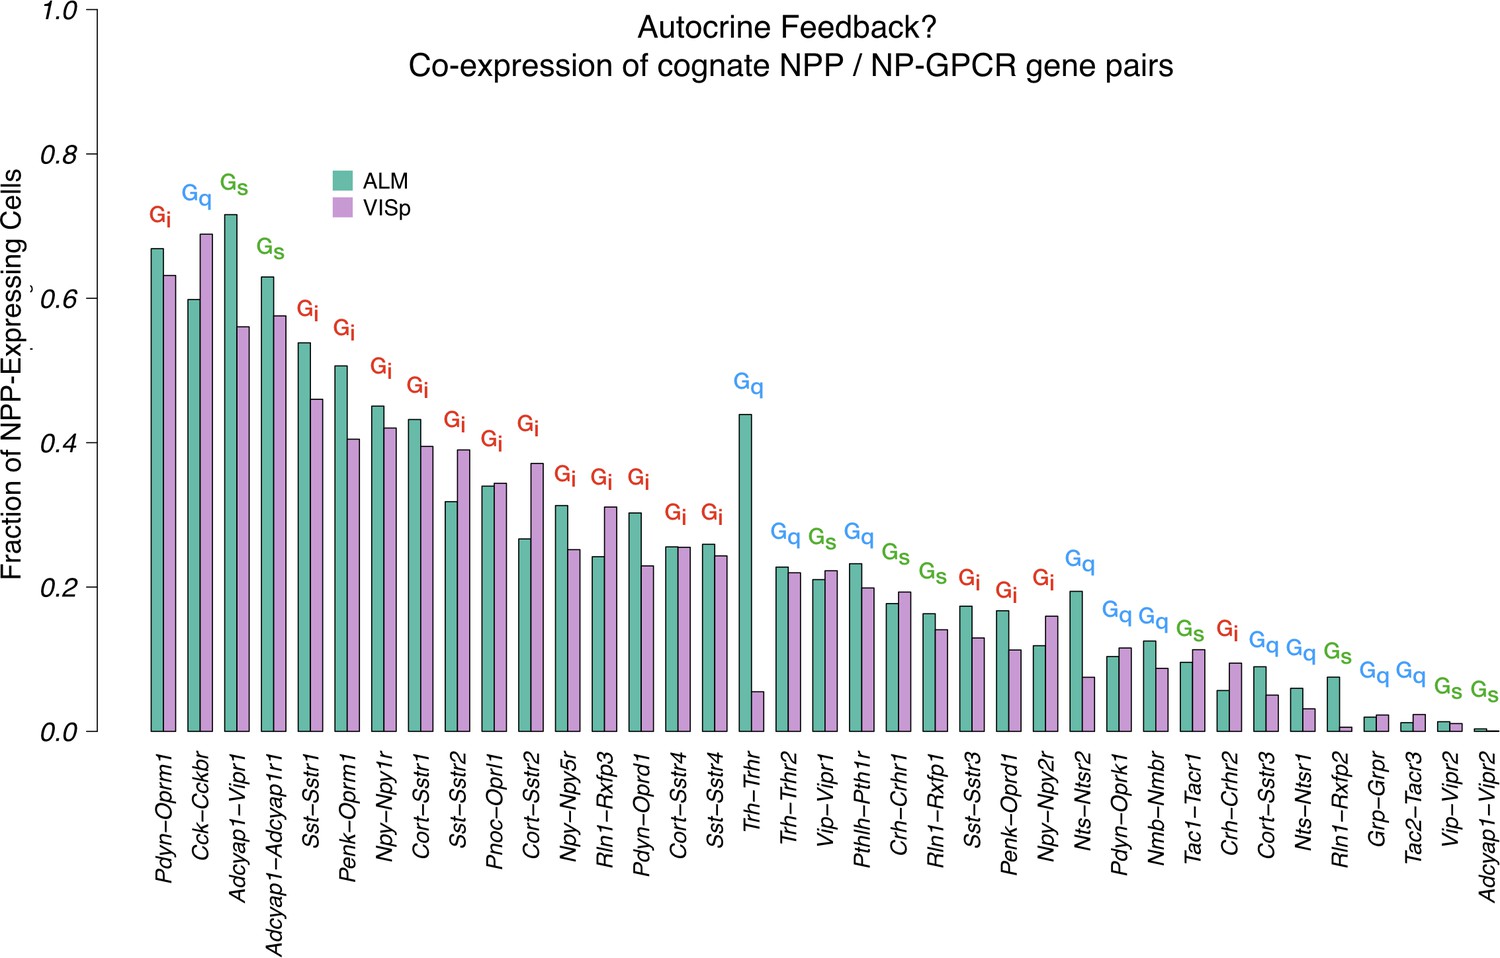
Co-expression of cognate NPP/NP-GPCR pairs.
A large fraction of cortical neurons co-express cognate NPP/NP-GPCR pairs, and conservation of these fractions between cortical areas VISp and ALM argues in favor of some important underlying biology and possible relevance to function. Annotations of primary Gα family on this graph also hint that both positive and negative feedback mechanisms might be considered. These predictions of autocrine feedback, particularly the functionally negative feedback likely associated with Gi signaling, suggest the intriguing possibility that peptide signaling might underlie some forms of cell-autonomous neuronal homeostasis.
Figure 3 with 3 supplements
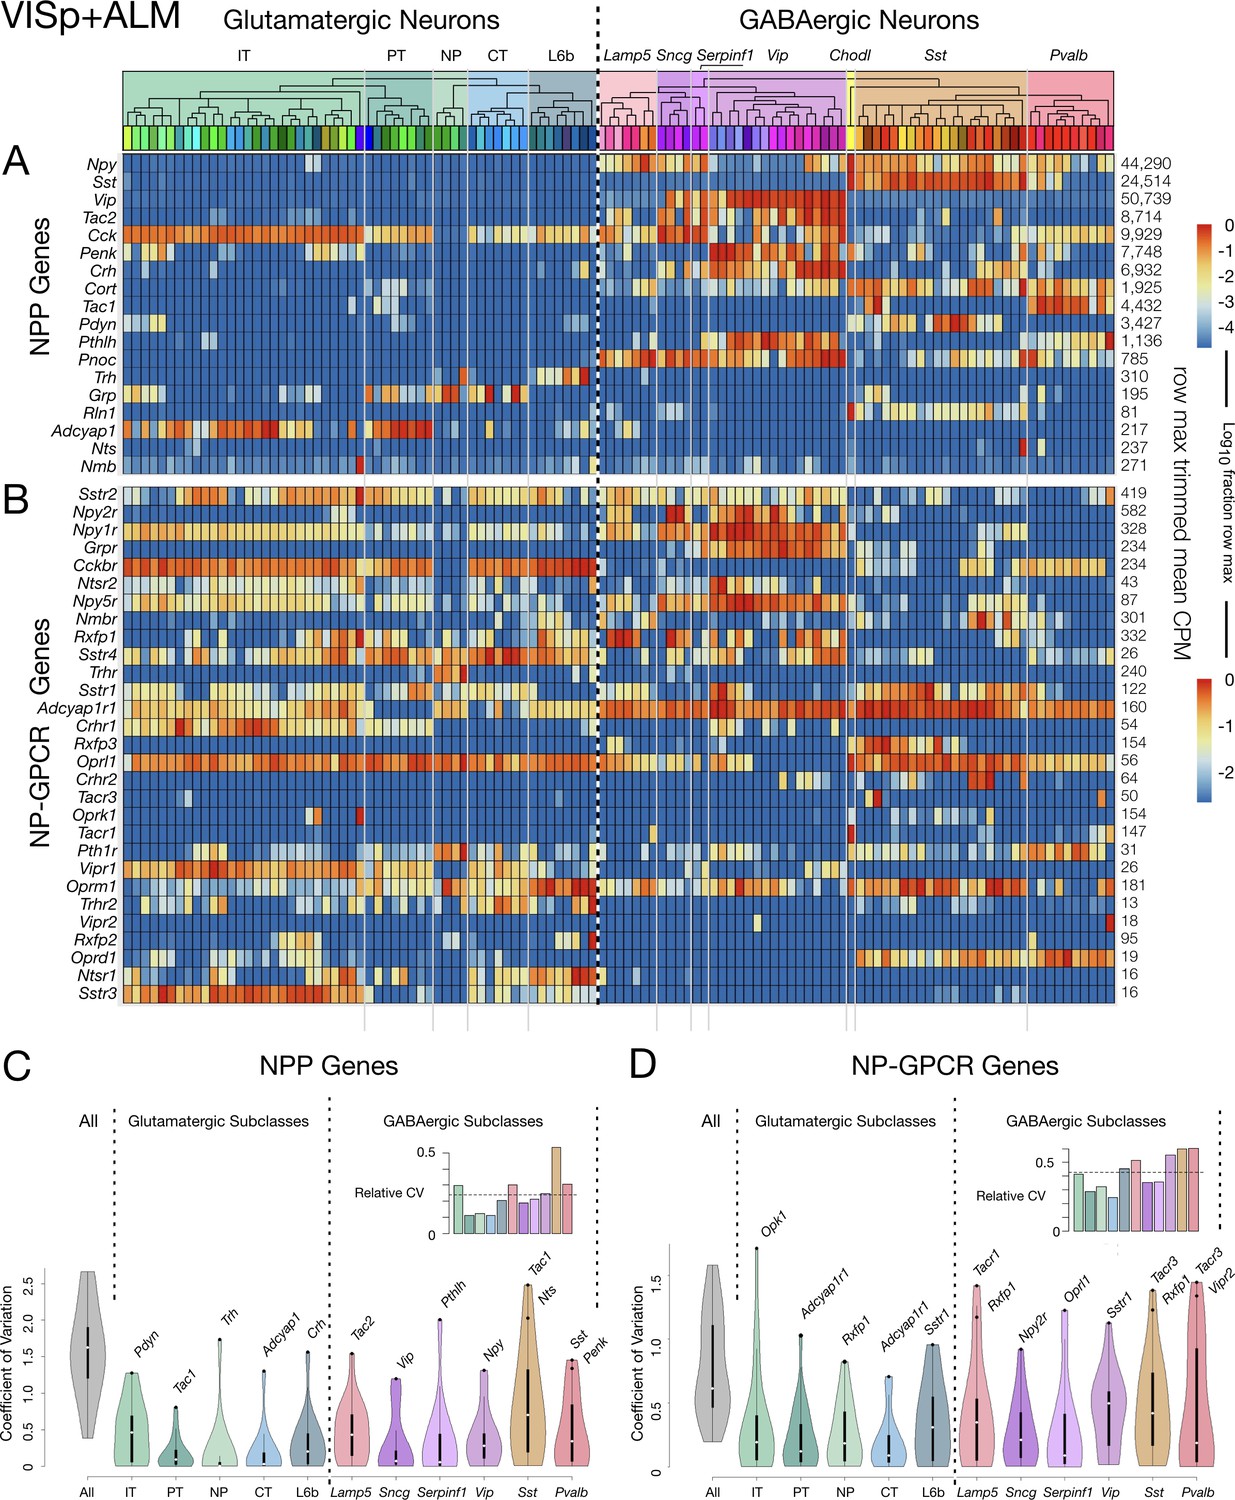
Neurotaxonomic heatmaps reveal highly neuron-type-specific expression of (A) 18 NPP and (B) 29 NP-GPCR genes in 22,439 individual neurons harvested from areas VISp and ALM.
Trimmed-mean (5% trim) CPM expression values for each of the 115 VISp+ALM glutamatergic and GABAergic neuron types (see Figure 3—figure supplement 1) are normalized per gene to maximum value indicated at right for each row and pseudocolored according to log10 scales at right. Note that these scales represent 5 (NPP) and 3 (NP-GPCR) orders of magnitude and that each gene spans the entire pseudocolor range across neuron types. Subclasses are called out here by labels (IT, PT, NP, CT, L6b for glutamatergic types; Lamp5, Sncg, Serpinf1, Vip, Chodl, Sst, Pvalb for GABAergic types) and demarcated on the heatmaps by thin gray lines. Gene rows are ordered here as in Tables 1 and 2. (C) Violin plots representing coefficients of CPM variation (CV) for 18 NPP genes across types pooled within each of the 11 subclasses indicated (Chodl not represented here as it is a singular neuron type) and globally across all cell types (‘All’). Callouts on each violin indicate genes of highest CVs within each subclass. Inset shows within-subclass CV/global CV demonstrating variation within subclasses is a significant fraction of global variability (dotted line mean = 0.239). See Figure 3—figure supplement 2 for individual gene statistics. (D) Similar for 29 NP-GPCR genes showing greater relative variability, mean CV = 0.427. See Figure 3—figure supplement 3 for individual gene statistics.
-
Figure 3—source data 1
Cell types, cluster ids and color codes for ALM and VISp regions.
- https://cdn.elifesciences.org/articles/47889/elife-47889-fig3-data1-v2.csv
Figure 3—figure supplement 1

Tasic 2018 neurotaxonomy.
Tasic and co-workers (Tasic et al., 2018, Nature 563:72–78) generated the hierarchical taxonomy of glutamatergic and GABAergic neurons represented here by dimensionality reduction and iterative hierarchical clustering of data from single-cell RNA-Seq analysis of 22,439 mouse cortical neurons dissociated from areas VISp (13,491 neurons) and ALM (8948 neurons). This neurotaxonomy is rendered here in four different forms as used in Figures 3–7 to specify Tasic 2018 neuronal cell ‘types’ and/or ‘subclasses’ as indicated by column headings. Each rendering represents a Tasic 2018 cladogram, five glutamatergic subclasses, 6 GABAergic subclasses (since Chodl is a singular type, it is not counted as a subclass) and some number of neuron types. The rectangle fill colors and orderings here are used consistently in Figures 3–7 to denote neuronal subclasses and types: the deep color fills for the small type rectangles are as introduced by the Tasic 2018 publication; the pastel color fills for the larger subclass rectangles are derived by averaging and fading the deeper color fills of the types within each subclass. The Tasic 2018 type numbers, names (panel A only) and counts of cells clustered to each type are tabulated here. (A) 11 subclasses and 115 types clustered from single-cell RNA-seq transcriptomes from cells aggregated across VISp and ALM areas. (B) 11 subclasses and 93 types found in VISp neurons. (C) 11 subclasses and 84 types found in ALM neurons. Because most GABAergic types (58 out of 60) are shared between VISp and ALM, spacers (black-filled rectangles) are placed in this rendering between types 87 and 89 and types 111 and 113 to maintain linear registration of GABAergic types between VISp and ALM types in spite of absence of types 88 and 112 in ALM. (D) 11 subclasses and 84 types found in ALM neurons (without registration-preserving spacers).
Figure 3—figure supplement 2
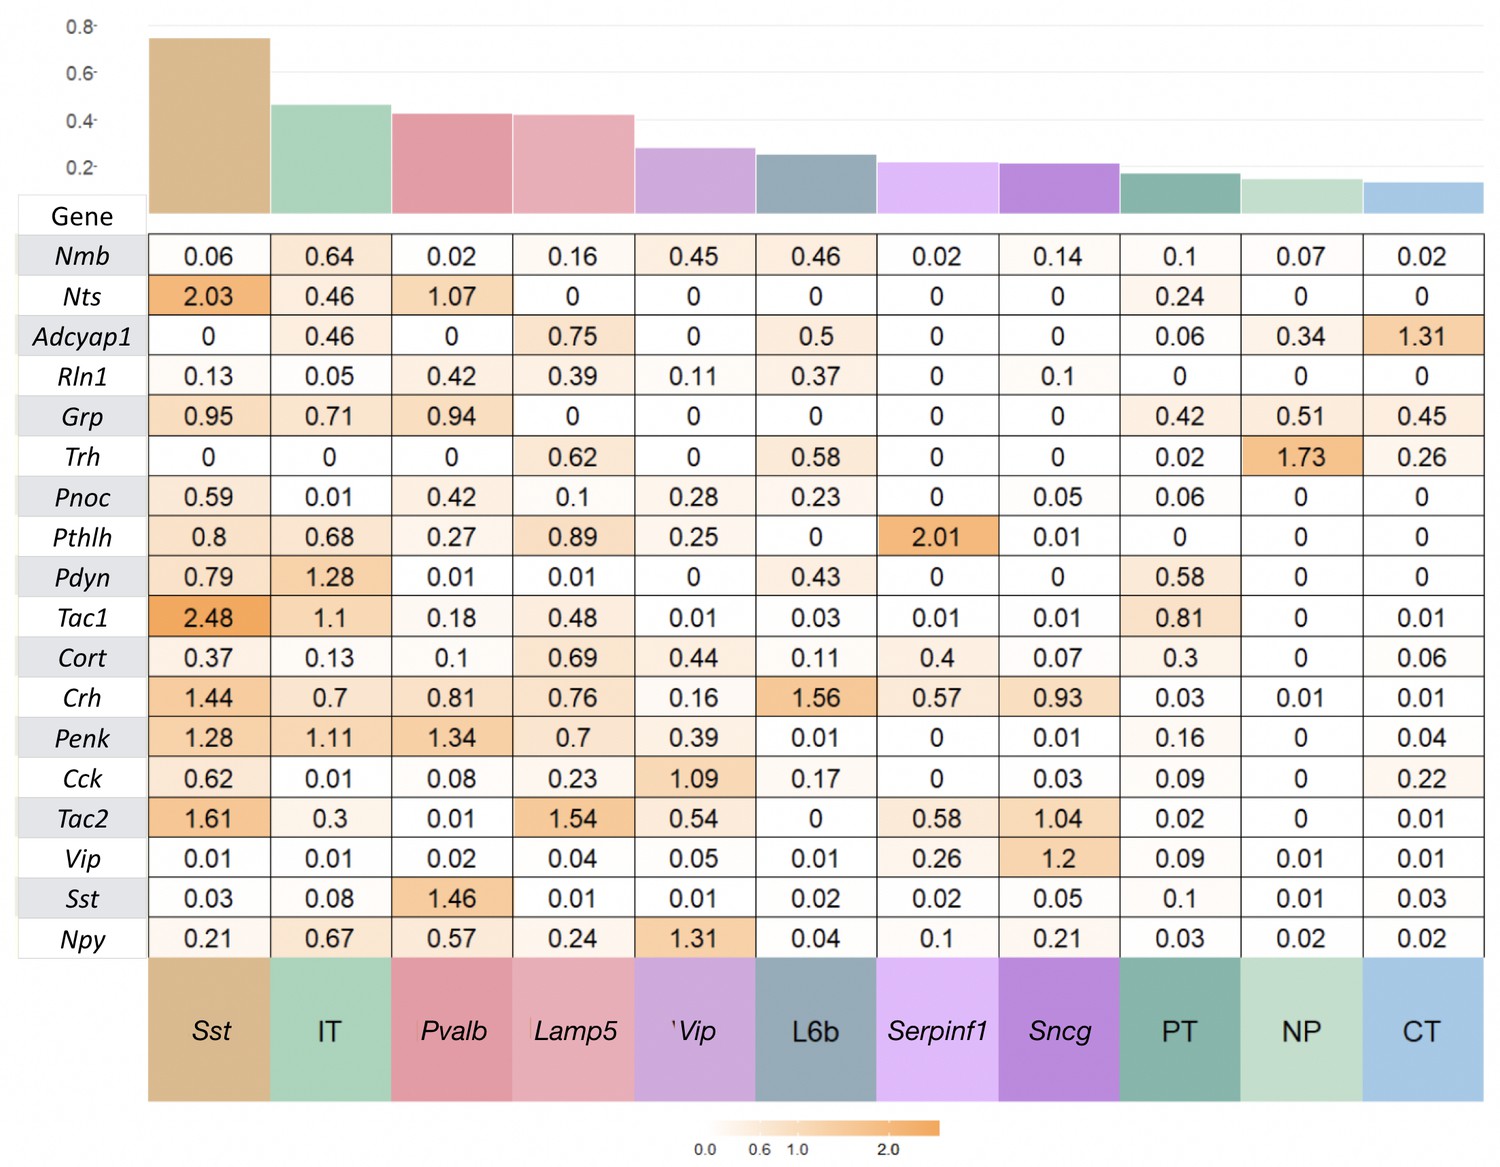
NPP expression variation within subclasses.
Coefficient of variation (c.v. = standard deviation/mean) of expression for each NPP gene for Tasic et al., 2018 cell types pooled to 12 major types, glutamatergic types (IT, PT, NP, CT, L6b) and GABAergic types (Lamp5, Sncg, Serpinf1, Vip, Chodl, Sst, Pvalb). Chodl does not appear in the figure here or in main text as there is only one Tasic cell type in this class. The type types are sorted from left to right in decreasing average c.v. The variability is a substantial fraction of the global variation across all types indicating complex combinatorial expression patterns at the level of the Tasic et al ontology and the need to consider this level of resolution. Outlier genes are colored more orange and examples labelled in Figure 3 of the main manuscript. Mean c.v is shown in the barplot on top.
Figure 3—figure supplement 3
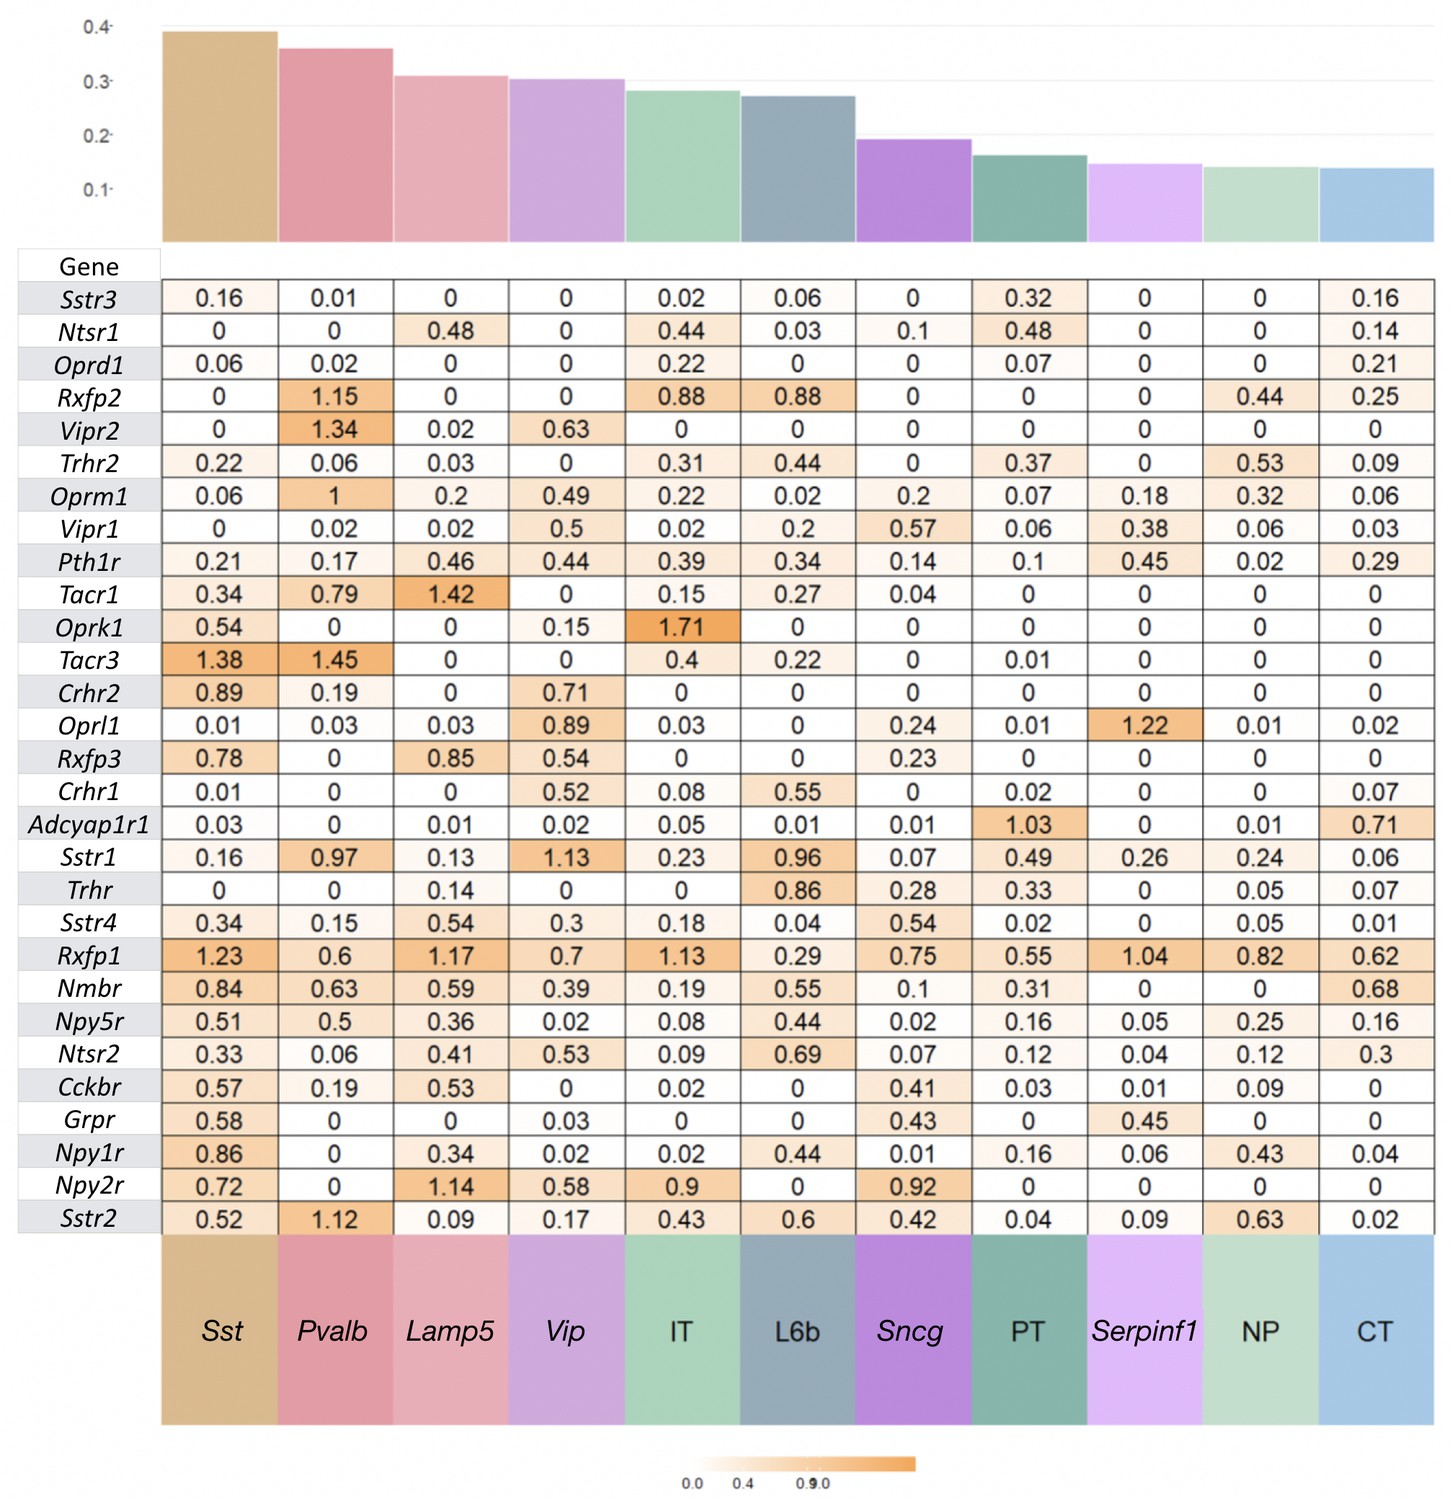
NP-GPCR expression variation within subclasses.
Coefficient of variation (c.v. = standard deviation/mean) of expression for each NP-GPCR gene for Tasic et al., 2018 cell types pooled to 12 major types, glutamatergic types (IT, PT, NP, CT, L6b) and GABAergic types (Lamp5, Sncg, Serpinf1, Vip, Chodl, Sst, Pvalb). Mean c.v is a higher percentage of total c.v. for NP-GPCR compared to NPP genes.
Figure 4 with 2 supplements
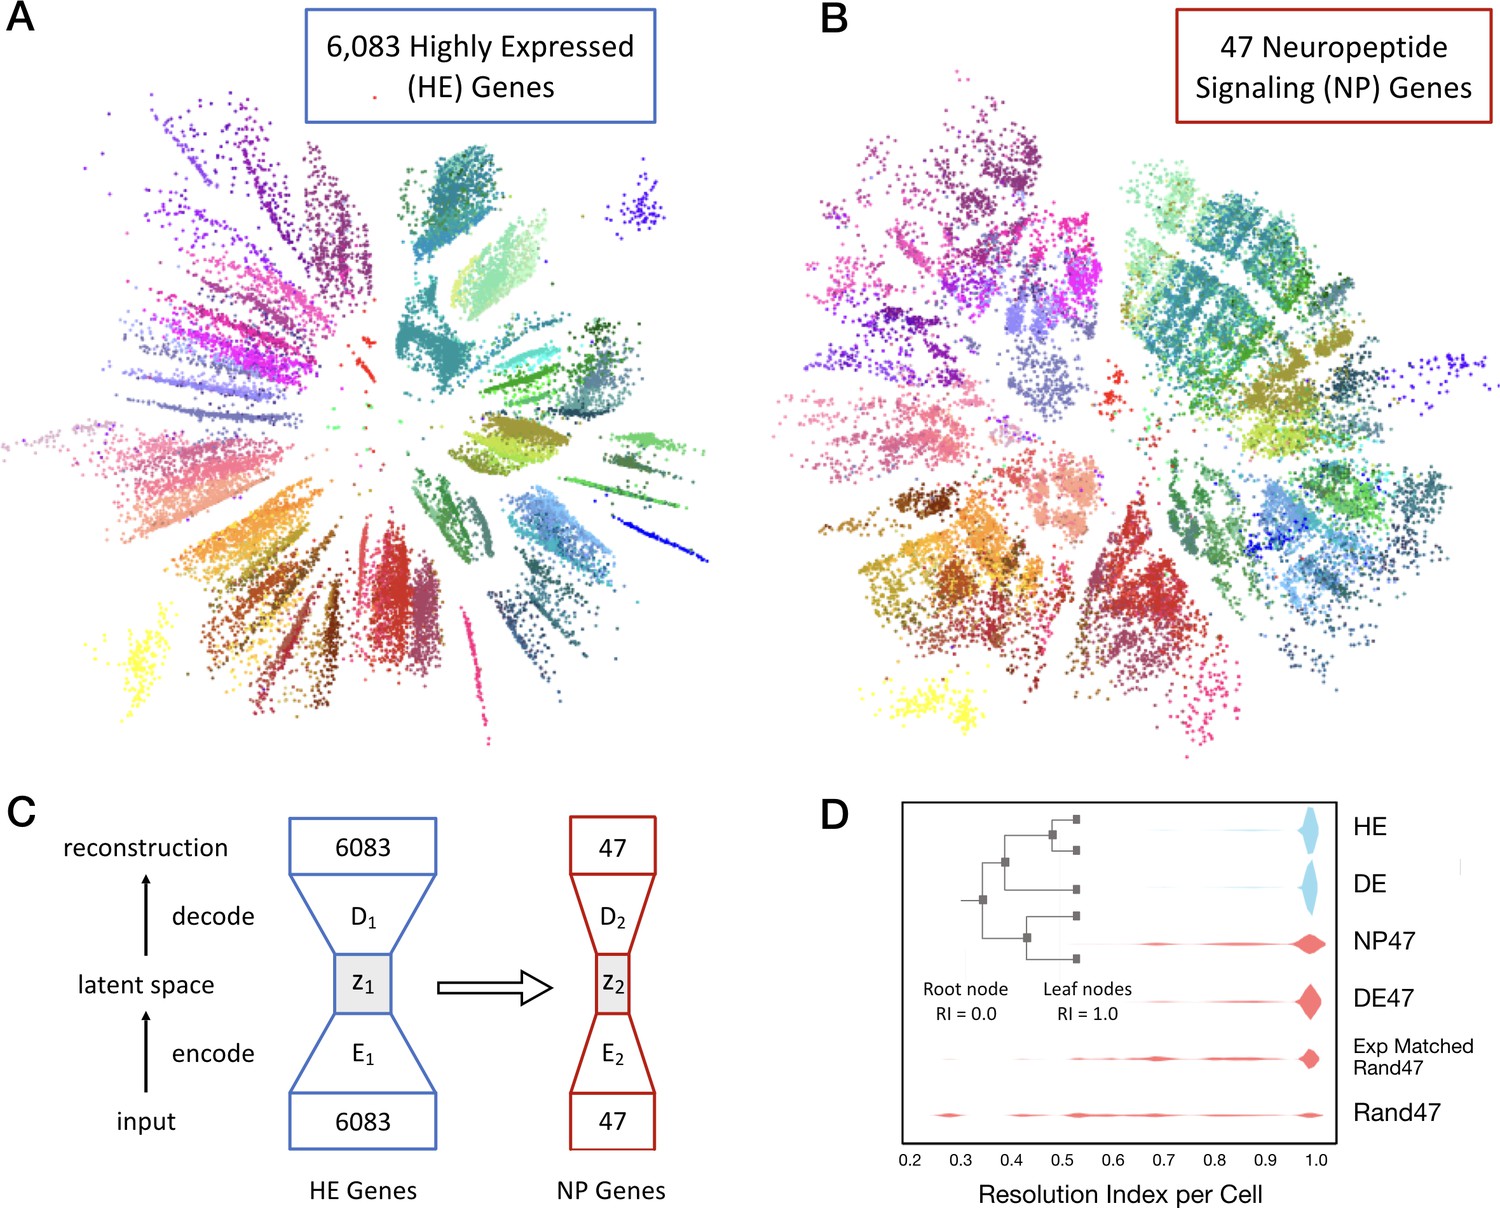
Neurons can be clustered effectively based on just 47 NP genes (18 NPP and 29 NP-GPCR).
(A) A two-dimensional latent space representation of 22,439 cells based on 6083 highly expressed (HE) genes obtained by an autoencoding neural network. Dots represent individual cells, colored according to the type-code assignments of Tasic et al. (2018) (see Figure 3—figure supplement 1). Cells of the same type appear as grouped into distinct islands, which suggests that classifiers trained to identify cell types would perform well with such low dimensional representations of gene expression. (B) Two-dimensional representation of neurons in such a latent space z2, based on the 47 NP genes. (C) Schematic of the network architecture used to train the second autoencoder that learns to represent neurons in a latent space z2 that is similar to z1. This second autoencoder represents cells in the latent space based on much smaller gene sets. (D) Inset illustrates resolution index (RI) associated with nodes on the hierarchical tree used in the per-cell RI calculation. RI distribution (see Materials and methods) for NP genes-based cell type classification shows that a vast majority of the cells can be correctly classified up to the type level (leaf nodes, RI = 1.0) of the Tasic 2018 hierarchy. Errors in classification (RI <1.0) at the type level are nevertheless resolved at the class level of the hierarchy, as indicated by the high values for RI for the remaining cells. High average RI for HE genes, and 4020 differentially expressed (DE) genes, and 47 DE genes indicates that the cell type classification procedure based on autoencoder representations is accurate. The average RI for cell type classification based on the 47 NP genes is significantly higher (p<0.01, bootstrap) than both, subsets of 47 genes selected randomly (Rand47, n = 100 subsets), and selected randomly but with expression levels matched to the NP genes (Rand47 ExpMatch, n = 100 subsets).
Figure 4—figure supplement 1
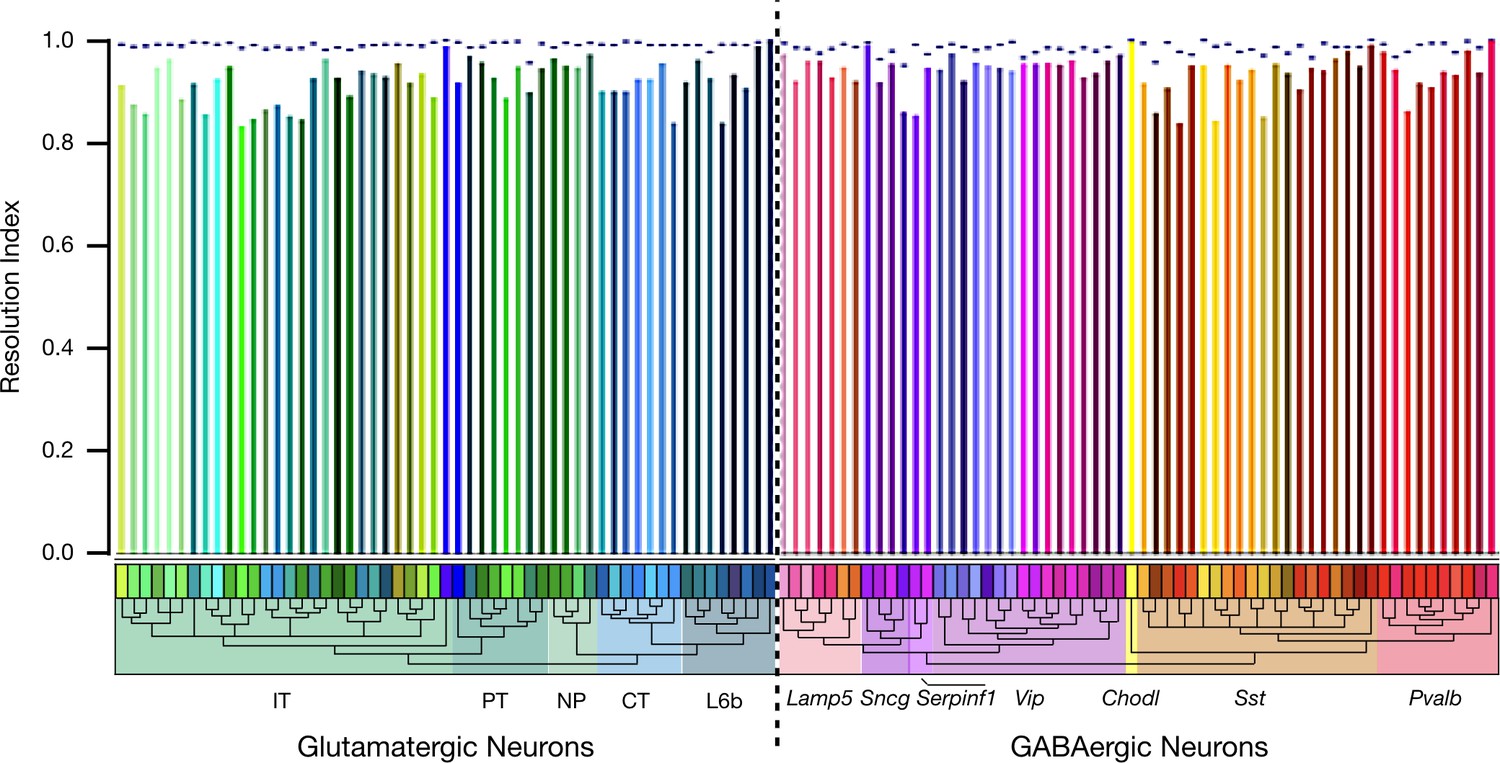
Autoencoder expression clustering performance by neuron type.
Results here compare classification based on 6,083 HE genes (dashed line) with results based on 47 NP genes (colored vertical bars). The resolution index (RI), as described in connection with Figure 4, generates a measure of autoencoder clustering agreement with the Tasic 2018 neurotaxonomy. Figure 4D represents resolution index distributions across all glutamatergic and GABAergic neurons represented in the Tasic 2018 dataset. This population is weighted, however, by the Tasic 2018 sampling process and does not represent the actual distribution of neuron types in cortex. As a check for possible anomalies related to this sampling process, we averaged resolution indices separately for each Tasic 2018 neuron type, as shown here. The single-type average resolution indices for both HE and NP gene sets are high across all types (>0.95 for HE and >0.8 for NP), confirming the adequacy of both gene sets in identifying all of the Tasic 2018 neuron types. Interestingly, this metric suggests that clustering performance using the 6,083 HE gene set is slightly worse for GABAergic than for glutamatergic types, while the reverse is true for the 47 NP gene set. Both effects are, however, quite small.
Figure 4—figure supplement 2
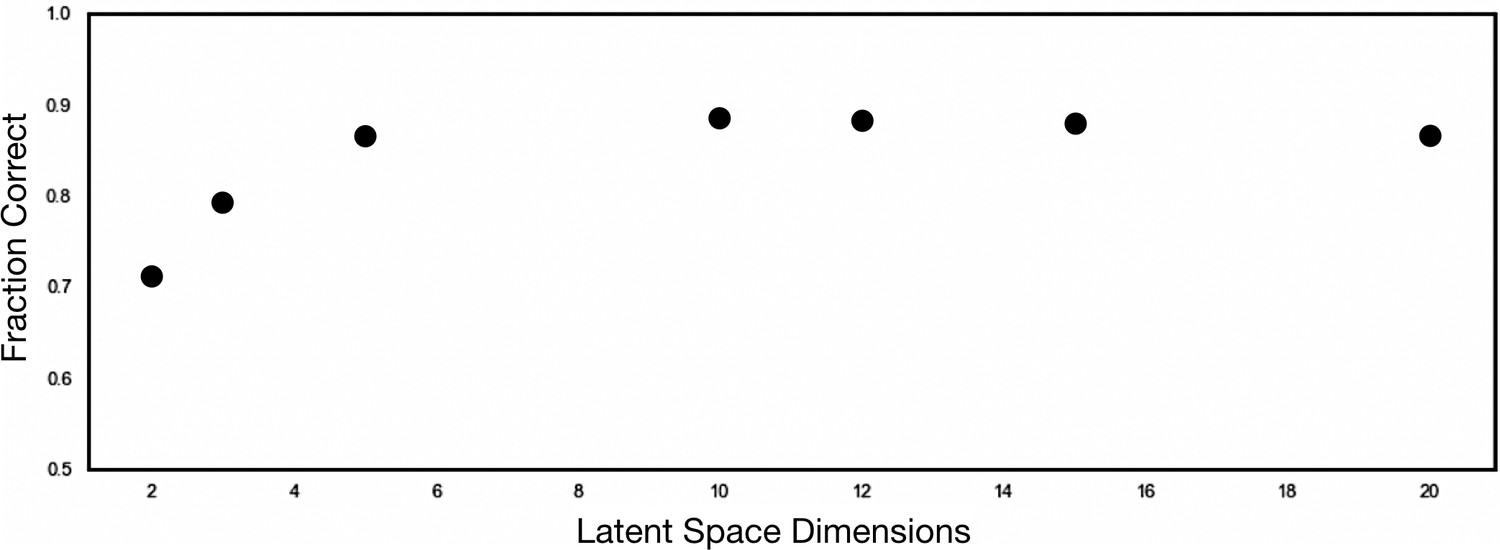
1```Determination of optimal autoencoder latent space dimensionality.
To determine the latent space dimensionality for optimal HE gene representation, we performed hyperparameter tuning by varying the latent space dimensionality between 2 and 20 dimensions. The performance of each latent space was compared to the Tasic 2018 taxonomy using a supervised gaussian mixture model (GMM). An optimal dimensionality of 5 was chosen, which resulted in a peaking adjusted random index of 0.8672.
Figure 5

Neurotaxonomic heatmaps show strong conservation of NPP and NP-GPCR expression patterns between two distant neocortical areas.
(A) Expression heatmap for 18 NPP and 29 NP-GPCR genes in 13,491 single VISp neurons classified by type. (B) Similar heatmap for 8948 single neurons harvested from ALM. Heatmaps generated and displayed as described in Figure 3, except for segregation here of VISp and ALM harvest areas. Heat maps are aligned horizontally here to match GABAergic neuron types between VISp and ALM. Vertical dark gray bars in Figure 5B are spacers marking the two GABAergic cell types absent in ALM. Glutamatergic neurotaxonomies are seen to differ substantially, but differences appear mainly at the finest, ‘leaf’ levels of the neurotaxonomic hierarchy (see Tasic 2018) and Figure 3—figure supplement 1).
-
Figure 5—source data 1
Cell types, cluster ids and color codes for VISp region.
- https://cdn.elifesciences.org/articles/47889/elife-47889-fig5-data1-v2.csv
-
Figure 5—source data 2
Cell types, cluster ids and color codes for ALM region.
- https://cdn.elifesciences.org/articles/47889/elife-47889-fig5-data2-v2.csv
Figure 6 with 10 supplements
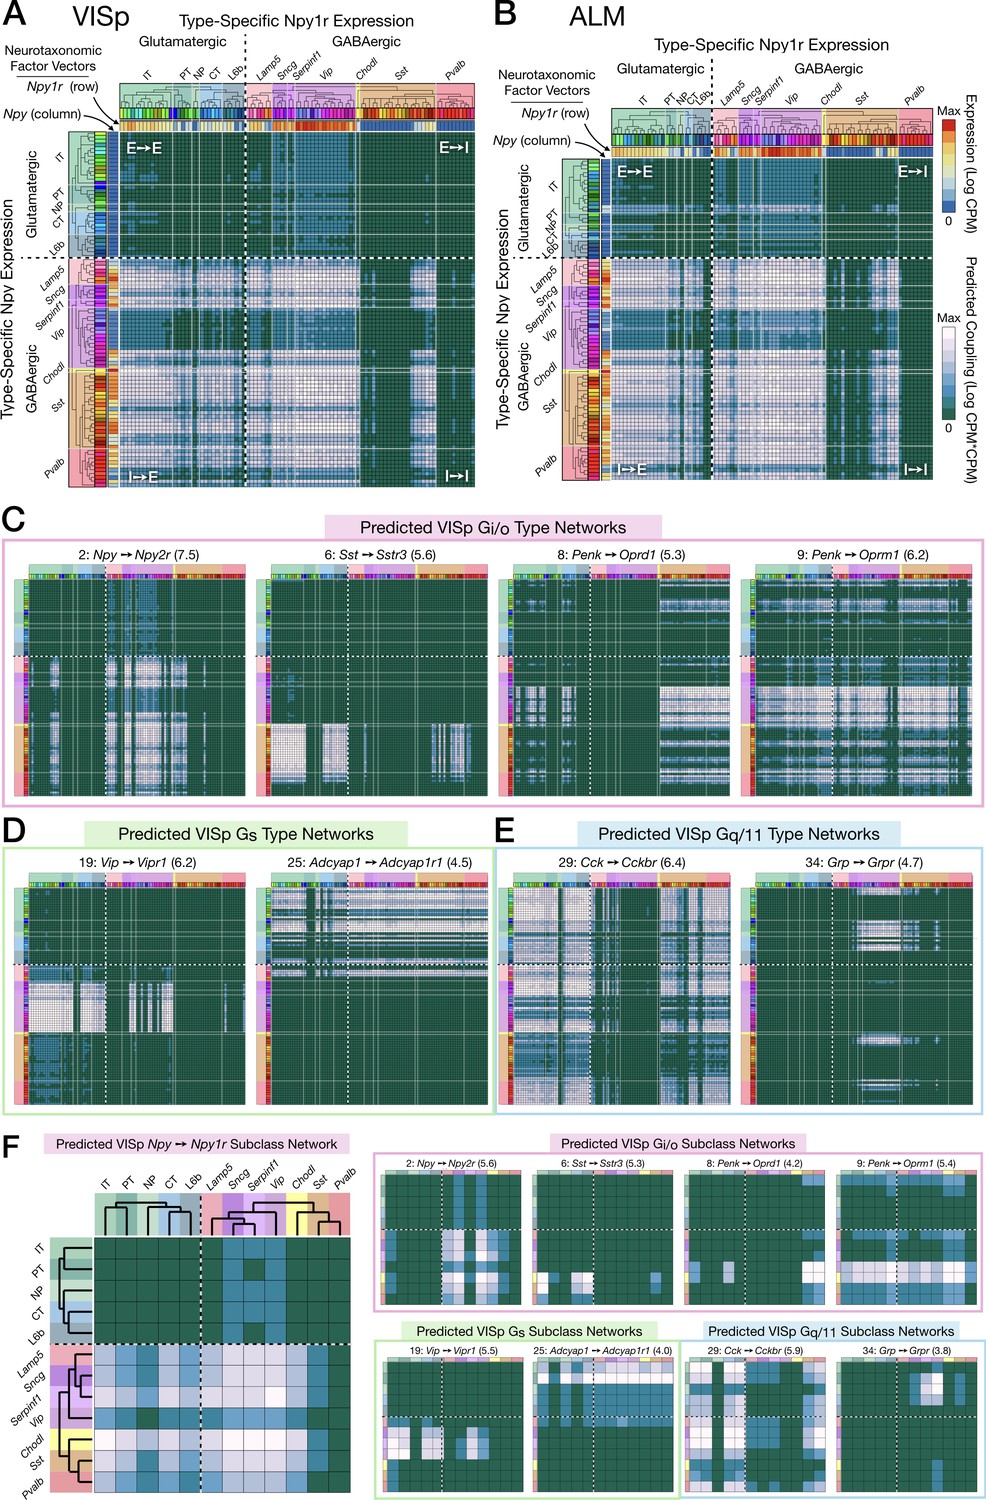
Neurotaxonomic expression profiles of 37 cognate NPP/NP-GPCR pairs predict 37 peptidergic networks.
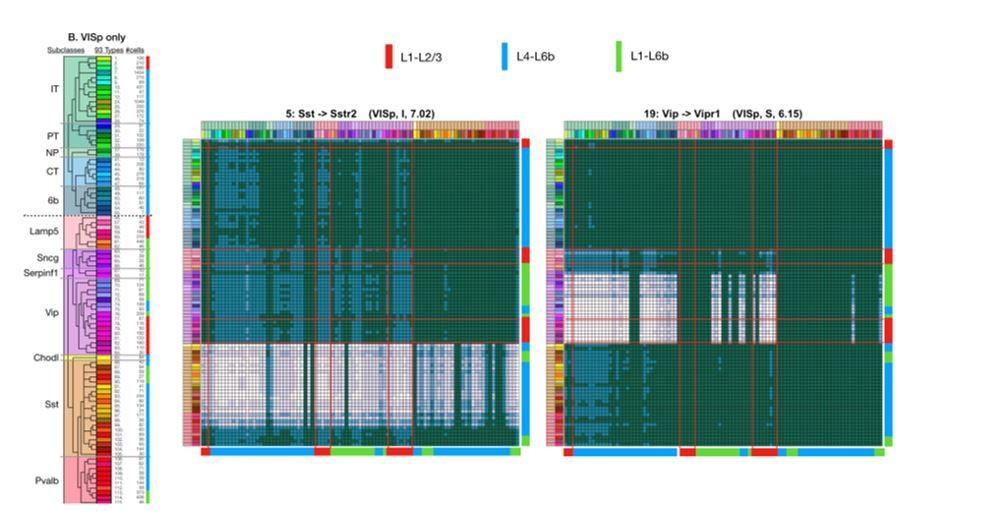
Weighted adjacency matrix plots predicting local peptidergic coupling amongst neuron types (A–E) and subclasses (F). Matrices were computed as outer products (CPM*CPM units) of row and column factor vectors representing abundance (CPM units) of NPP and cognate NP-GPCR genes. Pseudocolor scales representing both expression (CPM) and coupling (CPM*CPM) are logarithmic. (A) 93 × 93 matrix predicting coupling amongst 93 VISp neuron types based on type-specific expression of the Npy gene and the cognate Npy1r NP-GPCR gene, as indicated by row and column vector ‘heat’ strips called out by curved arrows. (B) An 84 × 84 square matrix similarly representing Npy-Npy1r coupling, depicted as in (A), except based only on the 84 ALM neuron types. Dashed crosses demarcate the four quadrants of directed NPP/NP-GPCR pairing between glutamatergic (‘E’) and GABAergic (‘I’) neuron types, called out as (E→ E), (E→ I), (I→ I) and (I→ E). Light gray lines, pastel color blocks and labels flanking both axes demarcate higher, subclass levels of the Tasic 2018 neurotaxonomy (as in Figure 3A above). (C–E) Exemplar matrix predictions for a further sampling of the 37 VISp cognate NPP/NP-GPCR pairs from each of the three primary G-protein transduction families: (C) Gi/o; (D) Gs; (E) Gq/11. (F) Adjacency matrices similar to A-E, except row and column factor vectors were calculated as means of CPM values across neuron types comprising indicated subclasses. (Cladograms and taxonomic color codes as delineated in Figure 6—figure supplements 1–8). Links below point to source data files and similar plots for all 37 VISp and ALM type and subclass adjacency matrices, and to additional quantitative analysis of coupling matrix hierarchies (Figure 6—figure supplement 9) and morphologies and correlations (Figure 6—figure supplement 10).
-
Figure 6—source data 1
NP coupling predictions by cognate pair and type for area VISp (archive containing 37 CSV files, one for each of the 37 cognate pairs listed in Table 3 and represented in Figure 6—figure supplements 1–8).
- https://cdn.elifesciences.org/articles/47889/elife-47889-fig6-data1-v2.zip
-
Figure 6—source data 2
NP coupling predictions by cognate pair and type for area ALM (archive containing 37 CSV files, one for each of the 37 cognate pairs listed in Table 3 and represented in Figure 6—figure supplements 1–8).
- https://cdn.elifesciences.org/articles/47889/elife-47889-fig6-data2-v2.zip
Figure 6—figure supplement 1
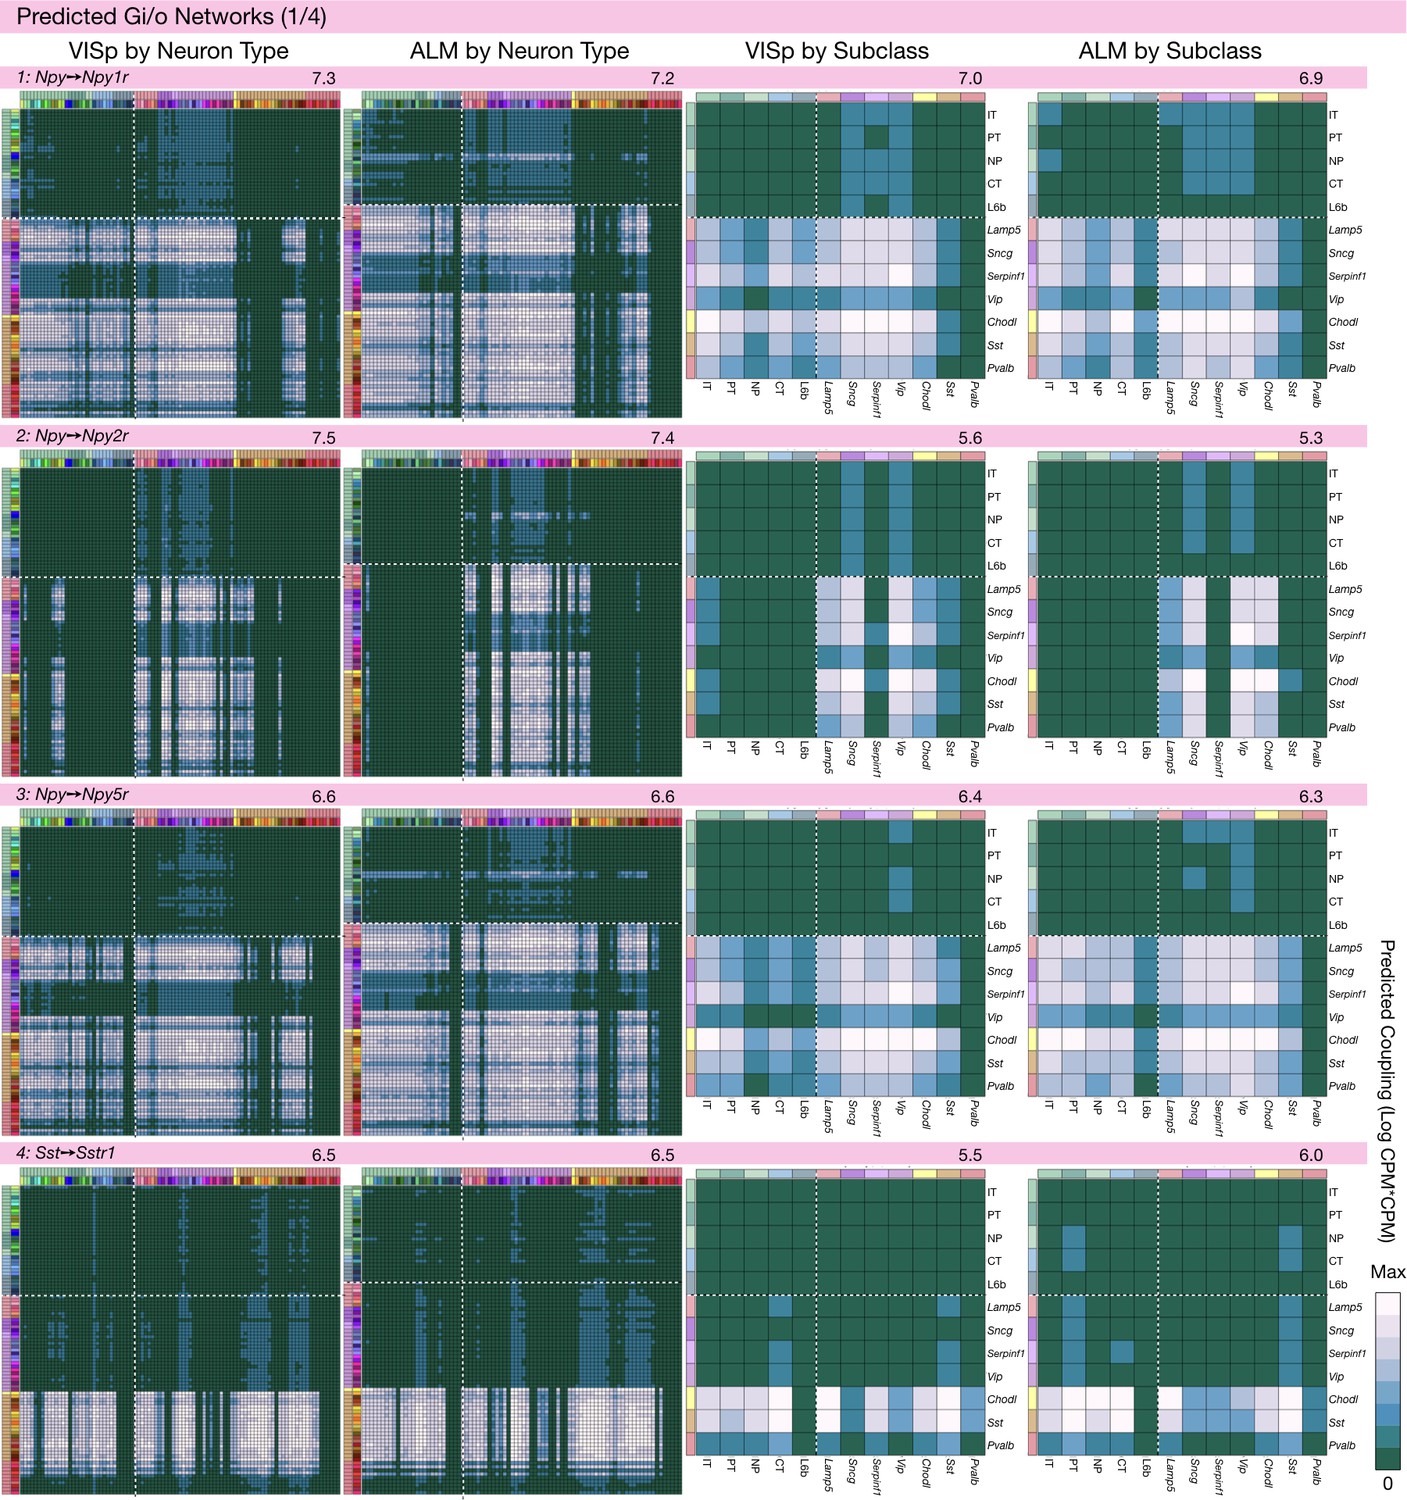
Neurotaxonomic coupling predictions for cognate NPP/NP-GPCR pairs #1-#4.
Predictions for all 37 cognate pairs in both VISp and ALM cortical areas are grouped and color-coded according to Gα signal transduction family. All predictions were generated as described in connection with Figure 6 and represented as in Figure 6C–E for neuron types and in 6F for subclasses. Numbers at upper right indicate the maximum value to which each plot was normalized, in units of CPM*CPM.
Figure 6—figure supplement 2

Neurotaxonomic coupling predictions for cognate NPP/NP-GPCR pairs #5-#9.
Predictions for all 37 cognate pairs in both VISp and ALM cortical areas are grouped and color-coded according to Gα signal transduction family. All predictions were generated as described in connection with Figure 6 and represented as in Figure 6C–E for neuron types and in 6F for subclasses. Numbers at upper right indicate the maximum value to which each plot was normalized, in units of CPM*CPM.
Figure 6—figure supplement 3
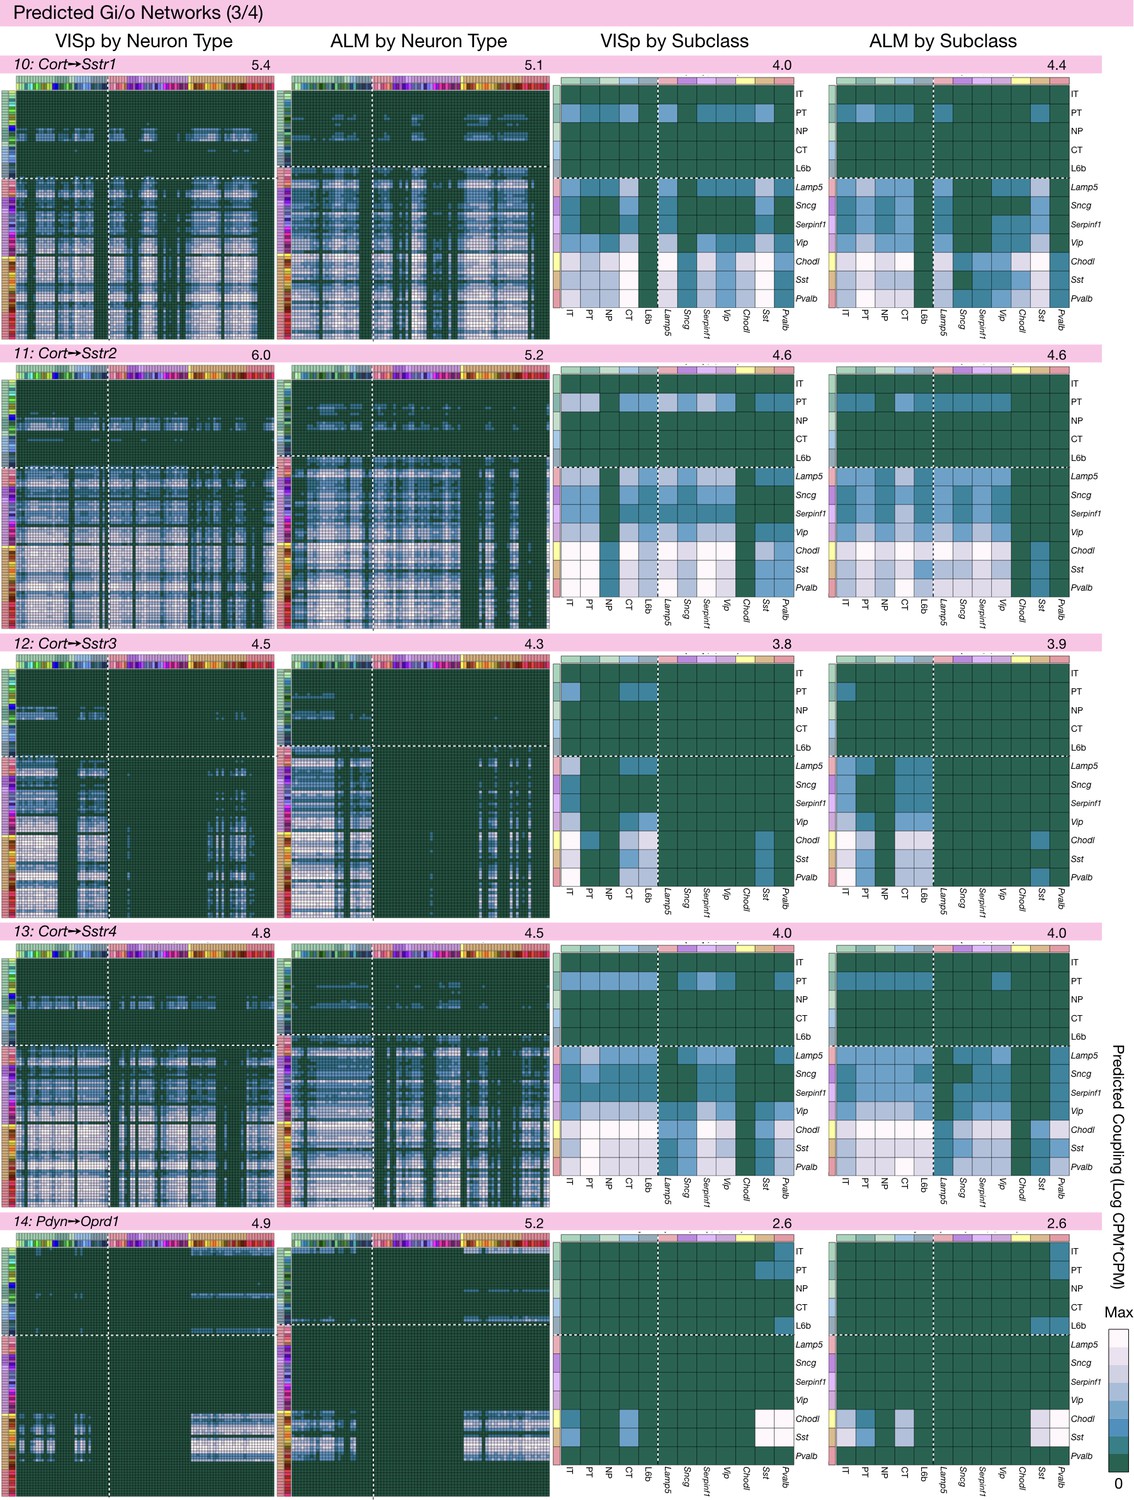
Neurotaxonomic coupling predictions for cognate NPP/NP-GPCR pairs #10-#14.
Predictions for all 37 cognate pairs in both VISp and ALM cortical areas are grouped and color-coded according to Gα signal transduction family. All predictions were generated as described in connection with Figure 6 and represented as in Figure 6C–E for neuron types and in 6F for subclasses. Numbers at upper right indicate the maximum value to which each plot was normalized, in units of CPM*CPM.
Figure 6—figure supplement 4
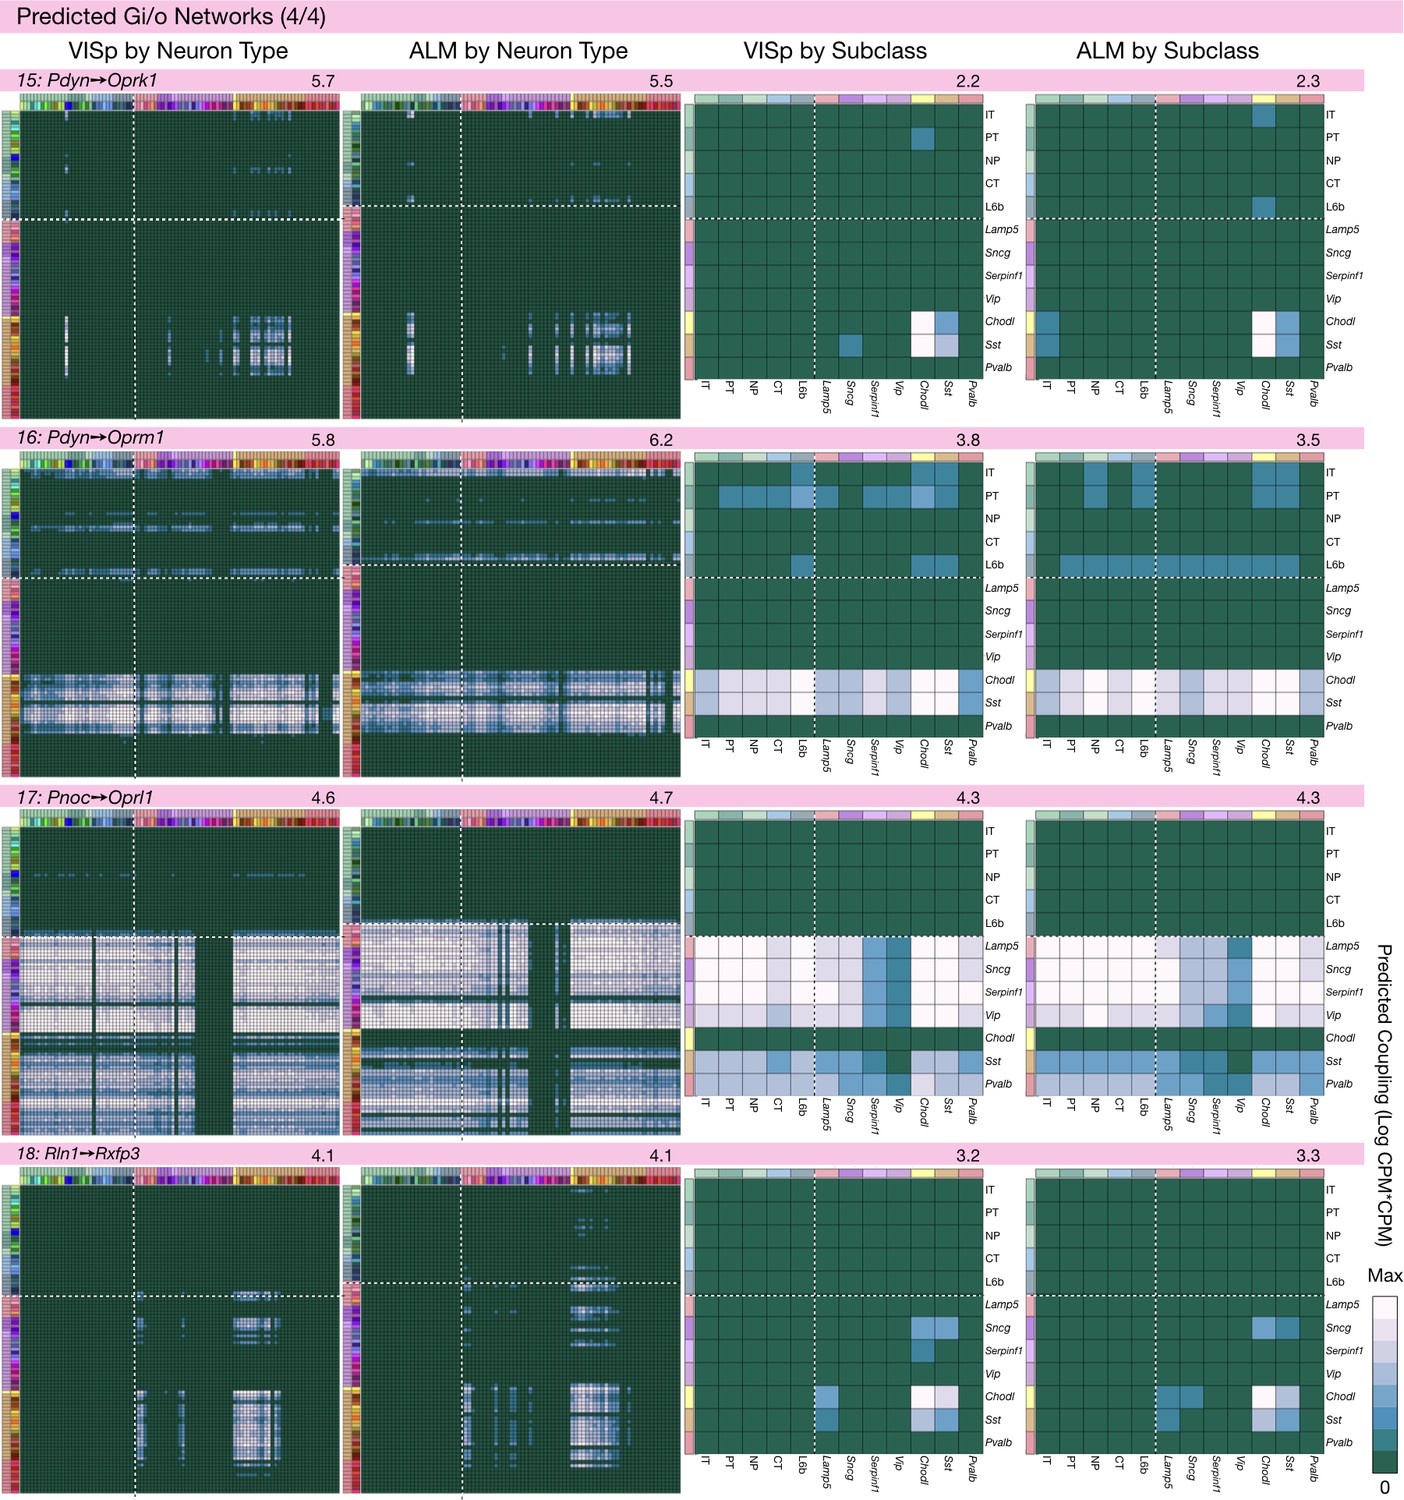
Neurotaxonomic coupling predictions for cognate NPP/NP-GPCR pairs #15-#18.
Predictions for all 37 cognate pairs in both VISp and ALM cortical areas are grouped and color-coded according to Gα signal transduction family. All predictions were generated as described in connection with Figure 6 and represented as in Figure 6C–E for neuron types and in 6F for subclasses. Numbers at upper right indicate the maximum value to which each plot was normalized, in units of CPM*CPM.
Figure 6—figure supplement 5
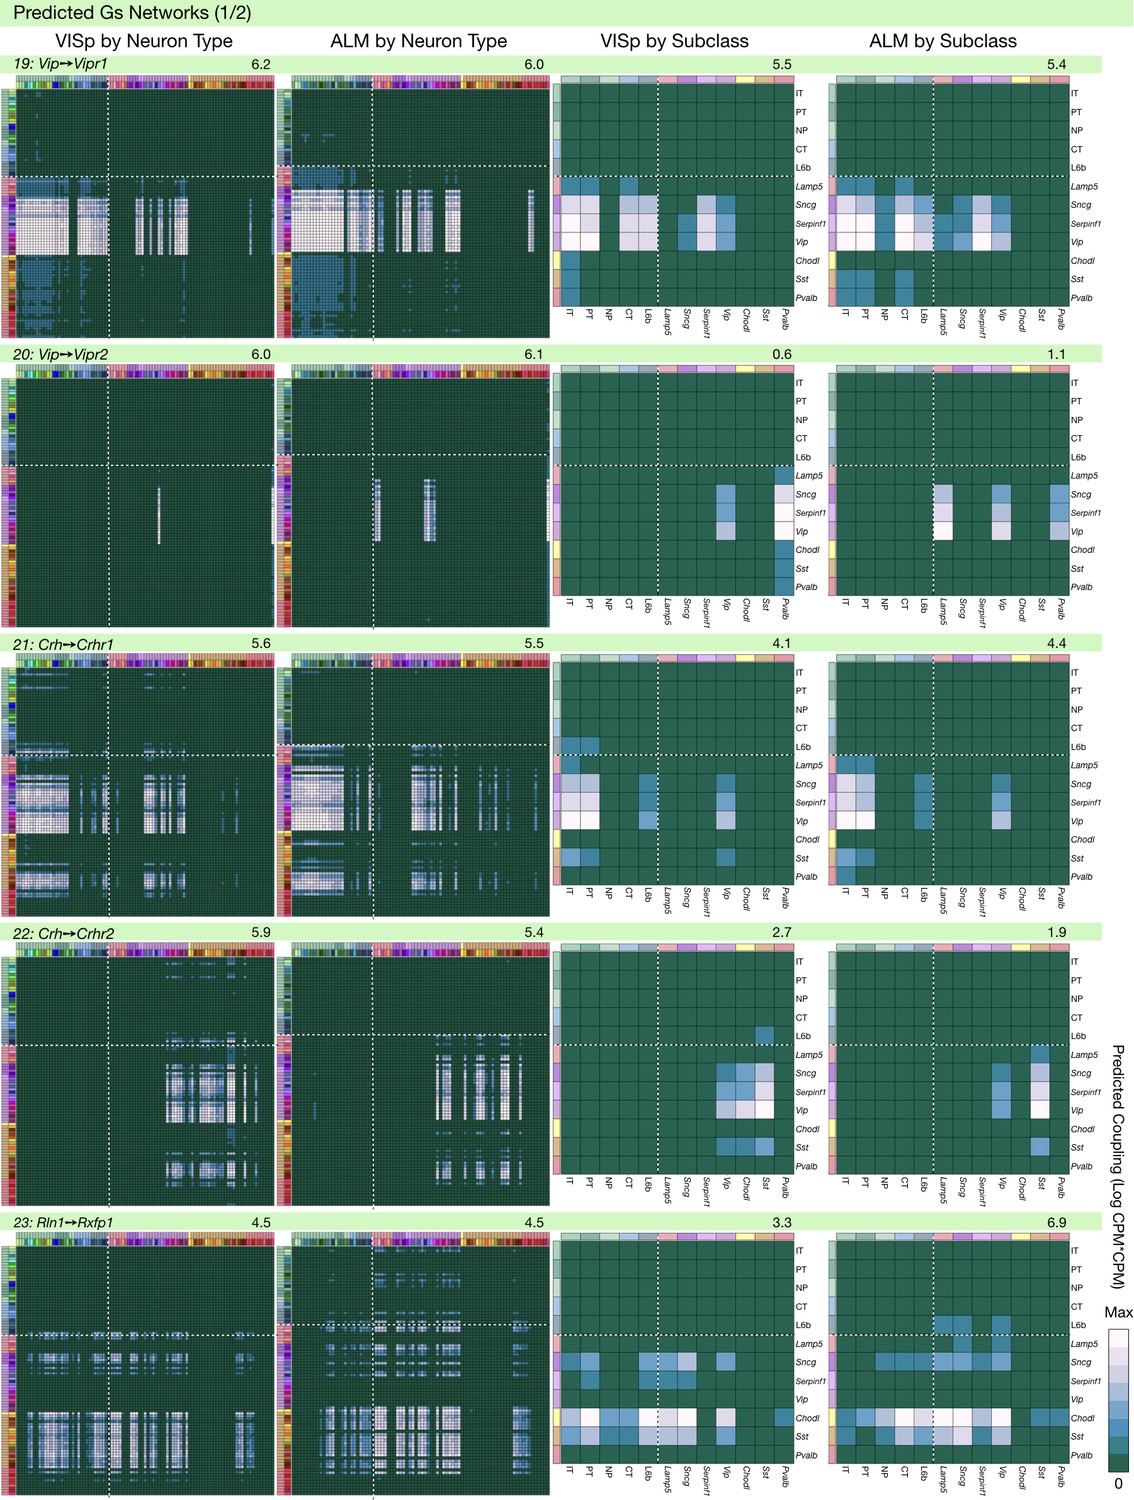
Neurotaxonomic coupling predictions for cognate NPP/NP-GPCR pairs #19-#23.
Predictions for all 37 cognate pairs in both VISp and ALM cortical areas are grouped and color-coded according to Gα signal transduction family. All predictions were generated as described in connection with Figure 6 and represented as in Figure 6C–E for neuron types and in 6F for subclasses. Numbers at upper right indicate the maximum value to which each plot was normalized, in units of CPM*CPM.
Figure 6—figure supplement 6
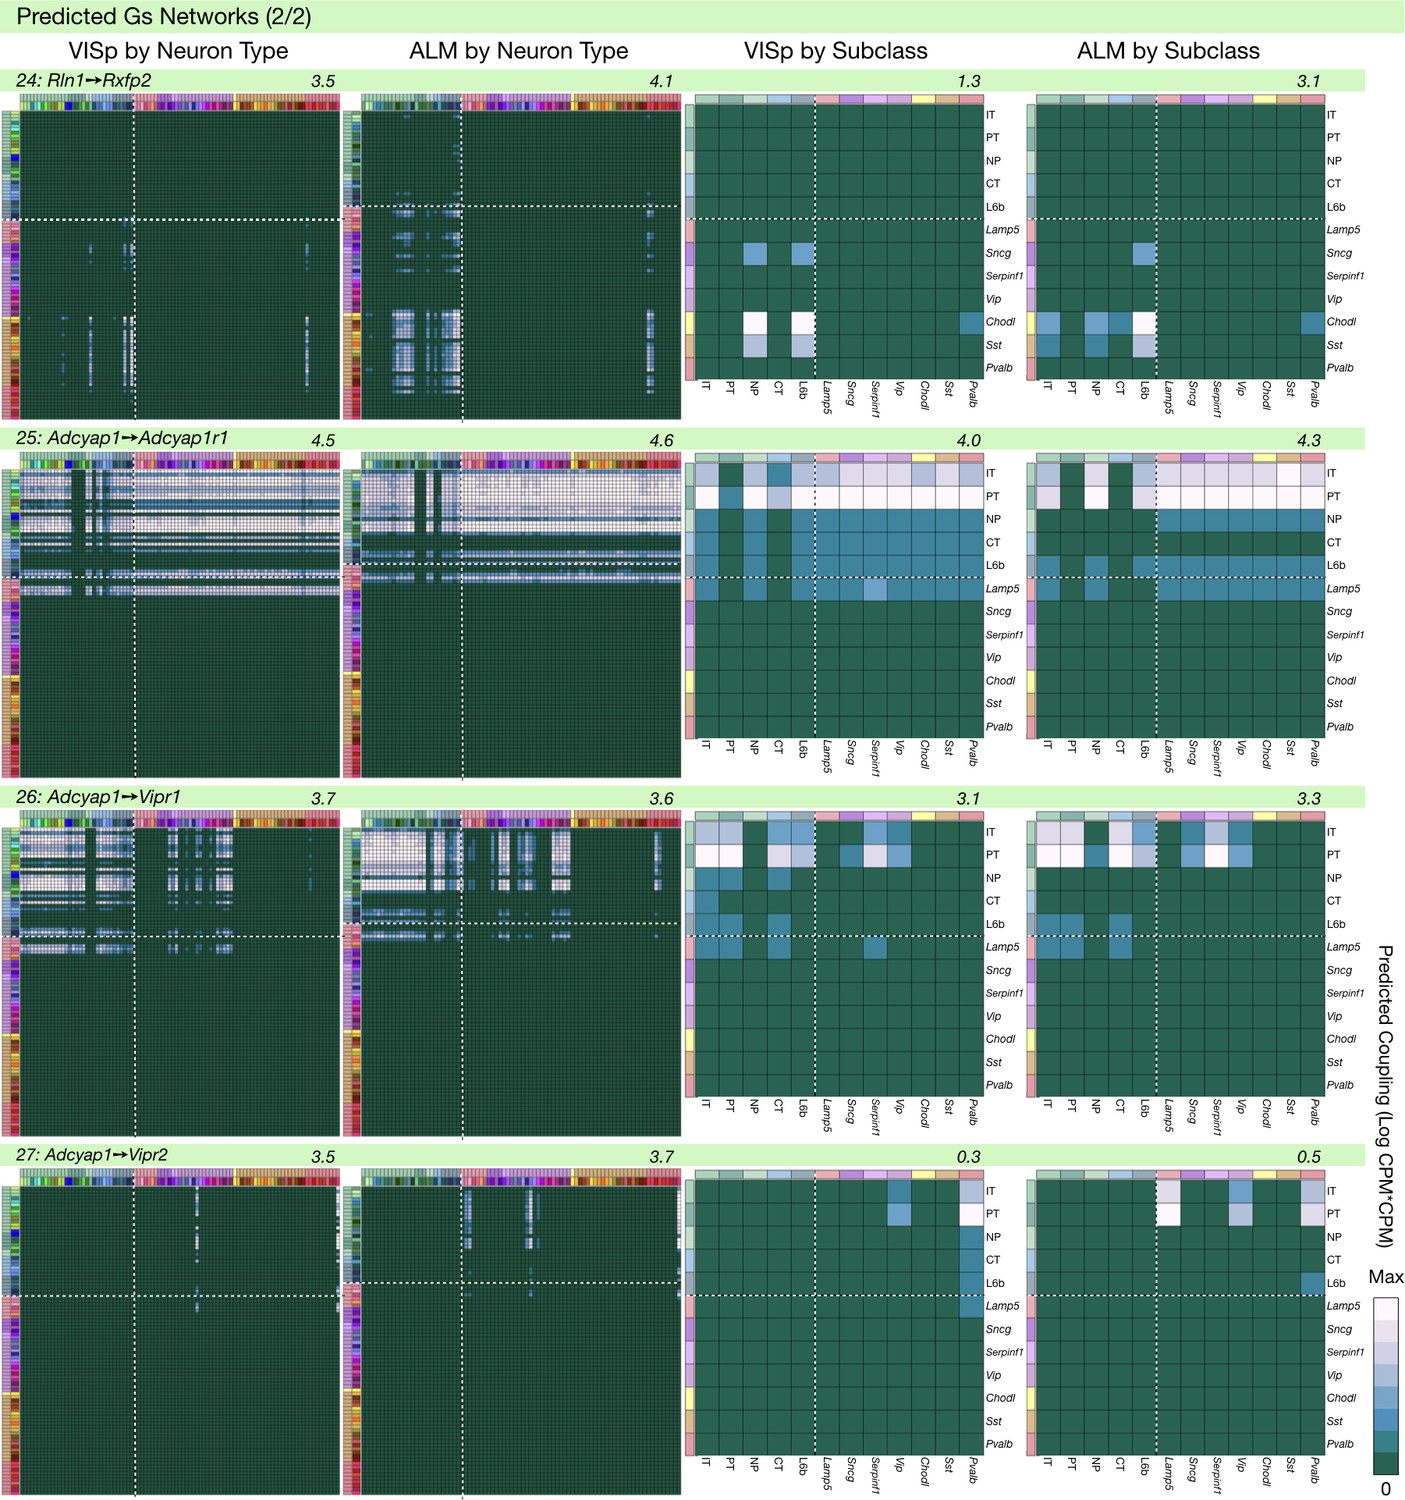
Neurotaxonomic coupling predictions for cognate NPP/NP-GPCR pairs #24-#27.
Predictions for all 37 cognate pairs in both VISp and ALM cortical areas are grouped and color-coded according to Gα signal transduction family. All predictions were generated as described in connection with Figure 6 and represented as in Figure 6C–E for neuron types and in 6F for subclasses. Numbers at upper right indicate the maximum value to which each plot was normalized, in units of CPM*CPM.
Figure 6—figure supplement 7
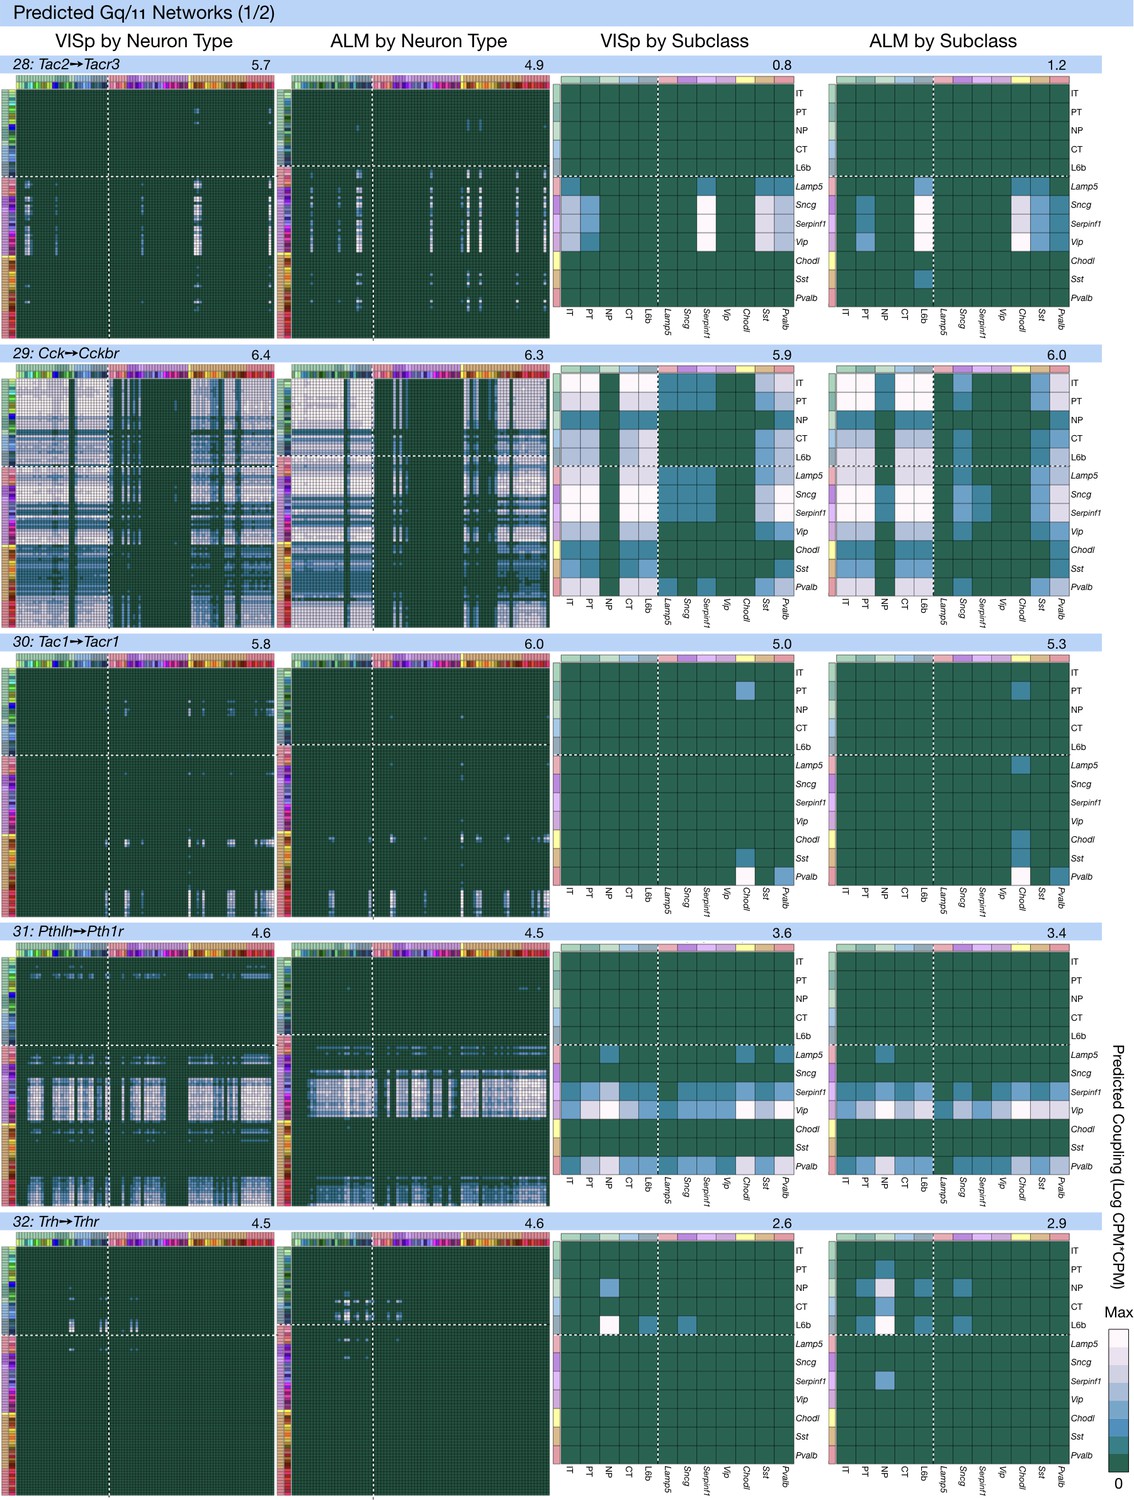
Neurotaxonomic coupling predictions for cognate NPP/NP-GPCR pairs #28-#32.
Predictions for all 37 cognate pairs in both VISp and ALM cortical areas are grouped and color-coded according to Gα signal transduction family. All predictions were generated as described in connection with Figure 6 and represented as in Figure 6C–E for neuron types and in 6F for subclasses. Numbers at upper right indicate the maximum value to which each plot was normalized, in units of CPM*CPM.
Figure 6—figure supplement 8

Neurotaxonomic coupling predictions for cognate NPP/NP-GPCR pairs #33-#37.
Predictions for all 37 cognate pairs in both VISp and ALM cortical areas are grouped and color-coded according to Gα signal transduction family. All predictions were generated as described in connection with Figure 6 and represented as in Figure 6C–E for neuron types and in 6F for subclasses. Numbers at upper right indicate the maximum value to which each plot was normalized, in units of CPM*CPM.
Figure 6—figure supplement 9
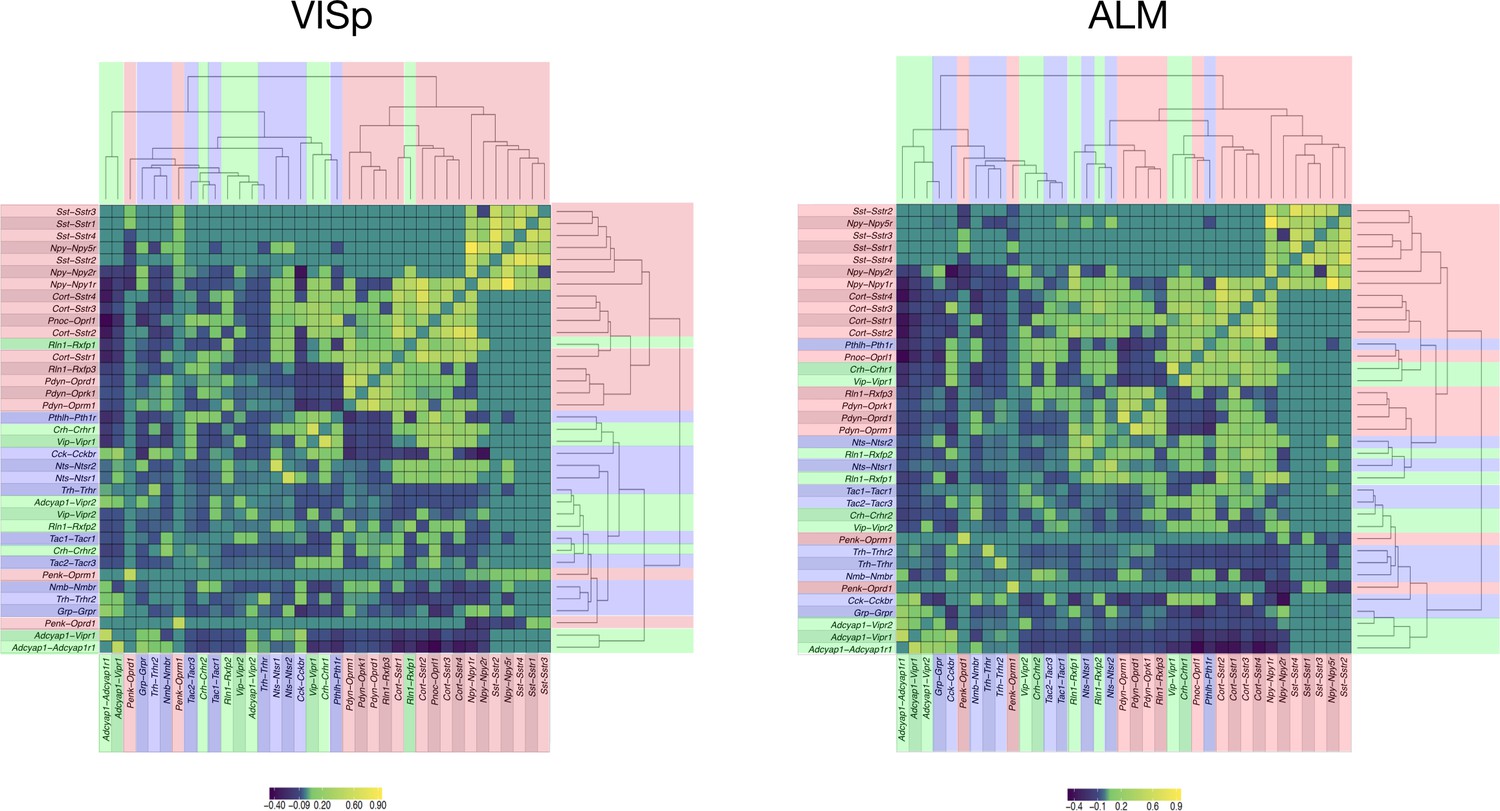
Hierarchical relationships of coupling matrices.
For area VISp (left) and ALM (right), the NPP, NP-GPCR coupling matrices C are linearized to vectors and then clustered using hierarchical clustering (average linkage) of the Pearson correlation between associated NPP, NP-GPCR vector pairs. The result of clustering the correlation matrix demonstrates consistent organization between ALM and VISp, with Sst-Sstr1, Sst-Sstr2, Sst-Sstr3, Sst-Sstr4,Npy-Npy5r showing greatest similarity of pattern. A singular value decomposition (SVD) of the associated ALM, VISp matrices shows 20 eigenvalues are required to explain 95% of variance for ALM, and 18 eigenvalues to explain 95% variance for VISp.
The complexity of these patterns suggests a highly non-redundant combinatorial code. Text fill colors indicate primary Gα family.
Figure 6—figure supplement 10
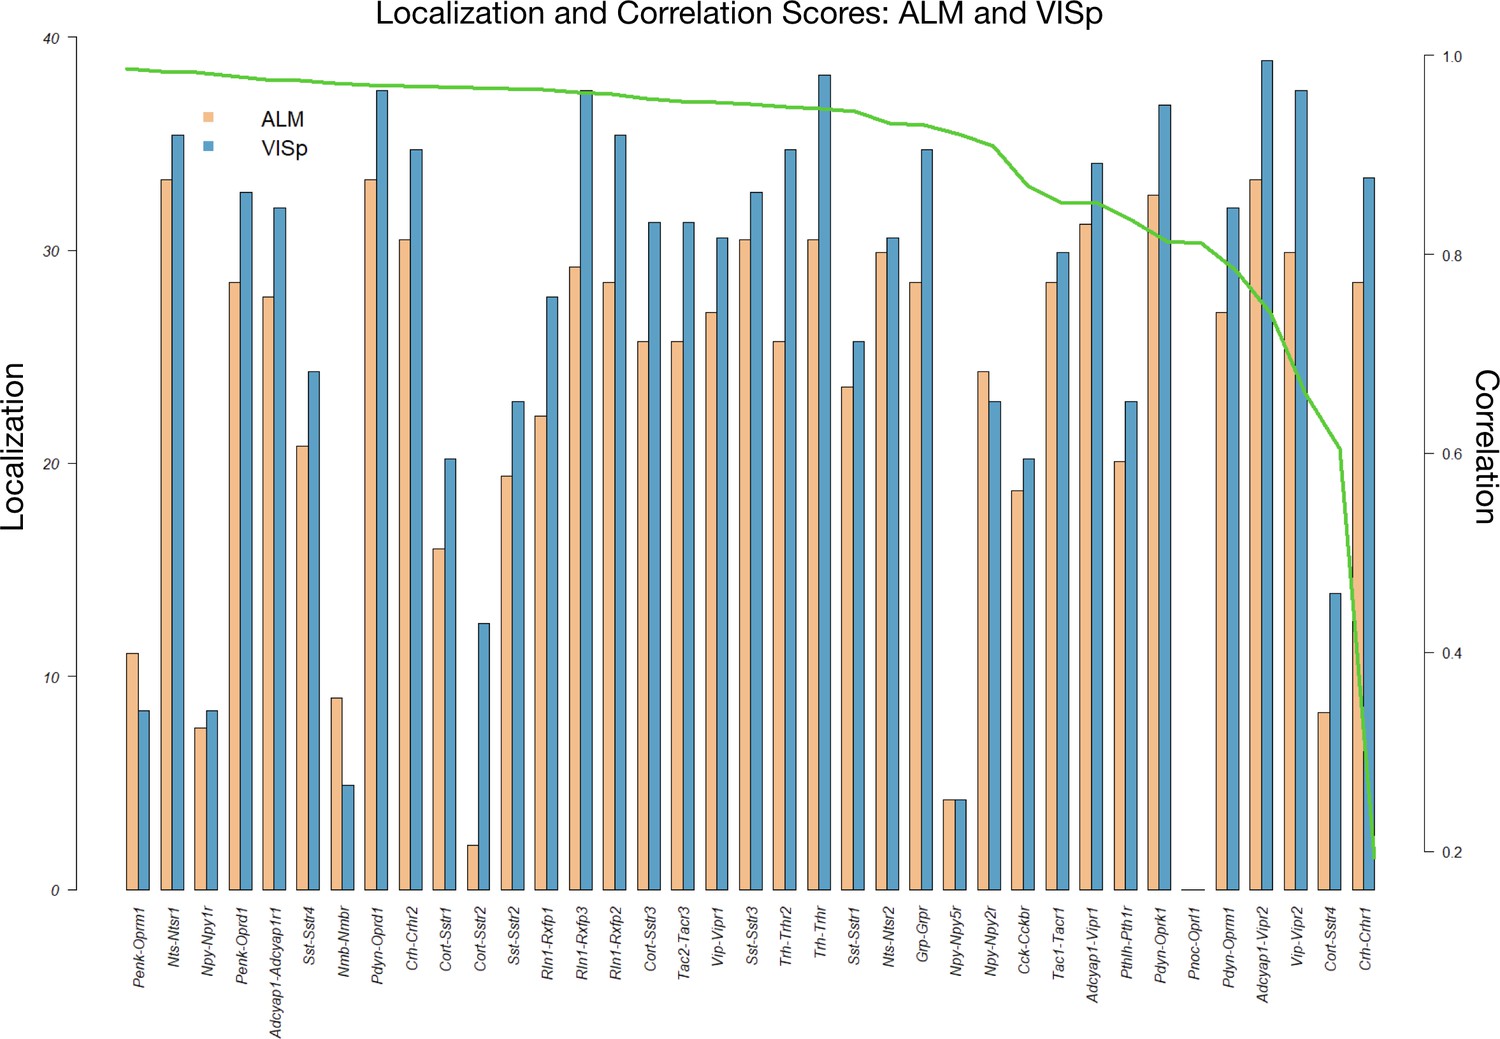
Coupling matrix localization and correlation metrics for VISp and ALM areas.
To measure the extent to which each (NPP, NP-GPCR) pair p demonstrates localized signal in its coupling matrix in a region , we extract the top 10% percentile of , then reduce the remaining expression signal to the pooled 12 × 12 major types matrix . Let M be the maximum number of non-zero cells of over all pairs t. Define the localization score of the pair p as = {M - # non-zero cells of }. Another informative metric is the Pearson correlation between the 12 × 12 major types matrices and . This figure shows the localization scores for each pair (NPP, NP-GPCR) for both ALM and VISp ordered by decreasing correlation . The result demonstrates a large number of localized pairs and localization that is generally independent of the correlation of the signal between ALM and VISp, suggesting reproducible localized signal across cortical regions.
Figure 7
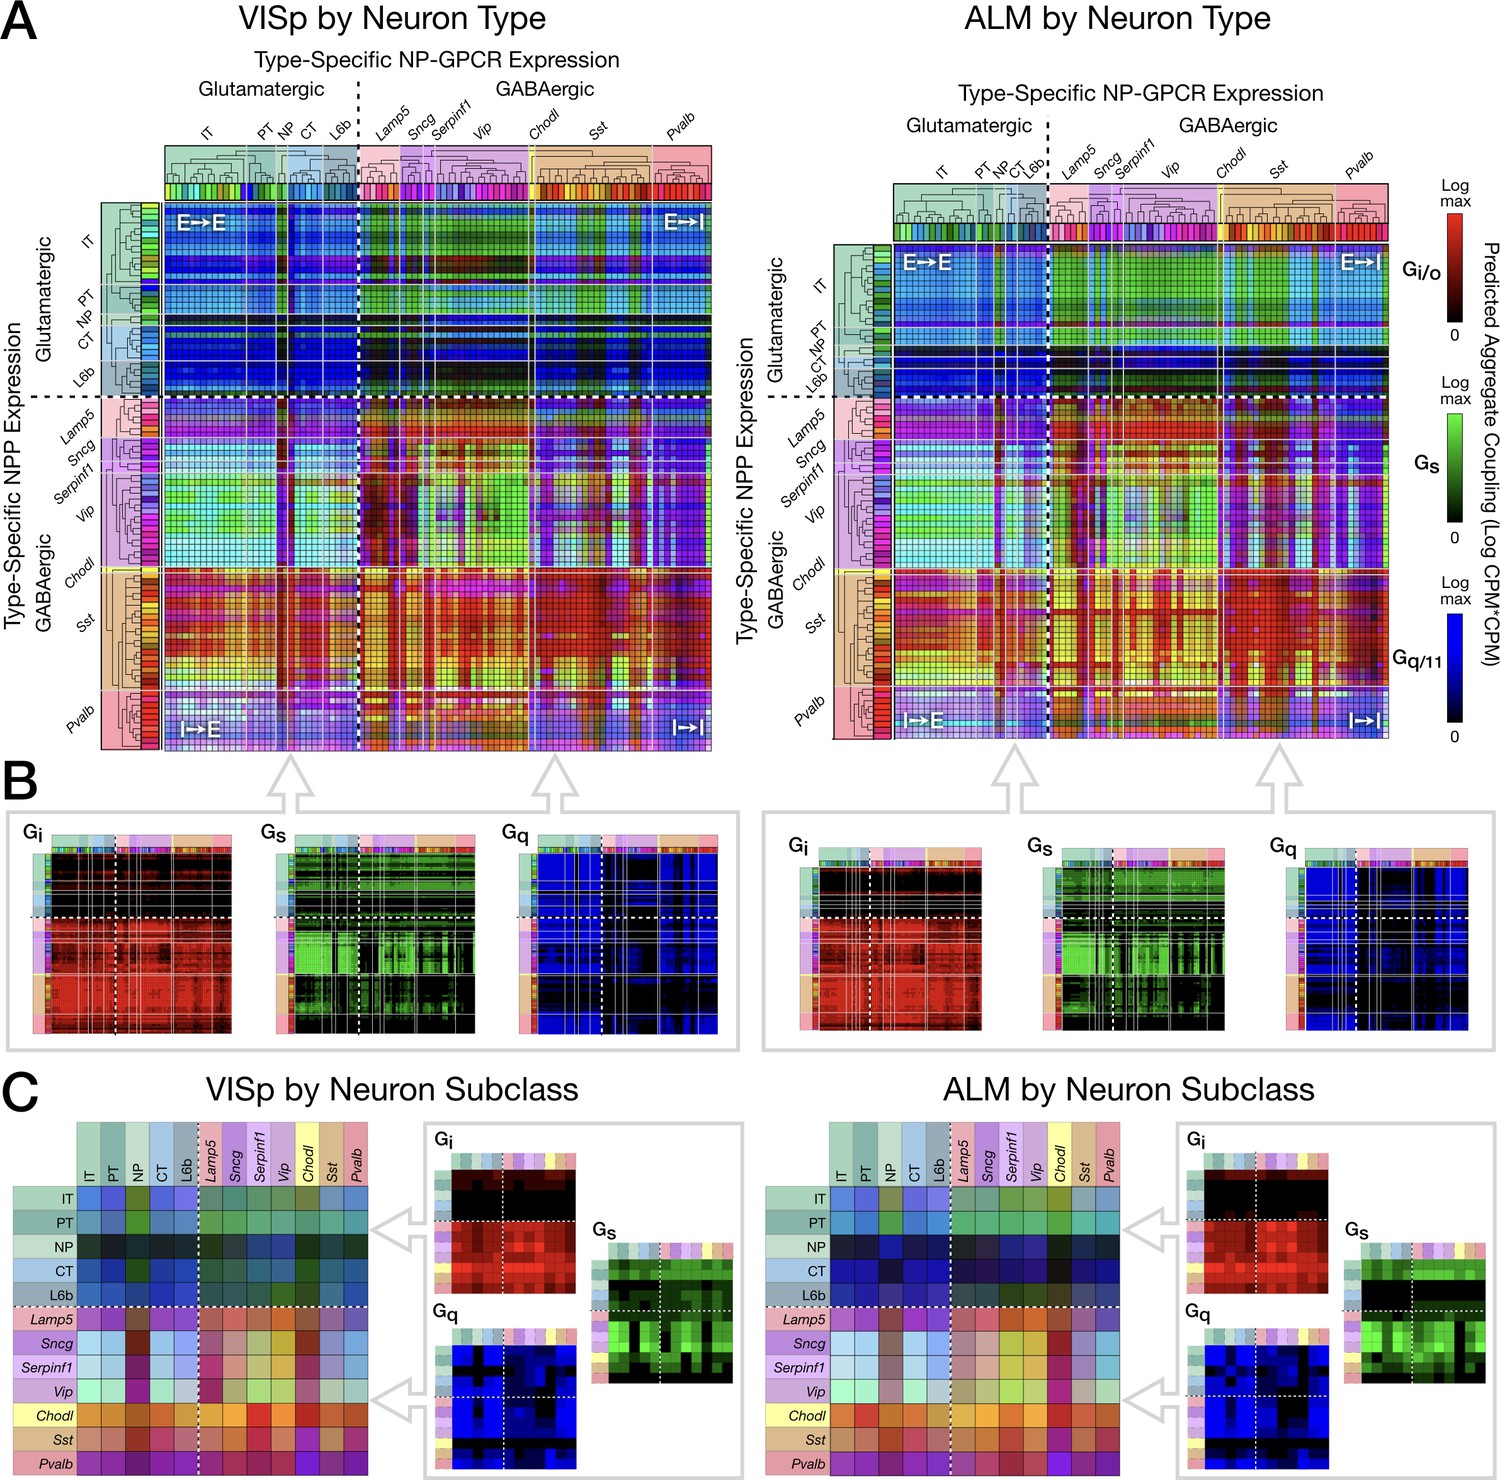
Pooling NP-GPCRs by primary Gα family enables neurotaxonomic prediction of primary NP-GPCR signaling impacts across 37 cognate NP pairs (see text) for each of areas VISp and ALM.
(A) ISQ color maps representing coupling matrix predictions at the Tasic 2018 neurotaxonomy type level, merging Gi/o (red), Gs (green) and Gq/11 (blue) primary Gα family components. (B) Component primary Gα family (color) channels prior to merger displayed in (A). (C) Coupling matrix plots as in (A) and (B), except generated at the higher Tasic 2018 neurotaxonomy subclass level. Individual aggregate matrix components as in (B) are plotted at the right for both VISp and ALM. Dashed white crosses overlaying each matrix plot demarcate glutamatergic and GABAergic classes and the four corresponding matrix quadrants (E→ E, E→I, I→I and I→E) as in the individual matrix plots of Figure 6. (Cladograms and taxonomic color codes as delineated in Figure 3—figure supplement 1).
-
Figure 7—source data 1
VISp coupling predictions by Gα family and type.
(archive containing three CSV files, one for each of Gi/o, Gs and Gq/11 families).
- https://cdn.elifesciences.org/articles/47889/elife-47889-fig7-data1-v2.zip
-
Figure 7—source data 2
ALM coupling predictions by Gα family and type.
(archive containing three CSV files, one for each of Gi/o, Gs and Gq/11 families).
- https://cdn.elifesciences.org/articles/47889/elife-47889-fig7-data2-v2.zip
Figure 8
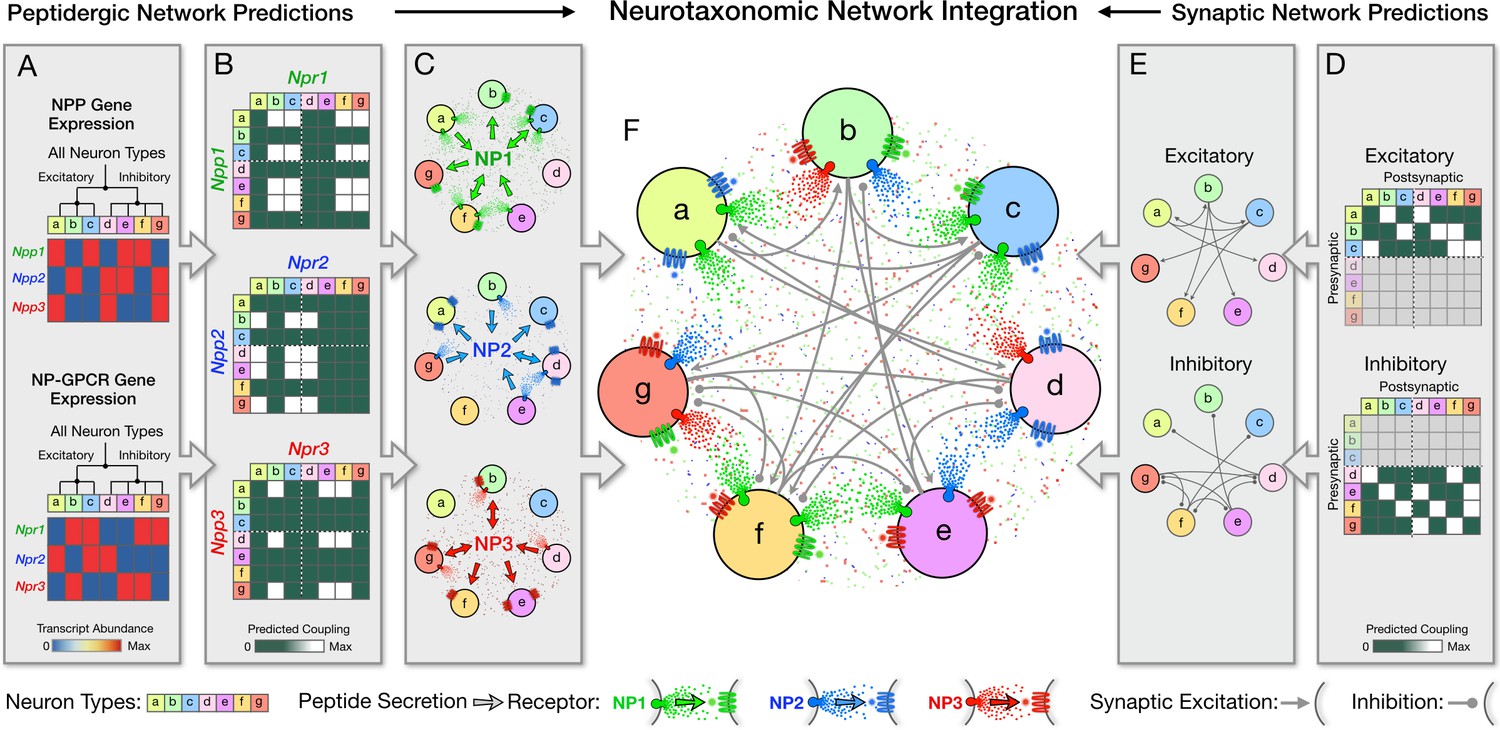
Neurotaxonomy offers a framework for integrating statistical descriptions of multiple modulatory and synaptic networks, as schematized here for purely fictitious neuron types, transcriptomic and connectomic data.
Multiple directed network graphs are predicted here for peptidergic networks from transcriptomic data (A–C) and for synaptic networks from connectomic data (D,E) to predict a modulated synaptic network (F). (A) Transcriptional heat maps representing expression of three fictitious NPP genes (Npp1,2,3) and three cognate NP-GPCR genes (Npr1,2,3) across a neurotaxonomy comprising seven fictitious neuron types (a-c excitatory; d-g inhibitory). (B) Adjacency matrices derived from expression data in (A) as outer products of column and row factor vectors representing NPP and NP-GPCR expression, respectively. (C) Directed network graphs representing the same three NP networks, diagramming paracrine coupling by three neuropeptides (NP1,2,3) with routing of broadcast diffusive signals determined by differential expression of peptide-receptor pairings. (D) Neurotaxonomic adjacency matrices expressing excitatory and inhibitory synaptic connection statistics. (E) Synaptic network graphs derived from (D). (F) Directed multigraph illustrating use neurotaxonomy to integrate the three modulatory graphs and two synaptic connectivity graphs.
Author response image 1
Tables
Table 1
Single-cell RNA-seq expression statistics for 18 highly expressed neuropeptide precursor protein (NPP) genes cognate to locally expressed NP-GPCR genes (see Table 2).
NPP genes are tabulated here along with peak single-cell expression levels as pFPKM (Peak FPKM, see Materials and methods), percentile and absolute ranking of these pFPKM values across pFPKMs for all 21,931 protein-coding genes, and the percentage of cells sampled in which transcripts of the given NPP gene were detected at > 1 CPM. The table also lists predicted neuropeptide products, and genes encoding the locally expressed G-protein-coupled receptors (NP-GPCRs) cognate to the NPP (see Table 2). NPP genes are listed here in descending order of Peak FPKM. Pastel color fills in the ‘Cognate NP-GPCR Genes’ column correspond to i/o (pink), s (light green) and q/11 (light blue) transduction families of associated G-protein and will be used to highlight these families consistently in all following figures.
| NPP Gene | Peak FPKM | pFPKM Percentile | pFPKM Rank | % Cells | Predicted Neuropeptides | Cognate NP-GPCR Genes | |
|---|---|---|---|---|---|---|---|
| Npy | 108,865 | 100.00 | 1 | 42 | Neuropeptide Y | Npy1r, Npy2r, Npy5 | |
| Sst | 70,274 | 99.99 | 2 | 26 | Somatostatins | Sstr1, Sstr2, Sstr3, Sstr4 | |
| Vip | 48,747 | 99.99 | 3 | 33 | Vasoactive Intestinal Peptide | Vipr1, Vipr2 | |
| Tac2 | 18,284 | 99.98 | 4 | 15 | Neurokinin B | Tacr3 | |
| Cck | 16,396 | 99.97 | 6 | 69 | Cholecystokinins | Cckbr | |
| Penk | 11,160 | 99.96 | 8 | 26 | Enkephalins | Oprd1, Oprm1 | |
| Crh | 9,118 | 99.95 | 10 | 17 | Corticotropin-Releasing Hormone | Crhr1, Crhr2 | |
| Cort | 7,477 | 99.93 | 15 | 32 | Cortistatin | Sstr1, Sstr2, Sstr3, Sstr4 | |
| Tac1 | 5,728 | 99.92 | 18 | 11 | Substance P, Neurokinin A | Tacr1 | |
| Pdyn | 2,813 | 99.69 | 68 | 8 | Dynorphins | Oprd1, Oprk1, Oprm1 | |
| Pthlh | 1,656 | 99.29 | 156 | 18 | Parathyroid-Hormone-Like Hormone | Pth1r | |
| Pnoc | 698 | 97.68 | 509 | 23 | Nociceptins | Oprl1 | |
| Trh | 510 | 96.51 | 766 | 3 | Thyrotropin-Releasing Hormone | Trhr, Trhr2 | |
| Grp | 435 | 95.59 | 968 | 12 | Gastrin-Releasing Peptide | Grpr | |
| Rln1 | 258 | 91.99 | 1757 | 7 | Relaxin 1 | Rxfp1, Rxfp2 | Rxfp3 |
| Adcyap1 | 165 | 87.29 | 2788 | 26 | Adenylate Cyclase-Activating Polypeptides | Adcyap1r1, Vipr1, Vipr2 | |
| Nts | 121 | 82.14 | 3917 | 1 | Neurotensin | Ntsr1, Ntsr2 | |
| Nmb | 112 | 80.53 | 4270 | 14 | Neuromedin B | Nmbr | |
Table 2
Single-cell RNA-seq expression statistics for 29 neuropeptide-selective, G-protein-coupled receptor (NP-GPCR) genes cognate to locally expressed NPP genes (see Table 1).
NP-GPCR gene peak FPPM values, percentile ranking, and percentage sampled as for NPP genes in Table 1. The table names encoded NP-GPCR proteins, A-F class of NP-GPCR, primary Gα signal transduction family (Alexander et al., 2017) and cognate NPP genes. Color fill in ‘primary Gα family’ column as in Table 1.
| NP-GPCR Gene | Peak FPKM | pFPKM Percentile | % Cells | Neuropeptide Receptor | GPCR Class | Primary Gα Family | Cognate NPP Genes |
|---|---|---|---|---|---|---|---|
| Sstr2 | 413 | 95.3 | 42 | Somatostatin Receptor 2 | A4 | Gi/o | Sst, Cort |
| Npy2r | 291 | 93.1 | 10 | Neuropeptide Y Receptor Y2 | A9 | Gi/o | Npy |
| Npy1r | 272 | 92.4 | 50 | Neuropeptide Y Receptor Y1 | A9 | Gi/o | Npy |
| Grpr | 231 | 91 | 10 | GRP Receptor | A7 | Gq/11 | Grp |
| Cckbr | 210 | 90 | 52 | Cholecystokinin B Receptor | A6 | Gq/11 | Cck |
| Ntsr2 | 161 | 86.9 | 17 | Neurotensin Receptor 2 | A7 | Gq/11 | Nts |
| Npy5r | 152 | 86.1 | 28 | Neurpeptide Y Receptor Y5 | A9 | Gi/o | Npy |
| Nmbr | 123 | 82.4 | 8 | Neuromedin B Receptor | A7 | Gq/11 | Nmb |
| Rxfp1 | 121 | 82 | 22 | Relaxin Family Receptor 1 | A5 | Gs | Rln1 |
| Sstr4 | 106 | 79.5 | 28 | Somatostatin Receptor 4 | A4 | Gi/o | Sst, Cort |
| Trhr | 101 | 78.4 | 3 | TRH Receptor | A7 | Gq/11 | Trh |
| Sstr1 | 90 | 76 | 38 | Somatostatin Receptor 1 | A4 | Gi/o | Sst, Cort |
| Adcyap1r1 | 89 | 75.8 | 71 | ADCYAP1 Receptor 1 | B1 | Gs | Adcyap1, Vip |
| Crhr1 | 86 | 74.9 | 28 | CRH Receptor 1 | B1 | Gs | Crh |
| Rxfp3 | 85 | 74.7 | 5 | Relaxin Family Receptor 3 | A5 | Gi/o | Rln1 |
| Oprl1 | 82 | 73.8 | 48 | Opioid Receptor-Like 1 | A4 | Gi/o | Pnoc |
| Crhr2 | 72 | 70.7 | 3 | CRH Receptor 2 | B1 | Gs | Crh |
| Tacr3 | 65 | 68 | 3 | Tachykinin Receptor 3 | A9 | Gq/11 | Tac2 |
| Oprk1 | 64 | 67.4 | 3 | Kappa-Opioid Receptor | A4 | Gi/o | Pdyn |
| Tacr1 | 56 | 64.2 | 3 | Tachykinin Receptor 1 | A9 | Gq/11 | Tac1 |
| Pth1r | 51 | 61.6 | 15 | PTH 1 Receptor | B1 | Gq/11 | Pthlh |
| Vipr1 | 41 | 56.1 | 28 | VIP Receptor 1 | B1 | Gs | Vip, Adcyap1 |
| Oprm1 | 35 | 52.1 | 43 | Mu-Opioid Receptor | A4 | Gi/o | Penk, Pdyn |
| Trhr2 | 30 | 48.9 | 10 | TRH Receptor 2 | A7 | Gq/11 | Trh |
| Vipr2 | 30 | 48.4 | 0.5 | VIP Receptor 2 | B1 | Gs | Vip, Adcyap1 |
| Rxfp2 | 28 | 47.3 | 4 | Relaxin Family Receptor 2 | A5 | Gs | Rln1 |
| Oprd1 | 26 | 45.8 | 13 | Delta-Opioid Receptor | A4 | Gi/o | Penk, Pdyn |
| Ntsr1 | 24 | 44.3 | 10 | Neurotensin Receptor 1 | A7 | Gq/11 | Nts |
| Sstr3 | 17 | 39.5 | 21 | Somatostatin Receptor 3 | A4 | Gi/o | Sst, Cort |
Table 3
The 18 NPP and 29 NP-GPCR genes of Tables 1 and 2 constitute 37 cognate NPP/NP-GPCR pairs and predict at least 37 potentially distinct peptidergic modulatory networks.
The 37 pairs are enumerated here along with indications of the expected primary GPCR signal transduction class for each NP-GPCR (Alexander et al., 2017) and a fraction denoting frequency with which the given cognate pair occurs as a fraction of all neuron pairs surveyed. Pastel table fill colors denote G-protein transduction class as in Tables 1 and 2.
| # | Cognate Pair Symbol | NPP Gene | NP-GPCR Gene | Primary Gα Family | Fraction of Type Pairs | # | Cognate Pair Symbol | NPP Gene | NP-GPCR Gene | Primary Gα Family | Fraction of Type Pairs |
|---|---|---|---|---|---|---|---|---|---|---|---|
| 1 | Npy→Npy1r | Npy | Npy1r | Gi/o | 0.7805 | 19 | Vip→Vipr1 | Vip | Vipr1 | Gs | 0.496 |
| 2 | Npy→Npy2r | Npy | Npy2r | Gi/o | 0.341 | 20 | Vip→Vipr2 | Vip | Vipr2 | Gs | 0.052 |
| 3 | Npy→Npy5r | Npy | Npy5r | Gi/o | 0.8095 | 21 | Crh→Crhr1 | Crh | Crhr1 | Gs | 0.3925 |
| 4 | Sst→Sstr1 | Sst | Sstr1 | Gi/o | 0.751 | 22 | Crh→Crhr2 | Crh | Crhr2 | Gs | 0.2035 |
| 5 | Sst→Sstr2 | Sst | Sstr2 | Gi/o | 0.836 | 23 | Rln1→Rxfp1 | Rln1 | Rxfp1 | Gs | 0.2465 |
| 6 | Sst→Sstr3 | Sst | Sstr3 | Gi/o | 0.405 | 24 | Rln1→Rxfp2 | Rln1 | Rxfp2 | Gs | 0.07 |
| 7 | Sst→Sstr4 | Sst | Sstr4 | Gi/o | 0.806 | 25 | Adcyap1→Adcyap1r1 | Adcyap1 | Adcyap1r1 | Gs | 0.284 |
| 8 | Penk→Oprd1 | Penk | Oprd1 | Gi/o | 0.4955 | 26 | Adcyap1→Vipr1 | Adcyap1 | Vipr1 | Gs | 0.1465 |
| 9 | Penk→Oprm1 | Penk | Oprm1 | Gi/o | 0.9 | 27 | Adcyap1→Vipr2 | Adcyap1 | Vipr2 | Gs | 0.0155 |
| 10 | Cort→Sstr1 | Cort | Sstr1 | Gi/o | 0.6265 | 28 | Tac2→Tacr3 | Tac2 | Tacr3 | Gq/11 | 0.0955 |
| 11 | Cort→Sstr2 | Cort | Sstr2 | Gi/o | 0.6965 | 29 | Cck→Cckbr | Cck | Cckbr | Gq/11 | 0.6635 |
| 12 | Cort→Sstr3 | Cort | Sstr3 | Gi/o | 0.338 | 30 | Tac1→Tacr1 | Tac1 | Tacr1 | Gq/11 | 0.119 |
| 13 | Cort→Sstr4 | Cort | Sstr4 | Gi/o | 0.672 | 31 | Pthlh→Pth1r | Pthlh | Pth1r | Gq/11 | 0.392 |
| 14 | Pdyn→Oprd1 | Pdyn | Oprd1 | Gi/o | 0.2115 | 32 | Trh→Trhr | Trh | Trhr | Gq/11 | 0.016 |
| 15 | Pdyn→Oprk1 | Pdyn | Oprk1 | Gi/o | 0.0745 | 33 | Trh→Trhr2 | Trh | Trhr2 | Gq/11 | 0.055 |
| 16 | Pdyn→Oprm1 | Pdyn | Oprm1 | Gi/o | 0.4 | 34 | Grp→Grpr | Grp | Grpr | Gq/11 | 0.113 |
| 17 | Pnoc→Oprl1 | Pnoc | Oprl1 | Gi/o | 0.654 | 35 | Nts→Ntsr1 | Nts | Ntsr1 | Gq/11 | 0.0225 |
| 18 | Rln1→Rxfp3 | Rln1 | Rxfp3 | Gi/o | 0.106 | 36 | Nts→Ntsr2 | Nts | Ntsr2 | Gq/11 | 0.054 |
| 37 | Nmb→Nmbr | Nmb | Nmbr | Gq/11 | 0.5655 |
Additional files
-
Supplementary file 1
Gene ontology results for 18 NPP genes.
- https://cdn.elifesciences.org/articles/47889/elife-47889-supp1-v2.csv
-
Supplementary file 2
Gene ontology results for 29 NP-GPCR genes.
- https://cdn.elifesciences.org/articles/47889/elife-47889-supp2-v2.csv
-
Supplementary file 3
pFPKM expression data for 94 putative mouse NPP genes.
- https://cdn.elifesciences.org/articles/47889/elife-47889-supp3-v2.csv
-
Supplementary file 4
Criteria for selecting 18 genes from a set of 39 cortically expressed NPP genes.
- https://cdn.elifesciences.org/articles/47889/elife-47889-supp4-v2.csv
-
Supplementary file 5
pFPKM expression data for 84 putative mouse NP-GPCR genes.
- https://cdn.elifesciences.org/articles/47889/elife-47889-supp5-v2.csv
-
Transparent reporting form
- https://cdn.elifesciences.org/articles/47889/elife-47889-transrepform-v2.docx
Download links
A two-part list of links to download the article, or parts of the article, in various formats.
Downloads (link to download the article as PDF)
Open citations (links to open the citations from this article in various online reference manager services)
Cite this article (links to download the citations from this article in formats compatible with various reference manager tools)
Single-cell transcriptomic evidence for dense intracortical neuropeptide networks
eLife 8:e47889.
https://doi.org/10.7554/eLife.47889


