Effect of helical kink in antimicrobial peptides on membrane pore formation
- CEITEC – Central European Institute of Technology, Masaryk University, Czech Republic
- National Centre for Biomolecular Research, Faculty of Science, Masaryk University, Czech Republic
- Department of Condensed Matter Physics, Faculty of Science, Masaryk University, Czech Republic
- Czech Academy of Sciences, Czech Republic
Figures
Figure 1

Free energy profiles of pore formation.
(A) Barrel-stave pore, (B) toroidal pore, and (C) synergistic pore. Schematic images of studied pore structures (top) and representative simulation snapshots of the phenomenological model (bottom) are shown. Labels flexible and rigid correspond to peptides with and without a kink, respectively. The dotted line corresponds to the free energy profile of our reference system, a pure membrane without any peptides. Color coding: lipid headgroup = orange, lipid tail = light gray, hydrophilic = green, hydrophobic = dark gray.
-
Figure 1—source data 1
Free energy profiles and system configurations for snapshots.
- https://cdn.elifesciences.org/articles/47946/elife-47946-fig1-data1-v1.zip
Figure 2
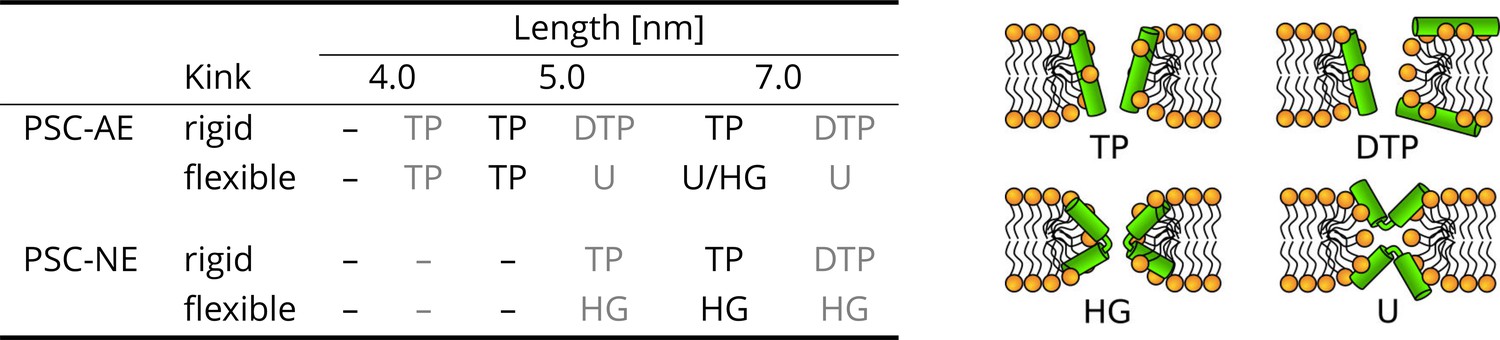
The effect of peptide properties and kink flexibility on the morphology of membrane pores.
Peptides with higher hydrophobic moment (see the Materials and methods) are written in gray. Toroidal pore (TP); Disordered toroidal pore (DTP); Hourglass pore (HG); U-shaped pore (U). PSC-AE and PSC-NE represent peptides with hydrophobic and hydrophilic termini, respectively.
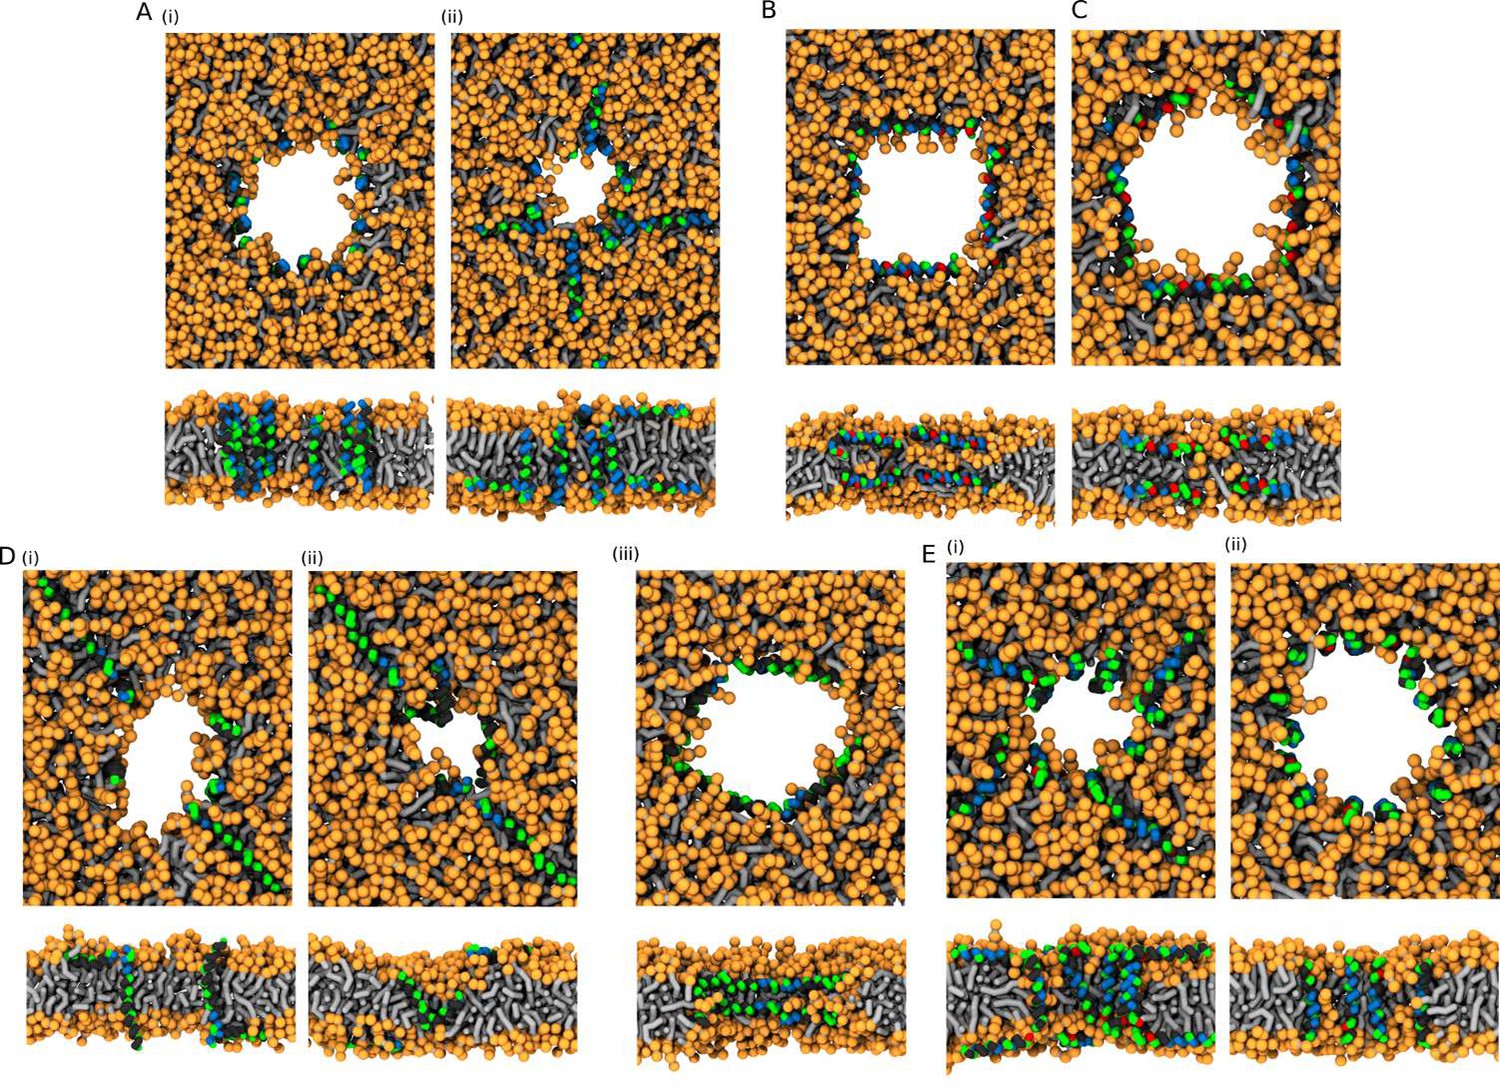
Figure 3
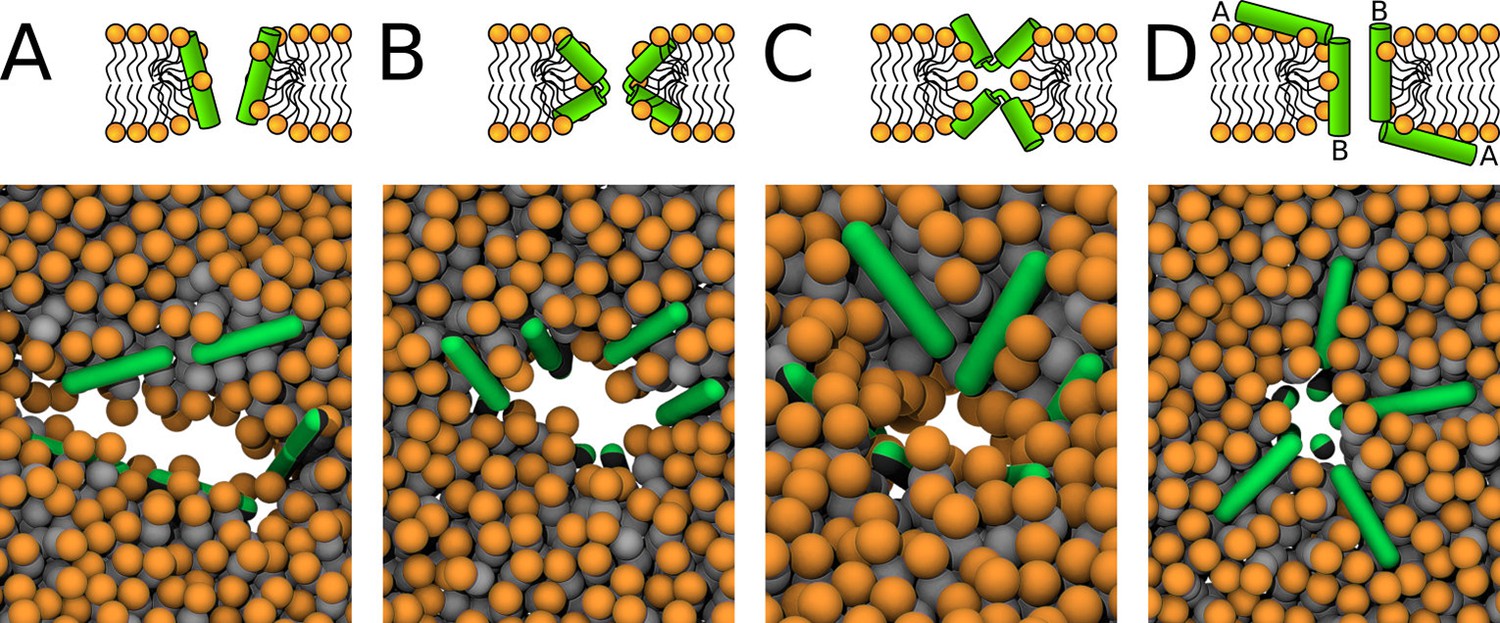
Schematic images (top) and representative simulation snapshots (bottom) of various pore structures.
(A) Toroidal pore with rigid peptides, (B) hourglass pore with flexible peptides, (C) U-shaped pore, and (D) synergistic pore. Schematic images are from a side view, while snapshots are from top view on the membrane. Color coding: lipid headgroup = orange, lipid tail = light gray, hydrophilic = green, hydrophobic = dark gray.
-
Figure 3—source data 1
System configurations for snapshots.
- https://cdn.elifesciences.org/articles/47946/elife-47946-fig3-data1-v1.zip
Figure 4

Representative snapshots of MARTINI simulation of Buforin II peptide in POPC membrane.
Buforin II variants (A) P11L (fully α-helical) and (B) P11G (helix-kink-helix) are shown. (A) Schematic image of barrel-stave pore (top left) and simulation snapshots from side view (left) and top view (right) of the pore are shown. Color coding: hydrophobic residues = dark gray, hydrophilic residues = green, positively charged residues = blue, lipid phosphate group = orange, lipid tail = light gray.
-
Figure 4—source data 1
System configurations for snapshots.
- https://cdn.elifesciences.org/articles/47946/elife-47946-fig4-data1-v1.zip
Figure 5
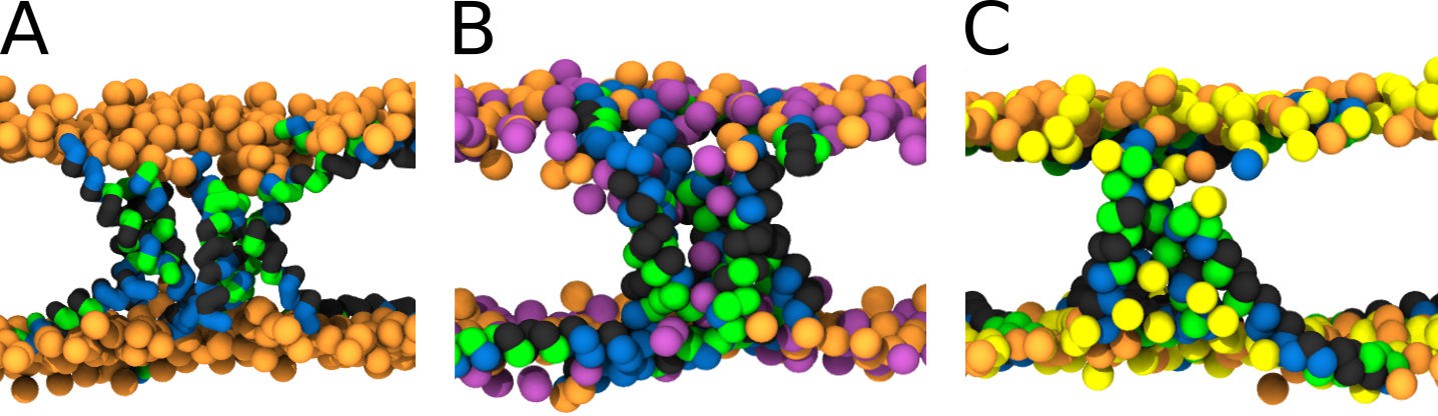
MARTINI simulation snapshots of Buforin II P11L peptide.
Side views on membranes composed of (A) POPC, (B) POPC:POPG (1:1 mol/mol), and (C) POPC:POPS (1:1 mol/mol) lipids are shown. For clarity, only phosphate groups of lipids are shown. Color coding: hydrophobic residues = dark gray, hydrophilic residues = green, positively charged residues = blue, POPC (orange), POPG (purple), and POPS (yellow).
-
Figure 5—source data 1
System configurations for snapshots.
- https://cdn.elifesciences.org/articles/47946/elife-47946-fig5-data1-v1.zip
Figure 6
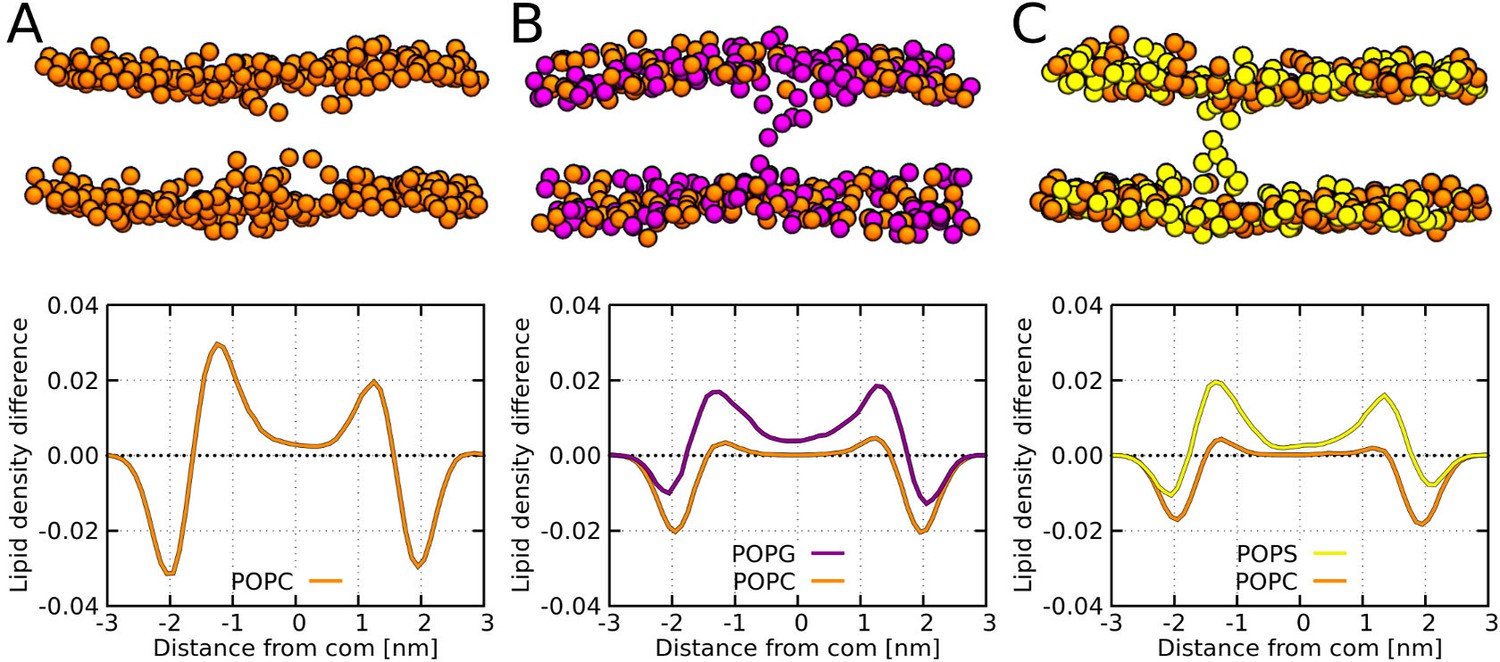
MARTINI simulation snapshots and density profiles of Buforin II P11L peptide.
Differences between density profiles of phosphates within 2.5 nm of the pore center and the rest of the membrane are shown. Membranes composed of (A) POPC, (B) POPC:POPG (1:1 mol/mol), and (C) POPC:POPS (1:1 mol/mol) lipids are shown. For clarity, only phosphate groups are depicted as spheres. Color coding: POPC (orange), POPG (purple), and POPS (yellow).
-
Figure 6—source data 1
System configurations for snapshots and density profiles.
- https://cdn.elifesciences.org/articles/47946/elife-47946-fig6-data1-v1.zip
Figure 7
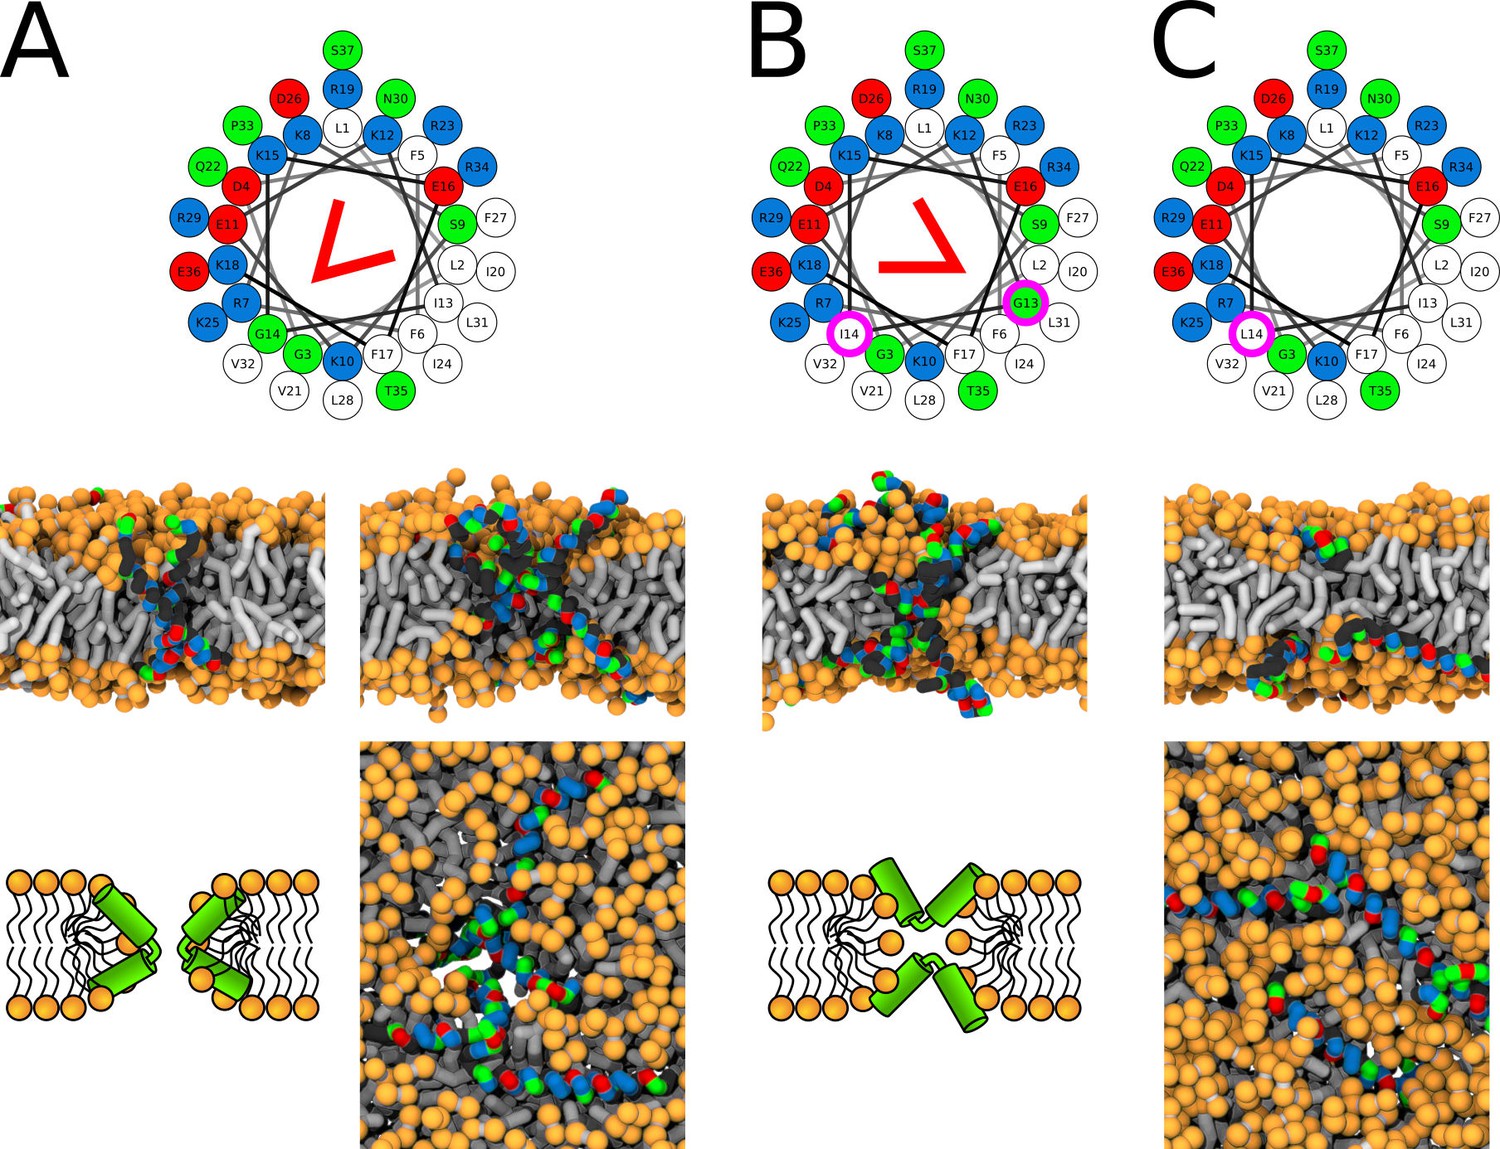
Representative snapshots of MARTINI simulation of LL-37 peptide in POPC membrane.
LL-37 variants (A) WT, (B) I13G/G14I, and (C) G14L are shown. Coloring of the helical wheel (top) corresponds to Wimley-White octanol scale. Red wedge shows position of the kink. The positions of substituted residues are highlighted with magenta circles. Both side (schematic images and snapshots in middle of the figure) and top views (bottom snapshots) on the membrane structures are shown. Color coding of snapshots: hydrophobic residues = dark gray, hydrophilic residues = green, positively charged residues = blue, negatively charged residues = red, lipid phosphate group = orange, lipid tail = light gray.
-
Figure 7—source data 1
System configurations for snapshots.
- https://cdn.elifesciences.org/articles/47946/elife-47946-fig7-data1-v1.zip
Figure 8
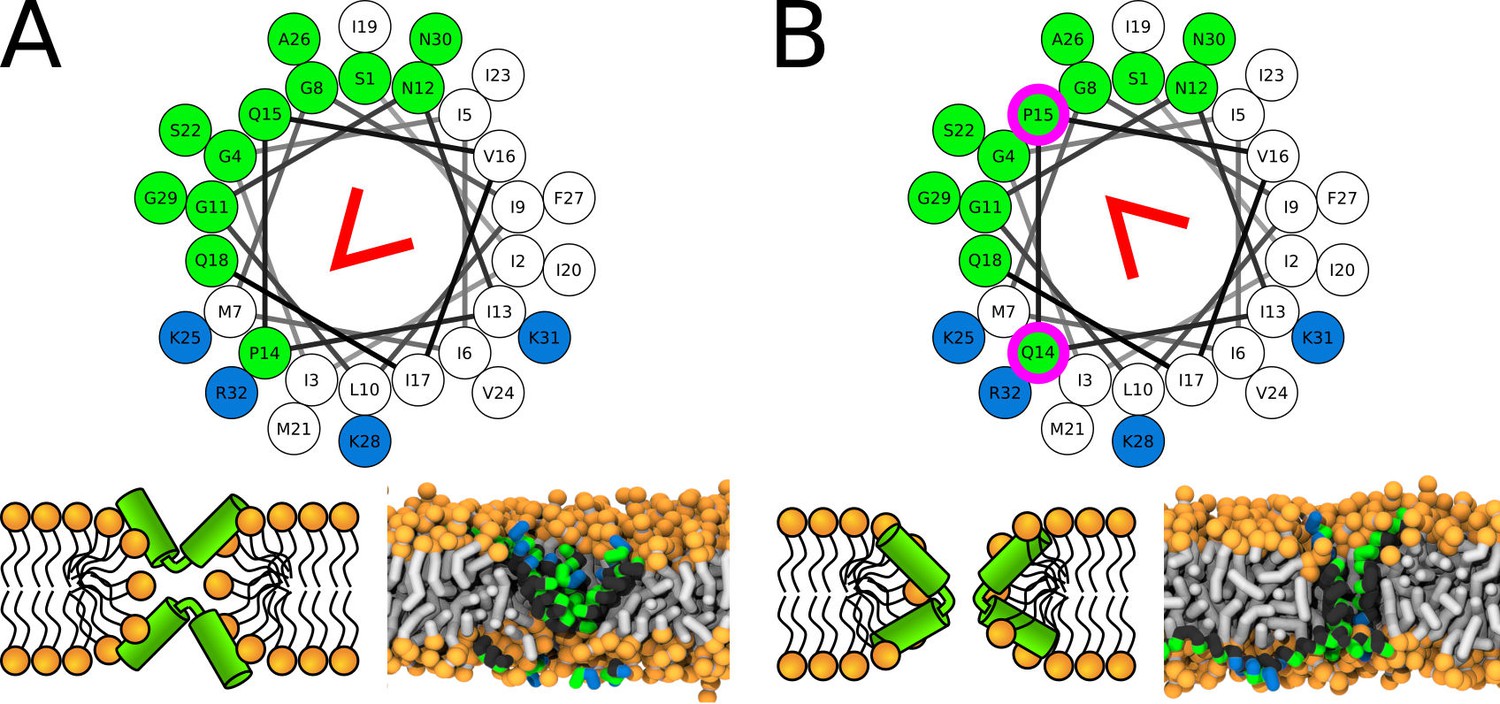
Representative snapshots of MARTINI simulation of CandKR peptide in POPC membrane.
CandKR variants (A) WT and (B) P14Q/Q15P are shown. Coloring of the helical wheel (top) corresponds to Wimley-White octanol scale. Red wedge shows position of the kink. The positions of substituted residues are highlighted with magenta circles. Color coding of snapshots: hydrophobic residues = dark gray, hydrophilic residues = green, positively charged residues = blue, lipid phosphate group = orange, lipid tail = light gray.
-
Figure 8—source data 1
System configurations for snapshots.
- https://cdn.elifesciences.org/articles/47946/elife-47946-fig8-data1-v1.zip
Figure 9
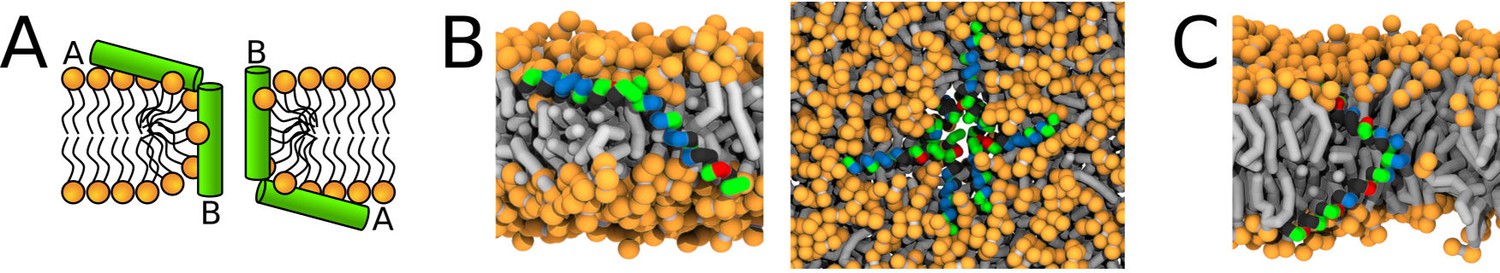
Representative snapshots of MARTINI simulation of Magainin 2 and δ-lysin peptides in POPC membrane.
(A) Schematic image of a synergistic pore structure, (B) side (left) and top (right) views on Magainin 2-formed pores, and (C) side view on two δ-lysin peptides in a pore. Color coding: hydrophobic residues = dark gray, hydrophilic residues = green, positively charged residues = blue, negatively charged residues = red, lipid phosphate group = orange, lipid tail = light gray.
-
Figure 9—source data 1
System configurations for snapshots.
- https://cdn.elifesciences.org/articles/47946/elife-47946-fig9-data1-v1.zip
Figure 10
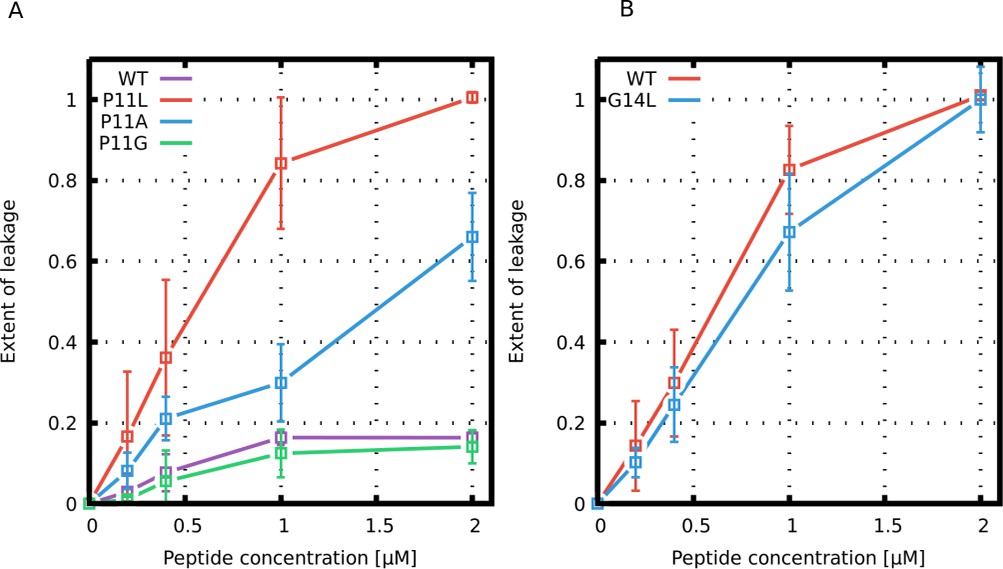
Leakage assay with calcein-loaded large unilamellar vesicles.
Leakage induced by (A) Buforin II and (B) LL-37 derived peptides is shown.
-
Figure 10—source data 1
Vesicle leakages as a function of peptide concentrations.
- https://cdn.elifesciences.org/articles/47946/elife-47946-fig10-data1-v1.zip
Figure 11
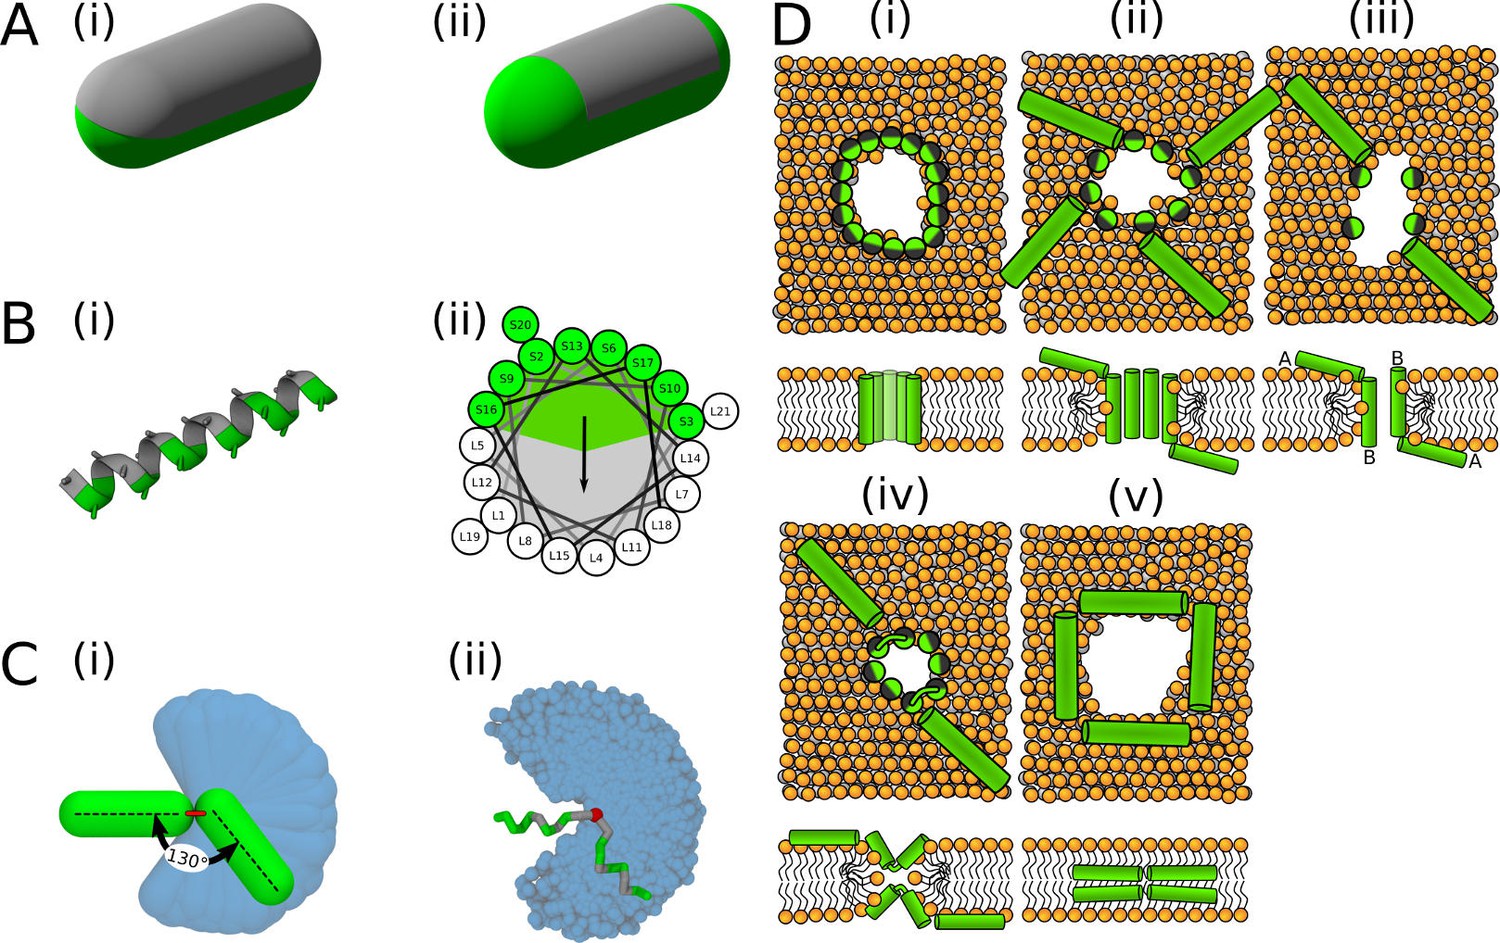
Visualisation of the employed models and initial configurations.
(A) Phenomenological model of half hydrophobic (gray) and half hydrophilic (green) helix peptides. The hydrophobic surface (i) extends till the ends in PSC-AE, or (ii) is confined to the cylindrical part in PSC-NE. A half-hydrophobic peptide (Lear et al., 1988) represented in (i) MARTINI and (ii) helical wheel projection (hydrophobic sector is shown as a gray area). (C) Comparison of the helical kink flexibility using our (i) PSC and (ii) MARTINI models. The central kink is colored in red. A peptide configuration with kink of roughly 130° is depicted on top of the range of available kink configurations depicted in blue. (D) Schematic illustration of the employed initial configurations for simulations with MARTINI model. Each configuration (i–v) is shown in the top and side view in upper and lower row, respectively. Green/gray depicts half hydrophilic/hydrophobic peptides. Lipids are displayed with orange headgroups and silver tails. One to four of these distinct pore structures were used for each peptide as the initial configurations.
Figure 12
MARTINI simulations – initial conditions.
Based on the preferred peptide orientation within membrane pore, couple of initial configuration were suggested and tested. (A) Buforin II peptides (i) 16 peptides oriented perpendicular to membrane plane with antiparallel arrangement in a pre-formed pore, (ii) eight peptides oriented perpendicular to membrane plane with antiparallel arrangement in a pre-formed pore and eight peptides being placed on membrane leaflets parallel to membrane, (B) 8 LL-37 peptides positioned parallel to membrane plane in pre-formed pore with double-belt pore arrangement, (C) eight δ-lysin peptides being positioned parallel to membrane in pre-formed pore with double-belt pore arrangement, (D) Candidalysin peptides (ii) four peptides placed in a pre-formed pore with perpendicular orientation to the membrane plane and four peptides on membrane surface oriented parallel to it, (ii) four peptides in a pre-formed pore in U-shaped conformation and four peptides on membrane, (iii) eight peptides in the pore oriented parallel to the membrane plane as in double-belt pore arrangement, (E) Magainin 2 peptides (I) eight peptides in the pore with antiparallel mutual orientation perpendicular to the membrane plane and eight peptides on membrane with parallel orientation to the membrane plane, and (ii) 16 peptides in the pore with antiparallel mutual orientation perpendicular to the membrane plane. Color coding: Hydrophobic residues = black, hydrophilic residues = green, positively charged residues = blue, negatively charged residues = red, lipid heads = orange, lipid tails = light gray.
-
Figure 12—source data 1
System configurations for snapshots.
- https://cdn.elifesciences.org/articles/47946/elife-47946-fig12-data1-v1.zip
Appendix 1—figure 1
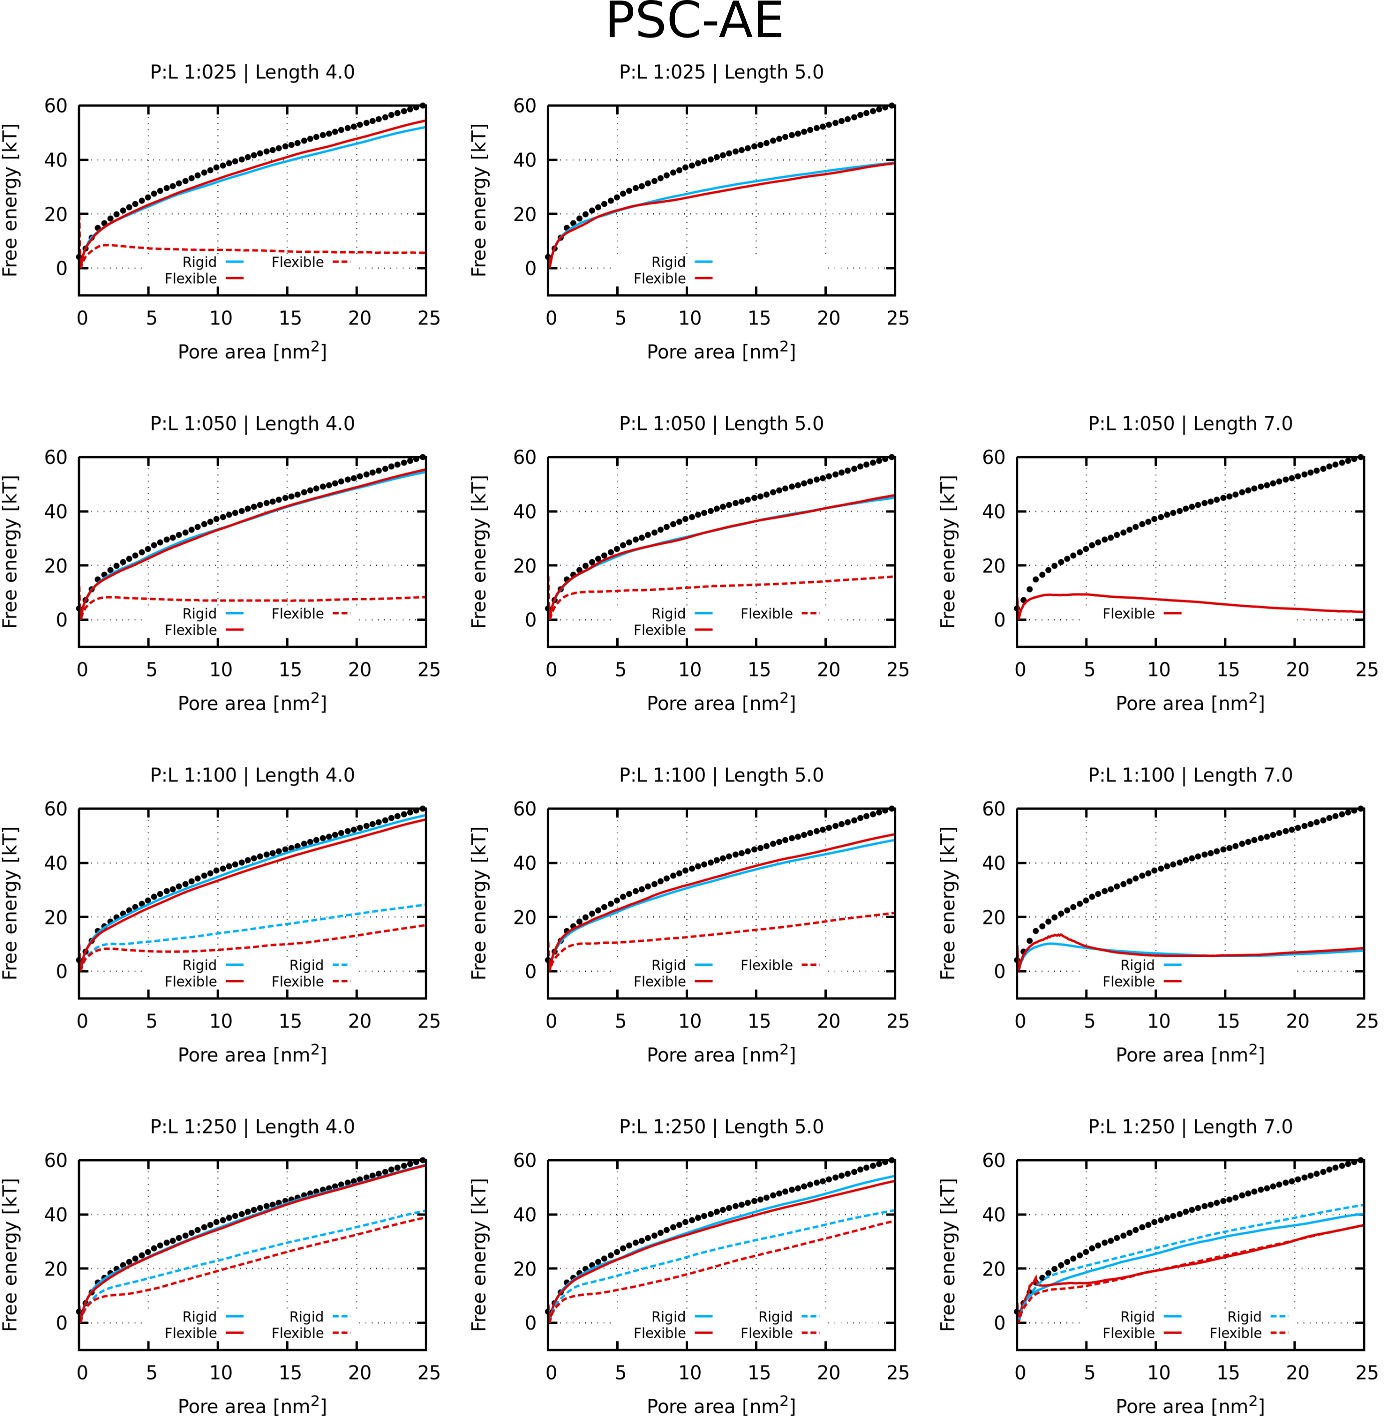
Free energy profiles of pore formation by PSC-AE peptides.
Standard and more hydrophobic PSC-AE peptides are shown in full and dashed lines, respectively. The dotted line corresponds to the free energy profile of our reference system, a pure membrane without any peptides.
Appendix 1—figure 2
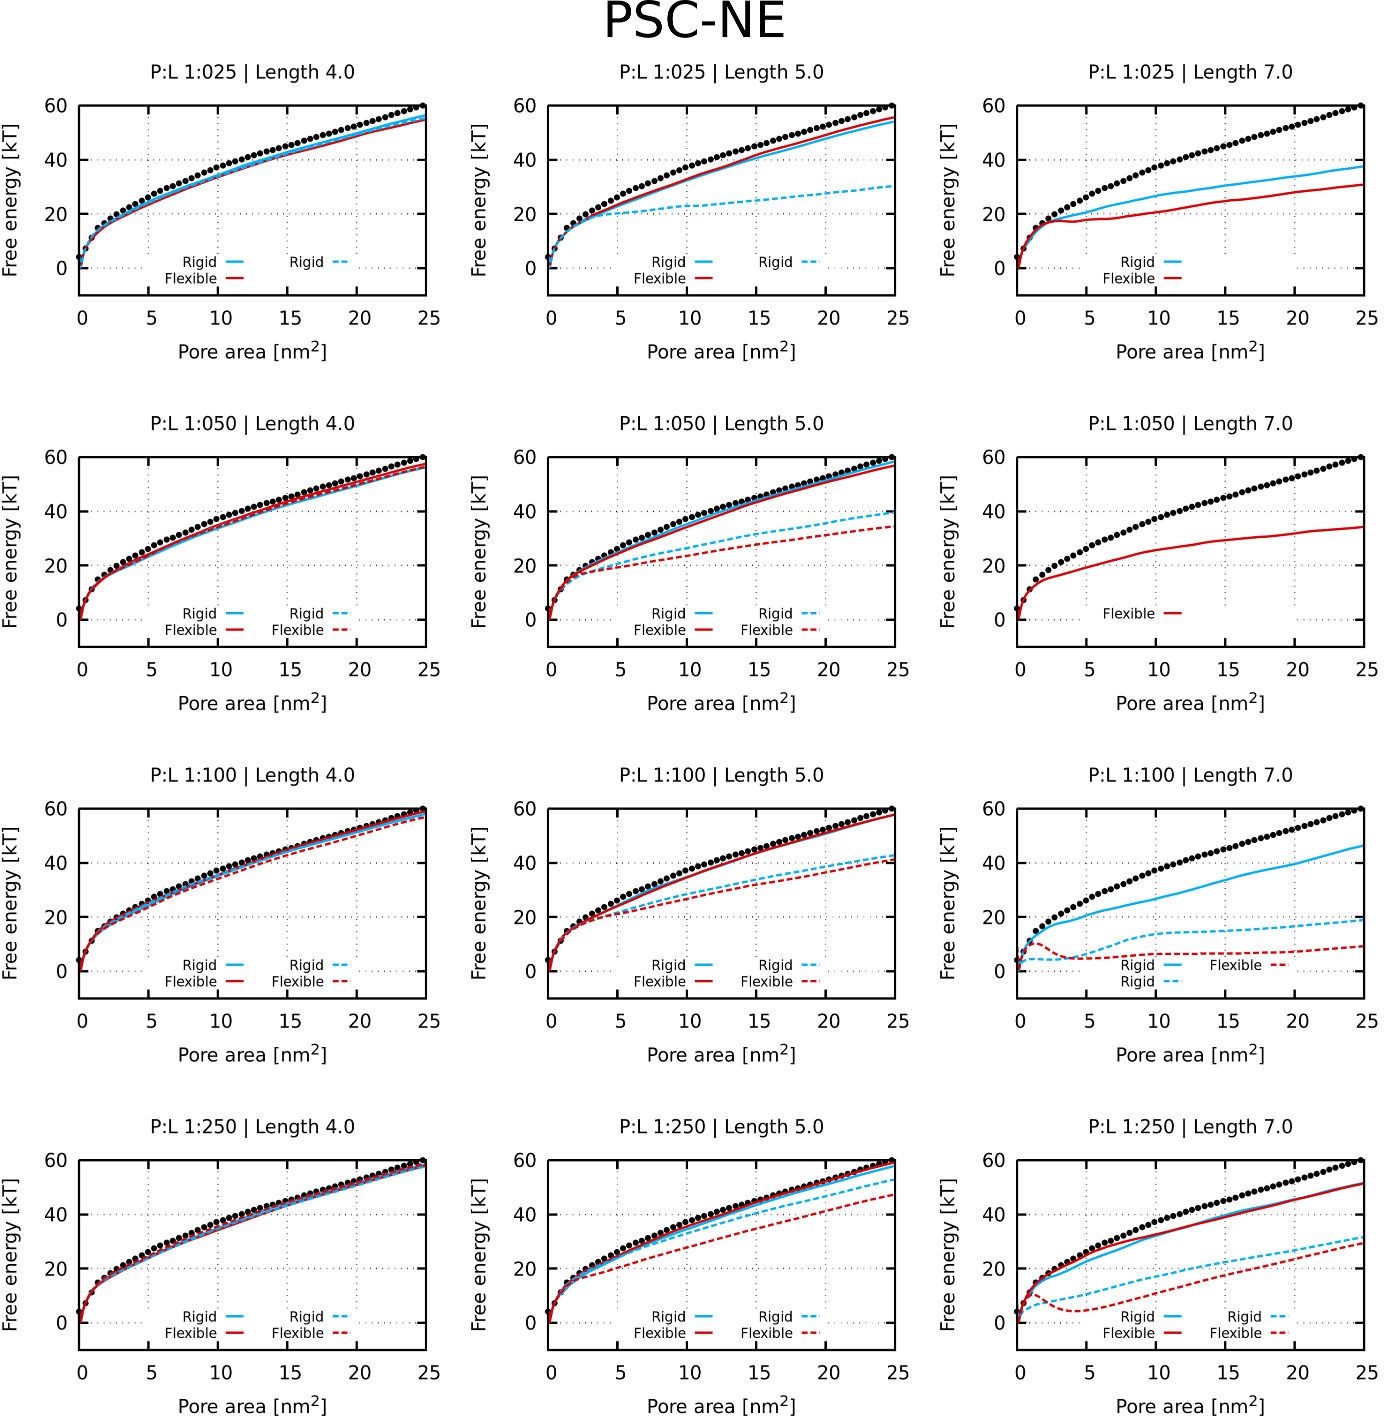
Free energy profiles of pore formation by PSC-NE peptides.
Standard and more hydrophobic PSC-NE peptides are shown in full and dashed lines, respectively. The dotted line corresponds to the free energy profile of our reference system, a pure membrane without any peptides.
Appendix 1—figure 3

Water density profiles for Buforin II peptides.
Note that WT* stands for wild-type sequence where proline residue was forced to be α-helical.
Appendix 1—figure 4
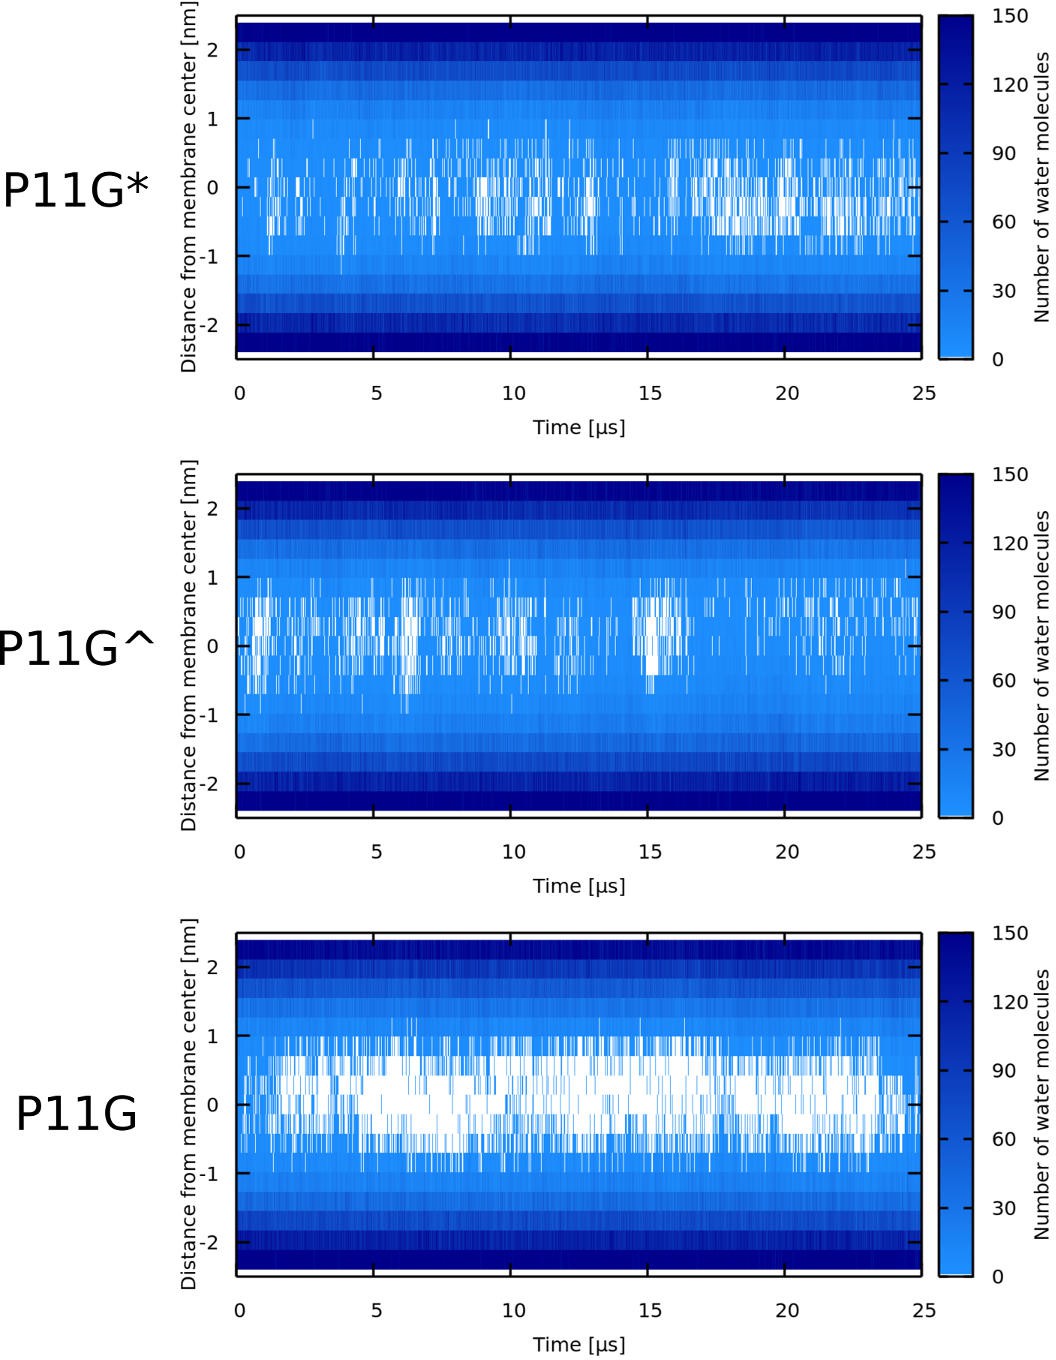
Water density profiles for Buforin II P11G in POPC membrane.
P11G* denotes a sequence that was forced to be α-helical. In case of Buforin II P11G^, only the glycine residue formed the flexible kink.
Appendix 1—figure 5
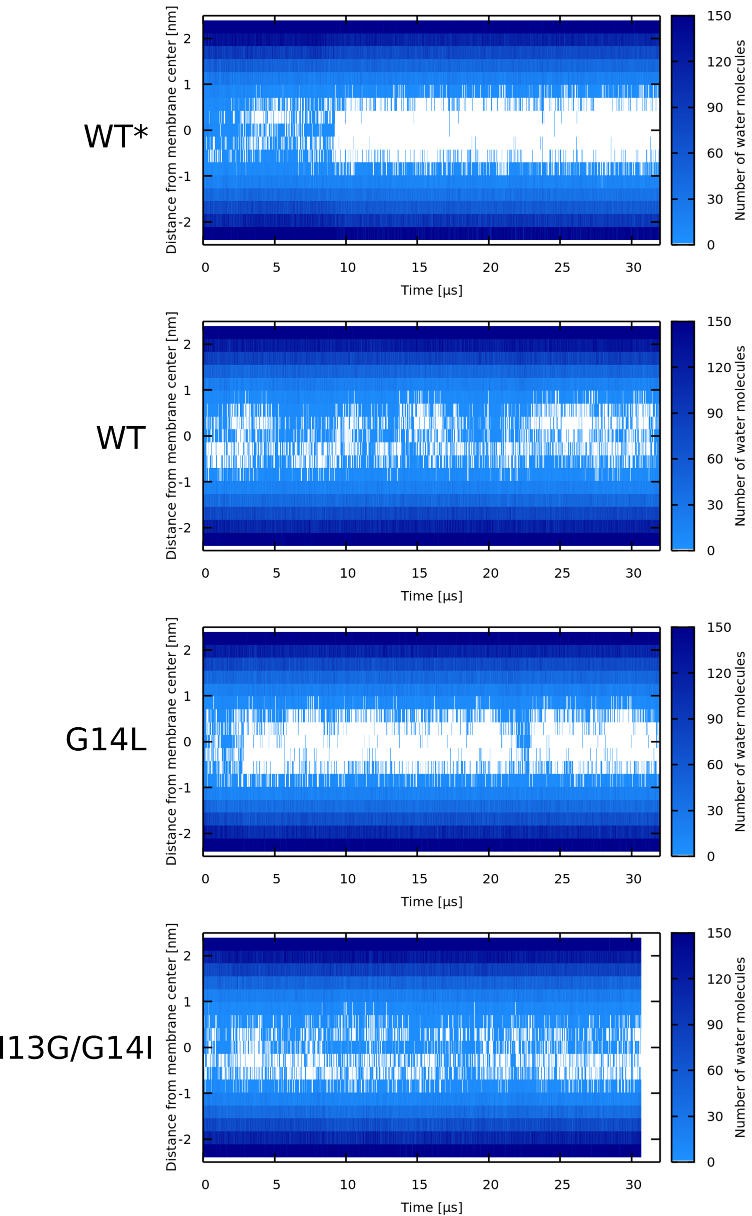
Water density profiles for LL-37 peptides.
Note that WT* stands for wild-type sequence where glycine residue was forced to be α-helical.
Appendix 1—figure 6
Water density profiles for Candidalysin peptides (CandK).
The label describes the starting configuration of the simulation. Note that WT* stands for wild-type sequence where proline residue was forced to be α-helical.
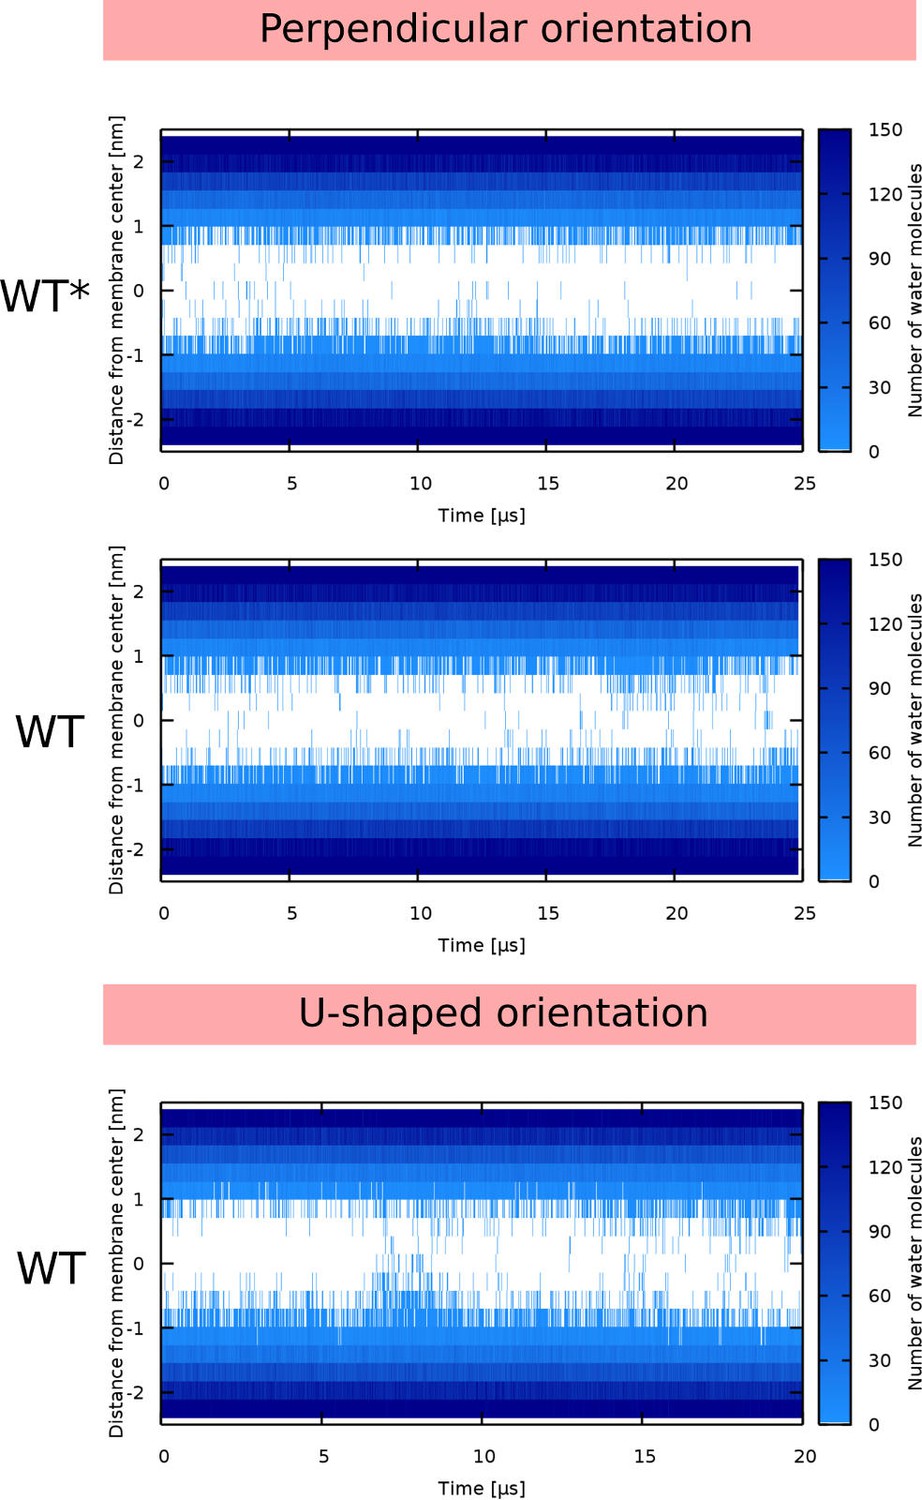
Appendix 1—figure 7
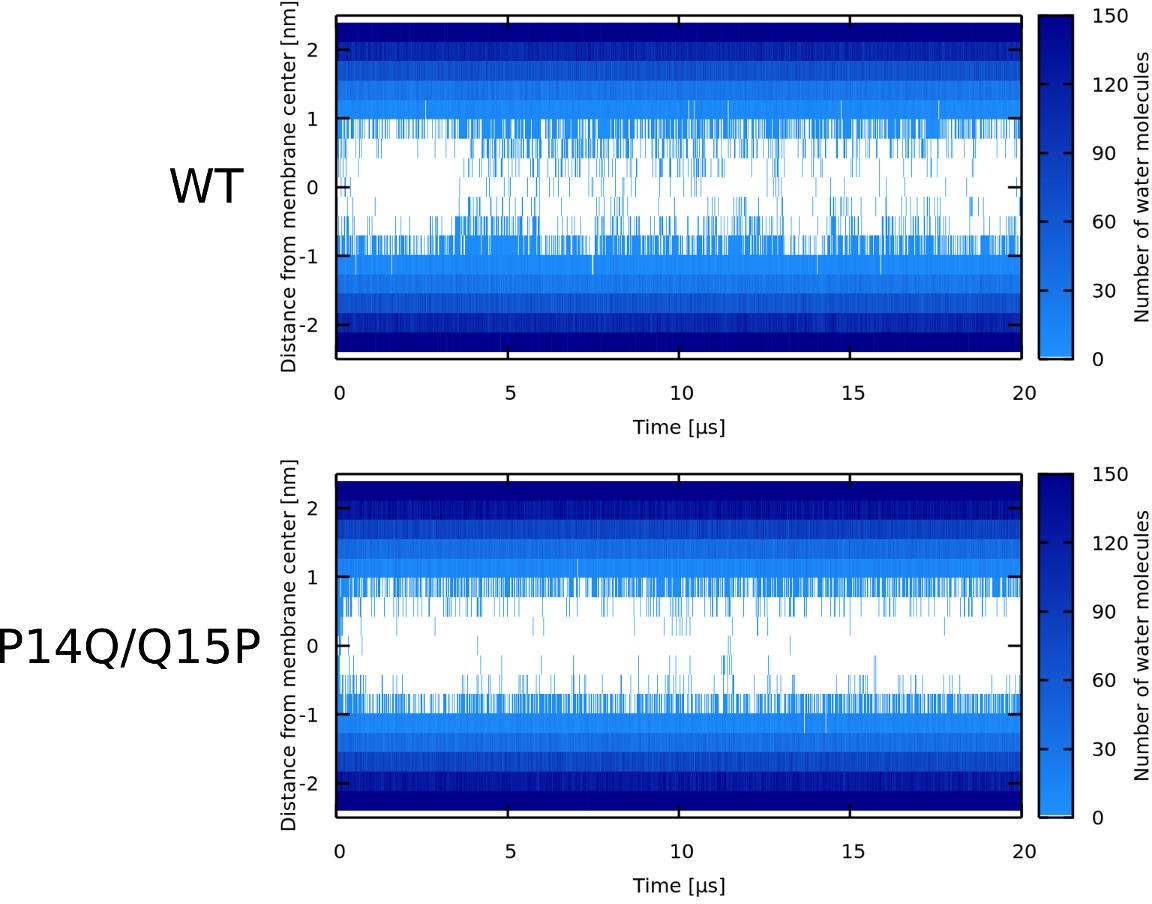
Water density profiles for Candidalysin peptides (CandKR).
Note that WT* stands for wild-type sequence where proline residue was forced to be α-helical.
Appendix 1—figure 8

Water density profiles for δ-lysin peptides.
Note that WT* stands for wild-type sequence where glycine residue was forced to be α-helical.
Appendix 1—figure 9
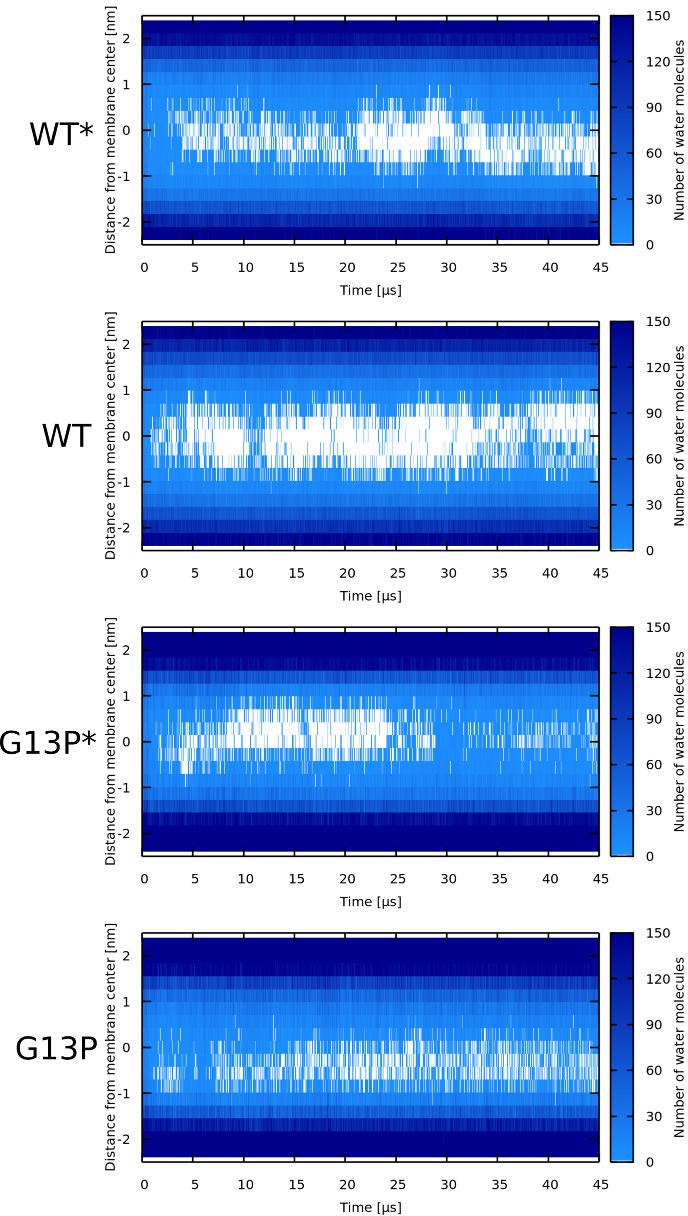
Water density profiles for Magainin 2 peptides.
Note that WT* and G13P* stand for wild-type sequences where kink-forming residues were forced to be α-helical.
Appendix 1—figure 10

Comparison of angles between peptides and z-axis in systems with synergistic interactions.
Phenomenological (PSC-NE) models (red), Magainin 2 peptides (green), and δ-lysin peptides (blue).
Tables
Table 1
Overview of peptides used in MARTINI simulations and observed pore structures.
| Peptide | Variant | Sequence and secondary structure | Pore† |
|---|---|---|---|
| LL-37 | WT | LLGDFFRKSK EKIGKEFKRI VQRIKDFLRN LVPRTES | HG |
| WT* | LLGDFFRKSK EKIGKEFKRI VQRIKDFLRN LVPRTES | – | |
| G14L | LLGDFFRKSK EKILKEFKRI VQRIKDFLRN LVPRTES | – | |
| I13G/G14I | LLGDFFRKSK EKGIKEFKRIVQRIKDFLRN LVPRTES | U | |
| Buforin II | WT | TRSSRAGLQF PVGRVHRLLR K | – |
| WT* | TRSSRAGLQF PVGRVHRLLR K | BP | |
| P11L | TRSSRAGLQF LVGRVHRLLR K | BP | |
| P11A | TRSSRAGLQF AVGRVHRLLR K | BP | |
| P11G | TRSSRAGLQF GVGRVHRLLR K | – | |
| P11G* | TRSSRAGLQF GVGRVHRLLR K | BP | |
| P11G^ | TRSSRAGLQF GVGRVHRLLR K | BP/TP | |
| Magainin 2 | WT | GIGKFLHSAK KFGKAFVGEI MNS | TP |
| WT* | GIGKFLHSAK KFGKAFVGEI MNS | SP | |
| G13P | GIGKFLHSAK KFPKAFVGEI MNS | TP | |
| G13P* | GIGKFLHSAK KFPKAFVGEI MNS | SP | |
| δ-lysin | WT | MAQDIISTIG DLVKWIIDTV NKFTKK | SP |
| WT* | MAQDIISTIG DLVKWIIDTV NKFTKK | TP | |
| CandK | WT | SIIGIIMGIL GNIPQVIQII MSIVKAFKGN K | U |
| WT* | SIIGIIMGIL GNIPQVIQII MSIVKAFKGN K | TP | |
| CandKR | WT | SIIGIIMGIL GNIPQVIQII MSIVKAFKGN KR | U |
| P14Q/Q15P | SIIGIIMGIL GNIQPVIQII MSIVKAFKGN KR | HG |
-
Sequence color coding: α-helix = roman, unstructured = bold. Amino acid substitutions in the peptide sequences are underlined.
∗ a sequence where glycine/proline (usually a kink-forming residues) was forced into an α-helix.
-
^ a sequence where only single residue was defined to be unstructured.
†Toroidal pore (TP); Disordered toroidal pore (DTP); Barrel-stave pore (BP); Hourglass pore (HG); U-shaped pore (U); Synergistic Pore (SP); No pore formation (–).
Table 2
Overview of peptides used in the fluorescence experiments.
| Peptide | Variant | Sequence |
|---|---|---|
| Buforin II | WT | TRSSRAGLQFPVGRVHRLLRK |
| P11L | TRSSRAGLQFLVGRVHRLLRK | |
| P11A | TRSSRAGLQFAVGRVHRLLRK | |
| P11G | TRSSRAGLQFGVGRVHRLLRK | |
| LL-37 | WT | LLGDFFRKSKEKIGKEFKRIVQRIKDFLRNLVPRTES |
| G14L | LLGDFFRKSKEKILKEFKRIVQRIKDFLRNLVPRTES |
-
Positions of the substituted residues are highlighted in bold.
Appendix 1—table 1
Combination of parameters for O-PSC-NE model peptides with rigid and flexible kink.
Effect of peptide length (4.0, 5.0, or 7.0 nm), width of hydrophobic sector (150°, 190°, 180°, 230°, 270°, 310°, 350°), on the formation of different pore structures is depicted.
| Hydrophobic sector [°] | ||||||||||||
|---|---|---|---|---|---|---|---|---|---|---|---|---|
| 150 | 190 | 230 | 270 | 310 | 350 | |||||||
| Length [nm] | flexible | rigid | flexible | rigid | flexible | rigid | flexible | rigid | flexible | rigid | flexible | rigid |
| 4.0 | – | – | – | – | – | – | – | – | – | BP | I/A | I/A |
| 5.0 | – | – | – | – | – | – | TP | BP | I/A | BP | I/A | I/A |
| 7.0 | TP | S/A | TP | TP | TP | DTP | I/A | DTP | I/A | I/A | I/A | I/A |
-
Toroidal pore (TP); Disordered toroidal pore (DTP); Barrel-stave pore (BP); Hourglass pore (HG); U-shaped pore (U); peptide insertion into the membrane without aggregation (I/A); peptide aggregation in solvent (S/A); no membrane binding (–)
Appendix 1—table 2
Number of distinct starting configurations for MARTINI simulations.
| Simulations | |||||
|---|---|---|---|---|---|
| Peptide | Variant | Membrane | Count† | Length [μs] | Figure‡ |
| LL-37 | WT | POPC | 2 | 45, 45 | Figure 7 |
| WT* | POPC | 1 | 67 | – | |
| G14L | POPC | 1 | 90 | Figure 7 | |
| I13G/G14L | POPC | 1 | 67 | Figure 7 | |
| Buforin II | WT | POPC | 3 | 45, 41, 14 | – |
| WT* | POPC | 3 | 45, 33, 21 | – | |
| P11L | POPC | 2 | 34, 27 | Figure 4, Figure 5, Figure 6 | |
| P11L | POPC:POPG (1:1) | 1 | 45 | – | |
| P11A | POPC:POPG (1:1) | 1 | 45 | – | |
| P11G | POPC:POPG (1:1) | 1 | 45 | – | |
| P11G* | POPC:POPG (1:1) | 1 | 45 | – | |
| WT | POPC:POPG (1:1) | 1 | 45 | – | |
| WT* | POPC:POPG (1:1) | 1 | 45 | – | |
| P11L | POPC:POPS (1:1) | 1 | 45 | Figure 5, Figure 6 | |
| P11A | POPC:POPS (1:1) | 1 | 45 | – | |
| P11G | POPC:POPS (1:1) | 1 | 45 | – | |
| P11G* | POPC:POPS (1:1) | 1 | 45 | – | |
| WT | POPC:POPS (1:1) | 1 | 45 | – | |
| WT* | POPC:POPS (1:1) | 1 | 45 | – | |
| P11A | POPC | 2 | 42, 27 | – | |
| P11G | POPC | 1 | 12 | Figure 4 | |
| P11G* | POPC | 2 | 45, 39 | – | |
| P11G^ | POPC | 2 | 45, 17 | – | |
| Magainin 2 | WT | POPC | 2 | 45, 45 | – |
| WT* | POPC | 4 | 45, 45, 45, 45 | Figure 9 | |
| G13P | POPC | 2 | 45, 45 | – | |
| G13P* | POPC | 2 | 45, 45 | – | |
| δ-lysin | WT | POPC | 1 | 44 | Figure 9 |
| WT* | POPC | 1 | 44 | – | |
| CandK | WT | POPC | 2 | 45, 35 | – |
| WT* | POPC | 1 | 49 | – | |
| CandKR | WT | POPC | 4 | 45, 12, 10, 10 | Figure 8 |
| P14Q/Q15P | POPC | 1 | 38 | Figure 8 | |
-
† Number of distinct starting configurations.
‡ List of figures in the main text where representative snapshots of these systems appear.
-
* a sequence where glycine/proline (usually kink-forming residues) was forced into an α-helix.
^ a sequence where only single residue formed the flexible kink.
Appendix 1—table 3
Average number of solvent molecules in the region from −0.9 to 0.9 nm from membrane center in the last 10 µs.
| Peptide | Variant | Membrane | Mean | Standard deviation |
|---|---|---|---|---|
| – | – | POPC | 0.7 | 1.1 |
| LL-37 | WT | POPC | 27.4 | 11.9 |
| WT* | POPC | 9.8 | 6.1 | |
| G14L | POPC | 15.3 | 7.8 | |
| I13G/G14I | POPC | 24.6 | 8.6 | |
| Buforin II | WT | POPC | 10.5 | 7.6 |
| WT* | POPC | 27.6 | 10.3 | |
| P11L | POPC | 43.7 | 17.8 | |
| P11A | POPC | 23.1 | 8.6 | |
| P11G | POPC | 7.7 | 6.0 | |
| P11G* | POPC | 21.4 | 7.4 | |
| P11G^ | POPC | 20.0 | 14.8 | |
| WT | POPC:POPG (1:1) | 4.0 | 3.2 | |
| WT* | POPC:POPG (1:1) | 6.0 | 3.6 | |
| P11L | POPC:POPG (1:1) | 14.9 | 8.0 | |
| P11A | POPC:POPG (1:1) | 5.3 | 3.6 | |
| P11G | POPC:POPG (1:1) | 3.7 | 3.2 | |
| WT | POPC:POPS (1:1) | 3.8 | 3.0 | |
| WT* | POPC:POPS (1:1) | 7.8 | 4.0 | |
| P11L | POPC:POPS (1:1) | 5.4 | 3.6 | |
| P11A | POPC:POPS (1:1) | 7.7 | 4.9 | |
| P11G | POPC:POPS (1:1) | 3.9 | 3.3 | |
| Magainin 2 | WT | POPC | 16.1 | 6.8 |
| WT* | POPC | 30.1 | 8.9 | |
| G13P | POPC | 60.3 | 18.8 | |
| G13P* | POPC | 45.3 | 11.5 | |
| δ-lysin | WT | POPC | 15.8 | 6.8 |
| WT* | POPC | 12.4 | 5.7 | |
| CandK | WT | POPC | 6.9 | 3.4 |
| WT* | POPC | 6.0 | 4.3 | |
| CandKR | WT | POPC | 7.1 | 4.2 |
| P14Q/Q15P | POPC | 6.6 | 4.5 |
-
* a sequence where glycine/proline (usually kink-forming residues) was forced into an α-helix.
^ a sequence where only single residue formed the flexible kink.
-
Lipid ratio is expressed as mol/mol.
Additional files
Download links
A two-part list of links to download the article, or parts of the article, in various formats.
Downloads (link to download the article as PDF)
Open citations (links to open the citations from this article in various online reference manager services)
Cite this article (links to download the citations from this article in formats compatible with various reference manager tools)
Effect of helical kink in antimicrobial peptides on membrane pore formation
eLife 9:e47946.
https://doi.org/10.7554/eLife.47946


