Loss of adaptive capacity in asthmatic patients revealed by biomarker fluctuation dynamics after rhinovirus challenge
- Amsterdam UMC, University of Amsterdam, Netherlands
- University of Basel, Switzerland
- University of Bordeaux, Inserm, Bordeaux Population Health Research Center, UMR 1219, France
Figures
Figure 1
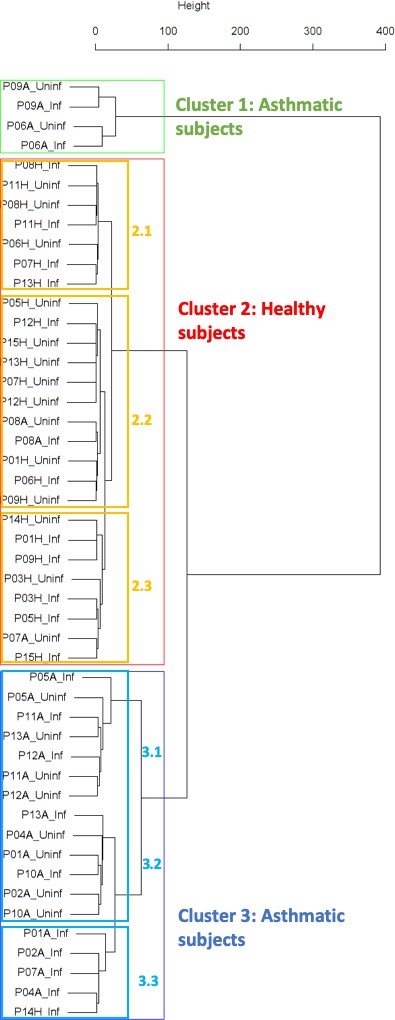
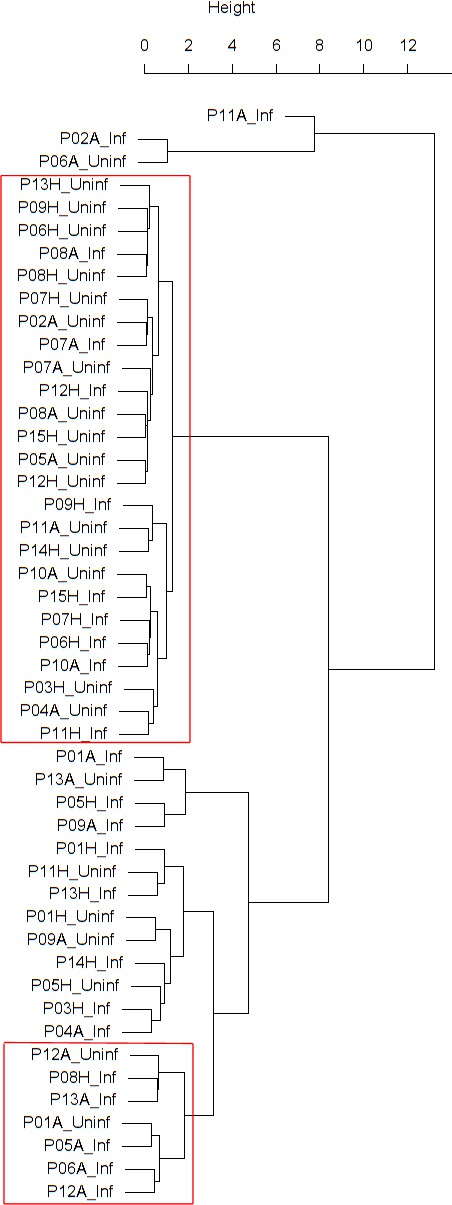
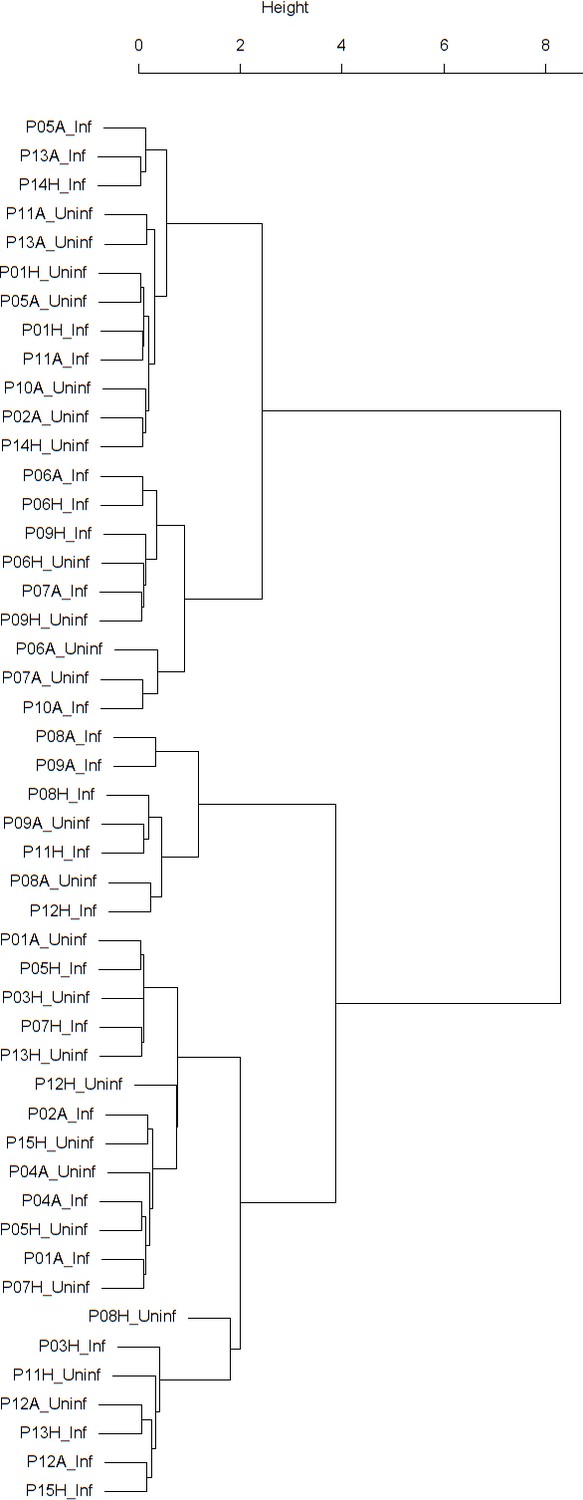
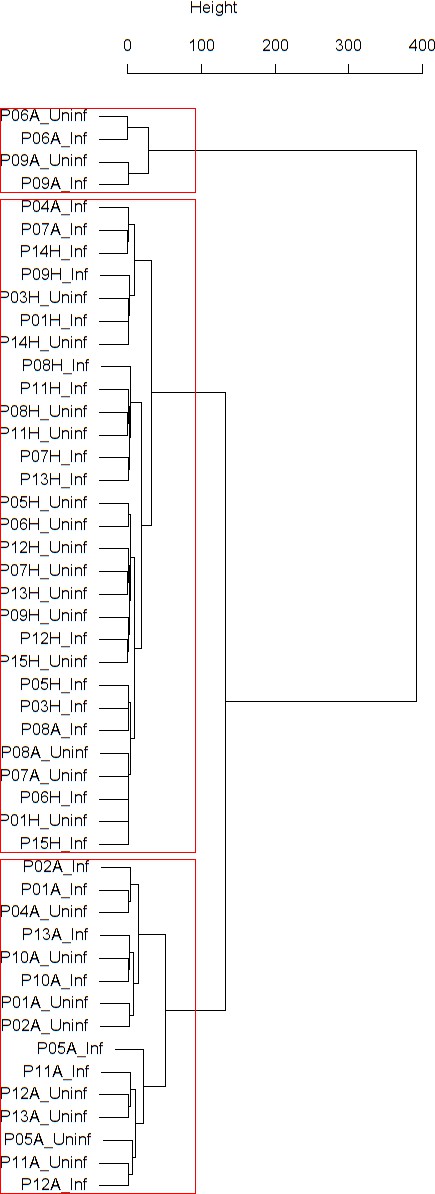
Cluster dendrogram obtained via hierarchical clustering of the participants’ pre- and post-challenge time series of FeNO.
The distance between any two-time series was calculated using the EMD. Rectangles mark the clusters and sub-clusters identified. From top to bottom: Cluster 1, Cluster 2 (subdivided into Clusters 2.1, 2.2, and 2.3), and Cluster 3 (subdivided into Clusters 3.1 and 3.2, and 3.3). Patient IDs are indicated by Pxy, their health status using H/A, denoting Healthy or Asthmatic, and their RV infection status by Uninf/Inf, which stands for Uninfected/Infected. Cluster 1 consists of time series from asthmatics which are prominently different from those from other asthmatic subjects in Cluster three and also from healthy subjects in Cluster 2. These might be regarded as outliers.
Figure 2

Analysis of biomarker time series in healthy and asthmatic populations using the "Earth Mover's Distance" metric.
(A) Depicts two pre-challenge time series of FeNO obtained from a healthy (blue curve), and from an asthmatic (red curve) participant, respectively. (B) Each of the time series is represented as empirical distribution. This representation of the two time series allows for the calculation of a distance or ‘dissimilarity’ between the two by means of the Earth Mover’s Distance (EMD). The EMD-comparison of all possible pairs of time series (both pre- and post-challenge) results in a symmetric matrix of pair-wise distances, as shown in (C) using a color-coded (violet to green) heat-map. Each row in this matrix corresponds to one time series. The color bar on the left hand side of the matrix encodes the ‘type’ of time series: Cyan marks a pre-challenge time series originating from a healthy participant; Blue marks a post-challenge time series originating from a healthy participant; Pink marks a pre-challenge time series originating from an asthmatic participant; Red marks a post-challenge time series originating from an asthmatic participant. The information stored in the matrix of pair-wise distances is then used within an agglomerative clustering algorithm in order to group the time series in different clusters. The outcome of this procedure is represented using a dendrogram as depicted in Figure 1 above.
Figure 3
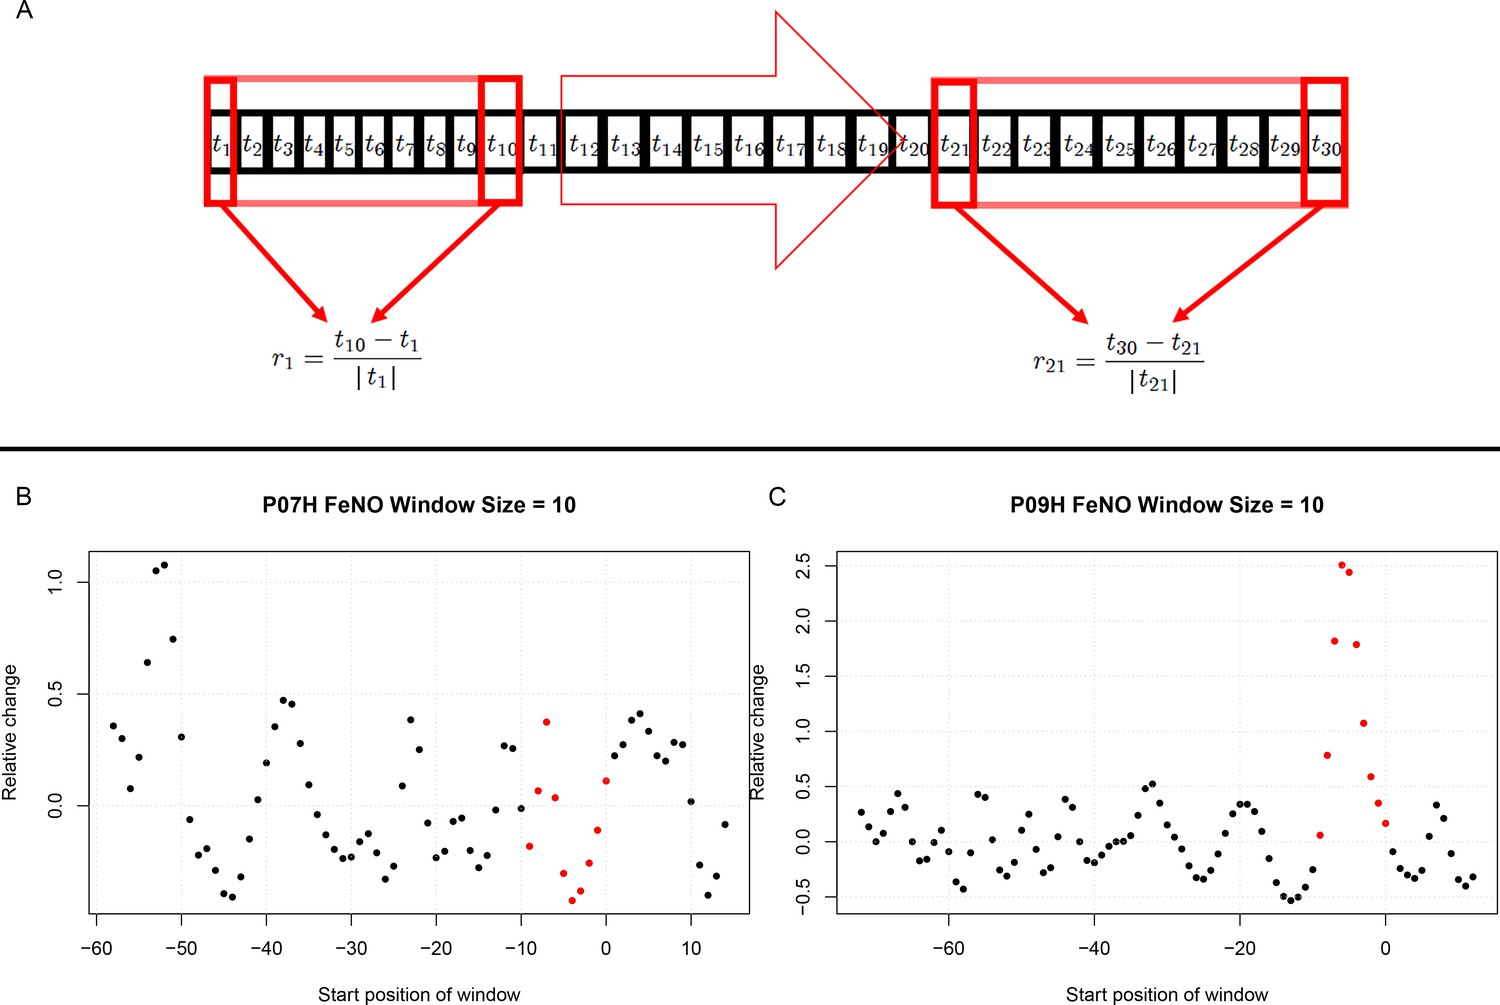
Estimation of short term responses in biomarker time series induced by viral challenge.
(A) Graphical representation of a biomarker time series ti. For the calculation of short-term/transient changes, a gliding interval or window is moved, one day at a time, along the time series. The relative change between the first and last entry of the gliding window is calculated, resulting in a new time series of short-term relative changes ri. (B) A healthy participant’s time series of short-term relative changes in FeNO is depicted. A gliding interval of size 10 days was used to calculate it from the participant’s time series of FeNO measurements. The start position of the gliding window is expressed relative to the day of the viral challenge, which is marked as day 0. When the position of the gliding window was such that the day of the viral challenge was contained within the gliding window, the corresponding value of the relative change is marked in red. In order to assess the statistical significance of the short-term relative changes possibly elicited by the viral challenge, the relative change values located to the left of those marked in red were compared to the values marked in red by means of a Mann-Whitney-U-test. Visual inspection of the time series in B correctly suggests that the outcome of this test is not significant. The reason being that the relative changes within time intervals of 10 days observed prior to the viral challenge are comparable to changes observed within intervals of the same length containing the day of the viral challenge. (C) Depicting data from a different healthy participant, the situation is clearly different, as verified by a significant outcome of the corresponding Mann-Whitney-U-test. In such cases, the participant is called a ‘responder’ with respect to the ‘relative change within 10 days criterion’.
Appendix 1—figure 1
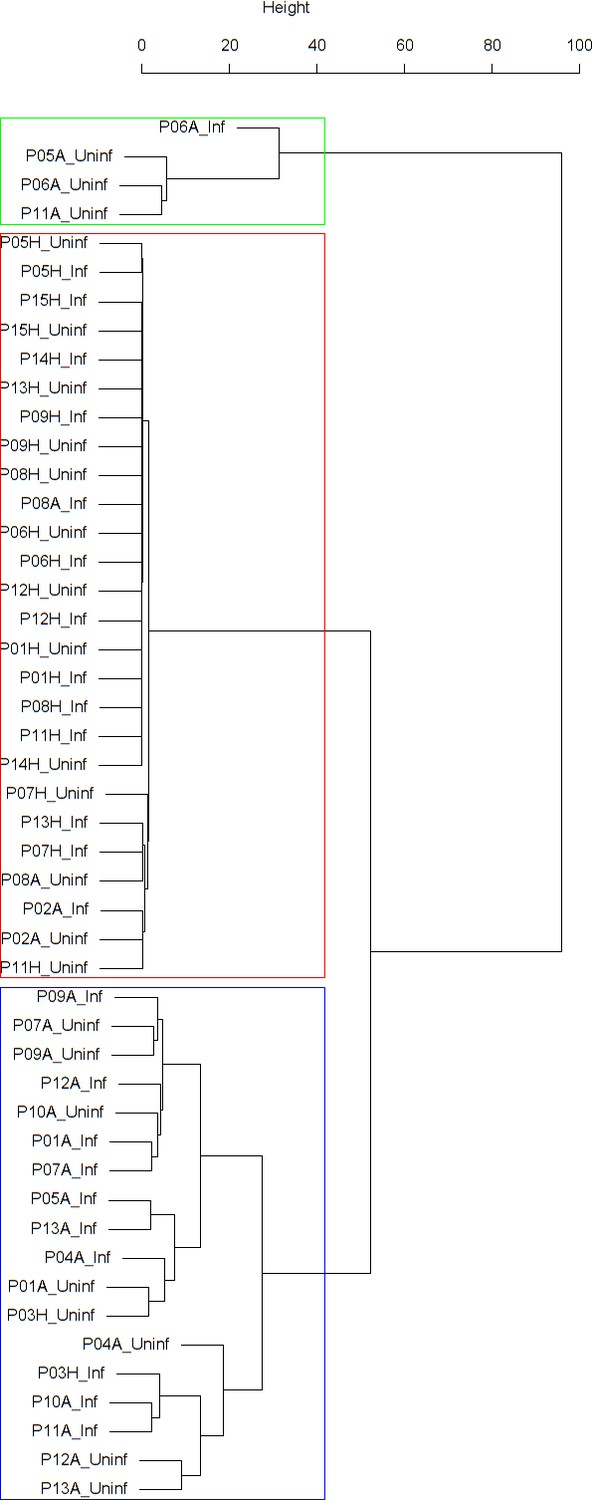
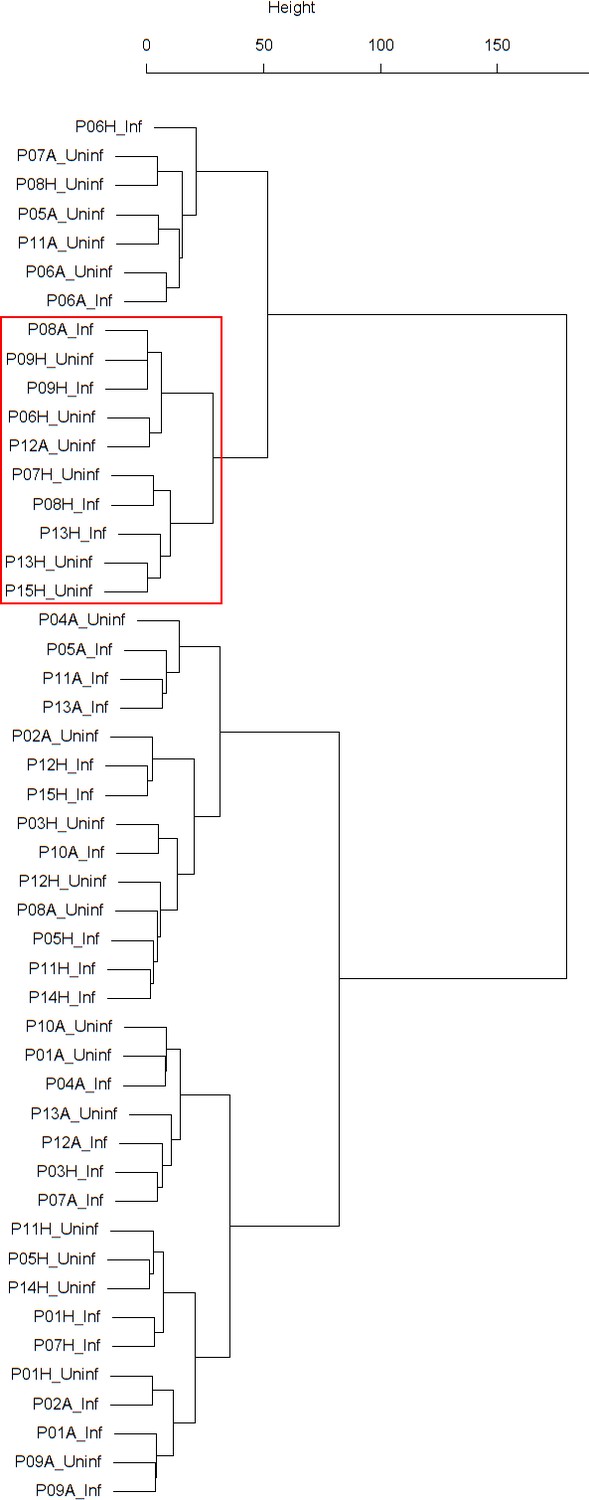
Dendrogram obtained from clustering the participants’ time series of the percentage of eosinophils in nasal lavage fluid using the EMD.
Appendix 1—figure 2

The boxplot to the left represents the distribution of cophenetic distances between time series corresponding to infected healthy participants and their uninfected counterparts.
Only time series belonging to Cluster two in the clustering dendrogram obtained using the percentage of eosinophils in nasal lavage fluid (see Appendix 1—figure 1 above) are contemplated here. The boxplot to the right represents the distribution of cophenetic distances between time series corresponding to infected asthmatic participants and their uninfected counterparts. Only time series belonging to Cluster three in the clustering dendrogram obtained using the percentage of eosinophils in nasal lavage fluid (see Appendix 1—figure 1 above) are contemplated here. The two distributions are statistically significantly different (p-value=8.96e-05, one-tailed Mann-Whitney-U-test, the cophenetic distances in Cluster three being, on average, higher than the ones in Cluster 2.
Appendix 1—figure 3
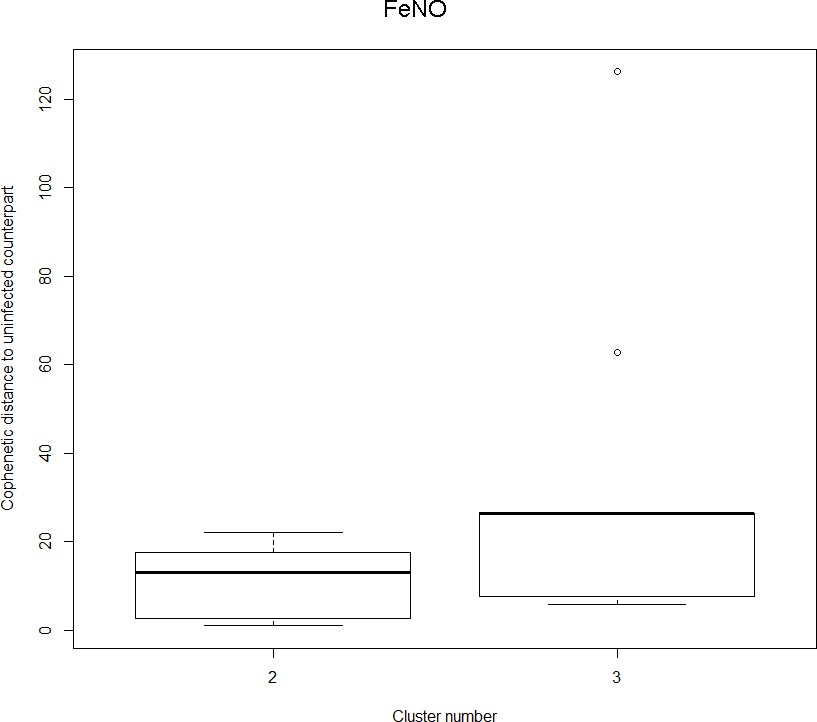
The boxplot to the left represents the distribution of cophenetic distances between time series corresponding to infected healthy participants and their uninfected counterparts.
Only time series belonging to Cluster two in the clustering dendrogram obtained using FeNo data (see Figure 1 in the Main Manuscript) are contemplated here. The boxplot to the right represents the distribution of cophenetic distances between time series corresponding to infected asthmatic participants and their uninfected counterparts. Only time series belonging to Cluster three in the clustering dendrogram obtained using FeNo data (see Figure 1 in the Main Manuscript) are contemplated here. The two distributions are statistically significantly different (p-value=0.033, one-tailed Mann-Whitney-U-test, the cophenetic distances in Cluster three being, on average, higher than the ones in Cluster 2.
Appendix 1—figure 4
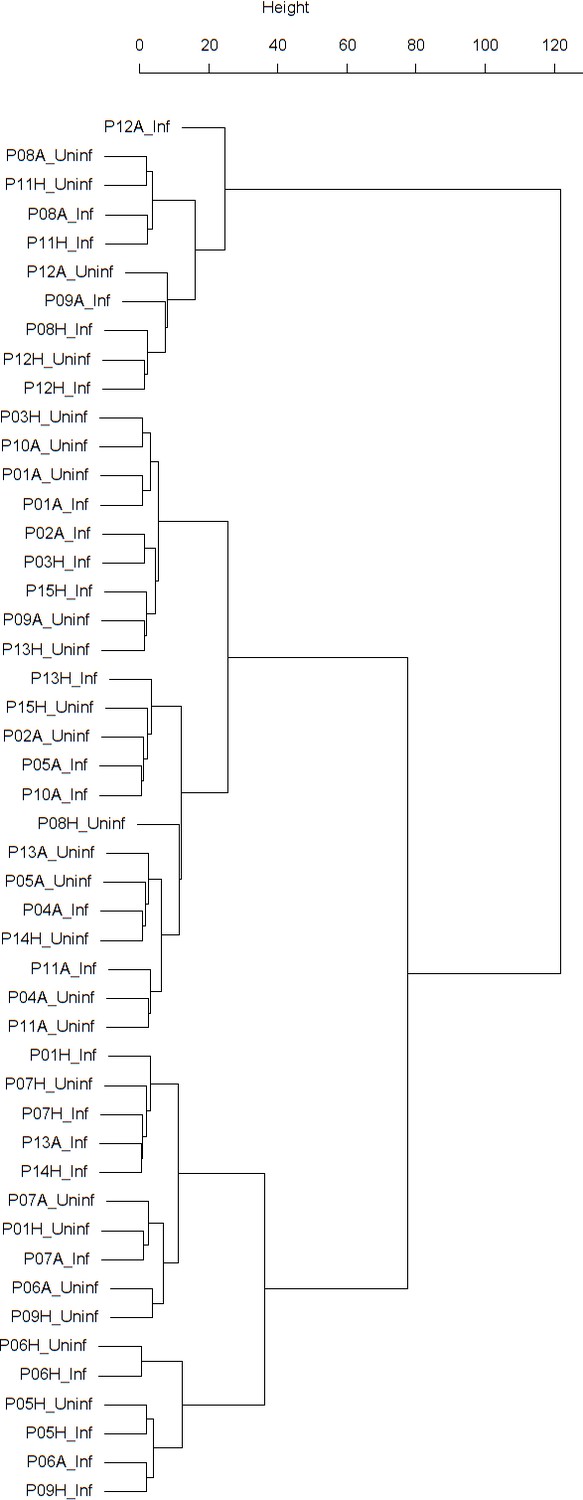
Dendrogram obtained from clustering the participants’ time series of cell density (millions per ml) in nasal lavage fluid using the EMD.
Appendix 1—figure 5
Dendrogram obtained from clustering the participants’ time series of the percentage of neutrophils in nasal lavage fluid using the EMD.
Appendix 1—figure 6

Dendrogram obtained from clustering the participants’ time series of the normalized ratio FEV1/FVC using the EMD.
Appendix 1—figure 7
Dendrogram obtained from clustering the participants’ time series of PEF (% predicted) using the EMD.
Appendix 1—figure 8
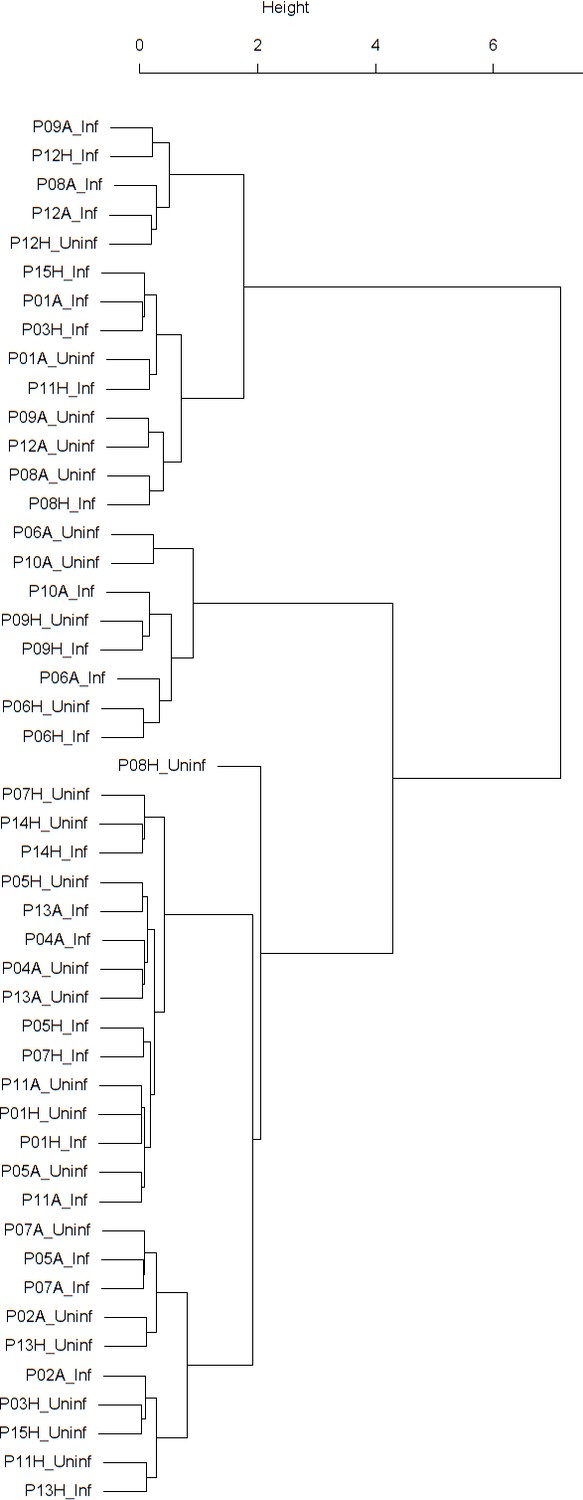
Dendrogram obtained from clustering the participants’ time series of normalized FEV1 using the EMD.
Appendix 1—figure 9
Dendrogram obtained from clustering the participants’ time series of normalized FVC using the EMD.
Appendix 1—figure 10
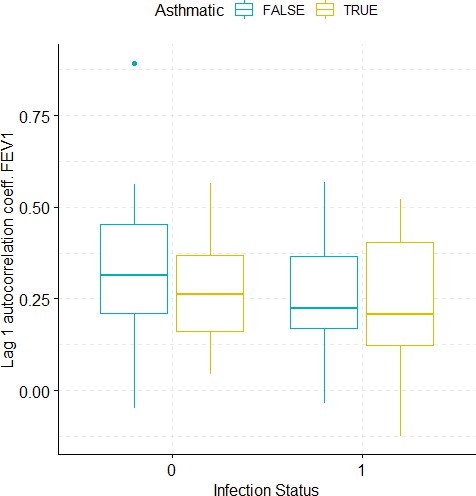
Boxplots demonstrating the distribution of autocorrelation coefficient at 1 day lag for FEV1 before and after viral challenge in healthy and asthma groups.
A 2-way ANOVA resulted in no significant differences.
Appendix 1—figure 11
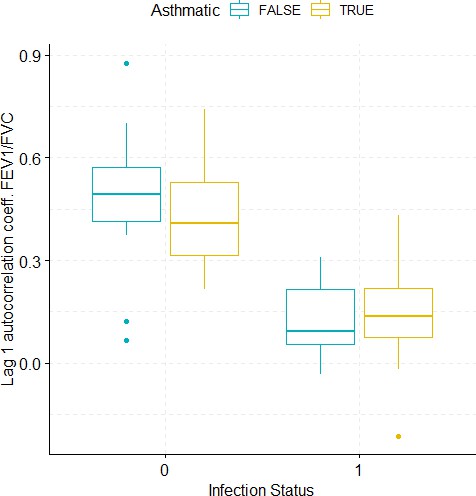
Boxplots demonstrating the distribution of autocorrelation coefficient at 1 day lag for FEV1/FVC before and after viral challenge in healthy and asthma groups.
A 2-way ANOVA resulted in a significant impact of the infection status on the autocorrelation coefficient (p<1e-07).
Appendix 1—figure 12

Boxplots demonstrating the distribution of autocorrelation coefficient at 1 day lag for FVC before and after viral challenge in healthy and asthma groups.
A 2-way ANOVA resulted in a significant impact of the infection status on the autocorrelation coefficient (p=0.0007).
Appendix 1—figure 13

Boxplots demonstrating the distribution of autocorrelation coefficient at 1 day lag for PEF (% predicted) before and after viral challenge in healthy and asthma groups.
The data did not fulfil the conditions for a 2-way ANOVA. Pairwise comparisons were carried out (t-test or Mann-Whitney-test, depending on whether the data fulfilled the conditions for a t-test). The tests used to compare pre- vs. post-challenge status within the two groups (healthy and asthma) were paired tests. Only significant p-values without multiple pairwise-comparison correction are displayed.
Appendix 1—figure 14
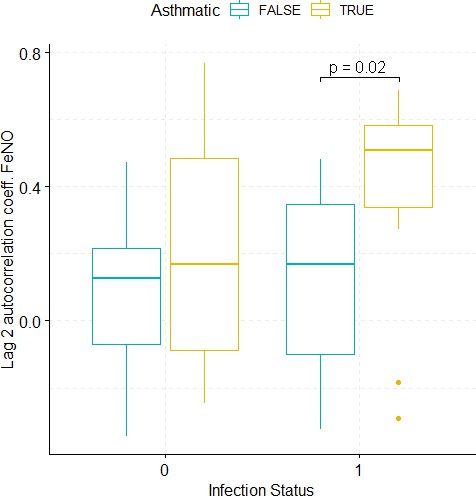
Boxplots demonstrating the distribution of autocorrelation coefficient at 2 days lag for FeNO before and after viral challenge in healthy and asthma groups.
The data did not fulfil the conditions for a 2-way ANOVA. Pairwise comparisons were carried out (t-test or Mann-Whitney-test, depending on whether the data fulfilled the conditions for a t-test). The tests used to compare pre- vs. post-challenge status within the two groups (healthy and asthma) were paired tests. Only significant p-values without multiple pairwise-comparison correction are displayed.
Appendix 1—figure 15
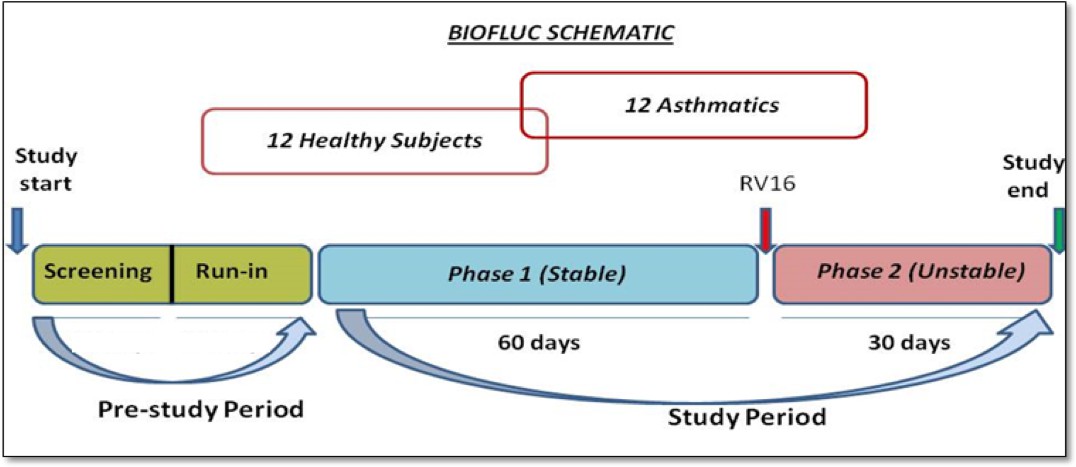
Schematic representation of the study design.
Appendix 1—figure 16
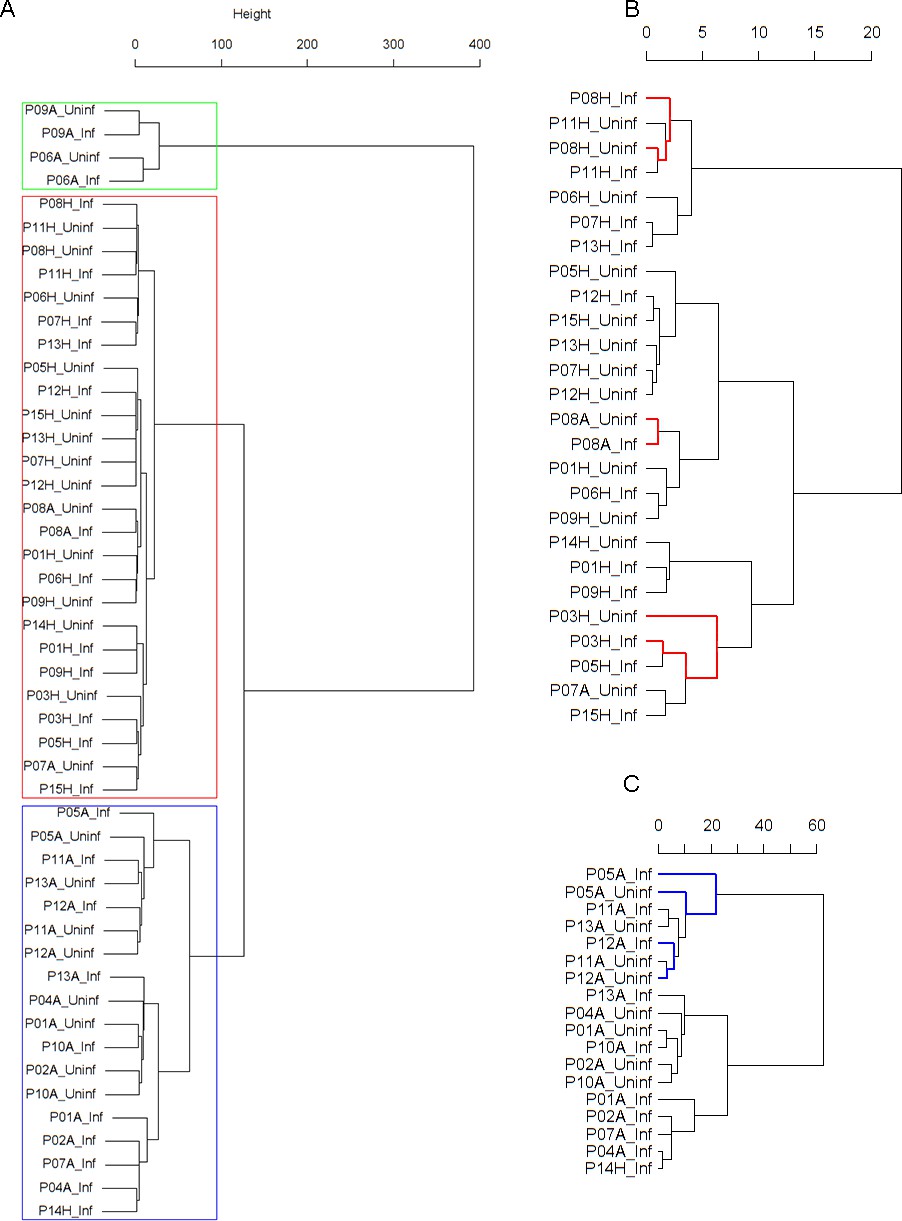
Panel A: Cluster dendrogram obtained via hierarchical clustering of the participants’ pre- and post-challenge time series of FeNO.
The distance between any two-time series was calculated using the EMD. Rectangles mark the clusters identified. Panel B displays a more detailed view of the second cluster. According to the definition of neighboring leaves provided in the text above, the leaves P03H_Uninf and P03H_Inf are neighbors in this dendrogram (highlighted in red). The reason for this is that the cophenetic distance from leaf P03H_Uninf to leaf P03H_Inf is equal to the minimum of all distances from leaf P03H_Uninf to all other leaves in the dendrogram. This is not the case for the leaf P03H_Inf. However, the fact that this condition holds for at least one of the two leaves renders them neighboring. Leaves P08H_Inf and P08H_Uninf, and P11H_Inf and P11H_Uninf, are neighbors, respectively (the latter pair is not marked in color). P08A_Inf and P08A_Uninf are also neighbors; In this case, the minimum condition is fulfilled by both leaves for of this leaf-pair. This is why the two leaves form a two-element cluster in the dendrogram. Panel C displays a more detailed view of the third cluster. Analogous information about neighboring leaves in Cluster three is highlighted in blue. However, as opposed to Cluster 2 (depicted in Panel B), the amount of neighboring leaves in Cluster three is not statistically significant (permutation test, see Table 2 in the Main Manuscript).
Appendix 1—figure 17
Dendrogram obtained from clustering the participants’ pre- and post-challenge average value of FeNO using the EMD.
Tables
Table 1
Biomarkers/parameters measured in each cohort participant during two months before, and during one month immediately after deliberate experimental inoculation with rhinovirus.
The corresponding sampling frequencies can be found in columns 2 and 3. See the Materials and methods section below for more details on the study design, and on the measurement procedures and laboratory assays used. FEV1: forced expiratory volume in one second. FVC: forced vital capacity. PEF: peak expiratory flow. FeNO: fractional expired concentration of nitric oxide.
| Biomarker or parameter | Sampling frequency before rhinovirus challenge | Sampling frequency after rhinovirus challenge |
|---|---|---|
| Lung function (FEV1, FVC, FEV1/FVC, PEF) | 2x daily | 2x daily |
| Exhaled Nitric Oxide (FeNO) | 3x weekly | 3x weekly |
| Eosinophil and neutrophil cell density in nasal lavage fluid | 1x weekly | 3x weekly |
Table 2
Composition, enrichment analysis, and grouping characteristics of the clusters found by comparison of each participant’s pre- and post-challenge time series of FeNO.
Enrichment is marked in bold letters, depletion in italics; the corresponding p-values were calculated using the hypergeometric test. The empirical p-values for the proportion of pre- and post-pairs were calculated using simulated permutations (see Materials and methods section). A participant is fully represented in a given cluster if both their pre- and post-challenge time series of measurements are contained in the cluster. For example, the healthy participant ‘P08H’ is fully represented in Cluster 2, as both their pre- and post-challenge time series of FeNO measurements are members of Cluster 2 (see Figure 1 below). Partial representation corresponds to the scenario in which only one of the two time series (pre- and post-challenge) is a member of the cluster. For instance, the asthmatic participant " P07A’ is only partially represented in Cluster 2, because their pre-challenge time series of FeNO measurements is part of Cluster 2, whereas their post-challenge time series of FeNO belongs to Cluster 3 (see Figure 1 below). See also the Materials and methods section for the definition of neighbors.
| Characteristic \ cluster number | Cluster 1 | Cluster 2 | Cluster 3 |
|---|---|---|---|
| Size (%) | 4 (8.33 %) | 26 (54.17 %) | 18 (37.5 %) |
| Fully represented healthy participants | 0 | 11 | 0 |
| Partially represented healthy participants | 0 | 1 | 1 |
| Fully represented asthmatic participants | 2 | 1 | 8 |
| Partially represented asthmatic participants | 0 | 1 | 1 |
| Number of time series from healthy participants (%) | 0 (0%) | 23 (88.46 %) | 1 (5.56 %) |
| p-value of enrichment/depletion in time series from healthy participants | 0.055 | 1.78E-09 | 1.15E-06 |
| Number of neighboring pre- and post-pairs (%) | 2 (100 %) | 4 (28.57 %) | 2 (20 %) |
| Empirical p-value (probability of observing, under the null hypothesis, the number of neighboring pre- and post-pairs found in the data, as listed in the previous row above) | 0.003 | 0.007 | 0.097 |
Table 3
Enrichment analysis of the sub-clusters found within the clusters described in Table 2 above (the clusters marked with orange and blue rectangles in Figure 1).
Enrichment in pre-challenge time series is marked in bold letters, depletion of pre-challenge time series (and consequently enrichment in post-challenge time series) in italics; the corresponding p-values were calculated using the hypergeometric test.
| Sub-cluster number \ characteristic | Size (%) | Number of pre-challenge series (%) | p-value |
|---|---|---|---|
| Cluster 2.1 | 7 (26.92 %) | 3 (42.86 %) | 0.404 |
| Cluster 2.2 | 11 (42.31 %) | 8 (72.73 %) | 0.104 |
| Cluster 2.3 | 8 (30.77 %) | 3 (37.5 %) | 0.246 |
| Cluster 3.1 and 3.2 | 13 (72.22 %) | 8 (61.54 %) | 0.029 |
| Cluster 3.3 | 5 (27.78 %) | 0 (0.00 %) | 0.029 |
Table 4
Composition, enrichment analysis, and grouping characteristics of the clusters found by comparison of each participant’s pre- and post-challenge time series of percentage of eosinophils in nasal lavage fluid.
Enrichment is marked in bold letters, depletion in italics; the corresponding p-values were calculated using the hypergeometric test. The empirical p-values for the proportion of pre- and post-pairs were calculated using simulated permutations (see Materials and methods section). A participant is fully represented in a given cluster if both their pre- and post-challenge time series of measurements are contained in the cluster. Partial representation corresponds to the scenario in which only one of the two time series (pre- and post-challenge) is a member of the cluster. See also the Materials and methods section for the definition of neighbors.
| Characteristic \ cluster number | Cluster 1 | Cluster 2 | Cluster 3 |
|---|---|---|---|
| Size (%) | 4 (8.33 %) | 26 (54.17 %) | 18 (37.50 %) |
| Fully represented healthy participants | 0 | 11 | 1 |
| Partially represented healthy participants | 0 | 0 | 0 |
| Fully represented asthmatic participants | 1 | 2 | 7 |
| Partially represented asthmatic participants | 2 | 0 | 2 |
| Number of time series from healthy participants (%) | 0 (0%) | 22 (84.62 %) | 2 (11.11 %) |
| p-value of enrichment/depletion in time series from healthy participants | 0.055 | 1.09E-07 | 2.89E-05 |
| Number of neighboring pre- and post-pairs (%) | 1 (33.33 %) | 5 (38.46 %) | 1 (10 %) |
| Empirical p-value (probability of observing, under the null hypothesis, the number of neighboring pre- and post-pairs found in the data, as listed in the previous row above) | 0.123 | 0.001 | 0.424 |
Table 5
Proportions of responders within the groups of healthy and asthmatic participants, respectively.
Two different criteria were used in order to establish a statistically significant response. According to the first criterion, a participant is considered a responder with respect to a given biomarker if the outcome of comparing the pre-challenge time series and the post-challenge time series of the same biomarker by means of the Kolmogorov-Smirnov test results in a p-value<=0.05 (columns 2 and 3). According to the second criterion, a participant is considered a responder with respect to a given biomarker if the outcome of comparing, by means of a Mann-Whitney-U-test, the magnitude of relative changes observed during 10 day time intervals prior to the challenge with the magnitude of relative changes that took place during 10 day time intervals that contained the day of the challenge results in a p-value<=0.05 (columns 4 and 5). For calculating the proportion of responders within each group the p-values were corrected for multiple testing using the false discovery rate (FDR) method of Benjamini and Hochberg. FEV1: forced expiratory volume in one second. FVC: forced vital capacity. PEF: peak expiratory flow. FeNO: fractional expired concentration of nitric oxide. The lung function parameters FEV1 and FVC, and thereby their ratio FEV1/FVC, were normalized using the standardized reference equations recommended by Global Lung Function Initiative (GLI) Task Force for comparisons across different populations.
| Biomarker name | % Healthy responders (distributional changes) | % Asthmatic responders (distributional changes) | % Healthy responders (relative change within 10 days) | % Asthmatic responders (relative change within 10 days) |
|---|---|---|---|---|
| PEF (% of predicted) | 50.0% | 75.0% | 0.0% | 0.0% |
| Normalized FEV1 | 75.0% | 66.7% | 0.0% | 0.0% |
| Normalized FVC | 83.3% | 100.0% | 0.0% | 0.0% |
| Normalized FEV1/FVC | 75.0% | 66.7% | 16.7% | 0.0% |
| FeNO | 8.3% | 0.0% | 41.7% | 8.3% |
| Cell density in nasal lavage fluid | 0.0% | 0.0% | 66.7% | 41.7% |
| Neutrophils in nasal lavage fluid (%) | 0.0% | 0.0% | 25.0% | 16.7% |
| Eosinophils in nasal lavage fluid (%) | 8.3% | 0.0% | 0.0% | 16.7% |
Table 6
The demographics of the study population.
BMI is Body Mass Index. Only one healthy subject smoked two pack years or less 2 years before recruitment to our study, which is considered an insignificant smoking history. FEV1: forced expiratory volume in one second. PEF: peak expiratory flow.
| Demographic features | Healthy | Asthmatic |
|---|---|---|
| Total number, n | 12 | 12 |
| Female gender, n (%) | 7 (58.3%) | 8 (66.7%) |
| Age (years), mean (SD) | 21 ± 1.5 | 22.2 ± 2.2 |
| Ethnicity (Caucasian), n (non-Caucasian, n) | 11 | 9 |
| BMI, mean (SD) | 22.2 ± 1.6 | 22.8 ± 3.1 |
| Smoking (pack years), n | 1 (0.17 PY) | -- |
| Height (centimeters) | 177.7 ± 8.6 | 172.5 ± 13.0 |
| Weight (KG) | 70.4 ± 10.1 | 67.8 ± 12.4 |
| Baseline spirometry | ||
| FEV1 %predicted | 105.7 ± 11.6 | 101.0 ± 10.0 |
| FVC %predicted | 104.2 ± 10.5 | 104.2 ± 10.2 |
| PEF %predicted | 108.4 ± 14.0 | 104.7 ± 12.2 |
| mean ± standard deviation |
Table 7
Basic characteristics of the study population.
| Healthy | Asthmatics |
|---|---|
| No history of episodic chest symptoms | History of episodic chest symptoms |
| Baseline FEV1 ≥ 80% predicted | Baseline FEV1 ≥ 70% predicted |
| AHR to methacholine (PC20) ≥ 19.6 mg/ml | AHR to methacholine (PC20) ≤ 9.8 mg/ml |
| SPT negative for all 12 common Aeroallergens | SPT positive for at least 1 out of 12 common Aeroallergens |
-
FEV1: forced expiratory volume in one second, AHR: Airway Hyper Responsiveness, PC20: Provocative Concentration causing a 20% fall in FEV1, SPT: Skin Prick Test.
Table 8
The overview of different measurements performed in the study along with the frequency of sampling before and after rhino-virus challenge.
Measures 1–4 include repeated measurements and 5,6 represent one-time measurement to screen the subjects for the study. eight refers to the experimental intervention in the study. FEV1: forced expiratory volume in one second. FVC: forced vital capacity. PEF: peak expiratory flow. FeNO: fractional expired concentration of nitric oxide.
| Measurements of biomarkers | Frequency before rhinovirus challenge | Frequency after rhinovirus challenge |
|---|---|---|
| Lung function with pocket-size spirometers (FEV1, FVC, FEV1/FVC, PEF) | 2x daily | 2x daily |
| Exhaled Nitric Oxide (FeNO) | 3x weekly | 3x weekly |
| Differential cell counts | 1x weekly | 3x weekly |
| Asthma Control Questionnaire | 2x daily | 2x daily |
| Spirometry | Performed once during screening to include subjects in the study | |
| Methacholine challenge | Performed once during screening to include subjects in the study | |
| Rhinovirus challenge | Performed after 2 months into the study | |
Appendix 1—table 1
Effectiveness of the viral challenge in asthmatic and healthy participants, respectively.
A participant is considered to have a successful viral inoculation if any one of the three tests is positive. one indicates positive response and 0 indicates a failed response in the corresponding tests indicated in columns.
| Study volunteers | Responders by seroconversion | Responders by RVPCR | Description of symptoms |
|---|---|---|---|
| 01A | 1 | 1 | Running nose, blocked nose and cough |
| 02A | 0 | 1 | Sore throat, blocked nose, full head, coughing and sneezing. |
| 04A | 1 | 0 | Slight symptoms of cold, very mild |
| 05A | 0 | 1 | No clear symptoms |
| 06A | 1 | 1 | Symptoms of cold |
| 07A | 1 | 1 | Minor sore throat, dripping nose, shortness of breath. |
| 08A | 1 | 0 | Sore throat, Probably very mild effect, no other symptoms |
| 09A | 0 | 1 | Running nose, head ache, fever |
| 10A | 1 | 1 | Very mild symptoms |
| 11A | 1 | 1 | Very mild symptoms |
| 12A | 0 | 1 | Cough, blocked nose |
| 13A | 0 | 1 | No clear symptoms |
| 01H | 0 | 1 | Sore throat |
| 03H | 0 | 1 | Sore throat and blocked nose |
| 05H | 1 | 1 | Cough, blocked nose and headache |
| 06H | 0 | 1 | No clear symptoms observed |
| 07H | 1 | 0 | Sneezing, itchy eyes and a little bit of a cough |
| 08H | 1 | 1 | Little bit sore throat |
| 09H | 1 | 1 | Sore throat and little cough |
| 11H | 0 | 0 | Blocked nose and sputum |
| 12H | 1 | 1 | Running nose and sneeze |
| 13H | 1 | 1 | No clear symptoms |
| 14H | 0 | 1 | Cough and blocked nose |
| 15H | 1 | 0 | No clear symptoms |
Appendix 1—table 2
P-values of the group comparisons regarding the Pearson autocorrelation coefficient at respective lags of the biomarker time series as listed in the first column.
When the data did not fulfil the requirements for a 2-way ANOVA, pairwise comparisons were conducted followed by correction for multiple testing using the FDR method.
| Biomarker | Lag | P-values asthmatic vs. healthy participants prechallenge | P-values asthmatic vs. healthy participants postchallenge | P-values prechallenge vs. postchallenge in healthy participants | P-values prechallenge vs. postchallenge in asthmatics | P-values interaction (2-way ANOVA) |
|---|---|---|---|---|---|---|
| Normalized FEV1 | 1 day | 0.4431 | 0.4431 | 0.282 | 0.282 | 0.737 |
| Normalized FEV1/FVC | 1 day | 0.8664 | 0.8664 | <1e-07 | <1e-07 | 0.5439 |
| Normalized FVC | 1 day | 0.233 | 0.233 | 0.0007 | 0.0007 | 0.8475 |
| PEF (% pred.) | 1 day | 0.5062 | 0.5036 | 0.0698 | 0.085 | NA |
| FeNO | 2 days | 0.7349 | 0.082 | 0.822 | 0.4668 | NA |
Appendix 1—table 3
Table displaying individual pre (0) and post (1) challenge autocorrelation coefficient at 1 day lag for FEV1 time series and associated p-values for the permutation tests conducted for assessment of the statistical significance of autocorrelation coefficients.
| Patient ID | Infection Status | 1 Day Lag FEV1 Autocorrelation | p-value |
|---|---|---|---|
| P01H | 0 | 0.254459145 | 0.006506 |
| P03H | 0 | 0.312001154 | 0.001425 |
| P05H | 0 | 0.382177632 | 0.000269 |
| P06H | 0 | 0.211190711 | 0.012607 |
| P07H | 0 | 0.203643391 | 0.03083 |
| P08H | 0 | 0.892125011 | <1e-6 |
| P09H | 0 | 0.318646957 | 0.000124 |
| P11H | 0 | 0.468008235 | <1e-6 |
| P12H | 0 | 0.562942585 | <1e-6 |
| P13H | 0 | −0.04987845 | 0.624876 |
| P14H | 0 | 0.447072337 | 6.00E-06 |
| P15H | 0 | 0.07979159 | 0.40799 |
| P01H | 1 | −0.035719445 | 0.82705 |
| P03H | 1 | 0.210750544 | 0.168883 |
| P05H | 1 | 0.408335039 | 0.009061 |
| P06H | 1 | 0.170326229 | 0.235598 |
| P07H | 1 | 0.166055078 | 0.245054 |
| P08H | 1 | 0.351014932 | 0.01394 |
| P09H | 1 | 0.464704837 | 0.001356 |
| P11H | 1 | 0.118074713 | 0.441357 |
| P12H | 1 | 0.207205794 | 0.181322 |
| P13H | 1 | 0.23673266 | 0.154677 |
| P14H | 1 | 0.56839312 | 2.50E-05 |
| P15H | 1 | 0.266373414 | 0.083097 |
| P01A | 0 | 0.200343624 | 0.062003 |
| P02A | 0 | 0.563837497 | <1e-6 |
| P04A | 0 | 0.239868384 | 0.028328 |
| P05A | 0 | 0.324114603 | 0.000172 |
| P06A | 0 | 0.348780303 | 0.000185 |
| P07A | 0 | 0.281945873 | 0.007739 |
| P08A | 0 | 0.508133817 | <1e-6 |
| P09A | 0 | 0.431528538 | 1.30E-05 |
| P10A | 0 | 0.168128839 | 0.062336 |
| P11A | 0 | 0.143276594 | 0.213631 |
| P12A | 0 | 0.043561404 | 0.67349 |
| P13A | 0 | 0.088531828 | 0.346438 |
| P01A | 1 | 0.419735569 | 0.003491 |
| P02A | 1 | 0.06814773 | 0.658923 |
| P04A | 1 | −0.124379351 | 0.493534 |
| P05A | 1 | 0.113506601 | 0.489726 |
| P06A | 1 | 0.429691697 | 0.001788 |
| P07A | 1 | 0.328041565 | 0.04651 |
| P08A | 1 | 0.142697377 | 0.326261 |
| P09A | 1 | 0.522358207 | 0.000105 |
| P10A | 1 | 0.125421761 | 0.389942 |
| P11A | 1 | 0.399401262 | 0.039162 |
| P12A | 1 | 0.183075563 | 0.32647 |
| P13A | 1 | 0.234323344 | 0.114713 |
Appendix 1—table 4
Table displaying individual pre (0) and post (1) challenge autocorrelation coefficient at 1 day lag for FEV1/FVC time series and associated p-values for the permutation tests conducted for assessment of the statistical significance of autocorrelation coefficients.
| Patient ID | Infection Status | 1 Day Lag FEV1/FVC Autocorrelation | p-value |
|---|---|---|---|
| P01H | 0 | 0.373461691 | 4.10E-05 |
| P03H | 0 | 0.532232344 | <1e-6 |
| P05H | 0 | 0.543561238 | <1e-6 |
| P06H | 0 | 0.699807531 | <1e-6 |
| P07H | 0 | 0.426087784 | 1.00E-06 |
| P08H | 0 | 0.656421903 | <1e-6 |
| P09H | 0 | 0.426194186 | <1e-6 |
| P11H | 0 | 0.875863699 | <1e-6 |
| P12H | 0 | 0.537767103 | <1e-6 |
| P13H | 0 | 0.122385415 | 0.240757 |
| P14H | 0 | 0.451348312 | 2.00E-06 |
| P15H | 0 | 0.065590774 | 0.469086 |
| P01H | 1 | 0.079120865 | 0.62836 |
| P03H | 1 | 0.082082101 | 0.591717 |
| P05H | 1 | −0.018492583 | 0.839892 |
| P06H | 1 | 0.307412139 | 0.028927 |
| P07H | 1 | −0.033268988 | 0.799478 |
| P08H | 1 | 0.156116543 | 0.144275 |
| P09H | 1 | 0.094516003 | 0.527785 |
| P11H | 1 | 0.215213314 | 0.13104 |
| P12H | 1 | 0.222717123 | 0.151388 |
| P13H | 1 | 0.221338946 | 0.183907 |
| P14H | 1 | −0.019789083 | 0.892886 |
| P15H | 1 | 0.0903505 | 0.516396 |
| P01A | 0 | 0.374048773 | 0.00036 |
| P02A | 0 | 0.287963001 | 0.003205 |
| P04A | 0 | 0.214051937 | 0.051278 |
| P05A | 0 | 0.579846615 | <1e-6 |
| P06A | 0 | 0.320989582 | 0.000793 |
| P07A | 0 | 0.497773172 | 2.00E-06 |
| P08A | 0 | 0.741401108 | <1e-6 |
| P09A | 0 | 0.61597128 | <1e-6 |
| P10A | 0 | 0.292115551 | 0.001014 |
| P11A | 0 | 0.510405399 | 5.00E-06 |
| P12A | 0 | 0.388760481 | 0.000102 |
| P13A | 0 | 0.428254592 | 1.00E-06 |
| P01A | 1 | 0.245018821 | 0.094571 |
| P02A | 1 | 0.339272642 | 0.024686 |
| P04A | 1 | 0.068042933 | 0.72154 |
| P05A | 1 | 0.123030146 | 0.430305 |
| P06A | 1 | 0.43121459 | 0.001864 |
| P07A | 1 | 0.209480725 | 0.195097 |
| P08A | 1 | −0.213598501 | 0.119532 |
| P09A | 1 | 0.149361152 | 0.276512 |
| P10A | 1 | 0.077200085 | 0.598176 |
| P11A | 1 | 0.163280273 | 0.438443 |
| P12A | 1 | −0.019360275 | 0.916728 |
| P13A | 1 | 0.084470792 | 0.574956 |
Appendix 1—table 5
Table displaying individual pre (0) and post (1) challenge autocorrelation coefficient at 1 day lag for FVC time series and associated p-values for the permutation tests conducted for assessment of the statistical significance of autocorrelation coefficients.
| Patient ID | Infection Status | 1 Day Lag FVC Autocorrelation | p-value |
|---|---|---|---|
| P01H | 0 | 0.566972433 | <1e-6 |
| P03H | 0 | 0.436365475 | 1.10E-05 |
| P05H | 0 | 0.465971785 | 7.00E-06 |
| P06H | 0 | 0.640739895 | <1e-6 |
| P07H | 0 | 0.189205156 | 0.044844 |
| P08H | 0 | 0.90035042 | <1e-6 |
| P09H | 0 | 0.329621329 | 6.40E-05 |
| P11H | 0 | 0.758209436 | <1e-6 |
| P12H | 0 | 0.739080801 | <1e-6 |
| P13H | 0 | 0.042633778 | 0.679417 |
| P14H | 0 | 0.538541079 | <1e-6 |
| P15H | 0 | 0.275286764 | 0.003684 |
| P01H | 1 | 0.259356651 | 0.110413 |
| P03H | 1 | 0.179338037 | 0.241313 |
| P05H | 1 | 0.353179143 | 0.02498 |
| P06H | 1 | 0.169544692 | 0.236277 |
| P07H | 1 | 0.100365821 | 0.484466 |
| P08H | 1 | 0.231434951 | 0.112321 |
| P09H | 1 | 0.729801074 | <1e-6 |
| P11H | 1 | 0.185429238 | 0.220647 |
| P12H | 1 | 0.450384055 | 0.00285 |
| P13H | 1 | 0.020855678 | 0.901048 |
| P14H | 1 | 0.271008078 | 0.059202 |
| P15H | 1 | 0.326461968 | 0.028183 |
| P01A | 0 | 0.271994439 | 0.010138 |
| P02A | 0 | 0.438907563 | 5.00E-06 |
| P04A | 0 | 0.262286425 | 0.016387 |
| P05A | 0 | 0.712236062 | <1e-6 |
| P06A | 0 | 0.410534972 | 1.70E-05 |
| P07A | 0 | 0.203604433 | 0.057294 |
| P08A | 0 | 0.731352747 | <1e-6 |
| P09A | 0 | 0.590921928 | <1e-6 |
| P10A | 0 | 0.229274362 | 0.012014 |
| P11A | 0 | 0.299616931 | 0.009238 |
| P12A | 0 | 0.339086145 | 0.000807 |
| P13A | 0 | 0.439003821 | <1e-6 |
| P01A | 1 | 0.218598655 | 0.140146 |
| P02A | 1 | 0.270949027 | 0.076421 |
| P04A | 1 | −0.073928076 | 0.69089 |
| P05A | 1 | 0.293313312 | 0.062662 |
| P06A | 1 | 0.250391409 | 0.074608 |
| P07A | 1 | 0.189131405 | 0.254627 |
| P08A | 1 | 0.178045115 | 0.225613 |
| P09A | 1 | 0.445823622 | 0.001069 |
| P10A | 1 | −0.001582542 | 0.991459 |
| P11A | 1 | 0.456235007 | 0.025106 |
| P12A | 1 | 0.235389493 | 0.193009 |
| P13A | 1 | 0.123712298 | 0.408539 |
Appendix 1—table 6
Table displaying individual pre (0) and post (1) challenge autocorrelation coefficient at 1 day lag for PEF (% predicted) time series and associated p-values for the permutation tests conducted for assessment of the statistical significance of autocorrelation coefficients.
| Patient ID | Infection Status | 1 Day Lag PEF (% pred.) Autocorrelation | p-value |
|---|---|---|---|
| P01H | 0 | 0.20931285 | 0.025684 |
| P03H | 0 | 0.472289454 | <1e-6 |
| P05H | 0 | 0.431529163 | 2.30E-05 |
| P06H | 0 | 0.159205269 | 0.061348 |
| P07H | 0 | 0.353319402 | 9.00E-05 |
| P08H | 0 | 0.5547174 | <1e-6 |
| P09H | 0 | 0.556029042 | <1e-6 |
| P11H | 0 | 0.395824905 | 1.00E-05 |
| P12H | 0 | 0.352609112 | 0.000503 |
| P13H | 0 | 0.35119991 | 0.000595 |
| P14H | 0 | 0.402389428 | 1.70E-05 |
| P15H | 0 | 0.54985376 | <1e-6 |
| P01H | 1 | 0.488137429 | 0.001568 |
| P03H | 1 | 0.036320181 | 0.812622 |
| P05H | 1 | −0.058331926 | 0.719869 |
| P06H | 1 | 0.369715029 | 0.010815 |
| P07H | 1 | 0.008216799 | 0.954193 |
| P08H | 1 | 0.256946281 | 0.070942 |
| P09H | 1 | 0.145828174 | 0.335955 |
| P11H | 1 | 0.245096978 | 0.104066 |
| P12H | 1 | 0.159620218 | 0.302733 |
| P13H | 1 | 0.1689537 | 0.271384 |
| P14H | 1 | 0.382046159 | 0.007018 |
| P15H | 1 | 0.193711859 | 0.227004 |
| P01A | 0 | 0.771975809 | <1e-6 |
| P02A | 0 | 0.178970869 | 0.073432 |
| P04A | 0 | 0.244996288 | 0.025515 |
| P05A | 0 | 0.185148797 | 0.039857 |
| P06A | 0 | 0.576945862 | <1e-6 |
| P07A | 0 | 0.448316304 | 1.10E-05 |
| P08A | 0 | 0.401445077 | 3.90E-05 |
| P09A | 0 | 0.385012408 | 0.000101 |
| P10A | 0 | 0.363852864 | 4.60E-05 |
| P11A | 0 | 0.116865011 | 0.282604 |
| P12A | 0 | 0.259095938 | 0.010966 |
| P13A | 0 | 0.330342847 | 0.000308 |
| P01A | 1 | 0.662163321 | <1e-6 |
| P02A | 1 | 0.202406559 | 0.184951 |
| P04A | 1 | 0.152123058 | 0.419598 |
| P05A | 1 | 0.063184538 | 0.703673 |
| P06A | 1 | 0.527353781 | 3.40E-05 |
| P07A | 1 | 0.24076991 | 0.140734 |
| P08A | 1 | 0.278277054 | 0.061281 |
| P09A | 1 | 0.721164295 | <1e-6 |
| P10A | 1 | 0.282769697 | 0.04905 |
| P11A | 1 | 0.082807179 | 0.477035 |
| P12A | 1 | 0.199423959 | 0.28367 |
| P13A | 1 | 0.04844711 | 0.74762 |
Appendix 1—table 7
Table displaying individual pre (0) and post (1) challenge autocorrelation coefficient at 2 days lag for FeNo time series and associated p-values for the permutation tests conducted for assessment of the statistical significance of autocorrelation coefficients.
| Patient ID | Infection Status | 2 Days Lag FeNO Autocorrelation | p-value |
|---|---|---|---|
| P01H | 0 | 0.321709552 | 0.2069 |
| P03H | 0 | 0.472331673 | 0.0687 |
| P05H | 0 | 0.105726872 | 0.7053 |
| P06H | 0 | 0.046826106 | 0.7172 |
| P07H | 0 | 0.231741841 | 0.3424 |
| P08H | 0 | 0.204582651 | 0.4323 |
| P09H | 0 | −0.343752612 | 0.0976 |
| P11H | 0 | −0.074771481 | 0.6224 |
| P12H | 0 | −0.110383598 | 0.6075 |
| P13H | 0 | 0.209107713 | 0.4296 |
| P14H | 0 | 0.14699793 | 0.4745 |
| P15H | 0 | −0.068181818 | 0.8054 |
| P01H | 1 | 0.314640112 | 0.3257 |
| P03H | 1 | 0.347121123 | 0.1962 |
| P05H | 1 | 0.124169987 | 0.6886 |
| P06H | 1 | 0.471311475 | 0.2051 |
| P07H | 1 | 0.21485574 | 0.4629 |
| P08H | 1 | −0.323361823 | 0.24 |
| P09H | 1 | −0.125 | 0.6982 |
| P11H | 1 | −0.289915966 | 0.332 |
| P12H | 1 | 0.352217742 | 0.2175 |
| P13H | 1 | −0.068493151 | 0.8668 |
| P14H | 1 | −0.091701293 | 0.7732 |
| P15H | 1 | 0.48125 | 0.0963 |
| P01A | 0 | 0.480394648 | 0.1001 |
| P02A | 0 | −0.244220459 | 0.2641 |
| P04A | 0 | −0.118700159 | 0.6458 |
| P05A | 0 | 0.103762095 | 0.6641 |
| P06A | 0 | 0.499676405 | 0.0264 |
| P07A | 0 | 0.735824043 | 0.0056 |
| P08A | 0 | −0.078914 | 0.7154 |
| P09A | 0 | −0.24540991 | 0.3058 |
| P10A | 0 | 0.004185217 | 0.9877 |
| P11A | 0 | 0.767363801 | 0.0018 |
| P12A | 0 | 0.46670556 | 0.0491 |
| P13A | 0 | 0.233558057 | 0.3441 |
| P01A | 1 | 0.579931923 | 0.0017 |
| P02A | 1 | 0.467260719 | 0.1566 |
| P04A | 1 | −0.291343669 | 0.3435 |
| P05A | 1 | −0.183087917 | 0.584 |
| P06A | 1 | 0.465145092 | 0.1357 |
| P07A | 1 | 0.272687609 | 0.3678 |
| P08A | 1 | 0.574961598 | 0.0605 |
| P09A | 1 | 0.360470496 | 0.2155 |
| P10A | 1 | 0.595921815 | 0.0443 |
| P11A | 1 | 0.685927733 | 0.0121 |
| P12A | 1 | 0.546008265 | 0.0609 |
| P13A | 1 | 0.632651662 | 0.0136 |
Additional files
-
Supplementary file 1
Plots of the time series of relative changes within 10 days for each biomarker.
- https://cdn.elifesciences.org/articles/47969/elife-47969-supp1-v4.zip
-
Supplementary file 2
Plots of the time series of each biomarker.
- https://cdn.elifesciences.org/articles/47969/elife-47969-supp2-v4.zip
-
Transparent reporting form
- https://cdn.elifesciences.org/articles/47969/elife-47969-transrepform-v4.pdf
Download links
A two-part list of links to download the article, or parts of the article, in various formats.
Downloads (link to download the article as PDF)
Open citations (links to open the citations from this article in various online reference manager services)
Cite this article (links to download the citations from this article in formats compatible with various reference manager tools)
Loss of adaptive capacity in asthmatic patients revealed by biomarker fluctuation dynamics after rhinovirus challenge
eLife 8:e47969.
https://doi.org/10.7554/eLife.47969


