Electrocorticographic dissociation of alpha and beta rhythmic activity in the human sensorimotor system
- University of California, Berkeley, United States
- Radboud University, Netherlands
- UMC Utrecht, Netherlands
- Utrecht University, Netherlands
Figures
Figure 1
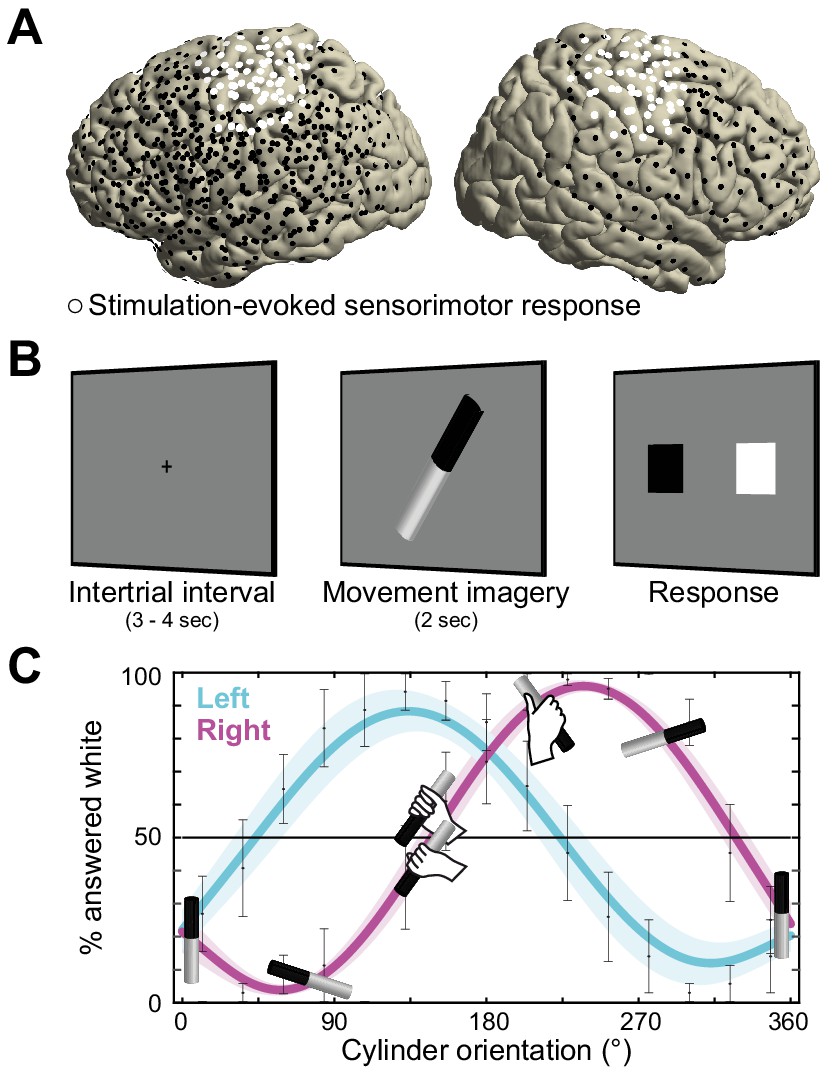
Recording electrode locations and movement imagery task.
(A) Neural signals were recorded from the cortical surface of eleven epilepsy patients that were implanted with subdural electrode grids and strips. The electrode locations of all participants are overlaid on a template brain (black markers). Electrodes resulting in either a somatomotor or somatosensory response in the upper limb upon electrical stimulation are highlighted in white. (B) Participants imagined grasping the middle-third of a black-white cylinder with either their left or right hand. At the response screen, they indicated whether their thumb was on the black or the white part of the cylinder at the end of the imagined movement. (C) The preferred manner in which the cylinder was grasped (thumb on black or white part, related to overhand vs. underhand grasping) was modulated as a function of the cylinder’s orientation and differed for the left and right hand. Error bars indicate M ± SEM over nine participants. Lines and shaded areas indicate M ± SEM of sine-wave fits to individual over-/underhand data points.
Figure 2 with 3 supplements

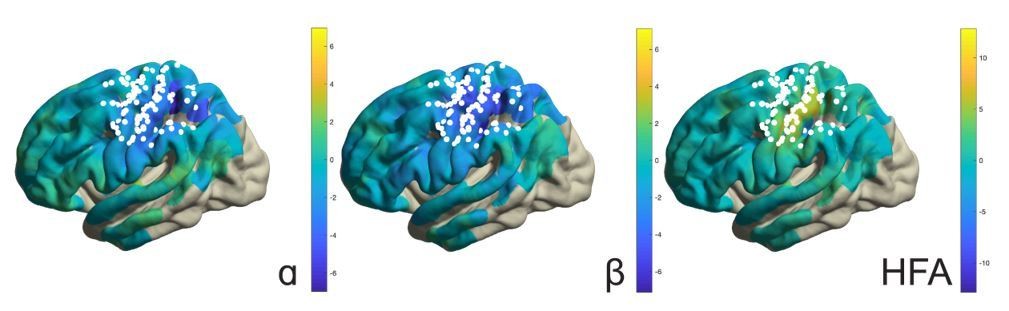
Anatomical and functional dissociation of sensorimotor alpha and beta.
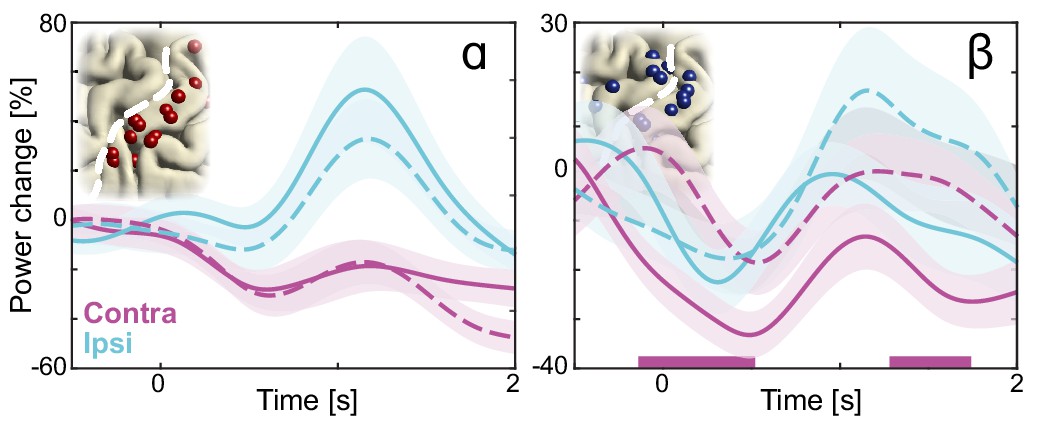
(A) Spectral and spatial distributions of alpha and beta rhythmic activity during imagined movement in two representative individuals. The insets show in log-log space the original power-spectra (in gray) and extracted arrhythmic 1/f content (black) that gave rise to the participant-specific rhythmic content shown in the main graph on the left. The color axes of the cortical maps run from minimum in blue to maximum absolute spectral power in yellow. White electrodes yielded somatomotor or somatosensory responses of the upper limb following electrical stimulation. Red and blue electrodes represent alpha- and beta-band local maxima across the sensorimotor cortex, respectively. (B) As the cortical maps in A, but for 60 to 120 Hz high-frequency arrhythmic content (HFA) of the ECoG signal. Green electrodes represent high-frequency-band local maxima across the sensorimotor cortex. (C) Ditto, but for the 1/f slope between 30 and 50 Hz, indicated by the orange graph sections in the insets of A. The 1/f slope is a putative power-spectral index of synaptic excitation/inhibition balance. Orange electrodes represent sensorimotor sites with relatively the strongest inhibition, that is the steepest slope. (D) Template brains showing the local maxima from five individuals visualized on the left hemisphere. Alpha is maximal at electrodes on the postcentral gyrus that yielded somatosensory sensations of the upper limb following electrical stimulation (red electrodes). In contrast, beta is strongest at electrodes placed over the central sulcus, with electrical stimulation yielding both movements and somatosensory sensations (blue electrodes). White dashed lines indicate central sulci. (E) Temporal dynamics of power changes aggregated across the relevant local maxima during imagined movement of the contralateral or ipsilateral arm. Both neuronal ensembles producing alpha and beta rhythms showed effector-specific modulation during motor imagery, from 0 to 2 s. Shaded areas indicate ±1 SEM. Colored bars along the x-axes indicate time intervals of statistically significant lateralization effects. Dashed black lines represent mean activity in the control task, for reference.
Figure 2—figure supplement 1
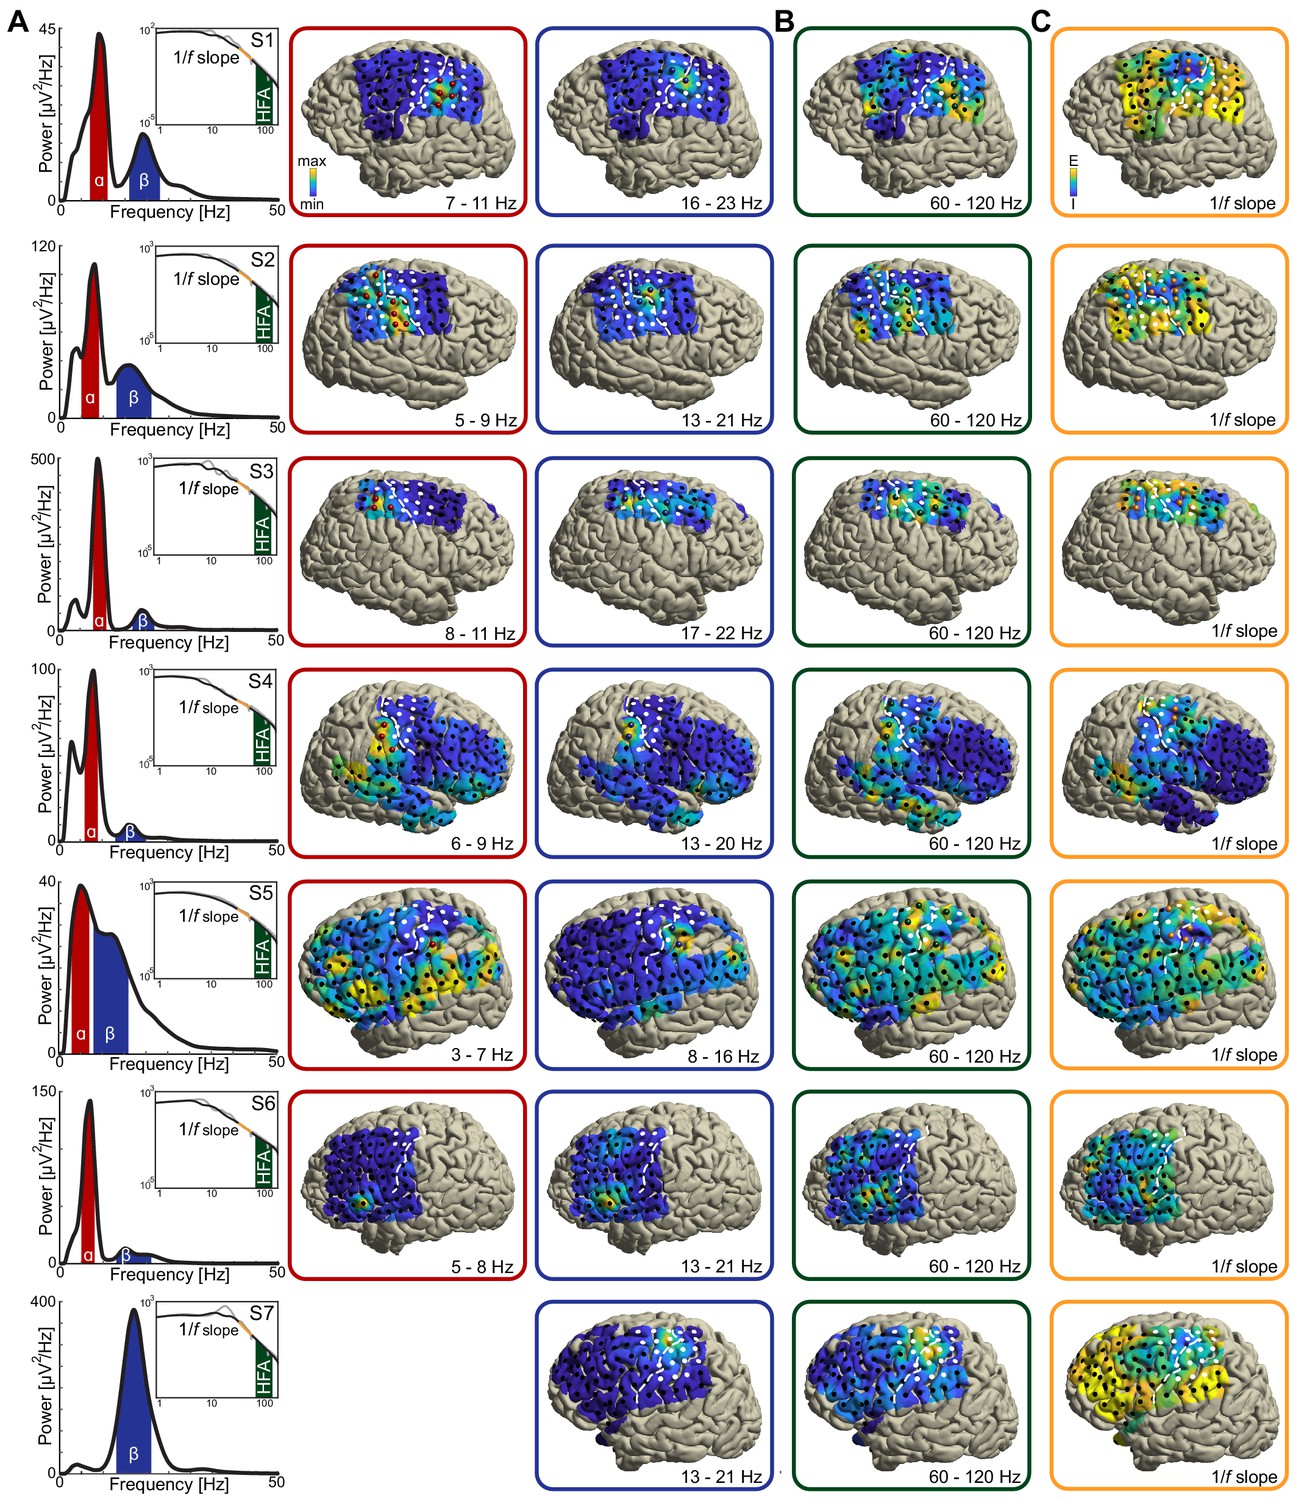
As in Figure 2A–C, for seven individuals with sensorimotor coverage.
Participant S7 lacked a rhythmic power-spectral component in the alpha frequency range (around 8–12 Hz; see bottom left power-spectrum in A) and was excluded from further analysis.
Figure 2—figure supplement 2
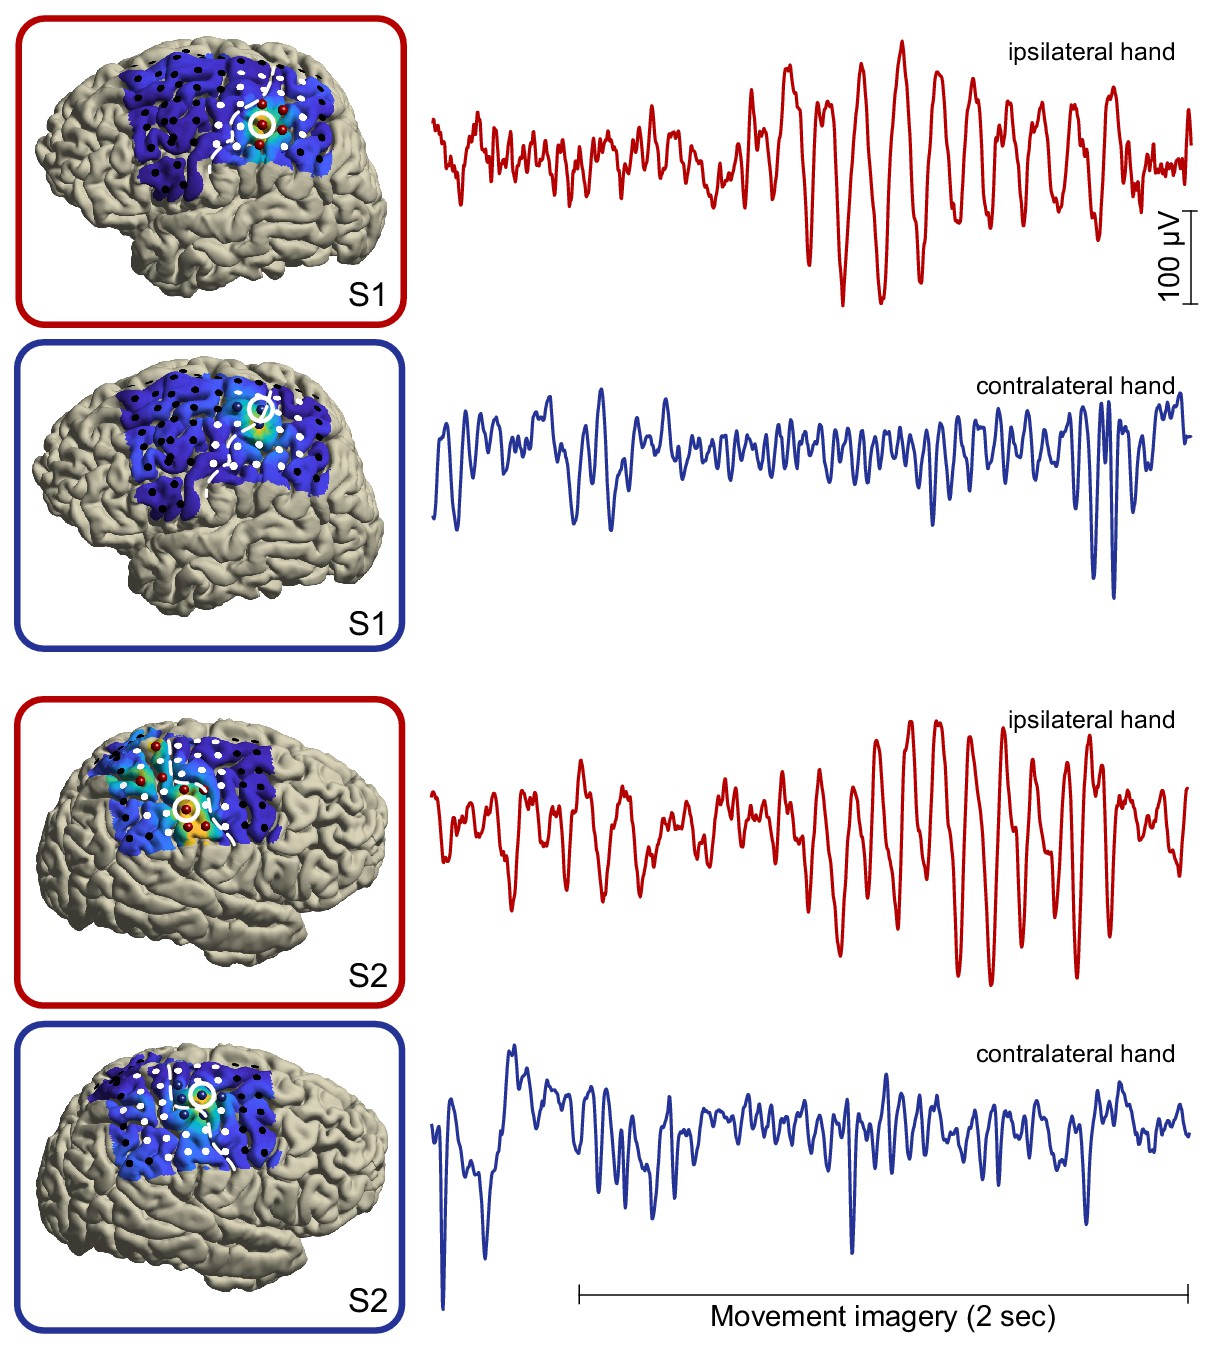
Single-trial broadband/unfiltered cortical signals from alpha- and beta-band local maxima (highlighted red and blue electrodes, respectively) in two representative individuals.
It can be seen that the group-level power dynamics in Figure 2E, showing attenuated beta rhythmic activity in contralateral somatomotor cortex and enhanced alpha rhythmic activity in ipsilateral somatosensory cortex during movement imagery, are preserved on the single-trial level of individuals. Further note that both rhythm types are sustained for many cycles.
Figure 2—figure supplement 3
As in Figure 2E, but with mean temporal dynamics of high demand trials (solid lines, cylinder orientations that afforded both overhand and underhand grasping) and low demand trials (dashed lines, cylinder orientations that afforded grasping in a single manner only).
The direction of the effects is consistent with a previous magnetoencephalography study showing that as task demand increased, alpha-band power increased in the sensorimotor cortex ipsilateral to the imagined arm, whereas beta-band power concurrently decreased in the contralateral sensorimotor cortex. Colored bars along the x-axes indicate time intervals of statistically significant task demand effects.
Figure 3 with 2 supplements
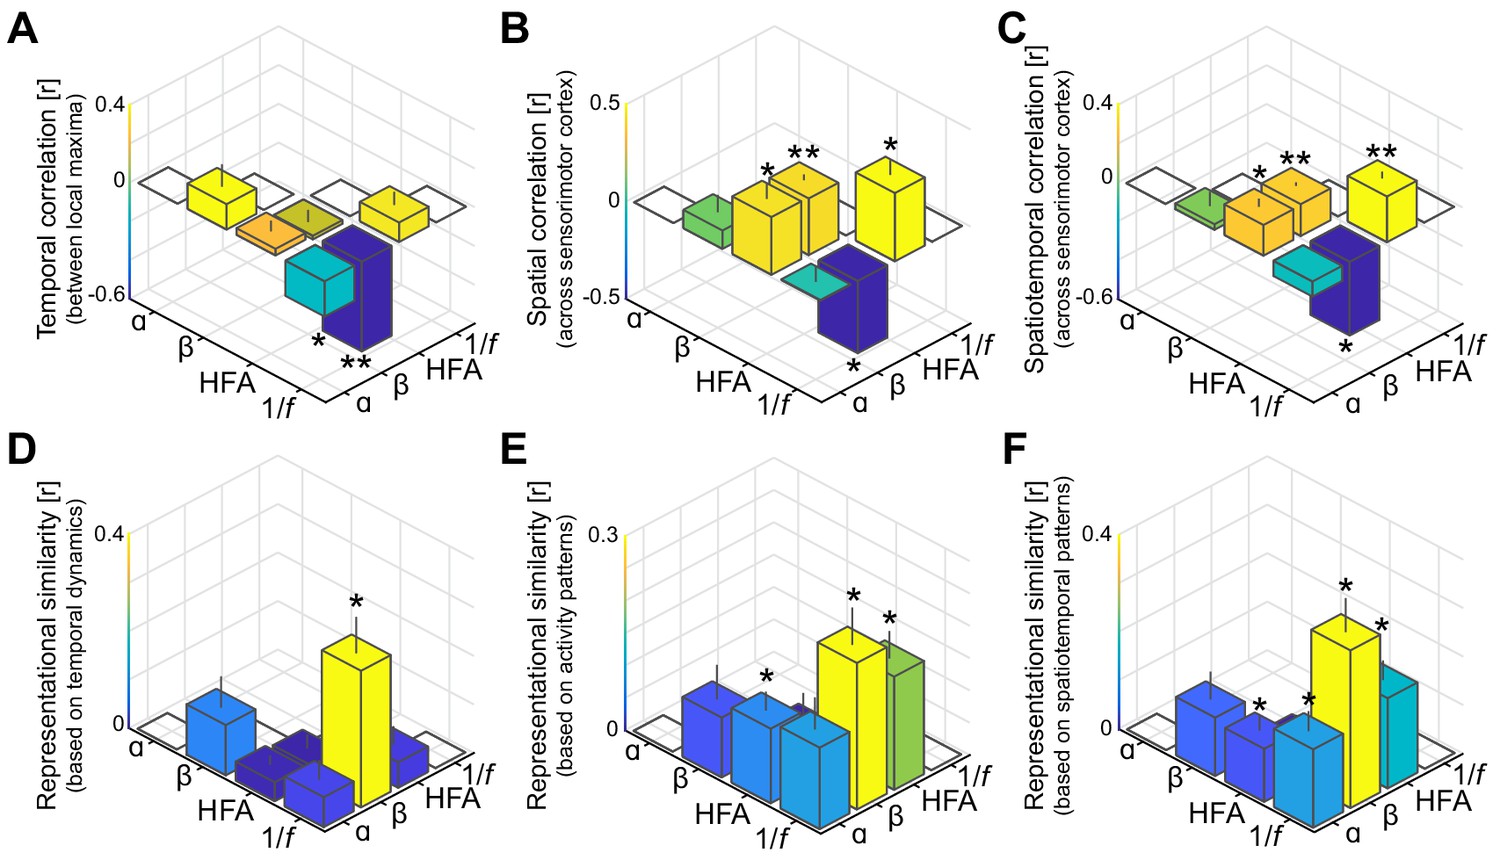
Spatiotemporal dissociation of sensorimotor alpha and beta.
(A - C) Temporal, spatial, and spatiotemporal correlations between alpha, beta, high-frequency activity (HFA), and the 1/f slope. Alpha and beta rhythms were weakly correlated in time and space during movement. Both alpha and beta showed a positive relationship with high-frequency activity, yet only beta-band power closely tracked changes in the 1/f slope across sensorimotor cortex (B and C). *: p<0.05; **: p<0.001. (D - F) Alpha and beta rhythms showed weak similarity in sensitivity to sensorimotor demands across different movements. Echoing the correlations shown in panels A to C, beta is largely sensitive to the same trial-by-trial demands as the 1/f slope, for both sensorimotor demands contained by temporal dynamics (D) and activity patterns (E and F).
Figure 3—figure supplement 1
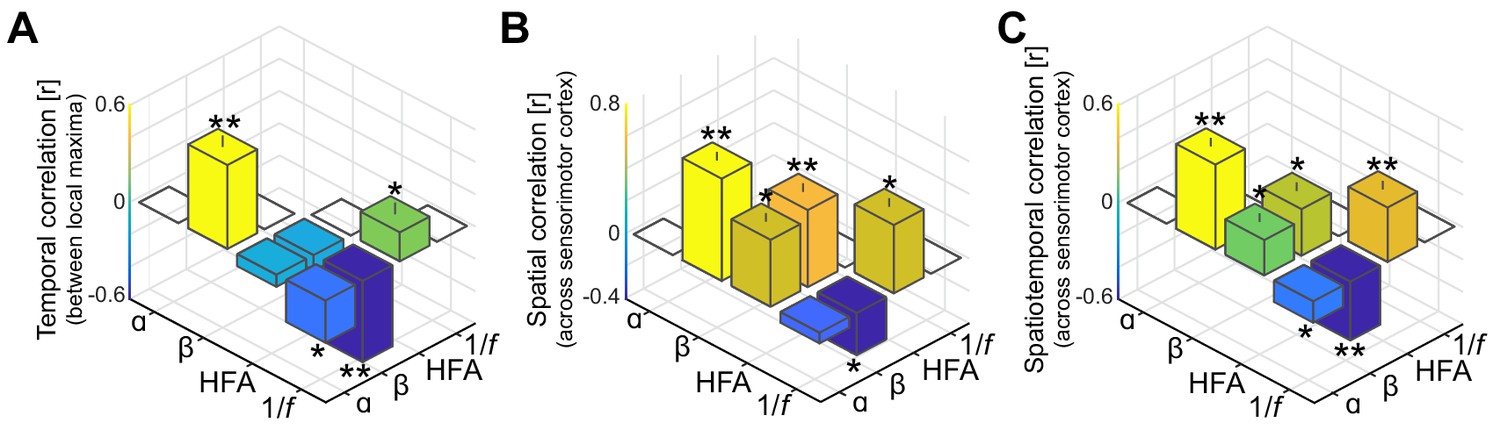
As in Figure 3A–C, but without accounting for shared variance in alpha- and beta-band frequency bands originating from concurrent 1/f modulations in the power-spectrum.
It can be seen from the leftmost bars in these figures that without the separation of rhythmic and arrhythmic activity in the power-spectrum, alpha- and beta-band rhythms appear temporally and spatially correlated.
Figure 3—figure supplement 2
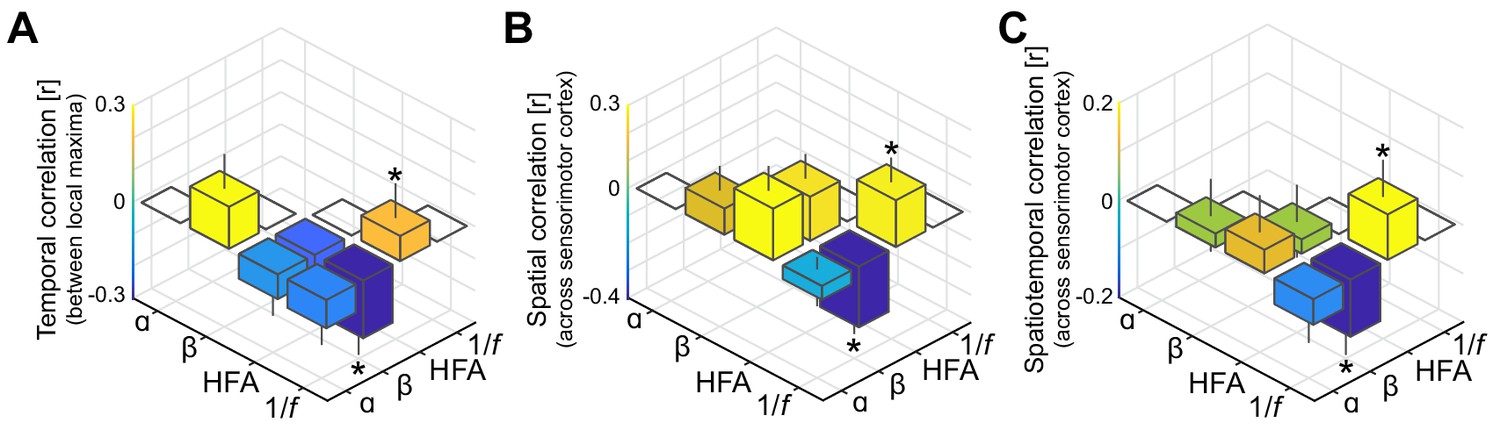
As in Figure 3A–C, but with high-frequency activity and the 1/f slope index based on the rhythmic component rather than on the arrhythmic component of the power-spectrum.
It can be seen that interactions involving low-frequency phenomena (alpha- and beta-band rhythmic activity) and local excitability metrics (high-frequency activity and the 1/f slope) are substantially weaker compared to the original correlations shown in Figure 3, despite that all spectral features are based on the same rhythmic component of the power-spectrum.
Figure 4 with 2 supplements

Dissociation of sensorimotor alpha and beta traveling waves.
(A) Propagation of alpha and beta rhythmic activity during imagined movement in two representative individuals. Example cortical signals are of the same data segment in each participant but filtered at individual alpha and beta frequencies. Red and blue markers indicate electrodes previously identified as alpha- and beta-band local maxima, respectively. Cortical phase maps indicate the average phase at each cortical site relative to a central sensorimotor reference electrode. Small cone-shaped arrows indicate the mean propagation direction at each stimulation-positive electrode, with arrow size weighted by the local phase gradient magnitude. Large arrows indicate the mean propagation direction across sensorimotor cortex, with arrow size weighted by the alignment of sensorimotor gradients (phase gradient directionality, PGD). (B) Mean propagation speeds of traveling alpha and beta waves over participants. (C) Mean probability distribution of traveling wave direction over participants. Alpha rhythm propagation is maximal in a caudo-rostral direction (red distribution), while beta rhythms predominantly moved in a rostro-caudal direction (blue distribution). Dashed black circle represents a uniform distribution of propagation directions, for reference. (D) Alpha traveling waves propagated more consistently through alpha-band local maxima during imagined movement of the ipsilateral arm (directional consistency, DC). In contrast, beta waves traveled more consistently through beta-band local maxima during imagined movement of the contralateral arm. Colored bars along the x-axes indicate time intervals of statistically significant DC changes from baseline levels for the effector involved in the imagined movement.
Figure 4—figure supplement 1
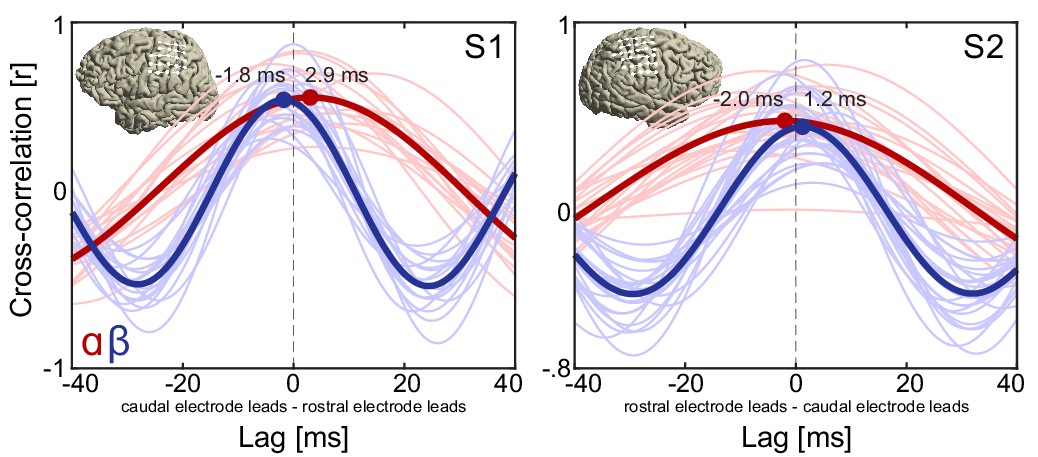
Cross-correlation functions of alpha and beta rhythmic activity at rostro-caudal electrode pairs on the sensorimotor cortex of two representative individuals.
It can be seen that rostral electrodes led caudal electrodes in the alpha frequency range during movement imagery (red lines), consistent with alpha waves traveling in a rostral direction. Conversely, caudal electrodes led rostral electrodes in the beta frequency range (blue lines), consistent with beta waves traveling in a caudal direction. This pattern of directionality is consistent with the instantaneous phase-based representations in Figure 4, showing concurrent alpha and beta waves traveling along opposite directions during movement imagery. Thin lines indicate mean cross-correlation functions across trials at individual electrode pairs. Thick lines indicate mean cross-correlation functions across all electrode pairs. White markers and lines on the brain insets indicate rostro-caudal electrode pairs on which amplitude-based cross-correlations were based. All lags were statistically significant (see Supplemental Analyses for details). Note that rostro-caudal direction is flipped on the x-axis of participant S2.
Figure 4—figure supplement 2

As in Figure 4D, but with directional consistency of wave propagation for high demand trials (solid lines, cylinder orientations that afforded both overhand and underhand grasping) and for low demand trials (dashed lines, cylinder orientations that afforded grasping in a single manner only).
Alpha waves propagated more consistently through alpha-band local maxima during imagined movement on high demand trials. Colored bars along the x-axes indicate time intervals of statistically significant task demand effects.
Author response image 1
Videos
Video 1
Time-lapse video of concurrent traveling alpha and beta waves in participant S1 during movement imagery.
Cortical phase maps indicate the average phase at each cortical site relative to a central sensorimotor reference electrode. Small cone-shaped arrows indicate the mean propagation direction at each stimulation-positive electrode, with arrow size weighted by the local phase gradient magnitude. Large arrows indicate the mean propagation direction across sensorimotor cortex, with arrow size weighted by the alignment of sensorimotor gradients (phase gradient directionality, PGD). Time is in seconds after cylinder appearance.
Video 2
As in Video 1, for participant S2.
https://doi.org/10.7554/eLife.48065.014Tables
Key resources table
| Reagent type (species) or resource | Designation | Source or reference | Identifiers | Additional information |
|---|---|---|---|---|
| Software, algorithm | FieldTrip | FieldTrip | Stolk et al., 2018 | Integrated analysis of human intracranial data |
| Software, algorithm | FreeSurfer | FreeSurfer | Dale et al., 1999 | Cortical surface extraction |
Additional files
-
Source code 1
Analysis code for the extraction of spectral features from the electrophysiological signal.
- https://doi.org/10.7554/eLife.48065.015
-
Transparent reporting form
- https://doi.org/10.7554/eLife.48065.016
Download links
A two-part list of links to download the article, or parts of the article, in various formats.
Downloads (link to download the article as PDF)
Open citations (links to open the citations from this article in various online reference manager services)
Cite this article (links to download the citations from this article in formats compatible with various reference manager tools)
Electrocorticographic dissociation of alpha and beta rhythmic activity in the human sensorimotor system
eLife 8:e48065.
https://doi.org/10.7554/eLife.48065


