Pretectal neurons control hunting behaviour
- UCL, United Kingdom
- University of A Coruña, Spain
Figures
Figure 1 with 2 supplements
Neural activity associated with hunting.
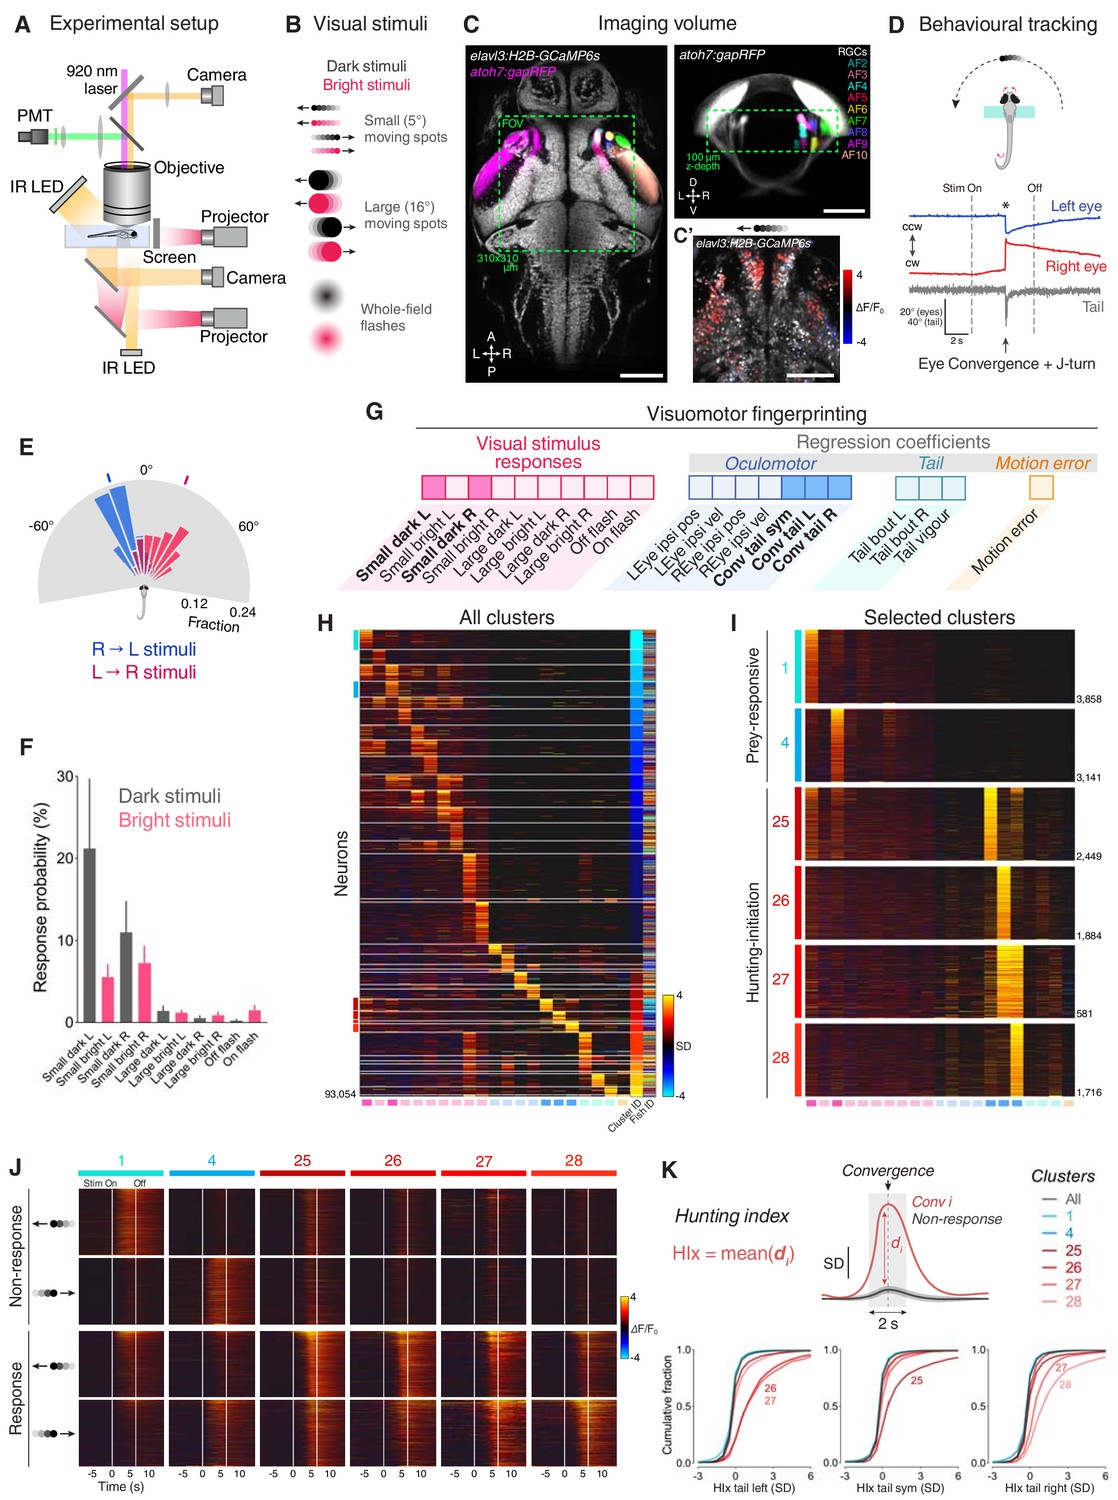
(A) 2-photon GCaMP imaging combined with behavioural tracking during virtual hunting behaviour (see Materials and methods). (B) Schematic of visual stimuli. (C) elavl3:H2B-GCaMP6s;atoh7:gapRFP reference brain showing imaging volume (green box), which encompassed most retinal arborisation fields (AF2–10). In the right hemisphere, RFP has been pseudo-coloured to demarcate specific AFs. (C’) Example of neuronal activity (ΔF/F0) within one focal plane in response to a dark, leftwards moving prey-like spot (mean activity over eight presentations) overlaid onto anatomical image (grey). (D) Example of behavioural tracking data indicating hunting initiation (eye convergence and leftwards J-turn) in response to a dark, leftwards moving prey-like spot. Asterisk indicates time of convergent saccade. cw, clockwise; ccw, counter-clockwise. (E) Distribution of spot locations at time of convergent saccade. Ticks indicates median location for leftwards (blue, –18.13°, N = 162 events in eight fish) and rightwards (red, 22.10°, N = 122 events) moving spots. (F) Hunting response probability (mean + SEM, N = 8 fish) across visual stimuli. (G) Schematic of the visuomotor vector (VMV) generated for each neuron. (H) VMVs of all clustered neurons (N = 93,054 neurons from eight fish). Within each cluster, neurons are ordered according to decreasing correlation with the cluster seed centroid (mean VMV). Coloured lines on the left highlight hunting-related clusters (prey-responsive clusters in blue, hunting-initiation clusters in red). (I) Enlargement showing VMVs of selected hunting-related clusters (1, 4, 25–28). Number of cells in each cluster is shown on right. (J) Stimulus-aligned activity during non-response (top) and response (bottom) trials for neurons in selected clusters (indicated top). (K) Hunting Index (HIx). Top schematic indicates how HIx is computed from calcium signals and bottom shows distribution of HIx scores for selected clusters. Scale bars, 100 µm. A, anterior; D, dorsal; L, leftwards; P, posterior; R, rightwards; V, ventral; Sym, symmetric. See also Figure 1—figure supplements 1 and 2 and Video 1.
-
Figure 1—source data 1
Source data for Figure 1.
Data provided as a MATLAB structure.
- https://doi.org/10.7554/eLife.48114.006
Figure 1—figure supplement 1
Behavioural and clustering analyses.
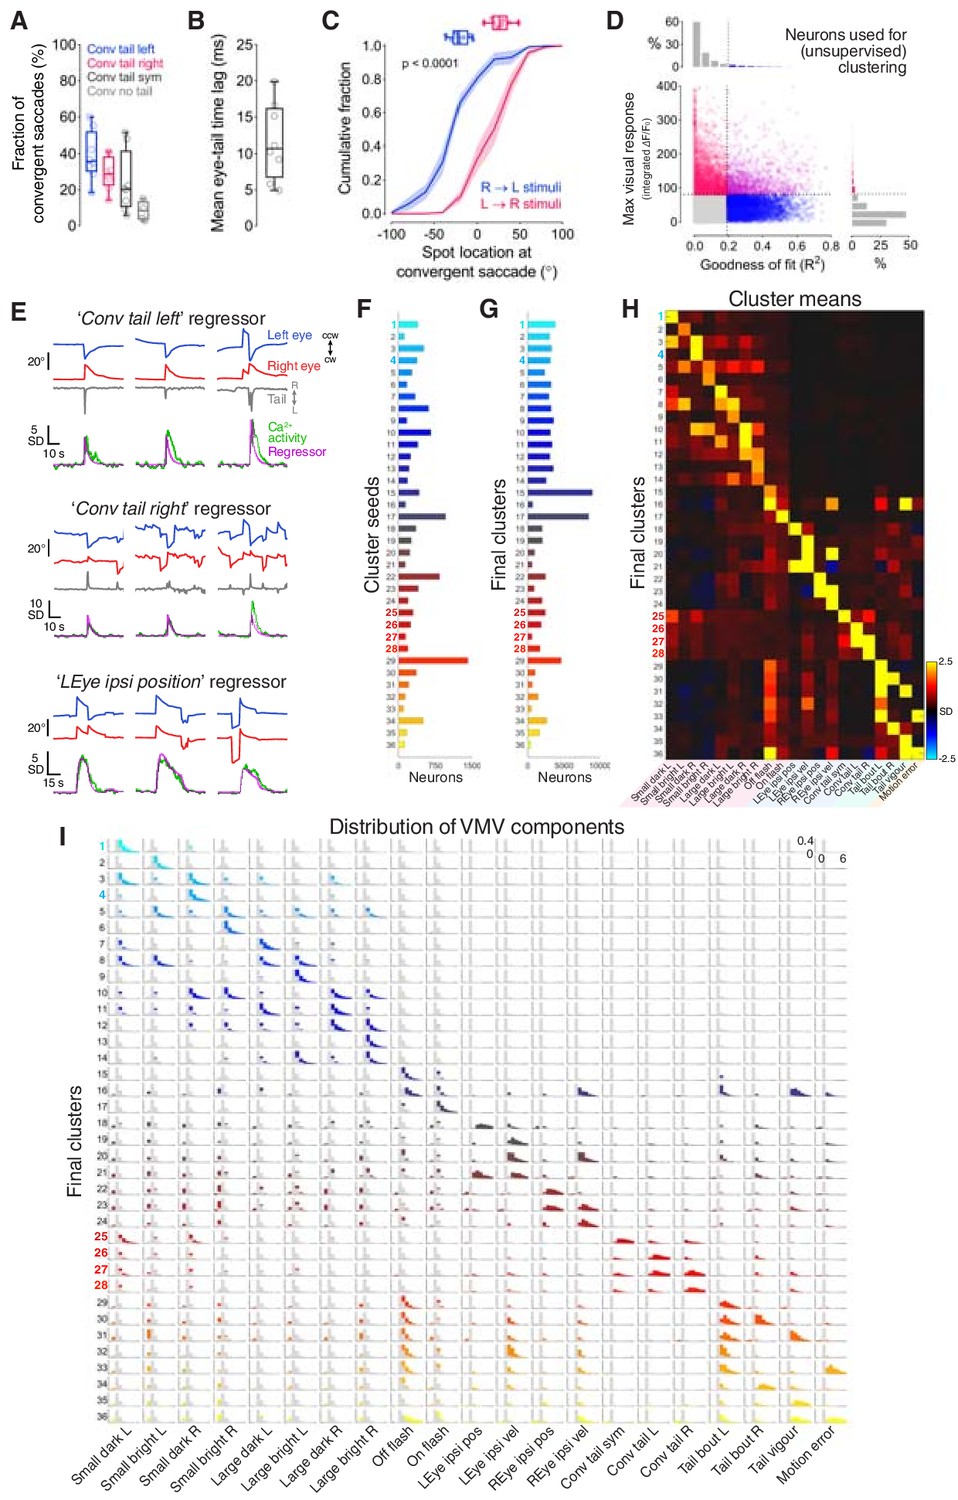
(A) Fraction of convergent saccades associated with leftwards, rightwards, symmetrical or no tail movement. (B) Mean time from convergent saccade to tail movement, per fish. (C) Cumulative distributions of spot locations at convergent saccade (N = 8 fish). The distributions of median spot locations for individual fish are reported at the top. (D) Scatter plot indicating maximum visual response versus goodness of fit of regression modelling, for all recorded cells. Coloured points indicate cells in the top 5th percentile for at least one metric, which were selected for unsupervised clustering (N = 17,181 cells out of 181,123). (E) Examples of three regressors used for multilinear regression modelling. In each case, three representative behavioural events are shown with the value of the regressor and recorded calcium activity from a well modelled cell. Coefficients from multilinear regression contribute to the VMV of the neuron. cw, clockwise; ccw, counter-clockwise; L, leftwards; R, rightwards; SD, standard deviation. (F) Number of neurons in cluster seeds. (G) Number of neurons in final clusters. (H) Cluster centroids (mean VMVs) for all 36 clusters. (I) Distributions of VMV components for all clusters. Distributions across all clustered neurons are overlaid in grey. Y-axis ranges from 0 to 0.4 (fraction), x-axis ranges from –2 to 6 (SD).
Figure 1—figure supplement 2
Stimulus and motor-triggered calcium responses.
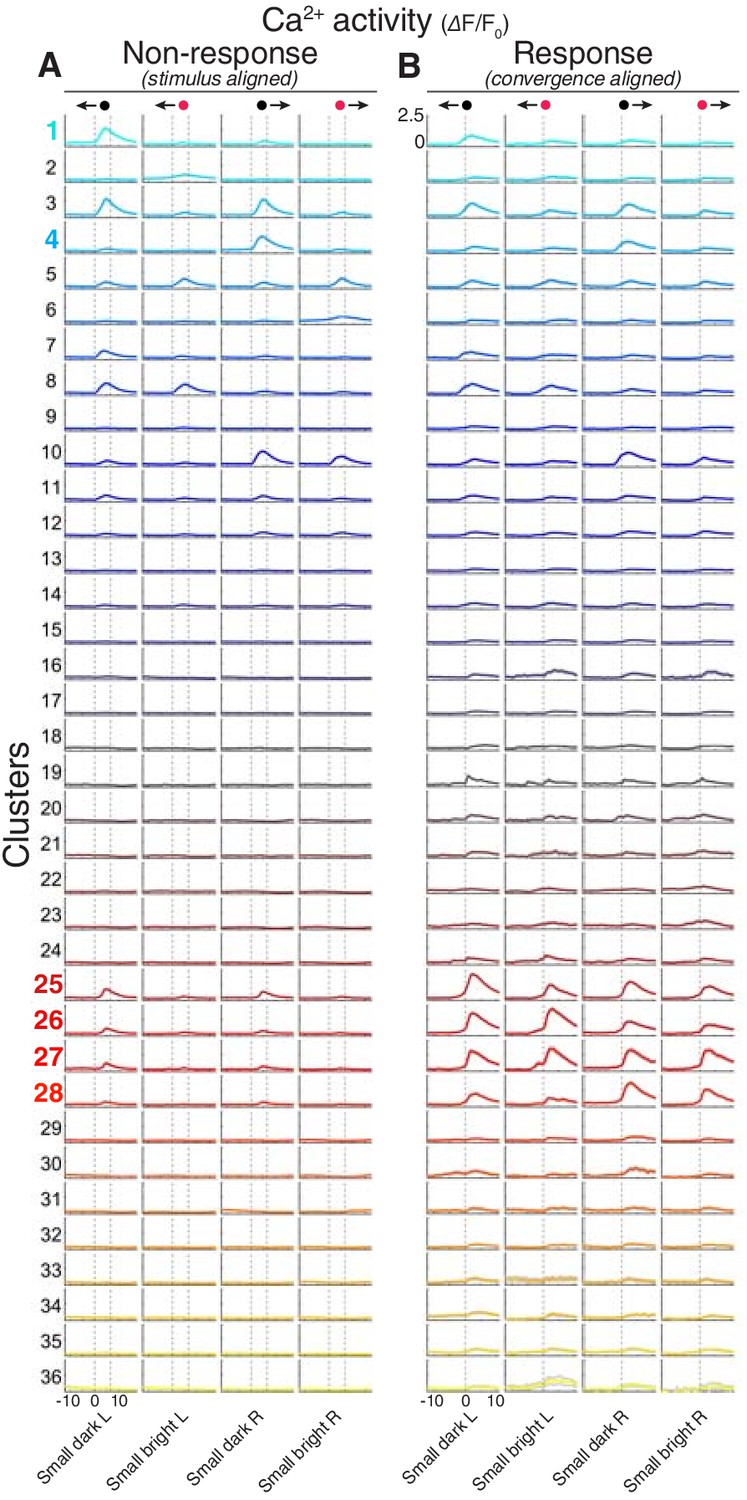
(A–B) Visual stimulus-aligned (A) and eye convergence-aligned (B) ΔF/F0 responses for all 36 clusters. Responses are shown for small moving spots (dark/bright moving leftwards/rightwards, as indicated at top of columns). Traces show mean ±95% confidence intervals across all neurons in each cluster. Dashed vertical lines indicate start/end of stimulus presentation in non-response trials (A), or time of saccadic convergence (B). L, leftwards; R, rightwards. X-axis reports time in seconds.
Figure 2 with 2 supplements

AF7-pretectum contains a high density of hunting initiation neurons.
(A) Anatomical maps of prey-responsive clusters (left) and hunting-initiation clusters (middle and right). Images show dorsal views of intensity sum projections of all neuronal masks in each cluster after registration to the elavl3:H2B-GCaMP6s reference brain (grey). Insets show fraction of neurons in left and right AF7-pretectum or medial thalamus belonging to specified clusters. (B) Ventro-dorsal cross-section views of anatomical maps. (C) Visual stimulus-aligned activity during non-response trials for prey-responsive clusters (left) and hunting-initiation clusters (middle and right; mean ± SEM). Activity is displayed separately for left (blue) and right (red) hemisphere neurons in each cluster. Insets show single-trial responses for a single example cell from each cluster (mean as thick line). (D) Activity aligned to convergent saccades associated with leftwards (top), rightwards (bottom), or symmetrical/no tail movements (middle). Activity during both spontaneous and visually evoked events was used. Scale bars, 100 µm. A, anterior; D, dorsal; L, left; P, posterior; R, right; V, ventral; Stim, stimulus.
Figure 2—figure supplement 1
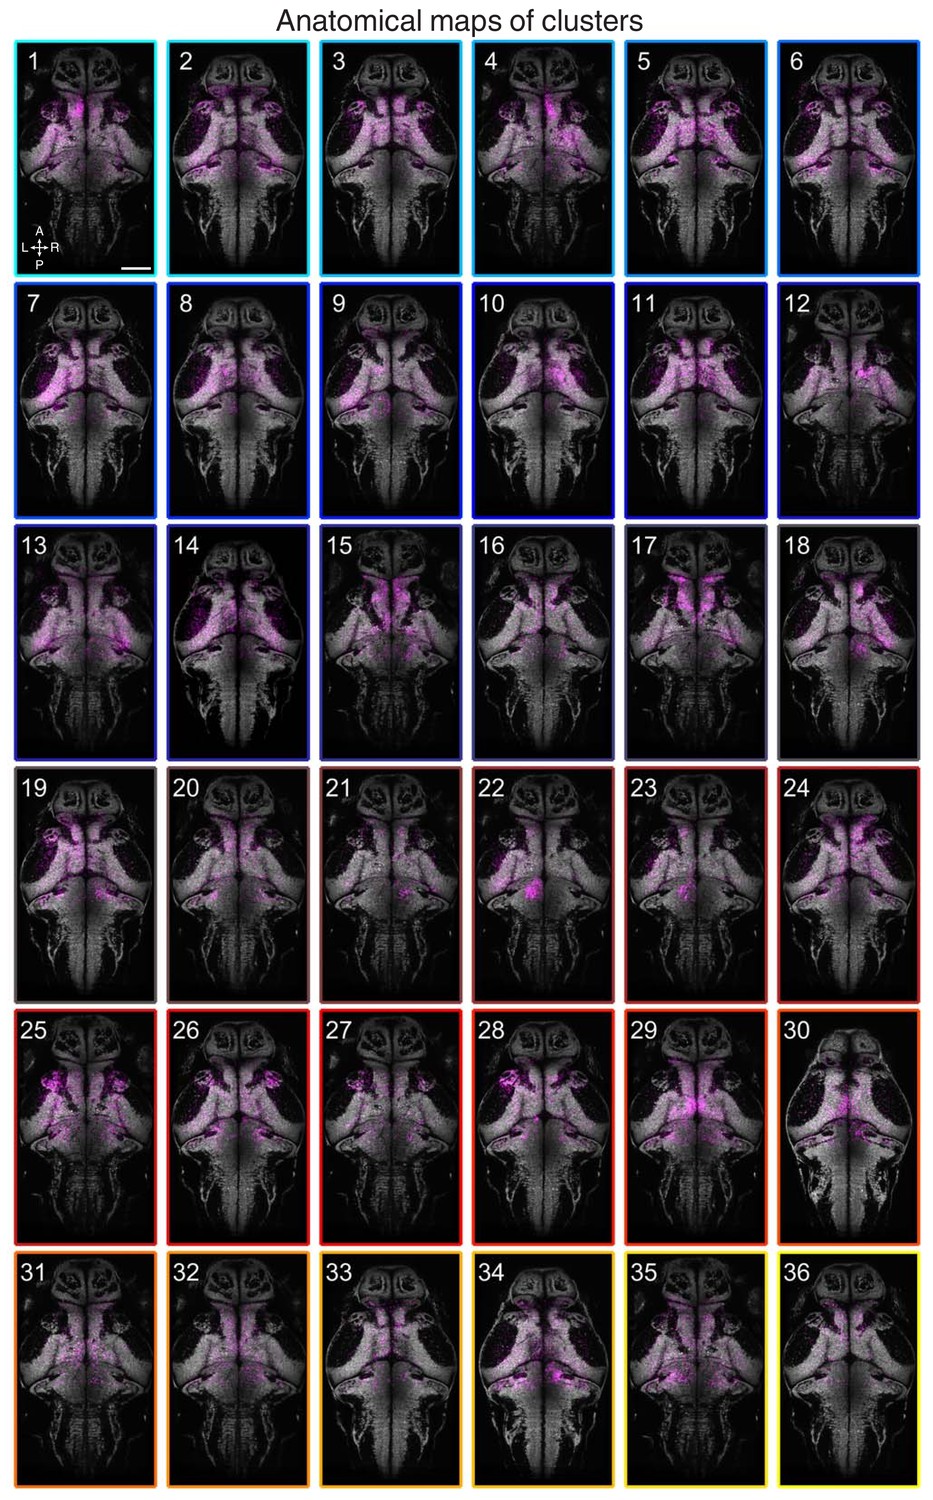
Anatomical maps of clusters.
Images show dorsal views of intensity sum projections of all neuronal masks in each cluster (magenta) after registration to the elavl3:H2B-GCaMP6s reference brain. Projections (obtained through all focal planes,~100 µm total depth) are overlaid on a maximum-intensity projection image (grey) from the elavl3:H2B-GCaMP6s reference brain (five planes, 5 µm depth, from focal planes with the largest number of neurons in each cluster). Scale bar, 100 µm. A, anterior; L, left; P, posterior; R, right.
Figure 2—figure supplement 2
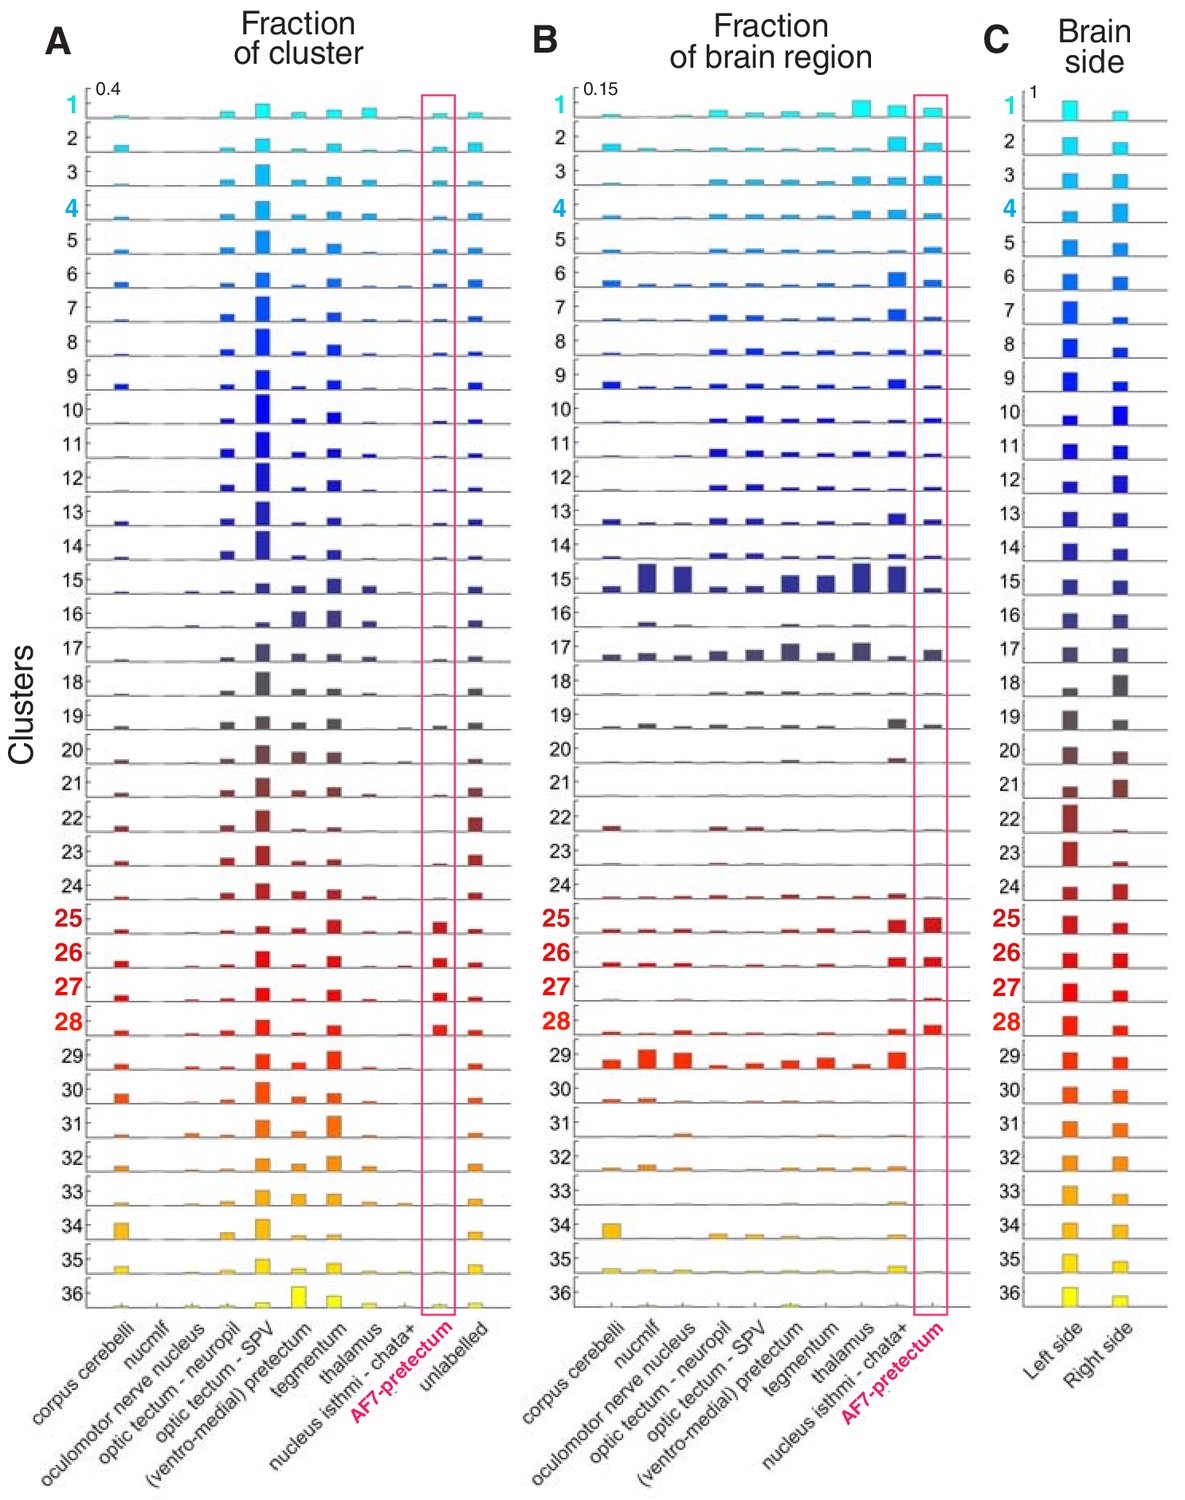
Anatomical locations of clustered neurons.
(A) Anatomical location of clusters (N = 8 fish). The fraction of cells in each cluster falling within each ZBB anatomical region is shown. Red box highlights AF7-pretectum. Y-axis ranges from 0 to 0.4 (fraction). (B) Fraction of imaged cells within each anatomical region that were assigned to each cluster type. Red box highlights AF7-pretectum. Y-axis ranges from 0 to 0.15 (fraction of imaged neurons in brain region). (C) Fraction of neurons in each cluster located in the left or right brain hemisphere. Y-axis ranges from 0 to 1 (fraction).
Figure 3 with 1 supplement
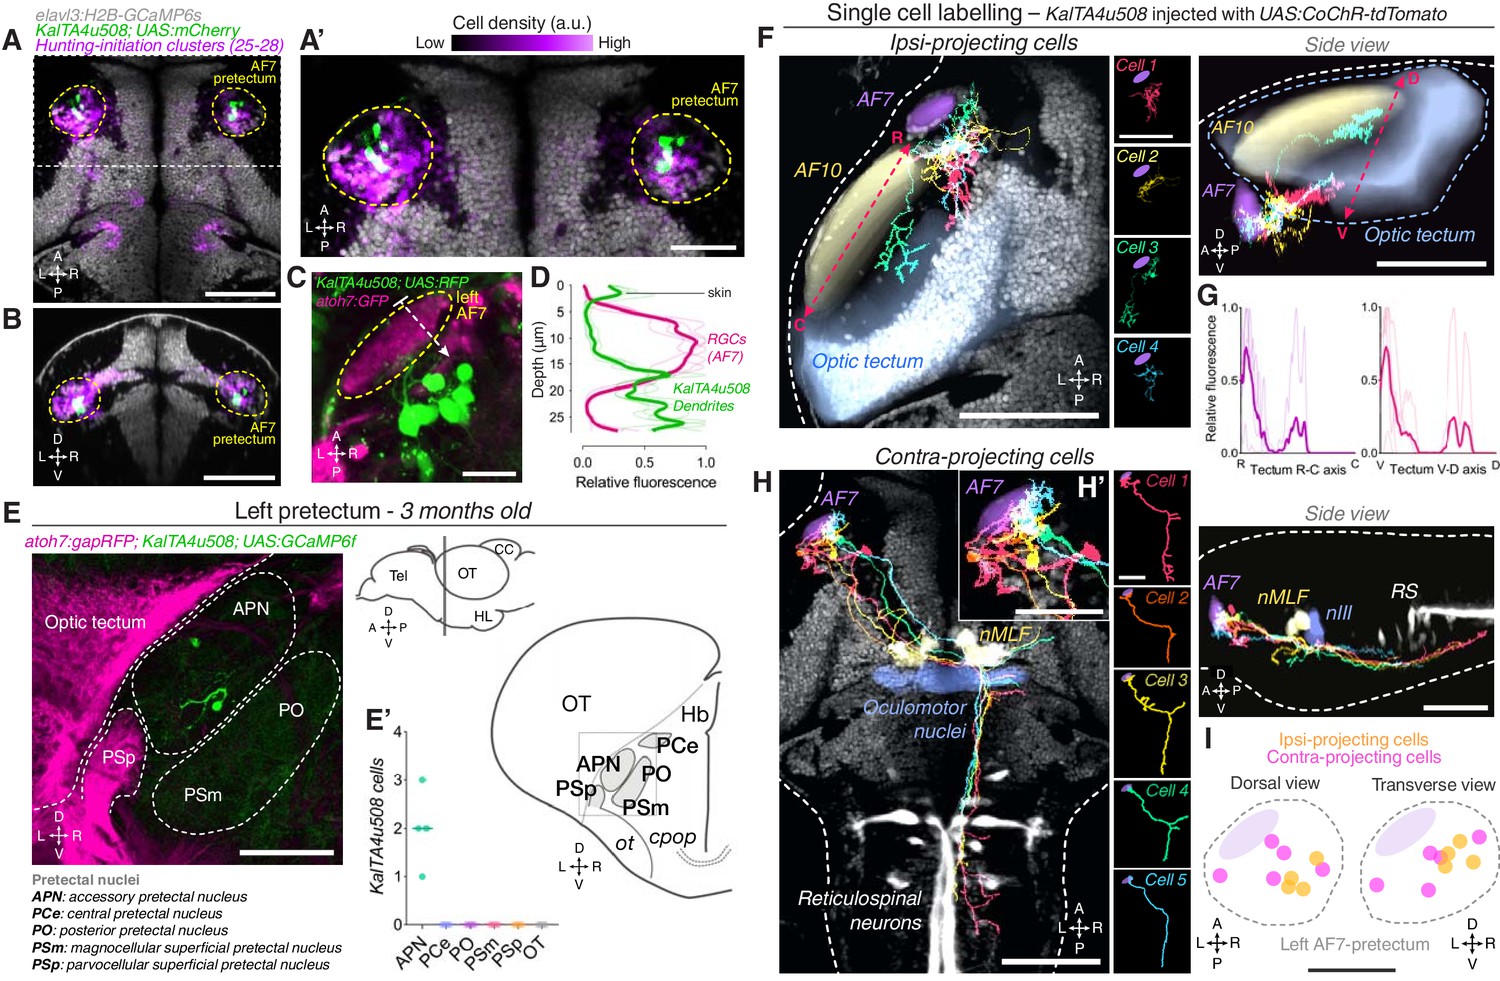
AF7-pretectal neurons with distinct projection patterns labelled by KalTA4u508.
(A) Dorsal view of KalTA4u508;UAS:mCherry expression at 6 dpf (green) registered to the elavl3:H2B-GCaMP6s reference brain (grey). Neurons of all four hunting-initiation clusters combined are shown in purple, colour-coded according to local cell density (clusters 25–28, N = 6,630 cells from eight fish). AF7-pretectum is indicated in yellow and the region is enlarged in (A’). (B) Ventro-dorsal cross-section of data in (A). (C) Left AF7-pretectum in a 6 dpf KalTA4u508;UAS:RFP;atoh7:GFP larva (dorsal view, maximum-intensity projections, 10 planes, 10 µm depth). (D) Dendritic stratification of KalTA4u508 neurons (green) relative to RGC axons (magenta) in AF7. Y-axis indicates distance from the skin in µm (dashed white arrow in C). Mean and individual stratification patterns are reported (N = 4 fish). (E) KalTA4u508 neurons in pretectum of a 3 month-old KalTA4u508;UAS:GCaMP6f;atoh7:gapRFP fish. Pretectal and tectal regions in the left hemisphere are shown. Schematic indicates location of micrograph and pretectal nuclei (transverse plane). Number of KalTA4u508 cells in each pretectal nucleus are reported in (E’) (N = 4 fish). APN, accessory pretectal nucleus; CC, cerebellar corpus; cpop, postoptic commissure; Hb, habenula; HL, hypothalamic lobe; OT, optic tectum; ot, optic tract; PCe, central pretectal nucleus; PO, posterior pretectal nucleus; PSm, magnocellular superficial pretectal nucleus, PSp, parvocellular superficial pretectal nucleus; Tel, telencephalon. (F) Tracings of individual KalTA4u508 projection neurons that innervate the ipsilateral tectum (‘ipsi-projecting’ cells, N = 4 cells from four fish). Data is from 6 to 7 dpf larvae and is registered to the elavl3:H2B-GCaMP6s reference brain (grey). Selected anatomical regions from the ZBB brain atlas are overlaid. To enable morphological comparisons, all traced neurons are shown in the left hemisphere. (G) Fluorescence profiles of neurites of ipsi-projecting KalTA4u508 cells along the rostro-caudal (R-C, left) and ventral-dorsal (V-D, right) axes of the optic tectum (dashed red arrows in F). Mean and individual profiles are reported (N = 4 cells). (H) Tracings of KalTA4u508 projection neurons innervating the contralateral hindbrain (‘contra-projecting’ cells, N = 5 cells from five fish). Dendritic arbours adjacent to AF7 are enlarged in inset (H’). nMLF, nucleus of the medial longitudinal fasciculus; RS, reticulospinal system. (I) Soma location of ipsi- and contra-projecting KalTA4u508 cells in AF7-pretectum. Scale bars, 100 µm, except (A’), (H’), (I), 50 µm, and (C), 20 µm. A, anterior; C, caudal; D, dorsal; L, left; P, posterior; R, right (rostral in G); V, ventral. See also Figure 3—figure supplement 1.
-
Figure 3—source data 1
Source data for Figure 3.
Data provided as a MATLAB structure.
- https://doi.org/10.7554/eLife.48114.013
Figure 3—figure supplement 1
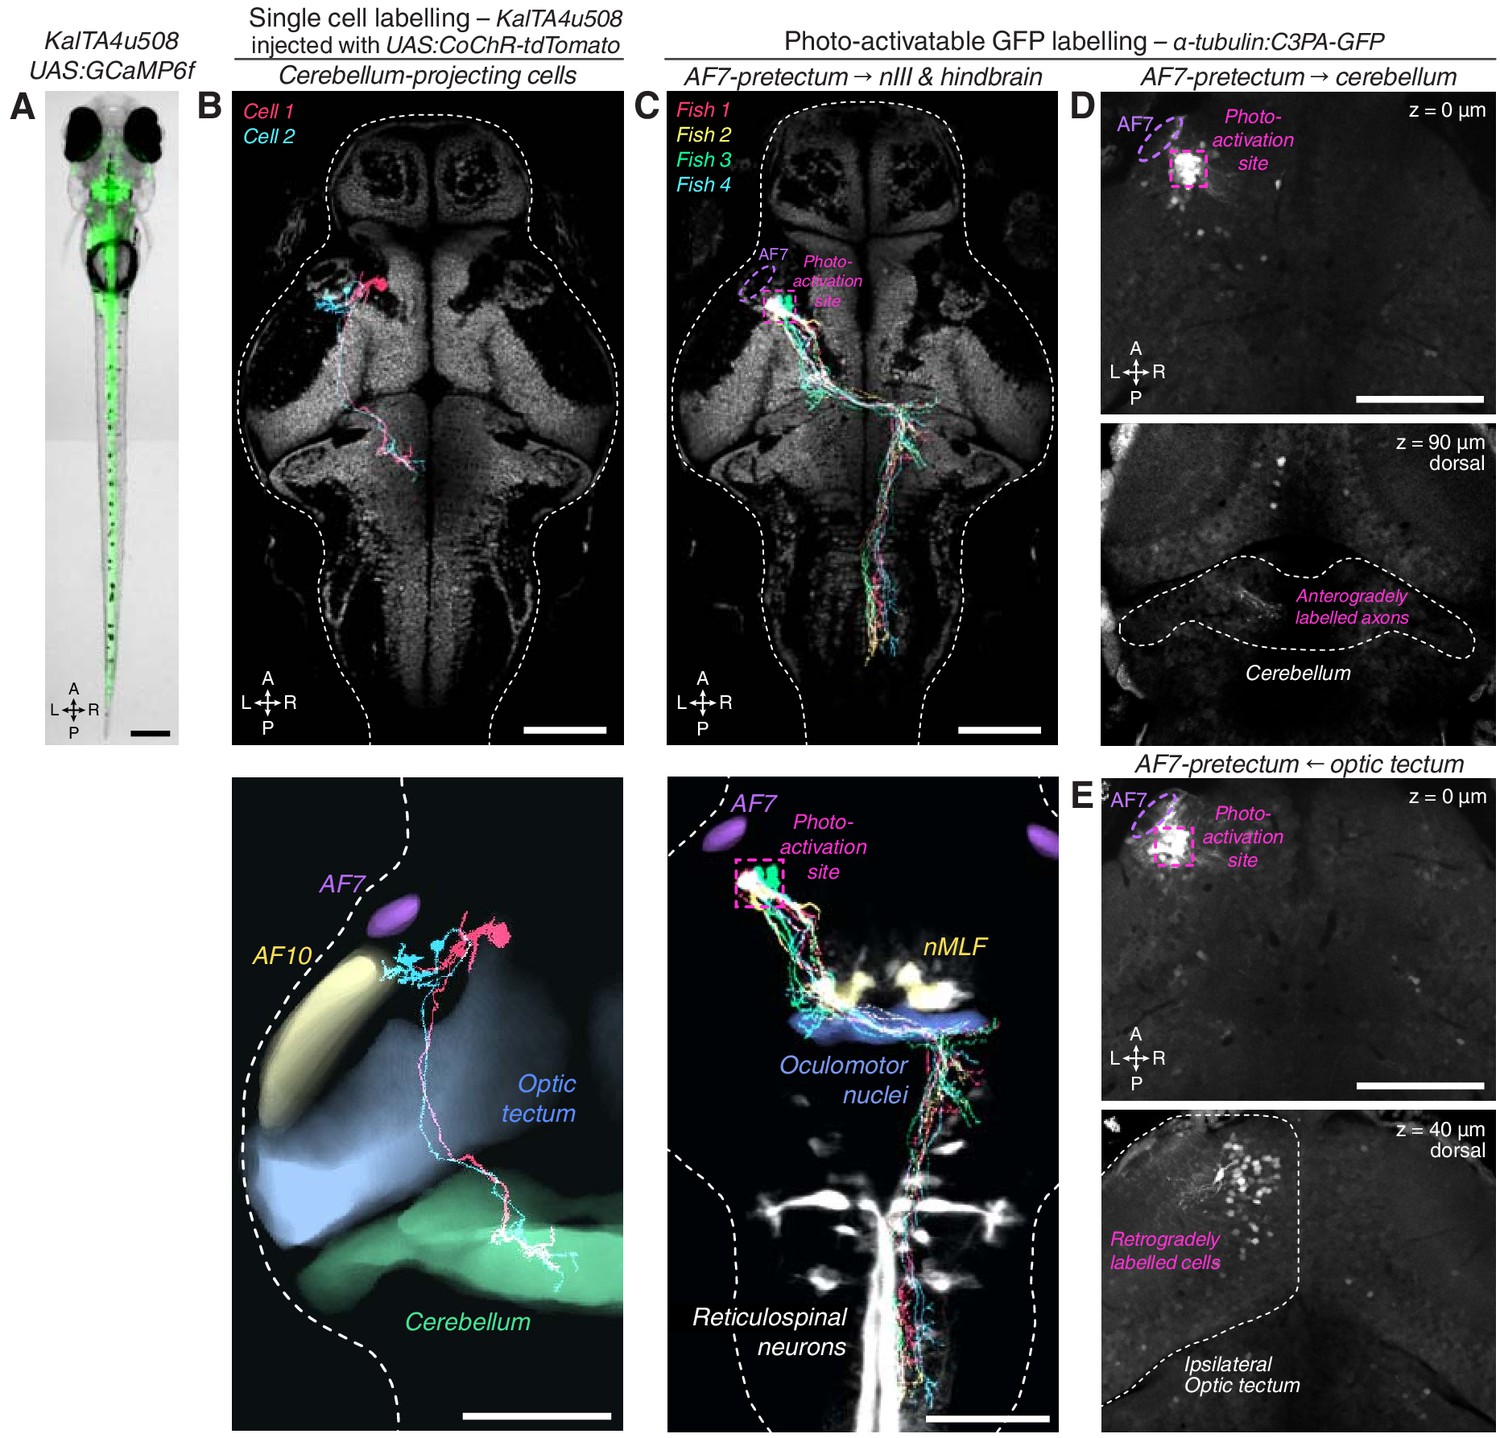
KalTA4u508 neurons innervating cerebellum, and PA-GFP projection mapping from AF7-pretectum.
(A) Expression pattern of the KalTA4u508 transgene, illustrated by a KalTA4u508;UAS:GCaMP6f transgenic larva (6 dpf). (B) Tracings of KalTA4u508 neurons projecting to ipsilateral medial corpus cerebellum (N = 2 cells from two fish). The bottom image shows tracings overlaid with selected anatomical regions from the ZBB brain atlas. (C) Tracings of PA-GFP-labelled AF7-pretectal cells projecting to oculomotor nuclei and contralateral hindbrain in 7 dpf α-tubulin:C3PA-GFP larvae (N = 4 fish) registered to the elavl3:H2B-GCaMP6s reference brain (grey). The photo-activation site is indicated in magenta. (D) PA-GFP-labelled AF7-pretectal cells in a 7 dpf α-tubulin:C3PA-GFP larva. The photo-activation site is indicated in magenta. Anterogradely labelled axonal terminals are visible in the ipsilateral medial cerebellum (bottom image, z-plane location is relative to top z-plane). (E) A second example of photoactivation that retrogradely labelled cell bodies in the ipsilateral anterior-ventral optic tectum. Scale bars, 100 µm except (A), 200 µm. A, anterior; L, left; P, posterior; R, right.
Figure 4 with 1 supplement
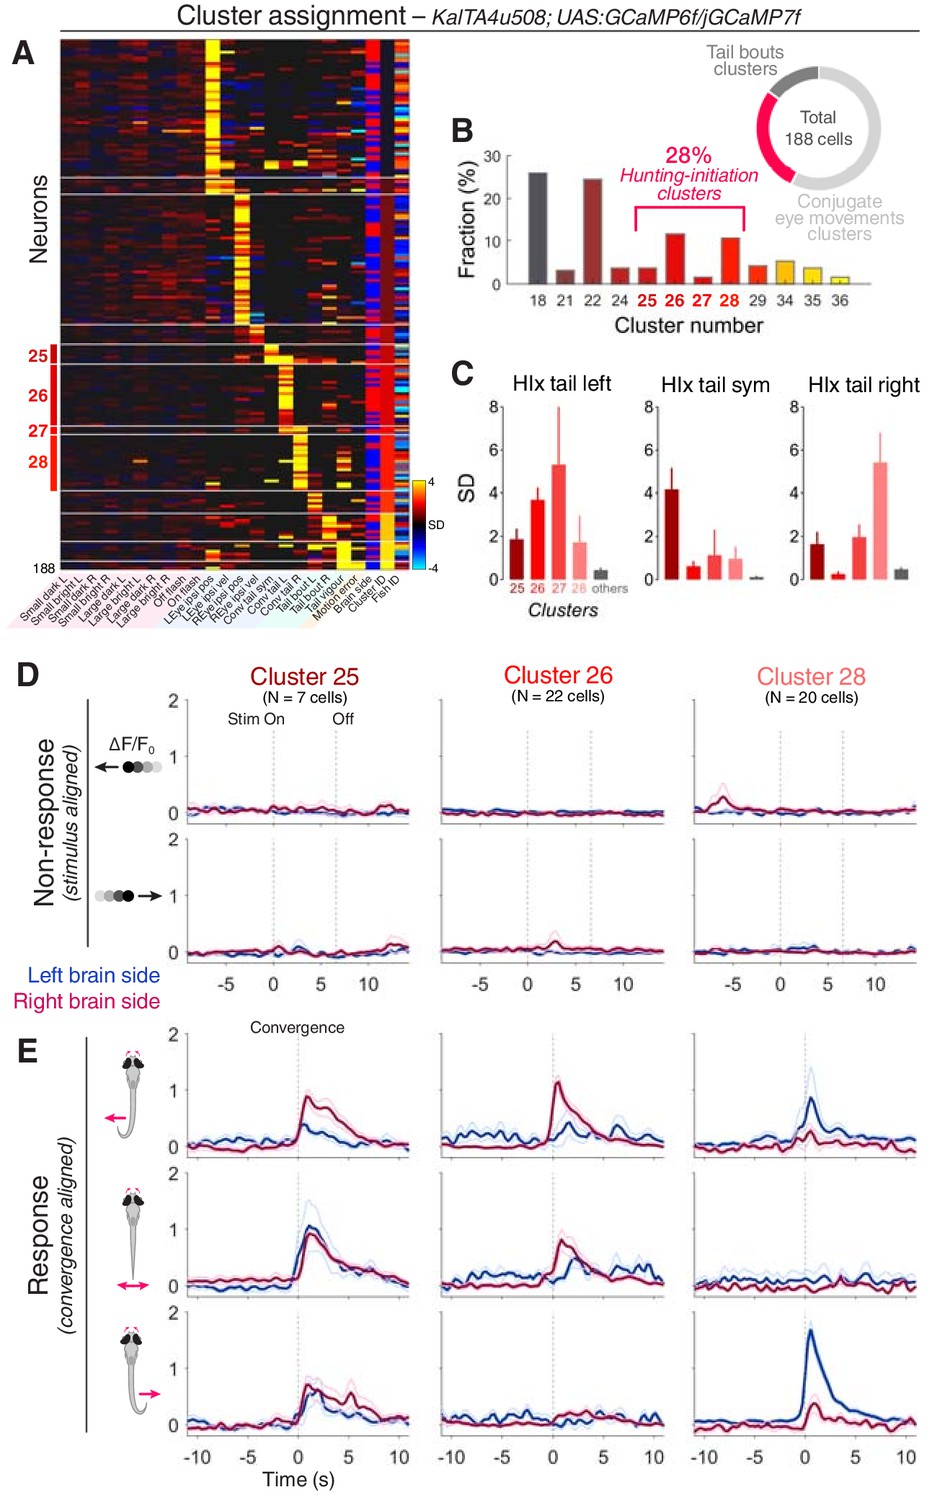
KalTA4u508 pretectal neurons are active during hunting initiation.
(A) VMVs of KalTA4u508 neurons with assigned cluster identities (N = 188 neurons from 30 fish). Cell location (blue for left hemisphere, red for right) is reported by the ‘Brain side’ column. L, left; R, right; Sym, symmetric. (B) Fraction of assigned KalTA4u508 neurons in each cluster. (C) Hunting Index (HIx) scores for KalTA4u508 neurons in different clusters (mean + SEM). (D) Visual stimulus-aligned responses of KalTA4u508 neurons during non-response trials (mean ± SEM). Traces are colour-coded according to anatomical laterality (blue for left hemisphere, red for right). Stim, stimulus. (E) Eye convergence-aligned neuronal responses. Activity during both spontaneous and visually evoked convergent saccades was used. See also Figure 4—figure supplement 1.
-
Figure 4—source data 1
Source data for Figure 4.
Data provided as a MATLAB structure.
- https://doi.org/10.7554/eLife.48114.016
Figure 4—figure supplement 1

Visual responses and activity during spontaneous convergences of KalTA4u508 pretectal neurons.
Distributions of maximum responses across visual stimuli for all recorded neurons in 6–7 dpf elavl3:H2B-GCaMP6s larvae (grey, N = 181,123 cells from eight fish) and KalTA4u508;UAS:GCaMP6f, or KalTA4u508;UAS:jGCaMP7f larvae (magenta, N = 369 cells from 30 fish). Before determining the maximum responses for each neuron, mean integrated ΔF/F0 for each visual stimulus was normalised by dividing values by the corresponding standard deviation (SD) across all neurons from elavl3:H2B-GcaMP6s larvae.
Figure 5 with 2 supplements

Optogenetic stimulation of single KalTA4u508 pretectal neurons induces hunting.
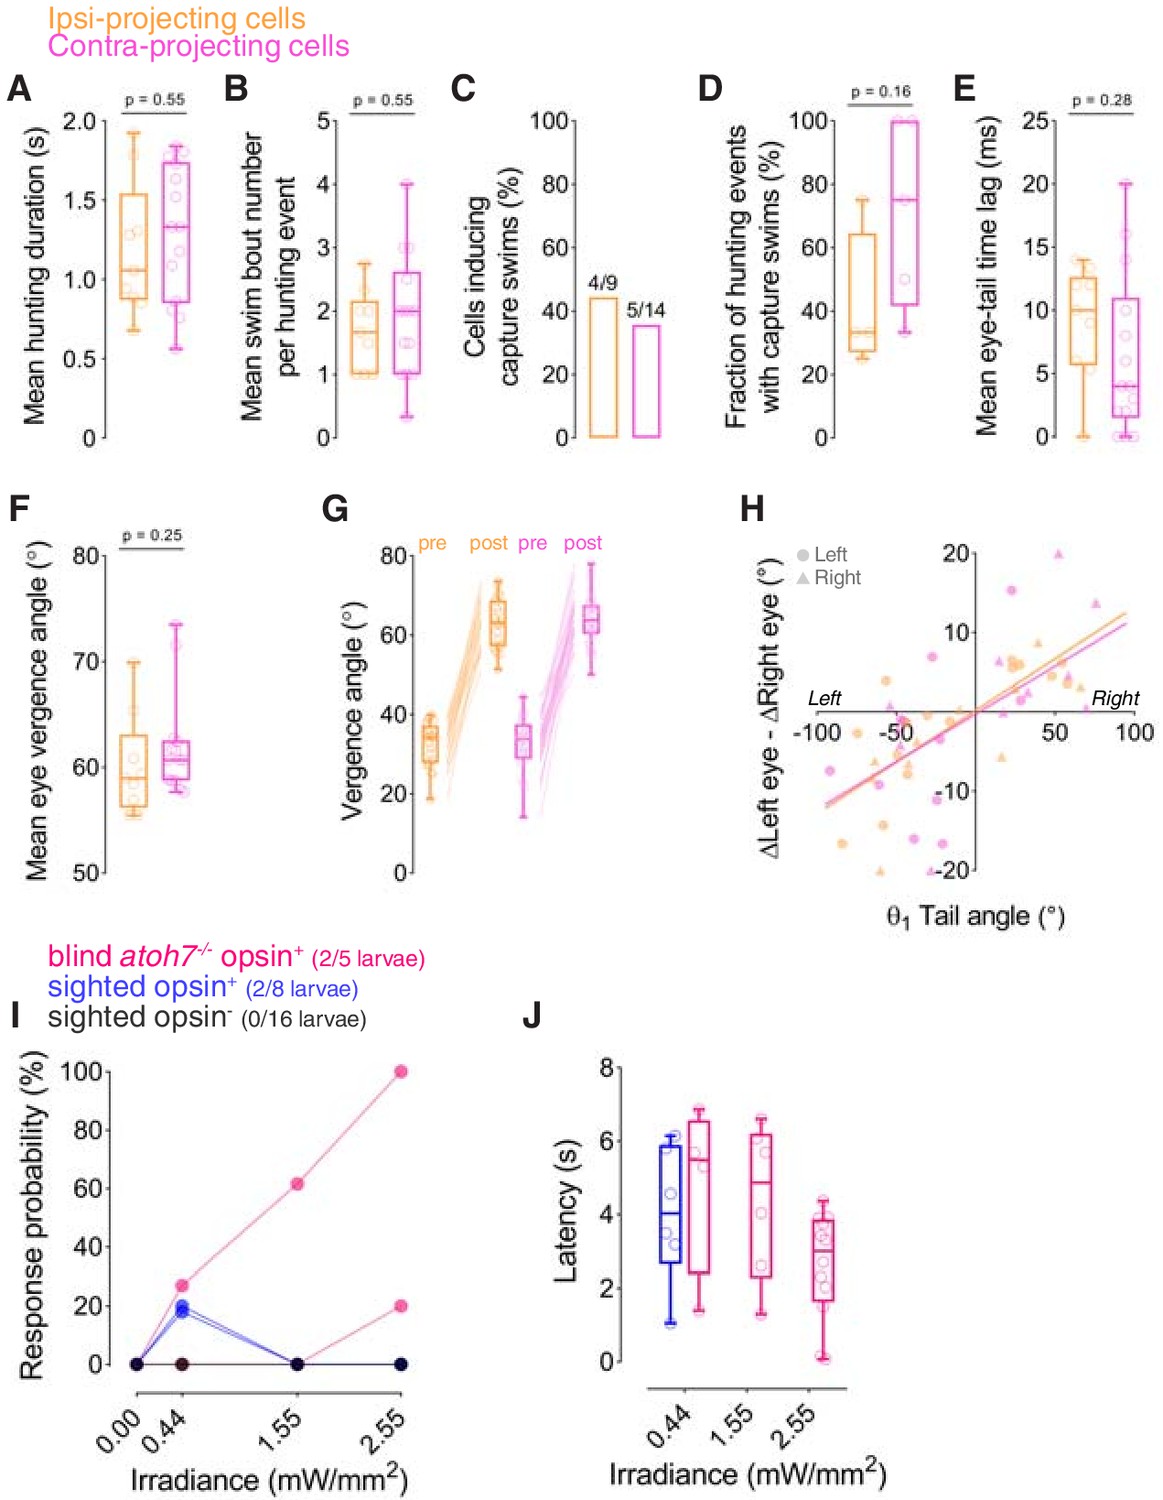
(A) Optogenetic stimulation of single neurons paired with behavioural tracking. (B) A single KalTA4u508 neuron in a 7 dpf KalTA4u508;elavl3:H2B-GcaMP6s larva that was injected at the one-cell stage with UAS:CoChR-tdTomato DNA. This ‘contra-projecting’ neuron is ‘Cell 3’ in Figure 3H. A, anterior; L, left; P, posterior; R, right. Scale bar, 100 µm. (C) Example frames from an optogenetically induced hunting event. Labels indicate time relative to saccadic eye convergence/hunting initiation. (D) Tail angle (grey) and ocular vergence angle (red) during an optogenetically induced hunting event (‘ipsi-projecting’ cell located in the left AF7-pretectum; this neuron is ‘Cell 4’ in Figure 3F; see also Video 2). Asterisk indicates time of convergent saccade. (E) Larval location colour-coded by vergence angle during the example hunting event in (D). (F) Hunting response probability for LED-On versus non-stimulation trials for larvae that performed at least one eye convergence during optogenetic stimulation (N = 23 fish). (G) Morphological identity of KalTA4u508 neurons that elicited hunting upon optogenetic stimulation. Numbers of responsive larvae are reported at the bottom (N = 23 fish). (H) Hunting response probability upon optogenetic stimulation of ipsi-projecting (orange, N = 9 cells) and contra-projecting neurons (magenta, N = 14). (I–P) Comparison of behavioural kinematics between optogenetically induced hunting events (blue, N = 23 fish) and Paramecia hunting (dark grey, N = 31). Tail kinematics for non-hunting swim bouts were recorded from the same larvae that were monitored during Paramecia hunting (light grey). In (L–P), data from all bouts are plotted, whereas in (I–K) the median or mean for each larva is reported. (Q–S) Behavioural kinematics of hunting events induced by stimulation of ipsi-projecting KalTA4u508 neurons (orange, N = 9 cells) or contra-projecting neurons (magenta, N = 14). (T) VMVs and cluster identities of KalTA4u508 neurons that induced hunting upon optogenetic stimulation and subsequently underwent calcium imaging (N = 6 cells from six fish). Symbols on the left indicate projection cell class and left/right location. HIx scores are shown on right. See also Figure 5—figure supplements 1,2 and Video 2.
-
Figure 5—source data 1
Source data for Figure 5.
Data provided as a MATLAB structure.
- https://doi.org/10.7554/eLife.48114.020
Figure 5—figure supplement 1
Behavioural kinematics of optogenetically induced hunting and responses at increased irradiance.
(A–H) Behavioural kinematics for hunting events evoked by optogenetic stimulation of single ipsi-projecting (orange, N = 9 cells) and contra-projecting KalTA4u508 neurons (magenta, N = 14). In (G and H), data from all hunting events are plotted. (I) Hunting response probability upon optogenetic stimulation of single KalTA4u508 pretectal neurons at varying irradiance in sighted (blue, N = 8 fish) and blind atoh7-/- larvae (pink, N = 5). (J) Response latency at varying irradiance for all hunting events.
Figure 5—figure supplement 2

Optogenetic stimulation of the KalTA4u508 pretectal population induces hunting with short latency.
(A) Digital micromirror device (DMD) setup used for patterned illumination of pretectum and behavioural tracking in partially tethered larvae. (B) Opsin expression in a 6 dpf KalTA4u508;UAS:CoChR-tdTomato larva (image acquired with 2-photon microscope). Coloured boxes indicate AF7-pretectal regions targeted for stimulation. A, anterior; L, left; P, posterior; R, right. Scale bar, 50 µm. (C) Frames from an optogenetically induced hunting event in a tethered 7 dpf KalTA4u508;UAS:CoChR-tdTomato larva. Times relative to light onset. Eye position is marked by blue lines. (D) Hunting response probability of opsin-expressing (blue) and control, opsin-negative (grey), larvae (mean ± SEM, N = 7 fish per group). Between 6 and 9 trials per stimulated region were performed in each animal. (E) Mean latency of hunting responses for left (blue) and right (red) pretectal stimulations. (F) Percentage of hunting responses in which the first tail movement was contralaterally directed.
Figure 6 with 1 supplement
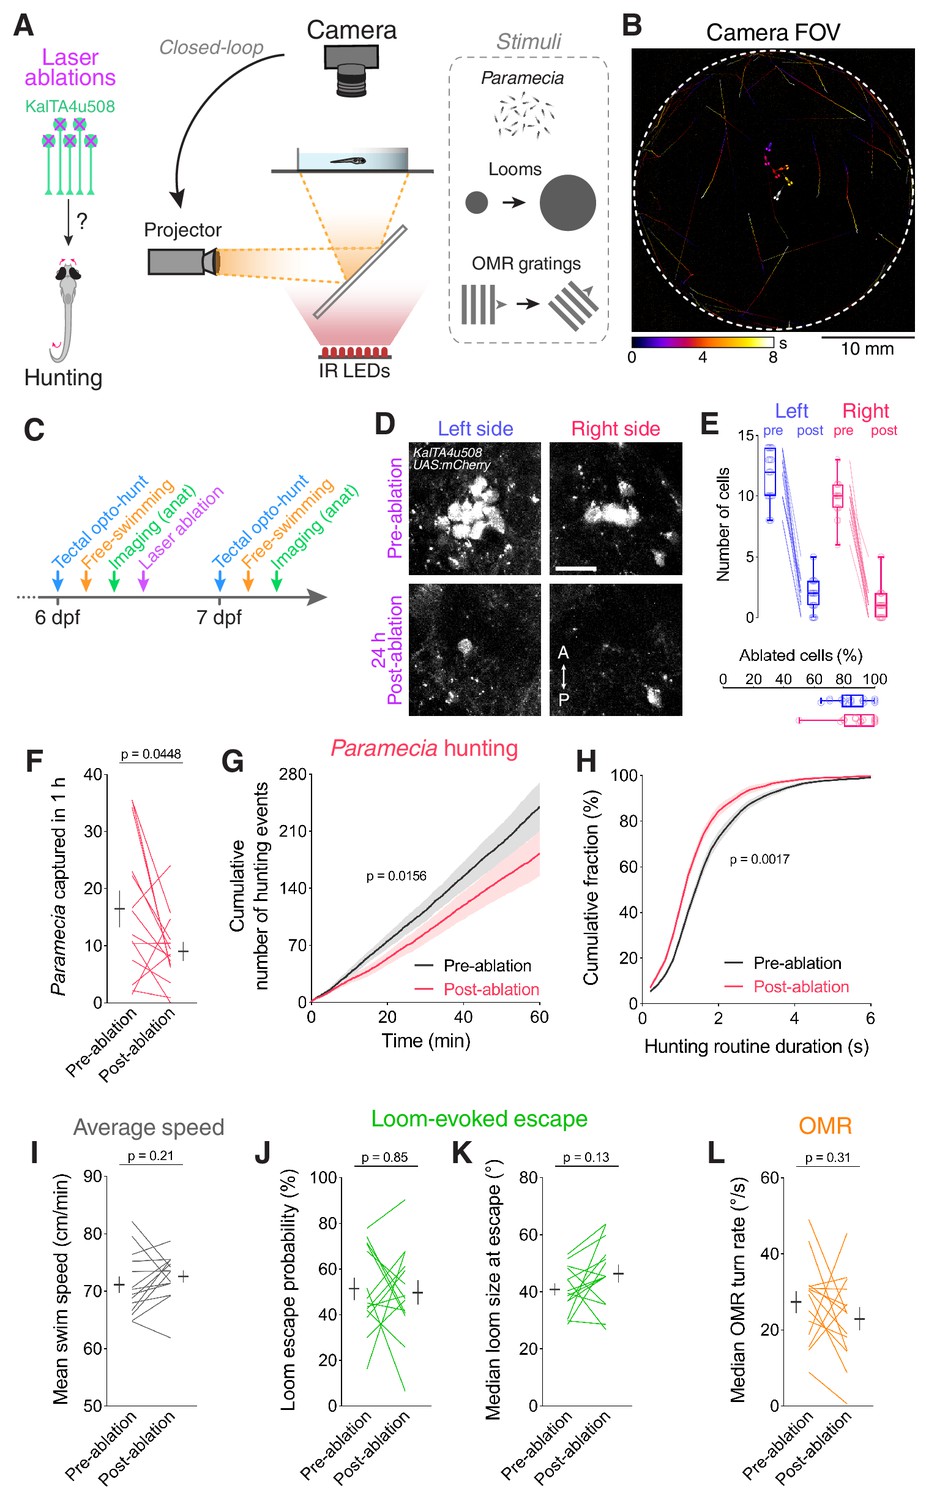
Ablation of KalTA4u508 pretectal neurons impairs hunting.
(A) Laser ablation of KalTA4u508 pretectal neurons and assessment of visuomotor behaviours. (B) Time-projection of larval behaviour (duration 8 s) showing trajectories of Paramecia and larval zebrafish swimming in the arena. (C) Time course of behavioural tests, ablation and brain imaging. (D) Pretectal neurons before (top, 6 dpf) and 24 hr after (bottom, 7 dpf) bilateral laser-ablations in a KalTA4u508;UAS:mCherry;elavl3:itTA;Ptet:ChR2-YFP larva. Images show maximum-intensity projections (red channel, 10 planes, 10 µm depth). A, anterior; P, posterior. Scale bar, 20 µm. (E) Quantification of cell ablation in left (blue) and right (red) AF7-pretectum (N = 14 fish). (F–H) Assessment of hunting performance before and after bilateral ablation of KalTA4u508 neurons (N = 14 fish). Mean ± SEM is reported for each condition. (I–L) Average swim speed, loom-evoked escape and OMR behaviour, before and after ablations. See also Figure 6—figure supplement 1.
-
Figure 6—source data 1
Source data for Figure 6.
Data provided as a MATLAB structure.
- https://doi.org/10.7554/eLife.48114.024
Figure 6—figure supplement 1
Assessment of visuomotor behaviours in control larvae.
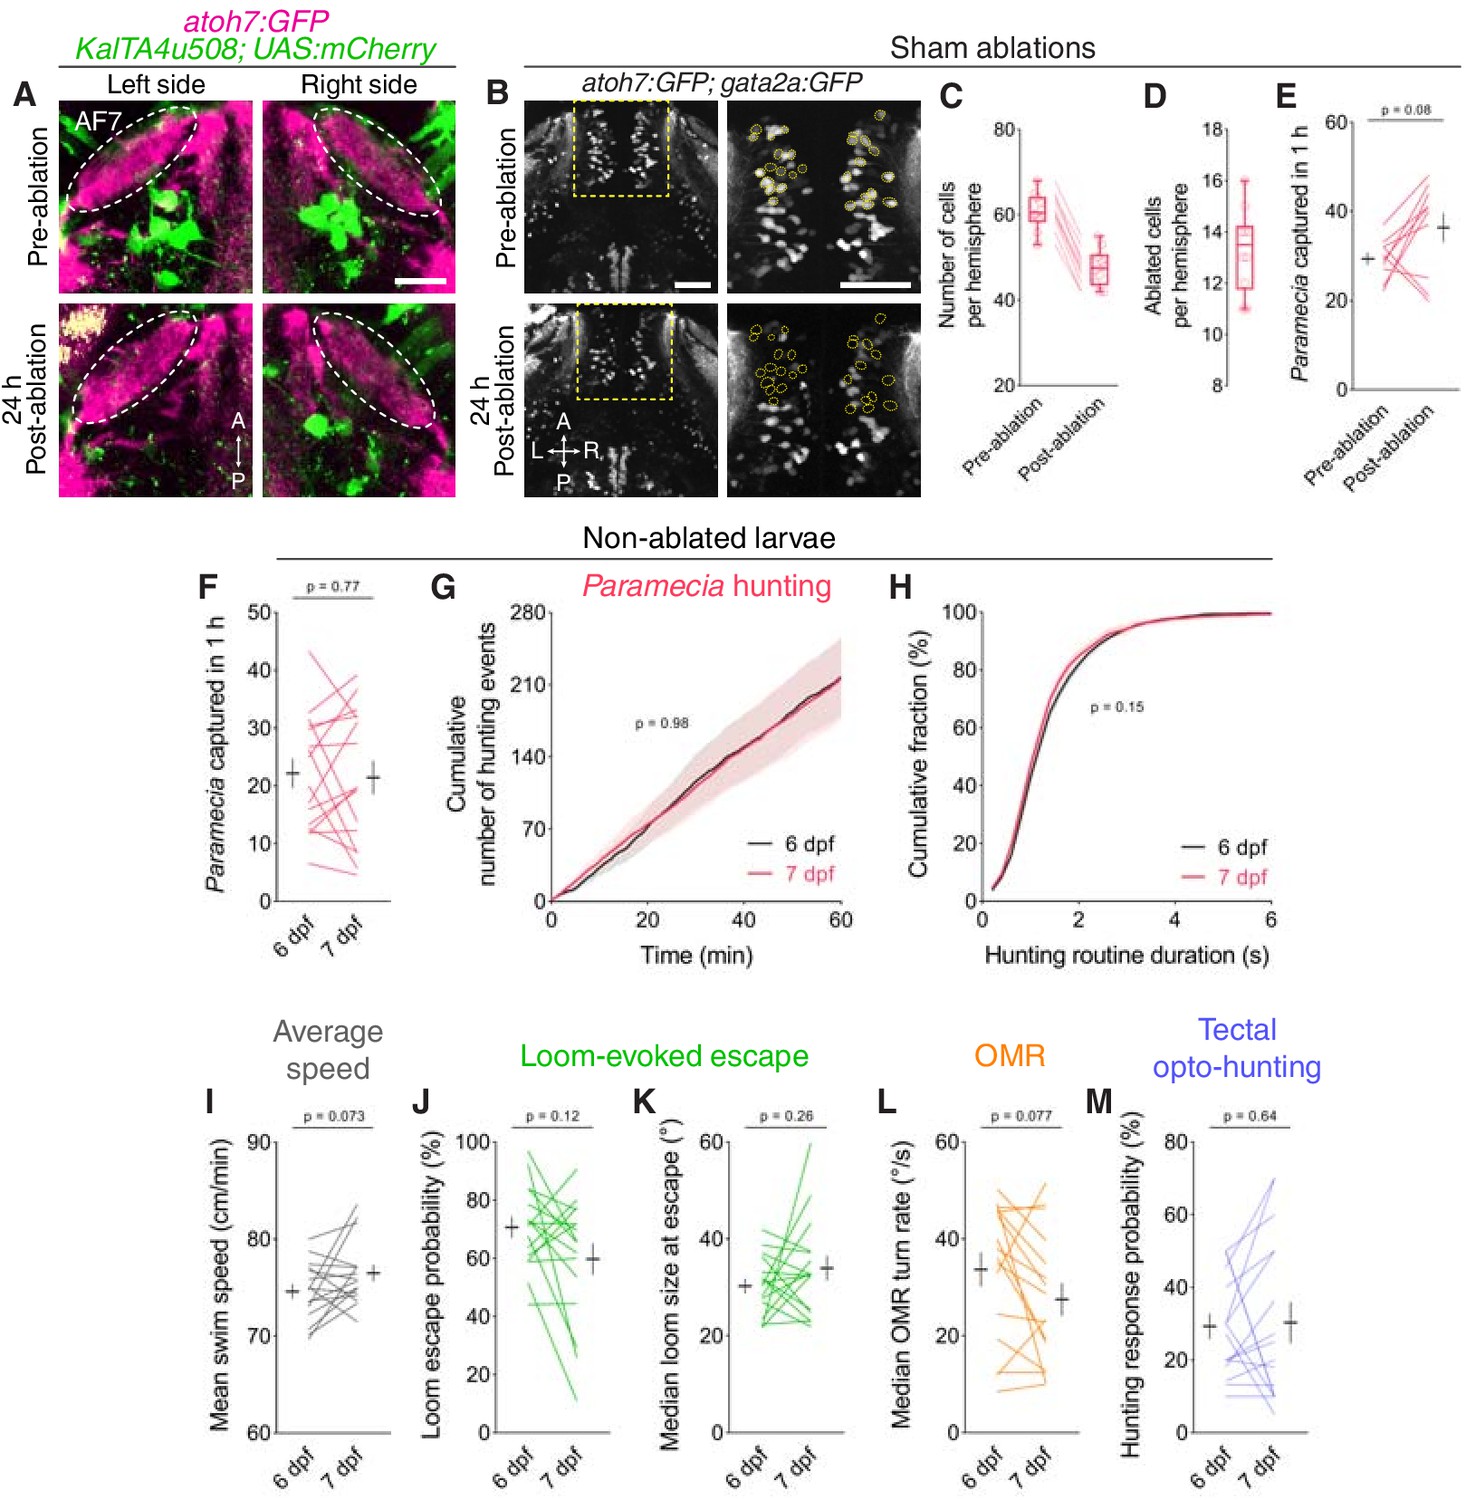
(A) RGC axonal arborisations in AF7 (magenta) before (top, 6 dpf) and 24 hr after (bottom, 7 dpf) bilateral laser-ablation of KalTA4u508 pretectal neurons (green) in a KalTA4u508;UAS:mCherry;atoh7:GFP larva. (B) Sham ablations. Thalamic neurons before (top, 6 dpf) and 24 hr after (bottom, 7 dpf) bilateral laser-ablations in a atoh7:GFP;gata2a:GFP larva. Images show maximum-intensity projections (20 µm depth). Targeted cells are outlined in yellow. (C) Mean number of cells labelled in the thalamus per hemisphere before and after ablations (N = 10 fish). (D) Mean number of ablated thalamic cells per hemisphere. (E) Paramecia consumption in atoh7:GFP;gata2a:GFP larvae, before and after thalamic ablations (N = 10 fish). Black symbols show mean ± SEM across animals. (F–H) Non-ablated control. Assessment of Paramecia hunting in KalTA4u508;UAS:mCherry;elavl3:itTA;Ptet:ChR2-YFP control larvae at 6 and 7 dpf (N = 16 fish). (I–L) Average swim speed, loom-evoked escape and OMR, in control larvae. (M) Hunting response probability upon optogenetic stimulation of avOT in non-ablated control larvae. Scale bars, 50 µm, except in (A), 20 µm. A, anterior; L, left; P, posterior; R, right.
Figure 7 with 1 supplement
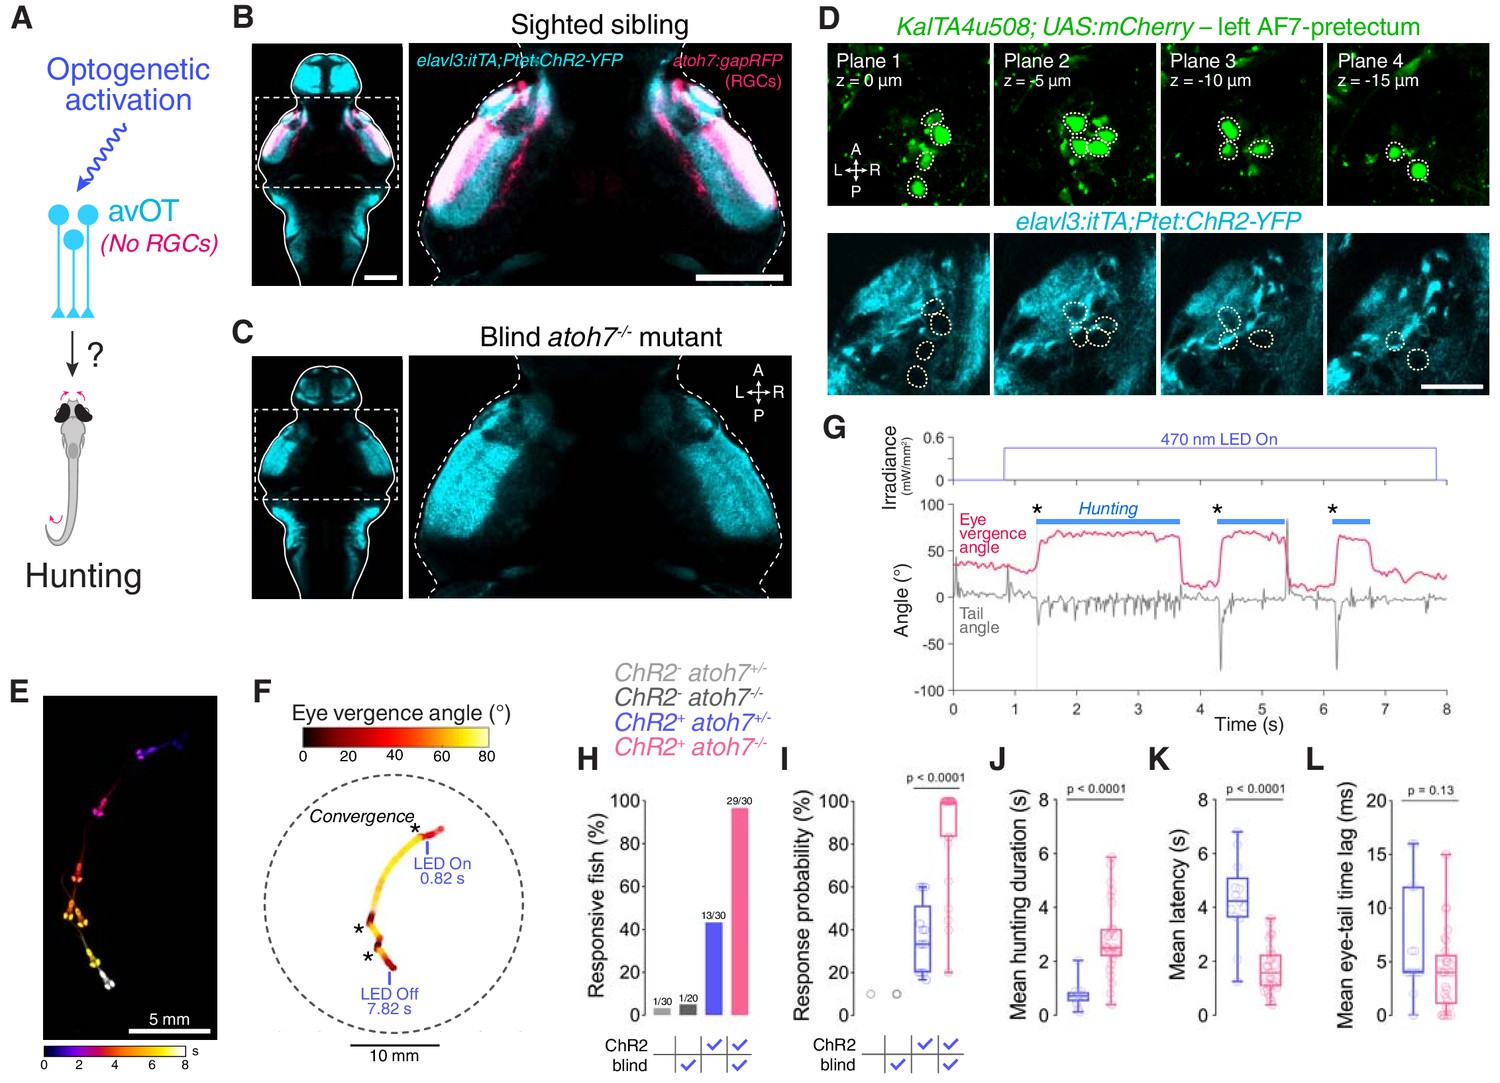
Optogenetic stimulation of avOT induces hunting in the absence of RGCs.
(A) Optogenetic stimulation of anterior-ventral optic tectum (avOT). (B–C) Dorsal view of ChR2-YFP expression in sighted (B) and blind atoh7-/- (C) 6 dpf elavl3:itTA;Ptet:ChR2-YFP;atoh7:gapRFP larvae registered to the ZBB brain atlas. Axonal projections of RGCs labelled by the atoh7:gapRFP transgene are displayed in magenta and are absent in atoh7-/- larvae. Images derive from median datasets across multiple immunostained brains (N = 6 sibling and N = 7 blind fish) and show maximum-intensity projections through focal planes encompassing AF7-pretectal regions. (D) ChR2 expression relative to KalTA4u508 neurons in a 6 dpf KalTA4u508;UAS:mCherry;elavl3:itTA;Ptet:ChR2-YFP larva. Images are single focal planes obtained from the left AF7-pretectum (plane one is dorsal relative to the other z-planes). KalTA4u508 neurons are not labelled with ChR2-YFP. (E) Time sequence composite image showing selected frames from an example optogenetically induced hunting sequence in a blind atoh7-/- 6 dpf elavl3:itTA;Ptet:ChR2-YFP;atoh7:gapRFP larva (see also Video 3). (F) Vergence angle overlaid onto larval location during the optogenetically induced hunting sequence from (E). Asterisks indicate time of convergent saccades. (G) Tail angle (grey) and ocular vergence angle (red) during the optogenetically induced hunting sequence shown in (E) and (F). Asterisks indicate time of convergent saccades. (H) Fraction of larvae that performed eye convergences during optogenetic stimulations. Larvae were either sighted (atoh7+/+ or atoh7+/-) or blind (atoh7-/-) and either opsin-positive (elavl3:itTA;Ptet:ChR2-YFP;atoh7:gapRFP) or opsin-negative (atoh7:gapRFP). Numbers of responsive larvae are reported above bars. (I) Response probability of larvae that performed eye convergence in at least one optogenetic stimulation trial. (J–L) Behavioural kinematics for optogenetically induced hunting events elicited in sighted (blue, N = 13 fish) and blind atoh7-/- (pink, N = 29) elavl3:itTA;Ptet:ChR2-YFP;atoh7:gapRFP larvae. Scale bars, 100 µm, except in (D), 30 µm. A, anterior; L, left; P, posterior; R, right. See also Figure 7—figure supplement 1 and Video 3.
-
Figure 7—source data 1
Source data for Figure 7.
Data provided as a MATLAB structure.
- https://doi.org/10.7554/eLife.48114.027
Figure 7—figure supplement 1
ChR2 expression in elavl3:itTA;Ptet:ChR2-YFP;atoh7:gapRFP larvae and additional behavioural kinematics of optogenetically induced hunting.
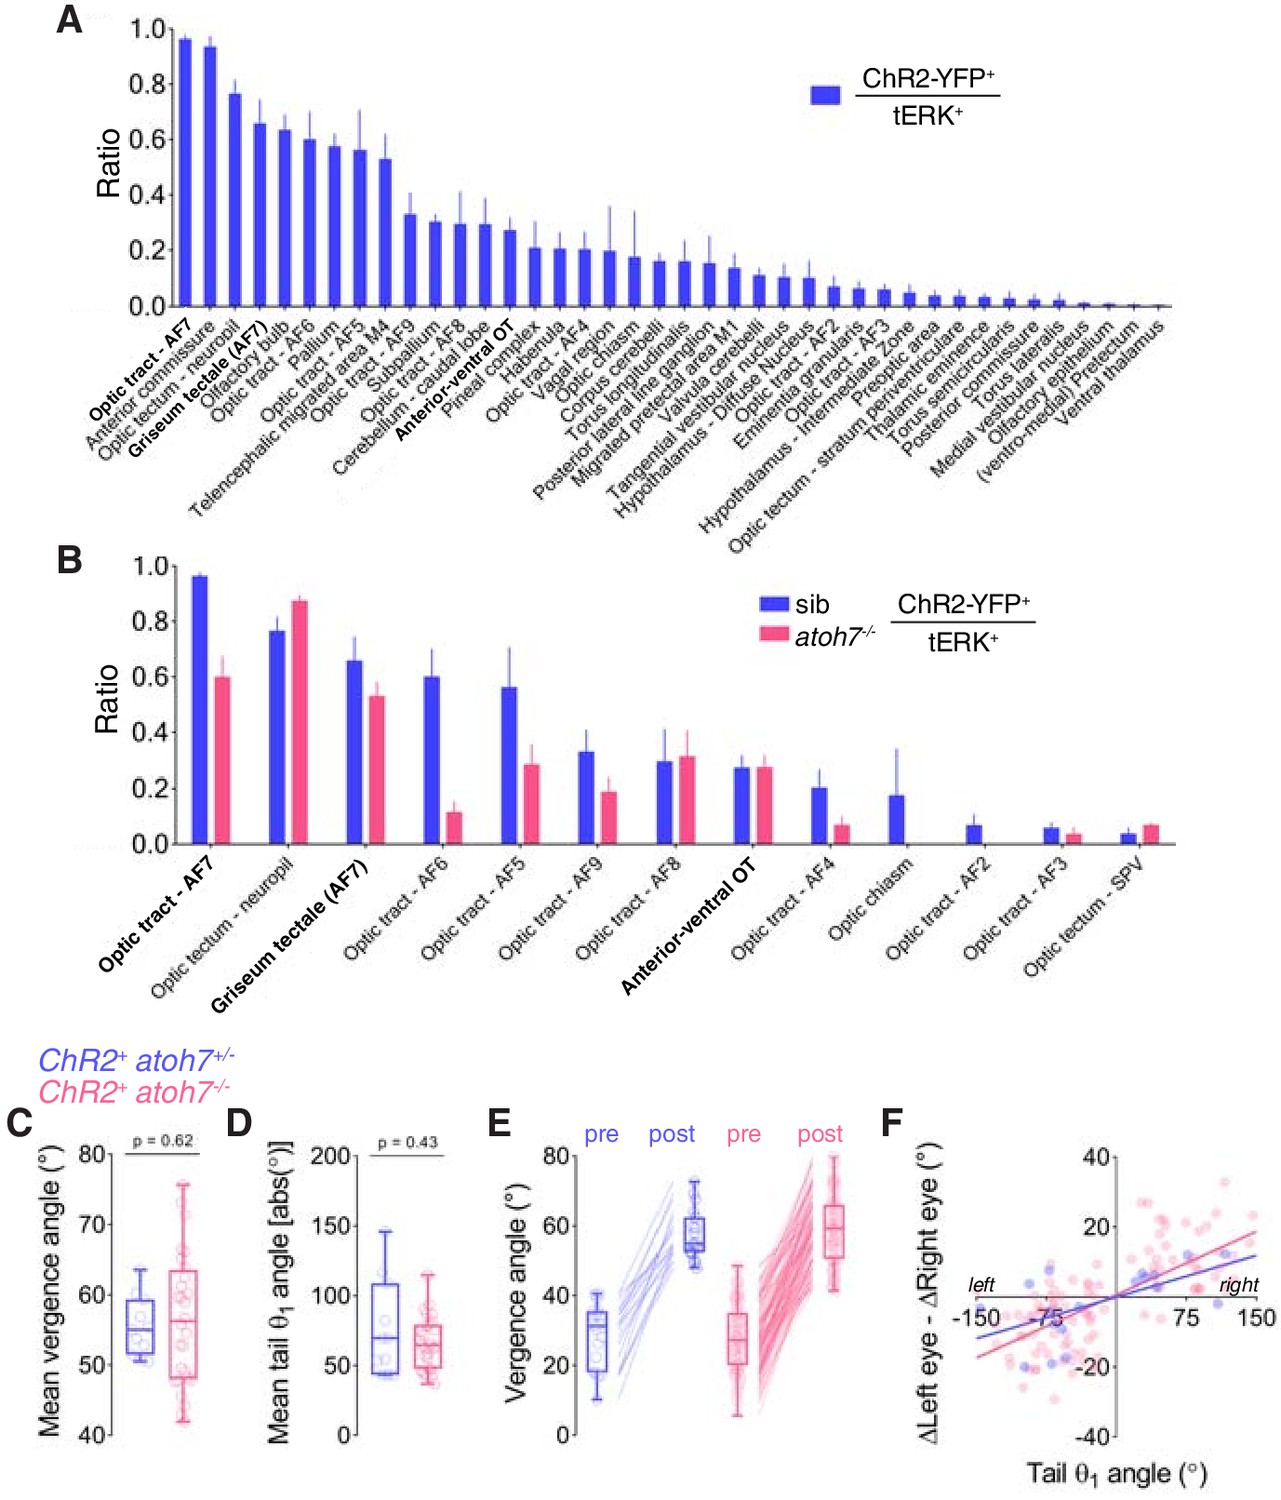
(A) Overlap between ChR2-YFP and tERK immunostain in elavl3:itTA;Ptet:ChR2-YFP larvae, computed as ratio between ChR2-YFP-positive voxels and tERK-positive voxels in each brain region. Mean + SEM values are reported only for anatomical regions showing overlap greater than zero (N = 6 fish). AF7-pretectum encompasses the ZBB masks ‘Optic tract - AF7’ and ‘Griseum tectale (AF7)’. (B) Overlap between ChR2-YFP and tERK immunostain in sighted (blue, N = 6 fish) and blind atoh7-/- (pink, N = 7) larvae. (C–F) Behavioural kinematics for optogenetically induced hunting events elicited in sighted (blue, N = 13 fish) and blind atoh7-/- (pink, N = 29) elavl3:itTA;Ptet:ChR2-YFP;atoh7:gapRFP larvae. In (E) and (F), data from all hunting events are plotted, whereas in the other plots the mean for each larva is reported.
Figure 8

KalTA4u508 pretectal neurons are required for tectally induced hunting.
(A) Optogenetic stimulation of avOT before and after ablation of KalTA4u508 pretectal neurons. (B) Hunting response probability upon optogenetic stimulation of KalTA4u508;UAS:mCherry;elavl3:itTA;Ptet:ChR2-YFP larvae, before and after bilateral ablation of KalTA4u508 pretectal neurons (N = 14 fish). (C) Model of the neural circuit that induces hunting behaviour. Two classes of AF7-pretectal projection neuron are capable of inducing hunting. Contralaterally projecting APN neurons are likely to induce hunting by recruiting activity in oculomotor and locomotor pattern generating circuits in the mid/hindbrain tegmentum. Ipsilaterally projecting AF7-pretectal neurons may recruit ipsilateral tectofugal pathways. Activation of anterior-ventral tectum requires AF7-pretectal neurons to induce hunting and likely operates via the contralaterally projecting APN population because unilateral avOT stimulation produces contralaterally directed responses (Fajardo et al., 2013). APN, accessory pretectal nucleus.
-
Figure 8—source data 1
Source data for Figure 8.
Data provided as a MATLAB structure.
- https://doi.org/10.7554/eLife.48114.030
Videos
Video 1
Z-stack of transgenic line used for calcium imaging with annotated RGC arborisation fields.
Imaging volume (z-stack) of 6 dpf elavl3:H2B-GCaMP6s;atoh7:gapRFP brain (mean of N = 3 fish) with labelled RGC arborisation fields (AFs). The green channel shows the elavl3:H2B-GCaMP6s reference brain used for anatomical registration. Related to Figure 1.
Video 2
Hunting behaviour evoked by optogenetic stimulation of a single KalTA4u508 pretectal neuron.
Data from a 6 dpf larva in which a single ipsi-projecting KalTA4u508 neuron, located in the left AF7-pretectum (Cell 4 in Figure 3F), expressed CoChR. Tracking data is reported in Figure 5D,E. The video was acquired at 250 frames per second and plays at 0.4 times the original speed. The raw movie is showed on the left, and a background-subtracted inset centred on the larva is showed on the right. Related to Figure 5.
Video 3
Hunting behaviour evoked by optogenetic stimulation of the anterior-ventral optic tectum in a blind larva.
Optogenetically induced hunting behaviour in a blind atoh7-/- 6 dpf elavl3:itTA;Ptet:ChR2-YFP;atoh7:gapRFP larva. Tracking data is reported in Figure 7E–G. The video was acquired at 250 frames per second and plays at 0.4 times the original speed. The raw movie is showed on the left, and a background-subtracted inset centred on the larva is showed on the right. Related to Figure 7.
Tables
Key resources table
| Reagent type (species) or resource | Designation | Source or reference | Identifiers | Additional information | |
|---|---|---|---|---|---|
| Genetic reagent(Danio rerio) | Tg(KalTA4u508) u508Tg | This study | Transgene | ||
| Genetic reagent(Danio rerio) | Tg(UAS:jGCaMP7f)u341Tg | This study | Transgene | ||
| Genetic reagent(Danio rerio) | Tg(UAS:CoChR-tdTomato)u332Tg | This study | ZFIN ID: ZDB-ALT-190226–4 | Transgene | |
| Genetic reagent (Danio rerio) | Tg(elavl3:H2B-GCaMP6s)jf5Tg | PMID: 25068735 | ZFIN ID: ZDB-ALT-141023–2 | Vladimirov et al., 2014 | |
| Genetic reagent (Danio rerio) | Tg(atoh7:gapRFP) cu2Tg | PMID: 17147778 | ZFIN ID: ZDB-ALT-070129–2 | Zolessi et al., 2006 | |
| Genetic reagent (Danio rerio) | Tg(UAS:GCaMP6f, cryaa:mCherry)icm06Tg | PMID: 28623664 | ZFIN ID: ZDB-ALT-160119–5 | Knafo et al. (2017) | |
| Genetic reagent(Danio rerio) | Tg(UAS-E1b:NfsB-mCherry)jh17Tg | PMID: 17335798 | ZFIN ID: ZDB-ALT-110222–4 | Davison et al. (2007) | |
| Genetic reagent(Danio rerio) | TgBAC(slc17a6b:loxP-DsRed-loxP-GFP)nns14Tg | PMID: 21199937 | ZFIN ID: ZDB-ALT-110413–5 | Koyama et al. (2011) | |
| Genetic reagent (Danio rerio) | Tg(UAS:RFP)tpl2Tg | PMID: 24179142 | ZFIN ID: ZDB-ALT-131119–25 | Auer et al. (2014) | |
| Genetic reagent(Danio rerio) | Tg(atoh7:GFP)rw021Tg | PMID: 12702661 | ZFIN ID: ZDB-ALT-050627–2 | Masai et al. (2003) | |
| Genetic reagent(Danio rerio) | Tg(Cau.Tuba1:c3paGFP)a7437Tg | PMID: 22704987 | ZFIN ID: ZDB-ALT-120919–1 | Bianco et al. (2012) | |
| Genetic reagent (Danio rerio) | Tg(elavl3:ITETA-PTET:Cr.Cop4-YFP)fmi2Tg | PMID: 23641200 | ZFIN ID: ZDB-ALT-120209–3 | Fajardo et al. (2013) | |
| Genetic reagent (Danio rerio) | Tg(gata2a:GFP)pku2Et | PMID: 18164283 | ZFIN ID: ZDB-ALT-080514–1 | Wen et al., 2008 | |
| Genetic reagent (Danio rerio) | atoh7th241 | PMID: 11430806 | ZFIN ID: ZDB-ALT-980203–363 | Kay et al. (2001) | |
| Recombinant DNA reagent | UAS:CoChR-tdTomato | This study | Plasmid | ||
| Sequence-based reagent | CoChR_fw PCR primer | This study | CTCAGCGTAAAGCCACCATGCTGGGAAACG | ||
| Sequence-based reagent | CoChR_rev PCR primer | This study | TACTACCGGTGCCGCCACTGT | ||
| Sequence-based reagent | CoChR_tdT_fw PCR primer | This study | ACAGTGGCGGCACCGGTAGTA | ||
| Sequence-based reagent | tdT_rev PCR primer | This study | CTAGTCTCGAGATCTCCATGTTTACTTATACAGCTCATCCATGCC | ||
| Sequence-based reagent | UAS_jGCaMP7_fw PCR primer | This study | CGTAAAGCCACCATGGGTTCTCATC | ||
| Sequence-based reagent | UAS_jGCaMP7_rev PCR primer | This study | CTCGAGATCTCCATGTTTACTTCGCTGTCATCATTTGTACAAAC | ||
| Sequence-based reagent | pvalb_fw PCR primer | This study | GGGGACAAGTTTGTACAAAAAAGCAGGCTGGATGGTGGGCCAAATCAAAGGCTAC | ||
| Sequence-based reagent | pvalb_rev PCR primer | This study | GGGGACCACTTTGTACAAGAAAGCTGGGTGGAACGAGACCGGCAACACACAG | ||
| Antibody | Rabbit polyclonal anti-GFP; TP401 | AMS Biotechnology | RRID: AB_10890443 | 1:1000 | |
| Antibody | Mouse monoclonalanti-44/42 MAPK (Erk1/2); 4696 | Cell Signaling Technology | RRID: AB_390780 | 1:500 | |
| Antibody | Rat monoclonal anti-GFP; 04404–26 | Nacalai Tesque | RRID: AB_10013361 | 1:1000 | |
| Antibody | Rabbit polyclonal anti-RFP/DsRed; PM005 | MBL International | RRID: AB_591279 | 1:1000 | |
| Software, algorithm | MATLAB | MathWorks | RRID: SCR_001622 | https://uk.mathworks.com/products/matlab.html | |
| Software, algorithm | LabView | National Instruments | RRID: SCR_014325 | http://www.ni.com/en-gb/shop/labview.html | |
| Software, algorithm | Prism | GraphPad | RRID: SCR_002798 | https://www.graphpad.com/scientific-software/prism/ | |
| Software, algorithm | FIJI | PMID: 22743772 | RRID: SCR_002285 | https://imagej.net/Fiji/Downloads | |
| Software, algorithm | Simple NeuriteTracer (ImageJ plugin) | PMID: 21727141 | RRID: SCR_016566 | https://imagej.net/Simple_Neurite_Tracer | |
| Software, algorithm | Advanced Normalization Tools (ANTs) | PMID: 20851191 | RRID: SCR_004757 | http://stnava.github.io/ANTs/ | |
| Software, algorithm | Psychophysics Toolbox | PMID: 9176952 | RRID: SCR_002881 | http://psychtoolbox.org/ | |
| Software, algorithm | Zebrafish Brain Browser (ZBB) | PMID: 26635538 | https://science.nichd.nih.gov/confluence/display/burgess/Brain+Browser | ||
| Software, algorithm | MATLAB script for cell detection | PMID: 27881303 | https://github.com/ahrens-lab/Kawashima_et_al_Cell_2016/ | ||
| Software, algorithm | Kernel Density Estimation Toolbox for MATLAB | https://www.ics.uci.edu/~ihler/code/kde.html |
Additional files
-
Supplementary file 1
Regression and statistical details.
Spreadsheet containing details of statistical analyses (test used, test statistic, values of N, centre and spread), and description of kinematic regressors.
- https://doi.org/10.7554/eLife.48114.031
-
Supplementary file 2
Anatomical mask – avOT.
TIFF stack containing binary mask defining the ‘avOT’ anatomical region, in ZBB space.
- https://doi.org/10.7554/eLife.48114.032
-
Supplementary file 3
Anatomical mask – AF7-pretectum.
TIFF stack containing binary mask defining the ‘AF7-pretectum’ anatomical region, in ZBB space.
- https://doi.org/10.7554/eLife.48114.033
-
Supplementary file 4
Anatomical mask – NI chata.
TIFF stack containing binary mask defining the ‘NI chata’ anatomical region, in ZBB space.
- https://doi.org/10.7554/eLife.48114.034
-
Transparent reporting form
- https://doi.org/10.7554/eLife.48114.035
Download links
A two-part list of links to download the article, or parts of the article, in various formats.
Downloads (link to download the article as PDF)
Open citations (links to open the citations from this article in various online reference manager services)
Cite this article (links to download the citations from this article in formats compatible with various reference manager tools)
Pretectal neurons control hunting behaviour
eLife 8:e48114.
https://doi.org/10.7554/eLife.48114


