Cohesin controls intestinal stem cell identity by maintaining association of Escargot with target promoters
- Leibniz Institute on Aging – Fritz Lipmann Institute (FLI), Germany
- Buck Institute for Research on Aging, United States
- Genentech, Inc, United States
Figures
Figure 1 with 3 supplements
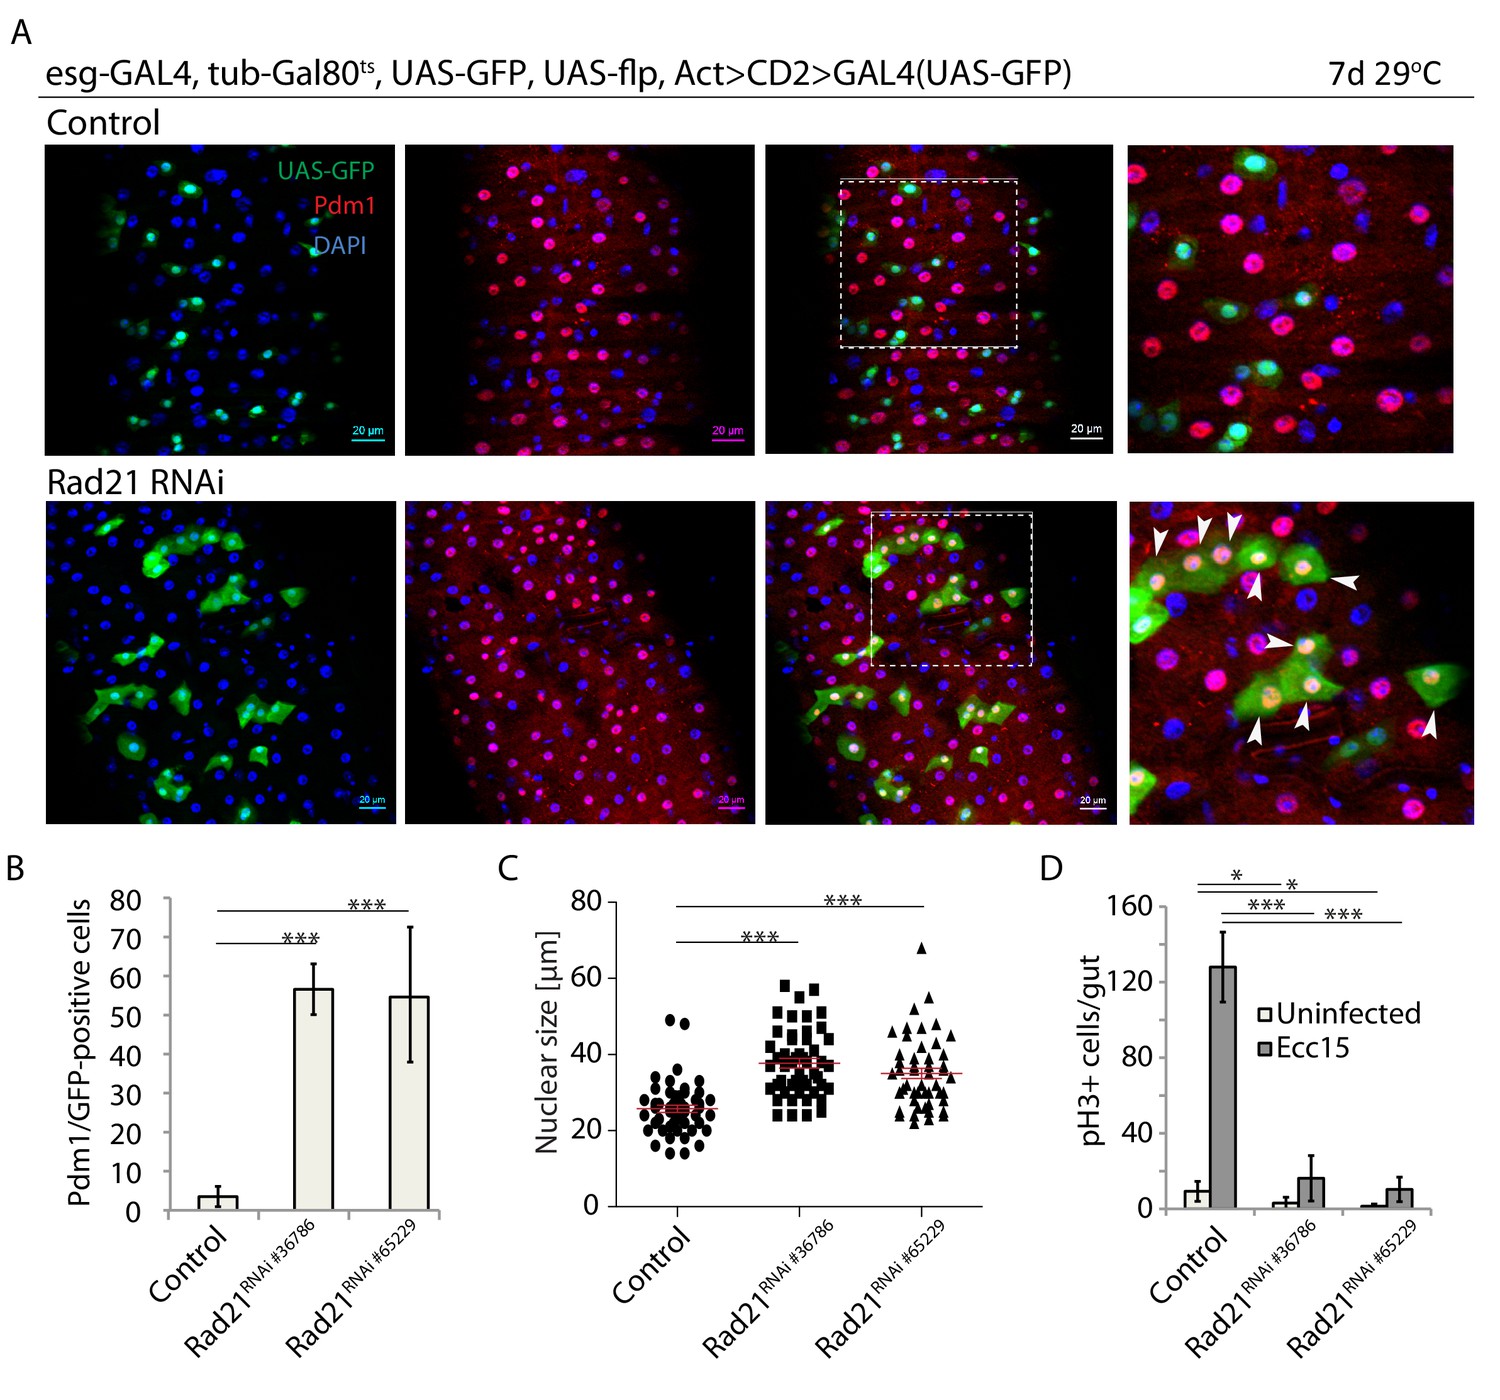
Rad21 knock down leads to premature ISC differentiation.
(A) esg-FlipOut (F/O) midguts expressing UAS-GFP alone (control) or expressing rad21RNAi. Samples were stained for GFP and Pdm1. (B) Quantification of GFP-positive/Pdm1-positive cells from A. (n = 771, 543 and 389) ANOVA. (C) Analysis of nuclei size from A (n = 50). Mann-Whitney Test. (D) Quantification of the number of mitotic pH3-positive cells/midgut in the guts expressing UAS-EYFP alone (control) or expressing rad21RNAi with and without Ecc15 infection. (n = 6–8), ANOVA. *p<0.05, ***p<0.001. Differentiated cells are labeled with white arrowheads. Scale bars, 20 µm.
Figure 1—figure supplement 1
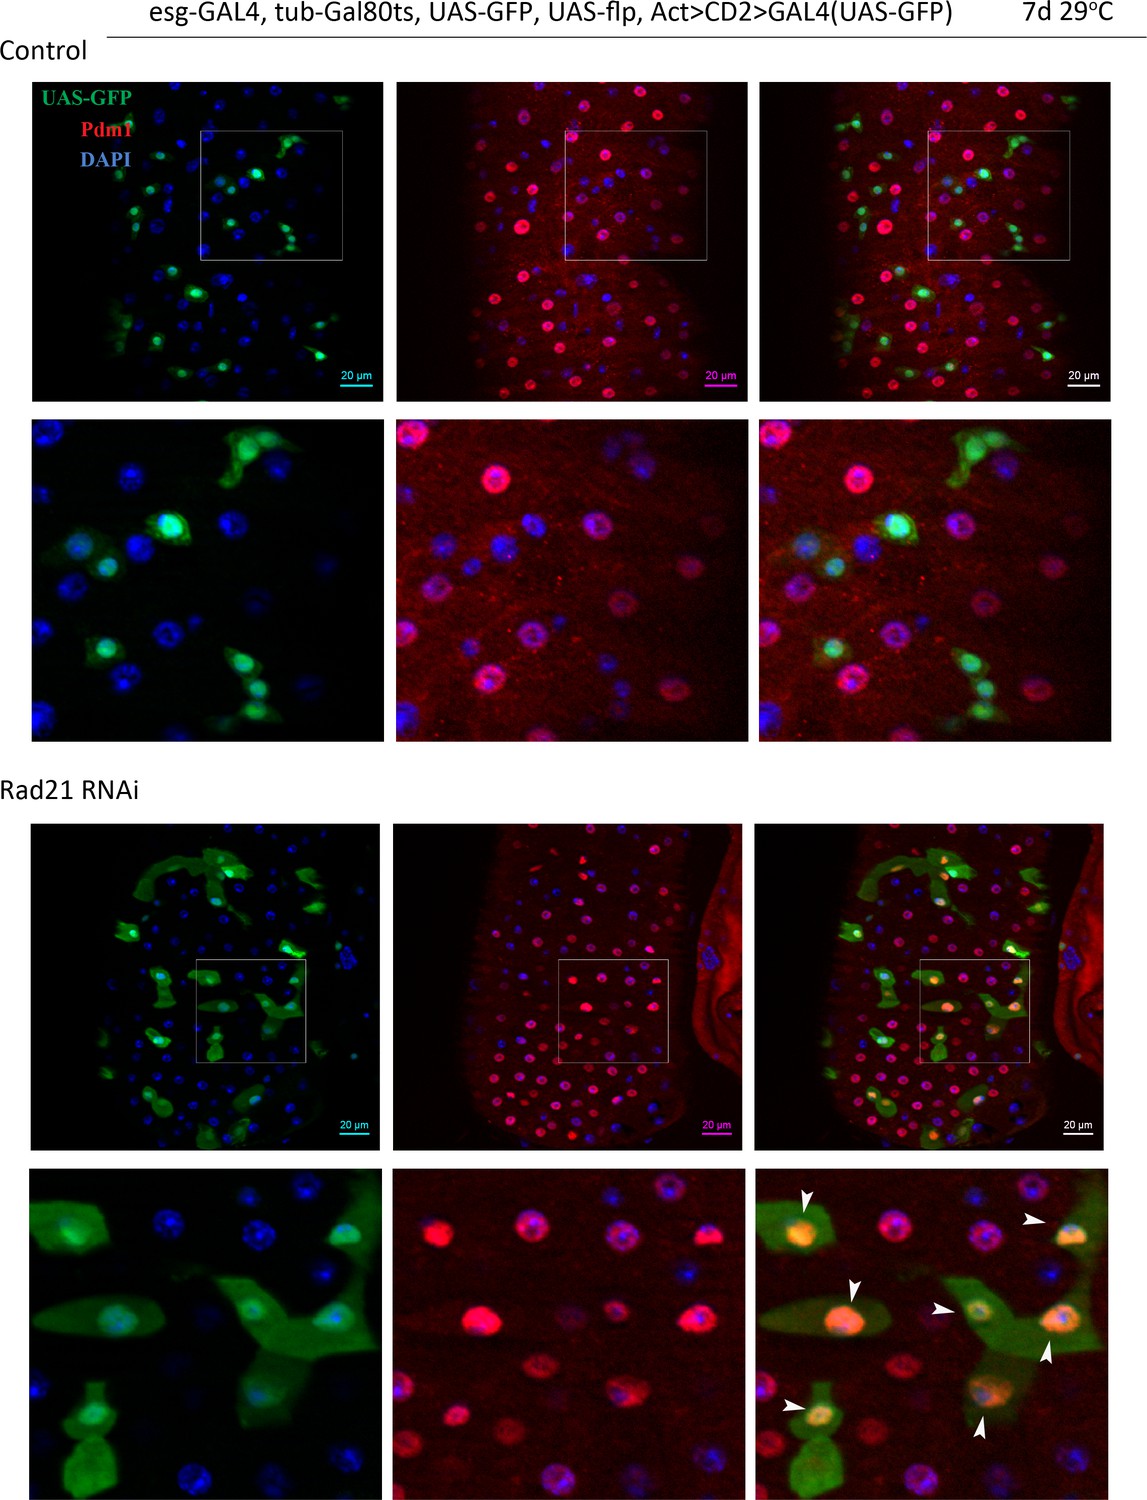
Esg-FlipOut (F/O) midguts expressing UAS-GFP alone (control) or expressing rad21RNAi.
Samples were stained for GFP and Pdm1. Differentiated cells are labeled with white arrowheads. Scale bars, 20 µm.
Figure 1—figure supplement 2
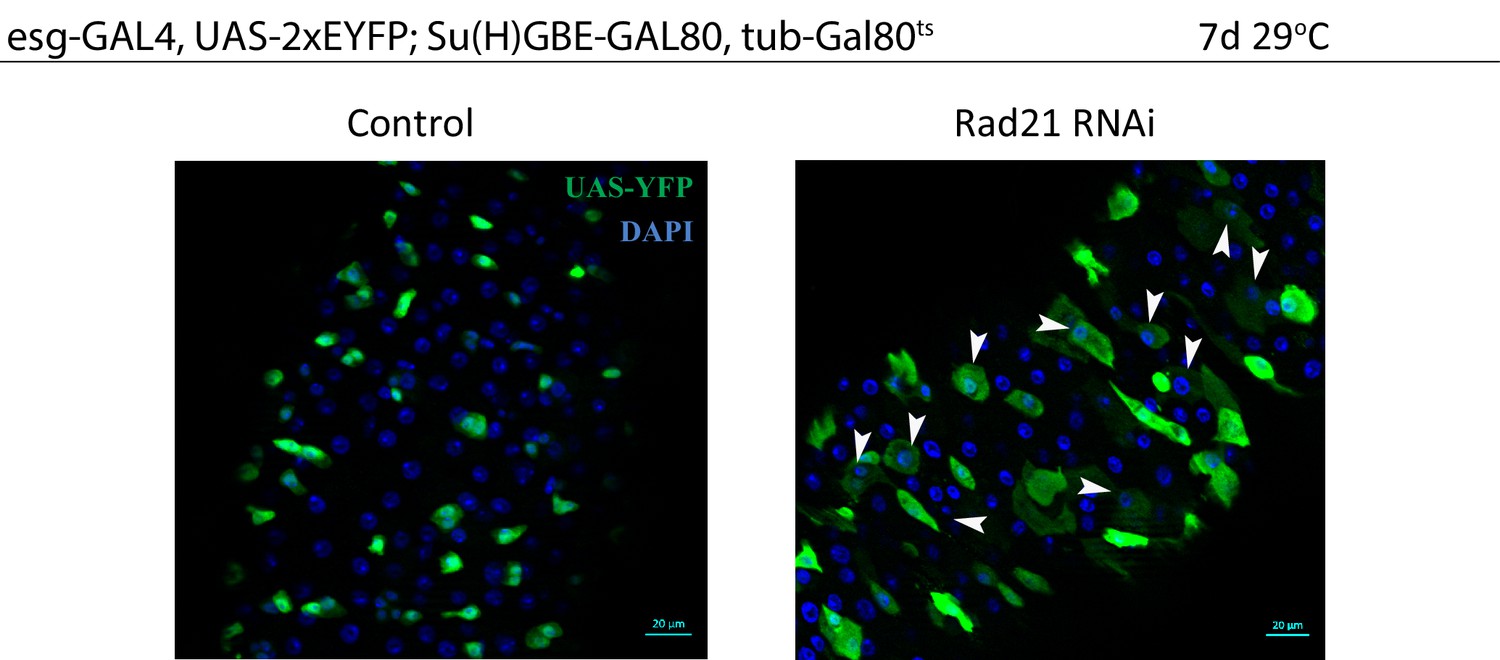
Esgts midguts expressing UAS-EYFP alone (control) or expressing rad21RNAi.
Differentiated cells are labeled with white arrowheads. Samples were stained for GFP. Scale bars, 20 µm.
Figure 1—figure supplement 3

A Esgts midguts expressing UAS-EYFP alone (control) or expressing rad21RNAi.
Samples were stained for GFP and Rad21. Rad21 expression (Control, second raw) or Rad21 knock down efficiency (Rad21 RNAi) is indicated by white arrowheads. Scale bars, 20 µm.
Figure 2 with 1 supplement
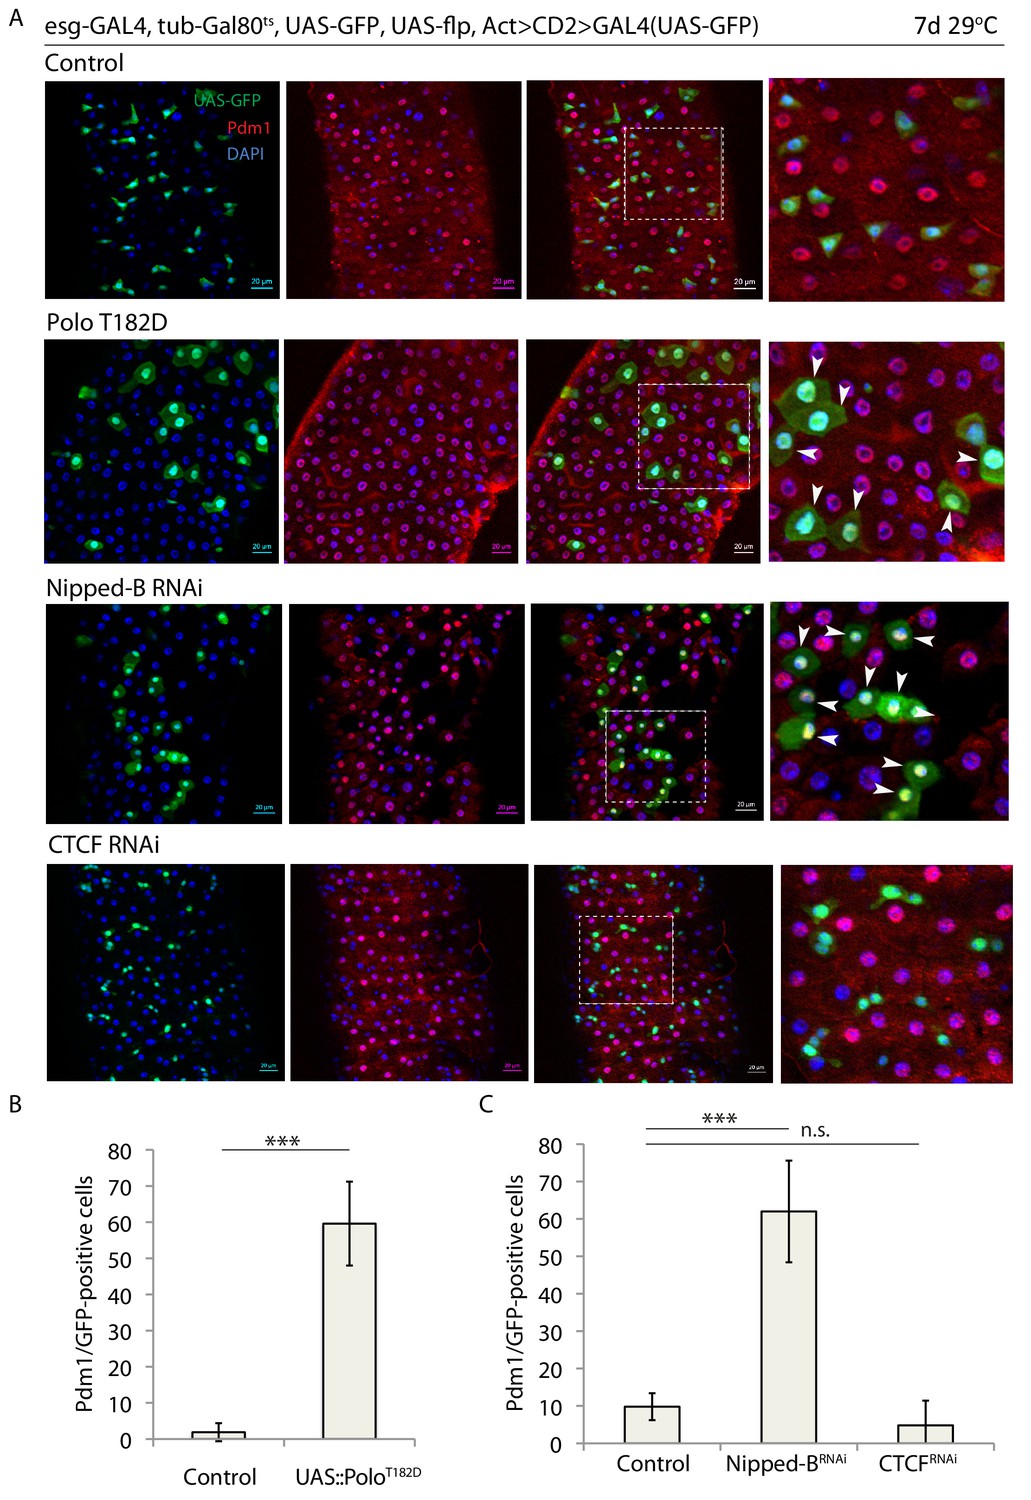
Binding of Rad21 to chromatin is crucial for ISC maintenance.
(A) esg-F/O midguts expressing UAS-GFP alone (control) or expressing UAS-PoloT182D, nippedBRNAi or CTCFRNAi. Samples were stained for GFP and Pdm1. (B and C) Quantification of GFP-positive/Pdm1-positive cells from C. (B n = 640 and 200; C n = 758, 408 and 622), ANOVA. ***p<0.001, n.s. not significant. Differentiated cells are labeled with white arrowheads. Scale bars, 20 µm.
Figure 2—figure supplement 1
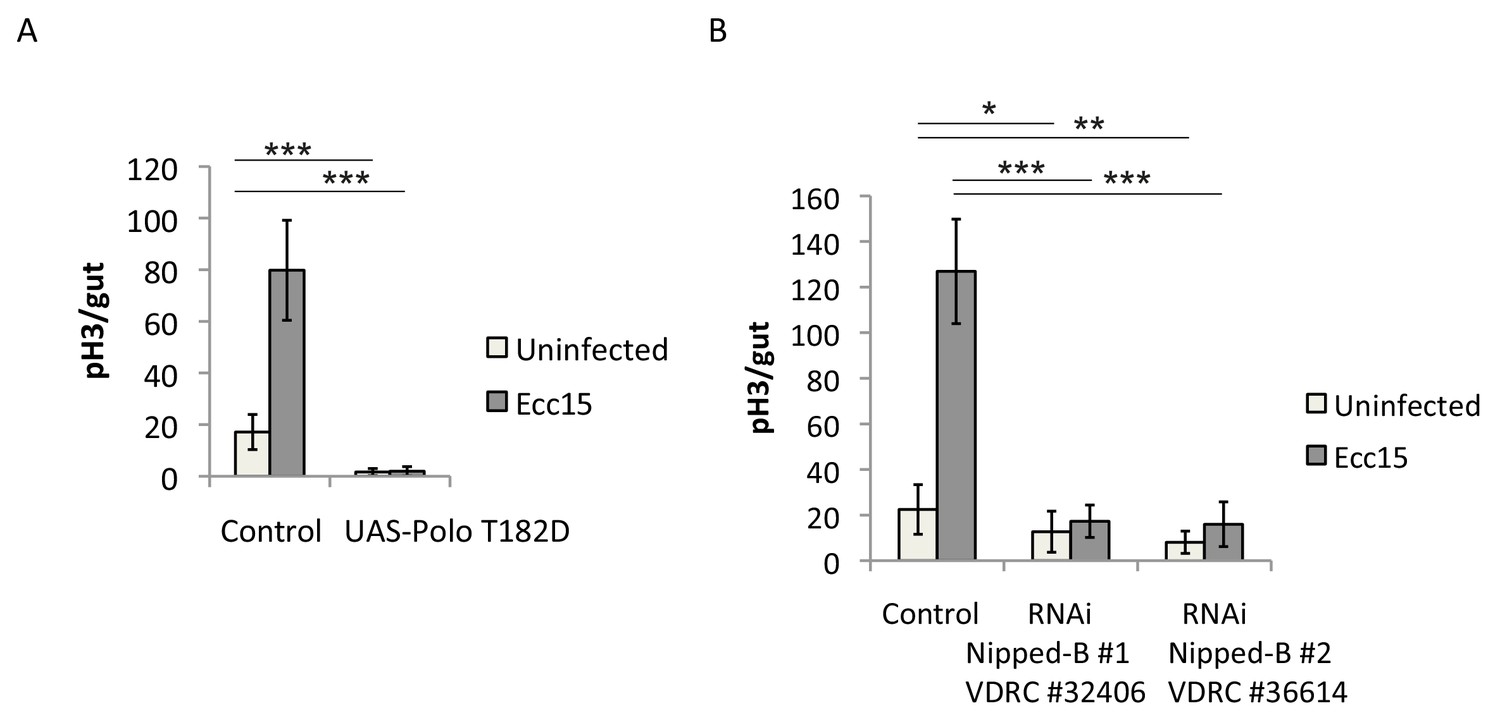
Overexpression of PoloT182D or downregualtion of Nipped-B trigger ISC differentiation.
(A) Quantification of the number of mitotic pH3-positive cells/midgut in esgts guts expressing UAS-GFP alone (control) or UAS-PoloT182D with and without Ecc15 infection (n = 8–10). ANOVA. (B) Quantification of the number of mitotic pH3-positive cells/midgut in esgts guts expressing UAS-GFP alone (control) or nippedBRNAi and with and without Ecc15 infection (n = 8–11). ANOVA.
Figure 3 with 1 supplement

Rad21 overexpression leads to increased ISC proliferation.
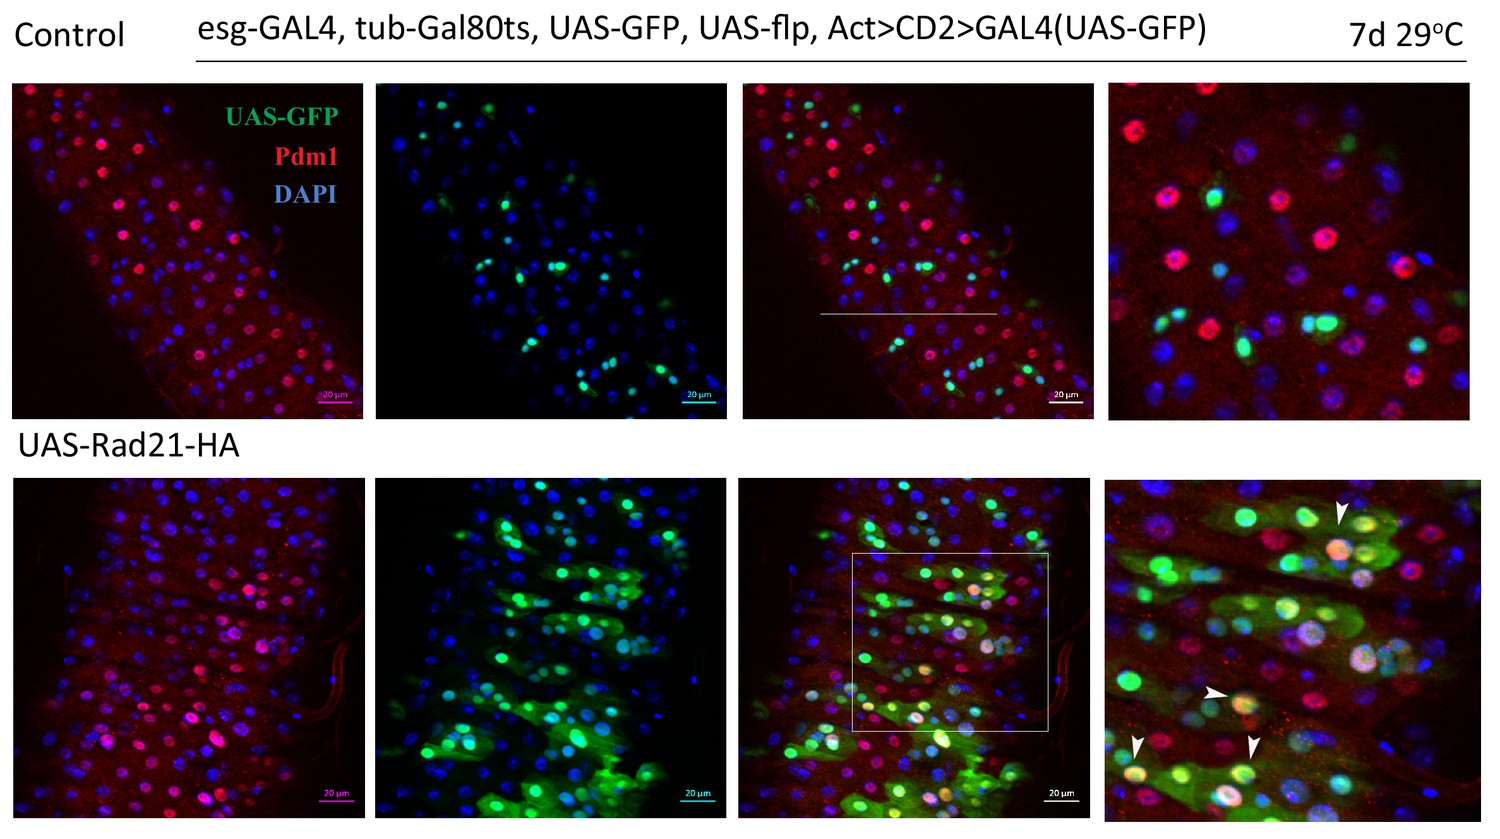
(A) esgts midguts expressing UAS-EYFP alone (control) or expressing UAS-Rad21-HA (B). Quantification of the number of mitotic pH3-positive cells/midgut in the guts from A (n = 8), (C). esgts midguts expressing UAS-EYFP alone (upper panels) or expressing UAS-Rad21-HA (lower panels). Samples were stained for GFP and either Rad21 (upper panels) or HA tag (lower panels). ANOVA. **p<0.01. Scale bars, 20 µm.
Figure 3—figure supplement 1
Esg-FlipOut (F/O) midguts expressing UAS-EYFP alone (control) or expressing UAS-Rad21-HA.
Samples were stained for GFP and Pdm1. Differentiated cells are labeled with white arrowheads. Scale bars, 20 µm.
Figure 4

Knock down of cell cycle regulators leads to premature ISC differentiation.
(A) esg-F/O midguts expressing UAS-GFP alone (control) or expressing poloRNAi. cdk1RNAi and aurBRNAi. Samples were stained for GFP and Pdm1. (B) Quantification of GFP-positive/Pdm1-positive cells from A. (n = 609, 369, 500, 482). (C) Quantification of the number of mitotic pH3-positive cells/midgut in esgts guts expressing UAS-GFP alone (control) or cdk1RNAi and aurBRNAi with and without Ecc15 infection (n = 7–11), ANOVA. ***p<0.001. Differentiated cells are labeled with white arrowheads. Scale bars, 20 µm.
Figure 5 with 1 supplement

Downregulation of AurB and Rad21 differentially affect ISC maintenance.
(A) esg-F/O/Delta-lacZ midguts expressing UAS-GFP alone (control), aurBRNAi or expressing rad21RNAi. Samples were stained for GFP and b-gal. (B) Quantification of GFP-positive/Delta-lacZ-positive cells from A. (n = 1489, 1522, 733), ANOVA. **p<0.01, ***p<0.001. Scale bars, 20 µm.
Figure 5—figure supplement 1
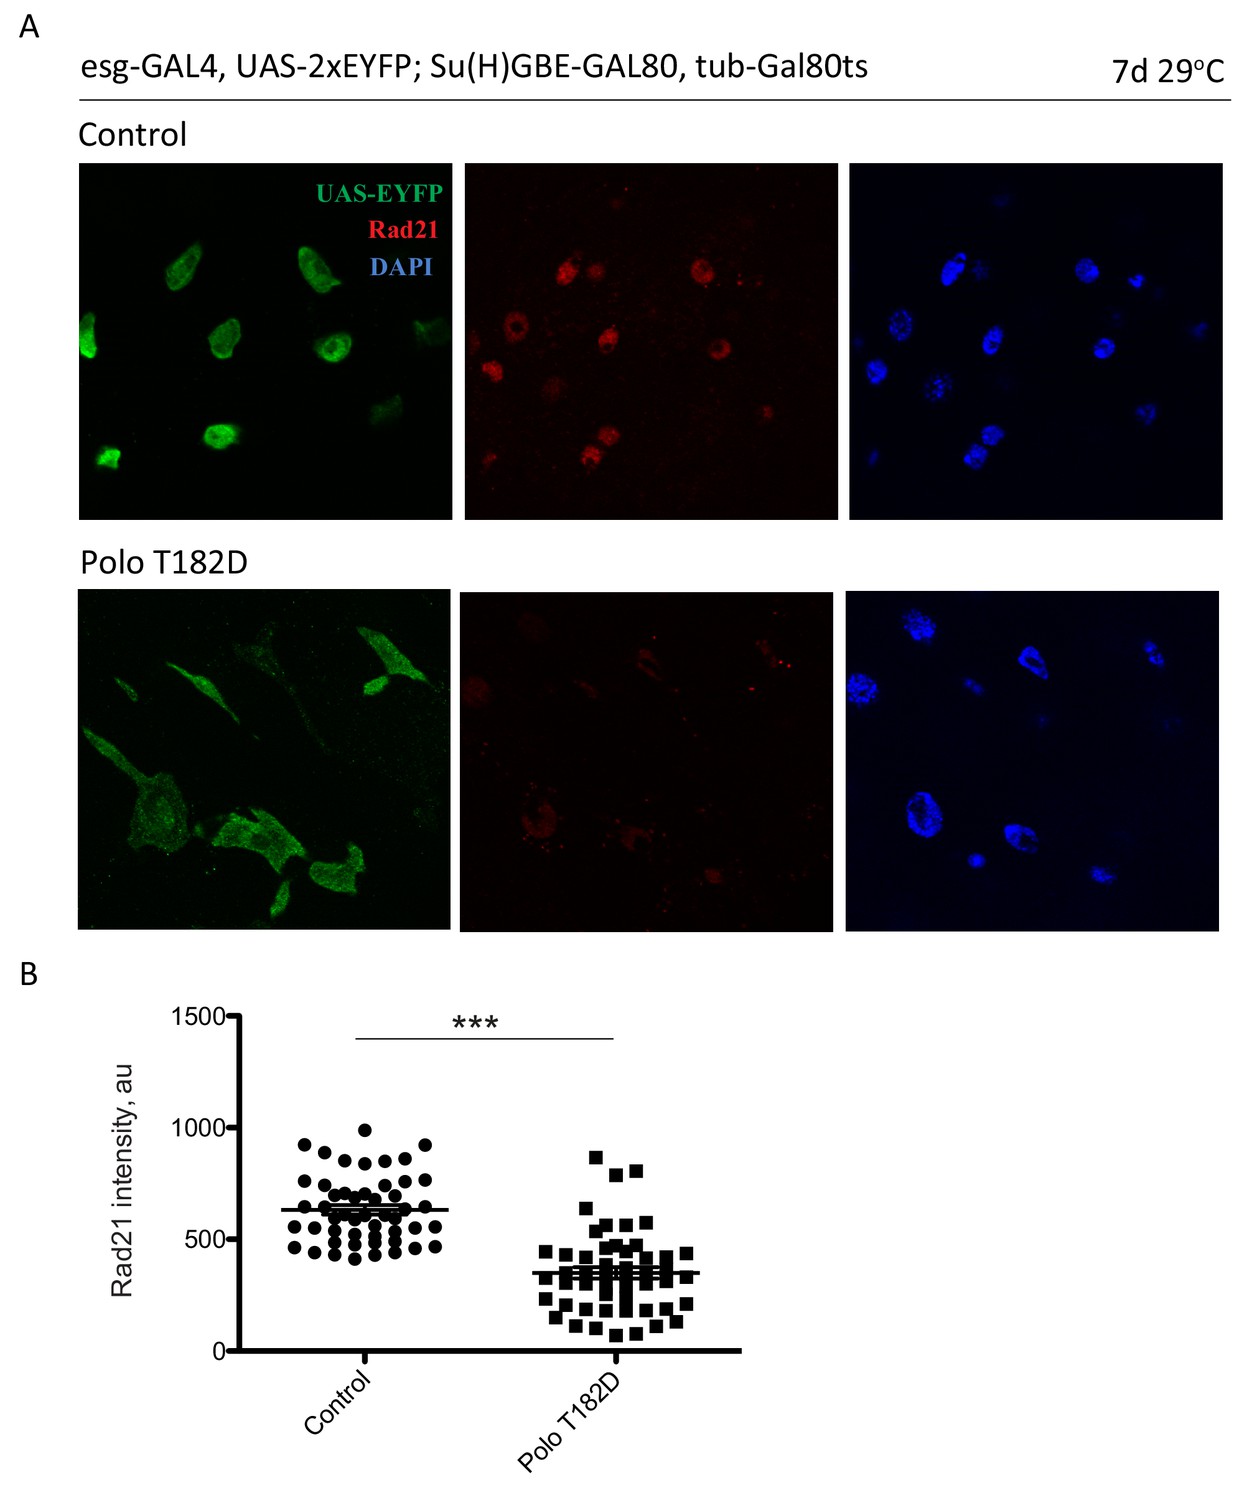
Rad21 intenstiy is reduced in PoloT182D-expressing ISCs.
(A) esg-F/O midguts expressing UAS-GFP alone (control) or expressing UAS-PoloT182D were stained for GFP and Rad21. (B) Analysis of Rad21 intensity in UAS-GFP alone (control) or UAS-PoloT182D-expressing ISCs. Mann-Whitney Test. *p<0.05, **p<0.01, ***p<0.001, n.s. not significant. Scale bars, 20 µm.
Figure 6 with 1 supplement

RNAseq and DamID analysis of ISCs after downregulating or overexpressing Rad21.
(A) Transcriptomic analysis of ISCs expressing UAS-EYFP (Control) or Rad21RNAi or UAS-Rad21-HA. Scatter plot of gene expression regulation after Rad21 knock down. Red dots represent significant hits (false discovery rate q < 0.05). (B) Overlap between significantly differentially expressed genes found in Rad21 RNAi and UAS-Rad21-HA datasets, Fisher exact test (***p<0.001). (C) Overlap between genes upregulated in Rad21 RNAi dataset and EC-specific genes (Doupé et al., 2018), Fisher exact test (***p<0.001). (D) Overlap between genes upregulated in Rad21 RNAi and esg RNAi datasets, Fisher exact test (***p<0.001) (Korzelius et al., 2014). (E) Rad21 expression in Control, Rad21RNAi or UAS-Rad21-HA ISCs from (A). (F) Examples of EC genes upregulated after Rad21 knock down from C. (G) Examples of genes shared in Rad21 RNAi and esg RNAi datasets from D. (H) DamID analysis of ISCs expressing Esg-Dam (Control) and Esg-Dam/Rad21RNAi (Rad21 RNAi). Overlap between significant peaks found in Esg-Dam compared to Dam only and significant peaks in Esg-Dam/Rad21RNAi compared to Dam only. (I) GO analysis of peaks significantly elevated in Esg-Dam compared to Esg-Dam/Rad21 RNAi samples. (J) Differential peaks as direct targets of Notch from H. (K) Differential occupancy of nub, GATAe and Brat loci by Esg-Dam or Esg-Dam after Rad21 knock down. Dam only serves as control. Lower panel shows peaks elevated after Rad21 knock down.
-
Figure 6—source data 1
Transcriptomic analysis of ISCs expressing UAS-EYFP (Control) or Rad21RNAi or UAS-Rad21-HA.
Raw data; overlaps of genes sets between Rad21 RNAi and UAS-Rad21-HA; upregulated genes in Rad21 RNAi and Esg RNAi (Korzelius et al., 2014); upregulated genes in Rad21 RNAi and EC-specific genes (Doupé et al., 2018).
- https://cdn.elifesciences.org/articles/48160/elife-48160-fig6-data1-v1.xlsx
-
Figure 6—source data 2
DamID analysis of ISCs expressing Esg-Dam in a wild-type (control) or Rad21 deficient (Rad21-) background.
Methylated DNA enrichment was measured relative to samples from dam-expressing ISCs (two independent samples for each condition; see Materials and methods for details). Peaks that pass IDR (irreproducible discovery rate) test in esg-dam (control) and esg-dam (Rad21-) samples were called and are shown in separate worksheets (‘idr_esg-dam (Rad21-) Peaks’ and ‘idr_esg-dam (Control) Peaks’). Merged peaks with chromosomal location are shown in the worksheet labeled ‘merged_esg-dam (ctrl and Rad21-)’, and peaks enriched in Control and Rad21 RNAi conditions are shown with gene annotations in the other two worksheets.
- https://cdn.elifesciences.org/articles/48160/elife-48160-fig6-data2-v1.xlsx
Figure 6—figure supplement 1
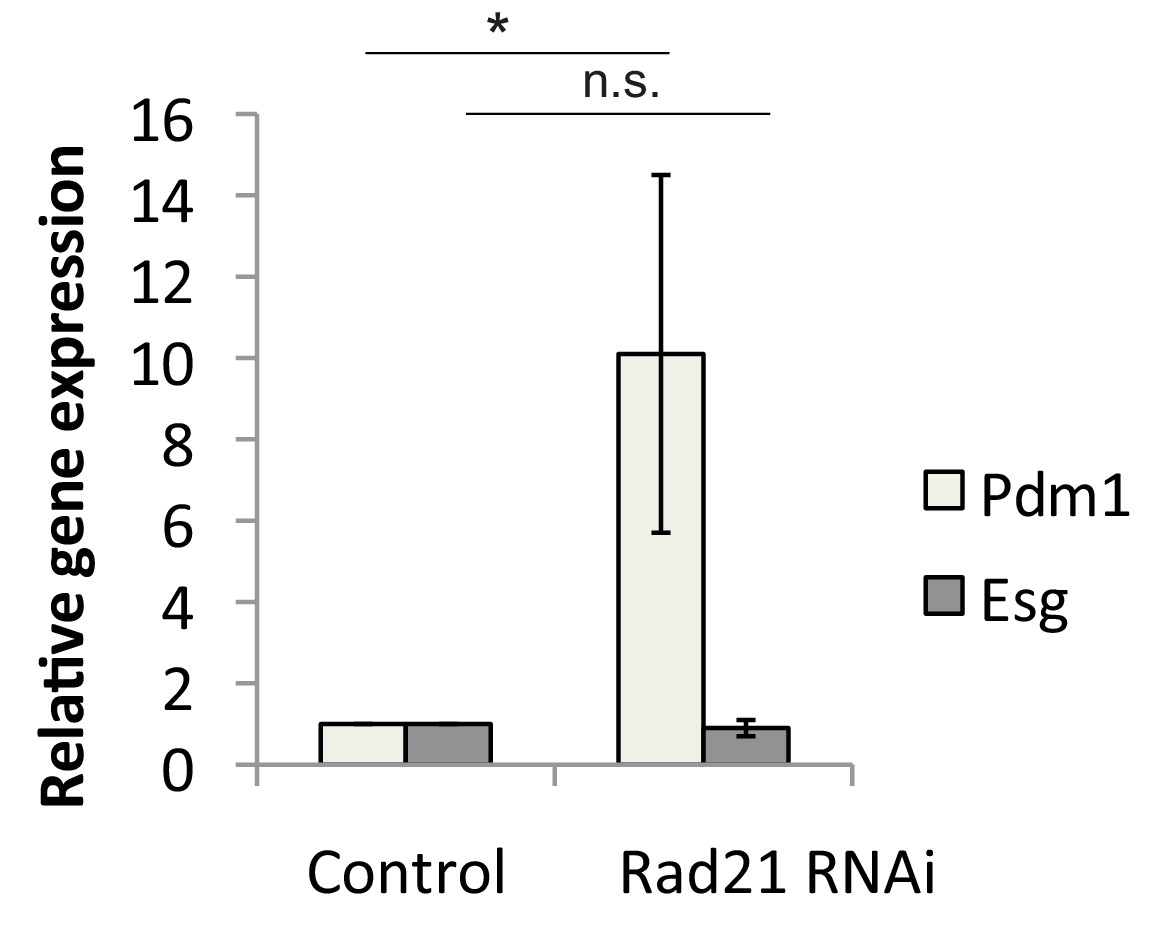
qRT-PCR analysis of Pdm1 and Esg expression in ISCs after Rad21 knock down, ANOVA.
*p<0.05, n.s. not significant.
Figure 7
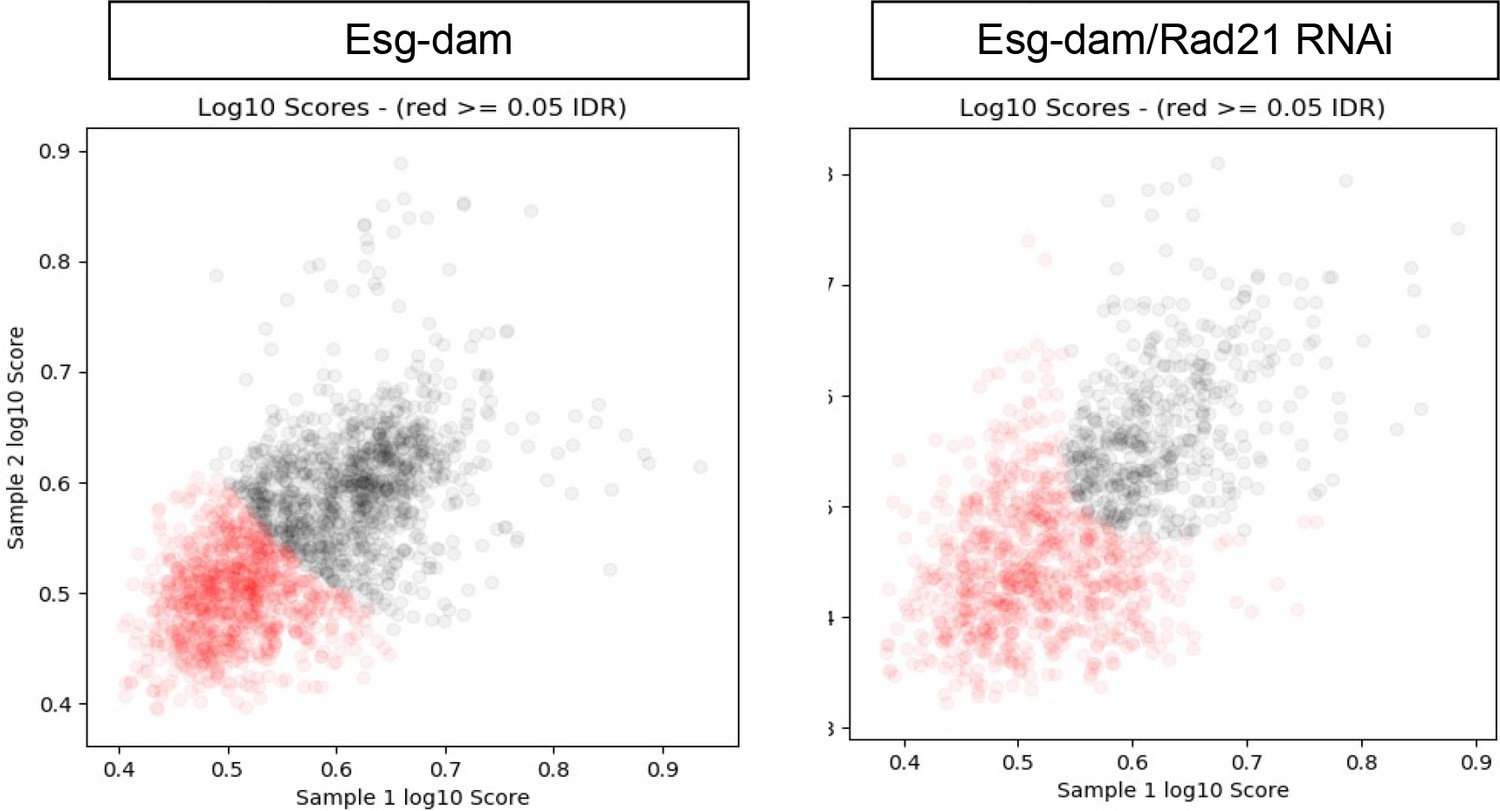
DamID analysis of ISCs expressing Esg-Dam (left) or Esg-Dam with Rad21RNAi (right).
Scatter plots showing reproducible peaks in repeat samples identified by the idr_tools pipeline. Black dots represent peaks with higher reproducibility (IDR <0.05).
Figure 8
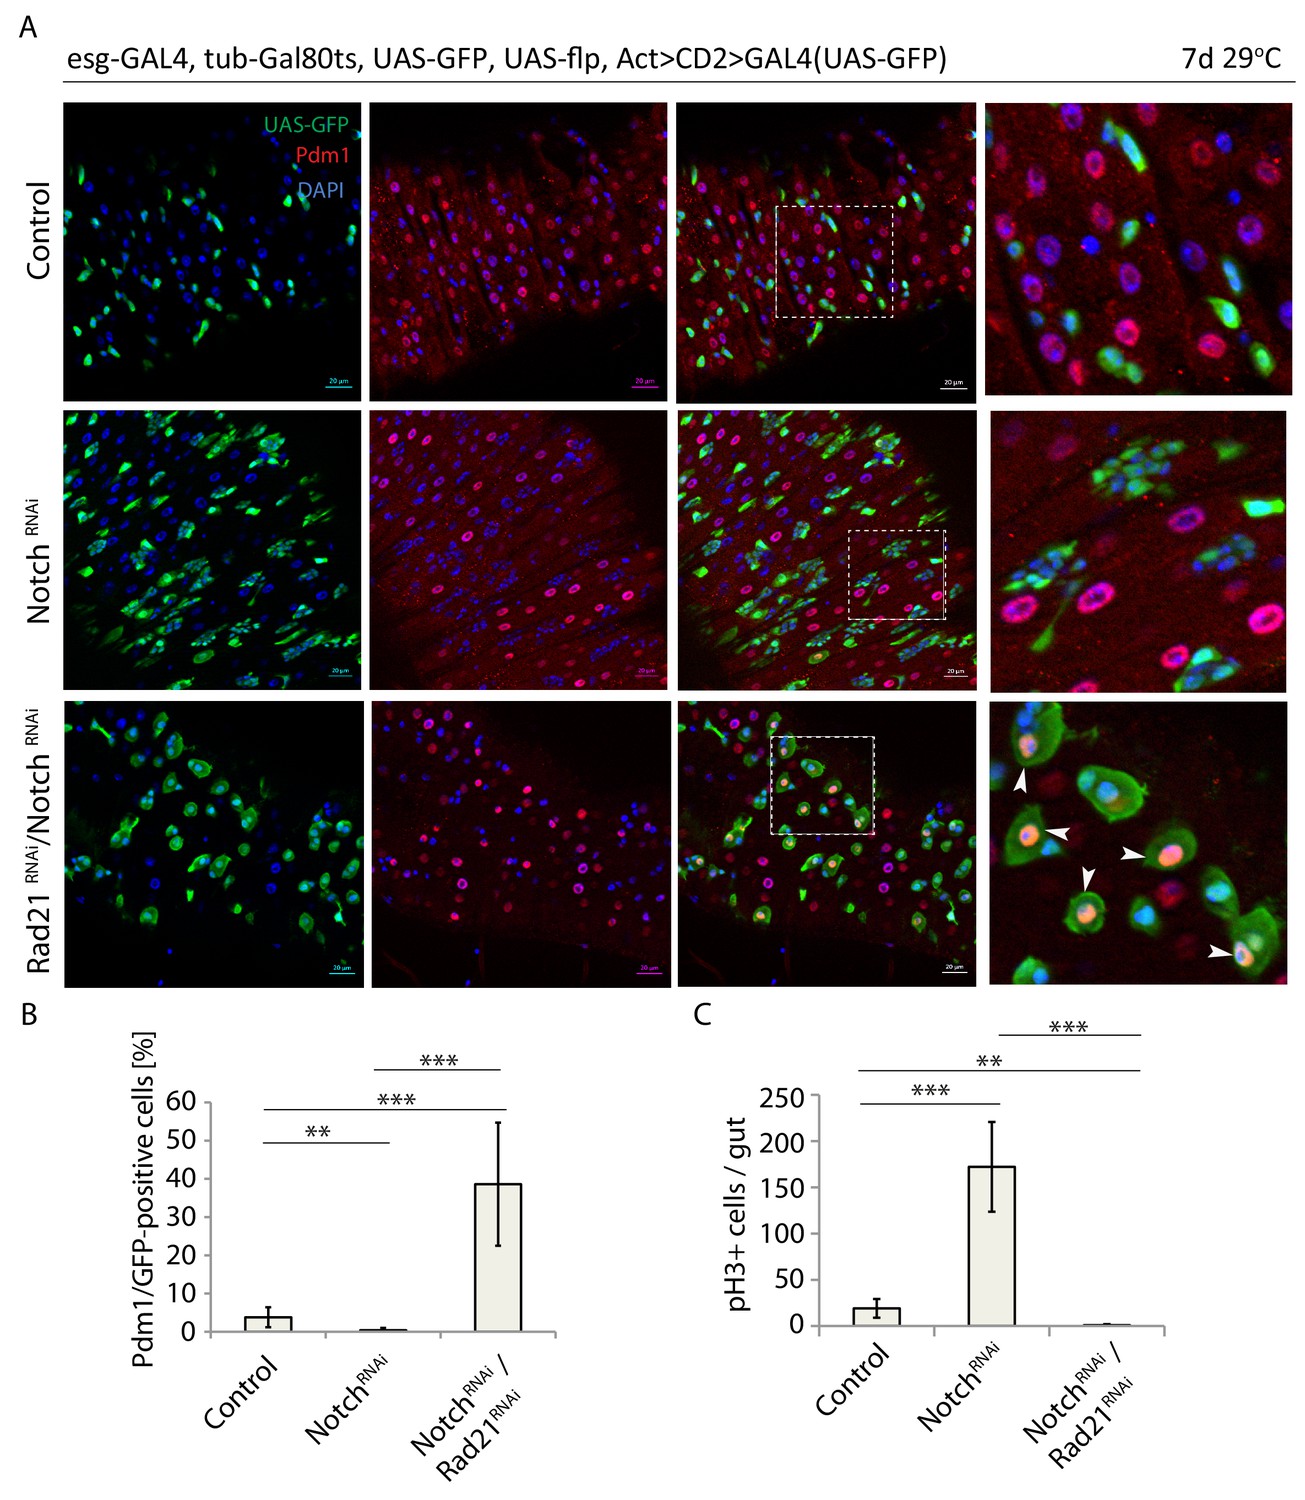
Rad21 RNAi-induced ISC differentiation occurs independently of Notch signaling.
(A) esg-F/O midguts expressing UAS-GFP alone (control), notchRNAi or notchRNAi/rad21RNAi. Samples were stained for GFP and Pdm1. (B) Quantification of GFP-positive/Pdm1-positive cells from A. (n = 829, 2485, 376). (C) Quantification of the number of mitotic pH3-positive cells/midgut in esgts guts expressing UAS-GFP alone (control), notchRNAi or notchRNAi/rad21RNAi with and without Ecc15 infection (n = 6–7), ANOVA. **p<0.01, ***p<0.001. Differentiated cells are labeled with white arrowheads. Scale bars, 20 µm.
Figure 9

Escargot overexpression prevents Rad21 RNAi-induced ISC differentiation.
(A) esg-F/O midguts expressing UAS-GFP alone (control), expressing rad21RNAi, UAS-esg RNAi/rad21RNAi or UAS-esg. Samples were stained for GFP and Pdm1. (B) Quantification of GFP-positive/Pdm1-positive cells from A. (n = 491, 402, 391, 766), (C) Quantification of the number of mitotic pH3-positive cells/midgut in esgts guts expressing UAS-GFP alone (control), rad21RNAi, UAS-esg/rad21RNAi or UAS-esg with and without Ecc15 infection (n = 4–6), ANOVA. *p<0.05, **p<0.01, ***p<0.001, n.s. not significant. Differentiated cells are labeled with white arrowheads. Scale bars, 20 µm.
Figure 10
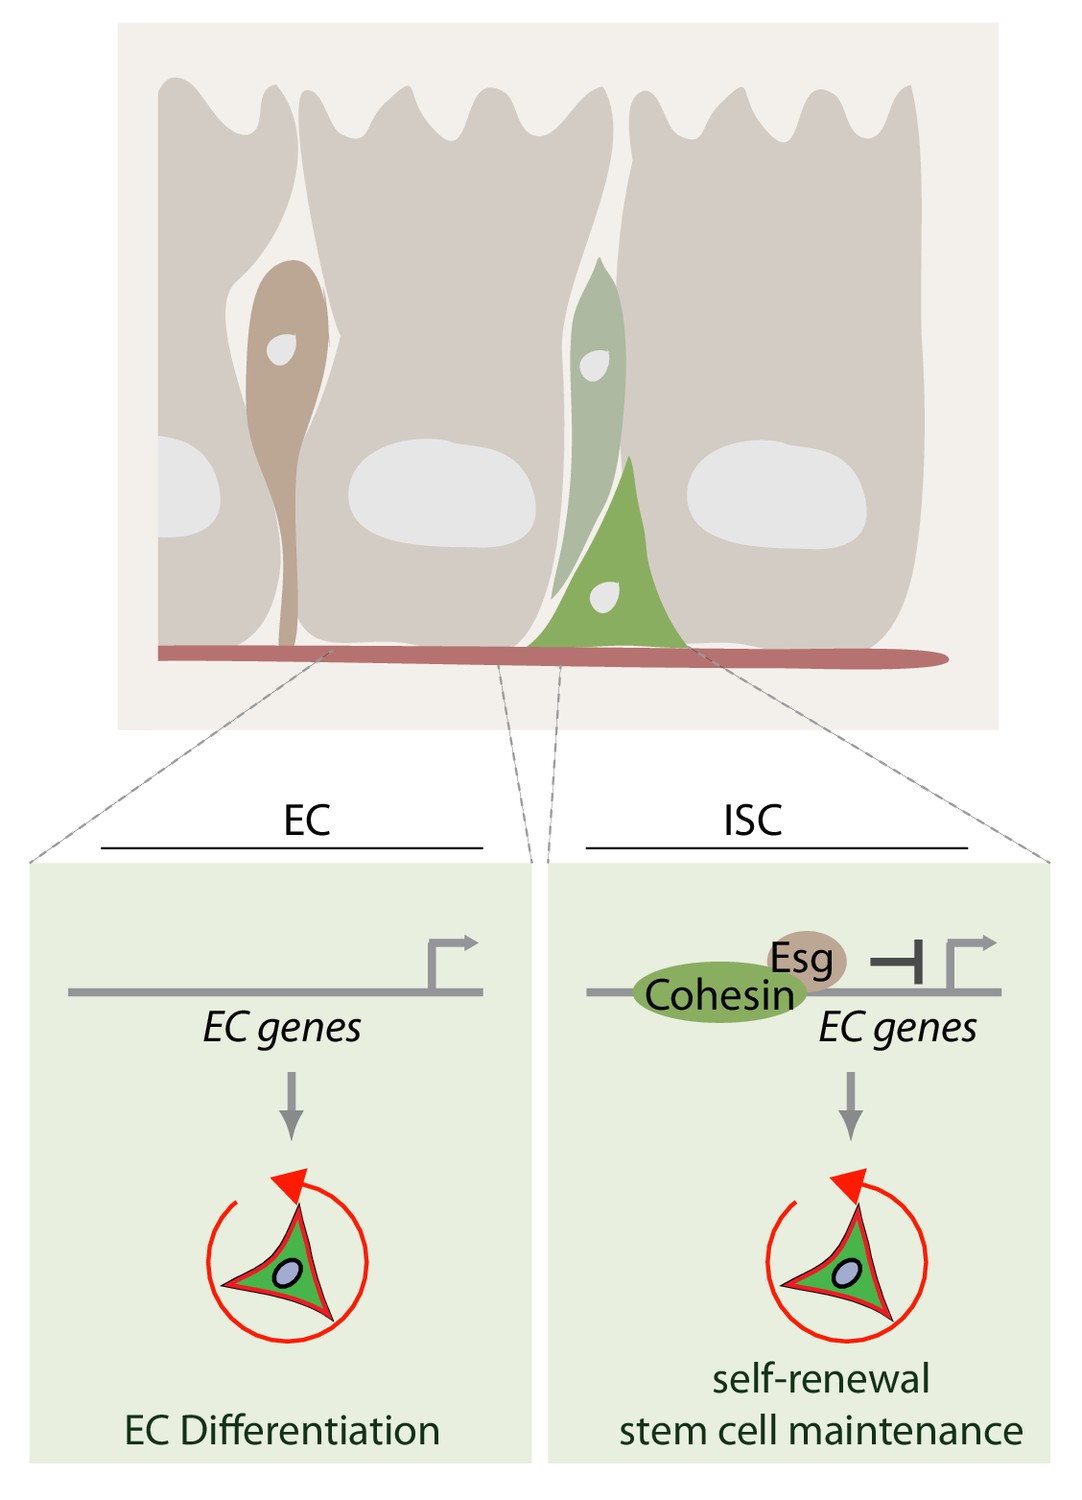
Model of how rad21 maintains ISC identity and proliferation via transcription factor esg.
Rad21-containing Cohesin complex recruits esg to promotors of gene responsible for ISC maintenance and repression of differentiation (for example Pdm1). Rad21 loss triggers EC gene expression and ISC differentiation.
Tables
Table 1
Dam ID alignment.
Number of reads is uniform across samples, the sequence quality is good and uniform. Alignment rate is good and uniform across dam and Esg-Dam samples but significantly lower for the Esg-Dam/Rad21 samples.
| # reads | #reads containing no Ns | Overall alignment rate | |
|---|---|---|---|
| dam1 | 62,324,161 | 99.88 | 94.46% |
| dam2 | 61,289,068 | 99.88 | 95.17% |
| esg1 | 63,277,266 | 99.88 | 92.87% |
| esg2 | 64,279,981 | 99.88 | 92.41% |
| rad21esg1 | 66,375,925 | 99.88 | 56.21% |
| rad21esg2 | 63,063,034 | 99.88 | 79.86% |
Table 2
DamID peak calling.
| #low threshold peaks | #merged peaks | #peaks passing IDR cutoff of 0.05 | %peaks passing IDR cutoff of 0.05 | |
|---|---|---|---|---|
| esg-dam1 | 2521 | 1973 | 1034 | 52.4% |
| esg-dam2 | 2537 | |||
| rad21RNAi/esg-dam1 | 2387 | 1327 | 500 | 37.7% |
| rad21RNAi/esg-dam2 | 2175 |
Additional files
Download links
A two-part list of links to download the article, or parts of the article, in various formats.
Downloads (link to download the article as PDF)
Open citations (links to open the citations from this article in various online reference manager services)
Cite this article (links to download the citations from this article in formats compatible with various reference manager tools)
Cohesin controls intestinal stem cell identity by maintaining association of Escargot with target promoters
eLife 9:e48160.
https://doi.org/10.7554/eLife.48160


