Repression of ferritin light chain translation by human eIF3
- University of California, Berkeley, United States
- Brandeis University, United States
- Lawrence Berkeley National Laboratory, United States
Figures
Figure 1 with 1 supplement

Post-transcriptional regulation of FTL mRNA.
(A, B) Iron-responsive regulation mediated by binding of Iron Response Proteins (IRPs) to Iron Response Element (IRE) RNA structures in the 5ʹ-UTR in (A) low-iron conditions and (B) high-iron conditions. In high iron, IRP2 is degraded by the proteasome, whereas IRP1 binds an iron-sulfur cluster to form the enzyme Aconitase (ACO1). (C) General schematic of the luciferase reporter mRNAs. The eIF3 PAR-CLIP site in FTL mRNA spans nucleotides 53–76 (Lee et al., 2015) and the 3RE region spans nucleotides 58–90. (D) Schematic of the IRP and eIF3 interaction sites on the experimentally-determined secondary structure of FTL mRNA (Martin et al., 2012). (E) Luciferase activity in HepG2 cells transfected with luciferase reporter mRNAs 6 hr post transfection, normalized to luciferase luminescence from mRNA with wild-type FTL 5ʹ-UTR. The results are for three biological replicates with error bars representing the standard deviation of the mean.
-
Figure 1—source data 1
Luciferase reporter readouts.
- https://doi.org/10.7554/eLife.48193.005
Figure 1—figure supplement 1
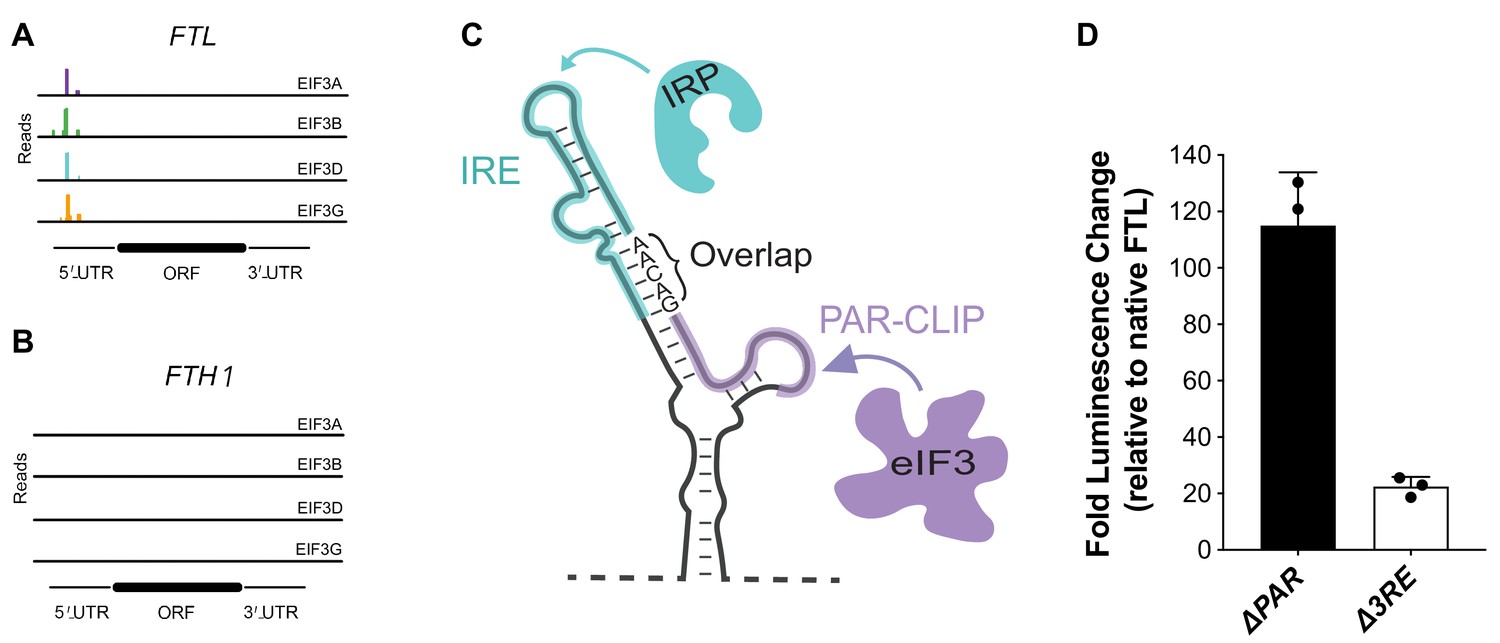
Sites of eIF3 interaction with FTL and FTH1 mRNAs.
(A, B) eIF3 PAR-CLIP cluster identified for (A) FTL but missing in (B) FTH1 (Lee et al., 2015). (C) Mapping of the IRP and PAR-CLIP derived eIF3 interaction sites on the secondary structure of the 5ʹ-UTR in FTL mRNA, determined by chemical probing (Martin et al., 2012). The overlap of the extended IRE and the PAR-CLIP site spans nucleotides 53–57. (D) Luciferase activity in HepG2 cells transfected with luciferase reporter mRNAs 12 hr post transfection, normalized to luciferase luminescence from mRNA with wild-type FTL 5ʹ-UTR. The results are of three biological replicates with error bars representing the standard deviation.
-
Figure 1—figure supplement 1—source data 1
Luciferase reporter readouts.
- https://doi.org/10.7554/eLife.48193.004
Figure 2 with 3 supplements
Maintenance of 5ʹ-cap and IRP-dependent regulation of 3RE deletions in the FTL 5ʹ-UTR.
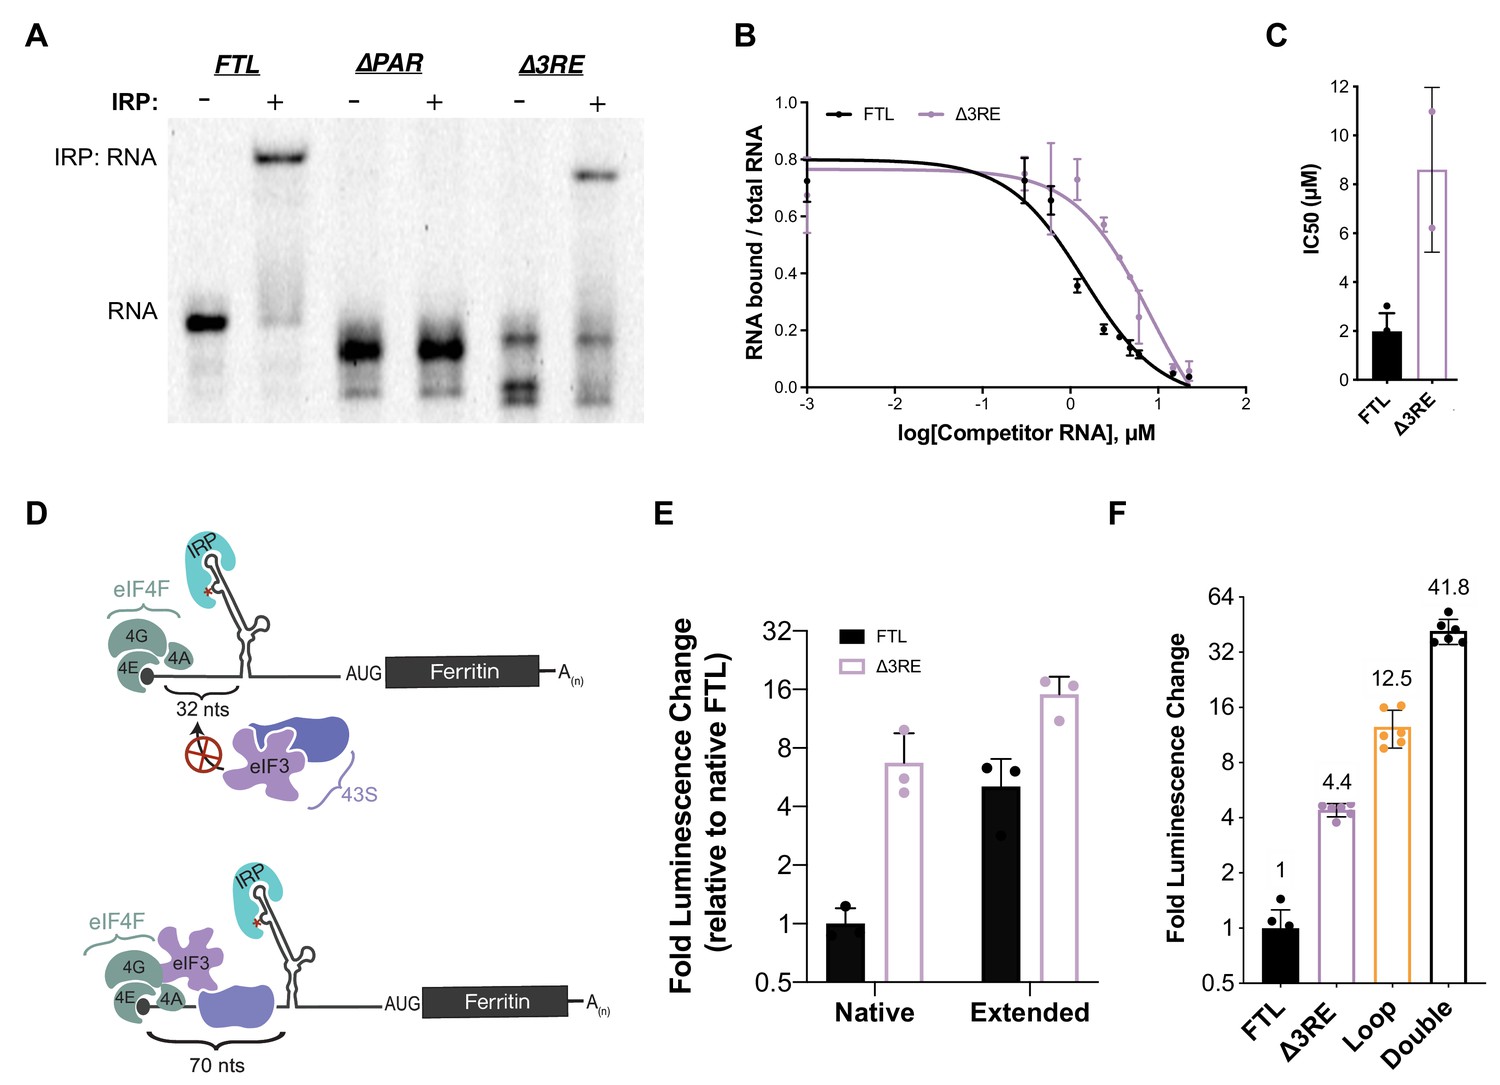
(A) Representative native RNA gel shift showing recombinant IRP1 binding activity. Near IR (NIR) labeled RNAs corresponding to the full-length WT FTL 5ʹ-UTR and the FTL 5ʹ-UTR with deletions of the predicted eIF3 interaction site were incubated with recombinant IRP1 and resolved on a native polyacrylamide gel. (B) Dose-response curve of two RNA competition assays, based on gel shifts of NIR-labeled WT IRE-containing RNA, with WT or ∆3RE RNAs serving as cold competitors. Fold excess of competitors extended up to 75,000x. Error bars represent standard deviations for each concentration of competitor. (C) Calculated IC50 values using Prism 7 of the various competitor RNAs, based on the data in (B), with error bars representing the standard deviation from the mean IC50 value. N.A., the IC50 value could not be determined for the Loop mutant due to lack of any detectable competition. (D) Schematics showing the effect of increasing the distance of the IRE from the 5ʹ-cap on IRP regulation of translation initiation (Goossen and Hentze, 1992), (Muckenthaler et al., 1998). The characteristic C (C18 in the wild-type context) is denoted by an asterisk. (E) The luciferase activity of HepG2 cells transfected with mRNAs containing the native and extended spacing between the 5ʹ-cap and IRE, with or without the 3RE site, normalized to the luciferase luminescence of cells transfected with WT FTL mRNA with native spacing from the 5ʹ-cap. The values are from cells that have been harvested 6 hr post-transfection. The results are from three biological replicates, with error bars representing the standard deviation of the mean. (F) The luciferase activity of HepG2 cells transfected with mRNAs containing the native and various combinations of eIF3 (∆3RE) and IRP (Loop, A15G/G16C) disrupting mutations in HepG2 cells, normalized to the luciferase luminescence of cells transfected with WT FTL mRNA with native spacing from the 5ʹ-cap. Double represents an mRNA construct that contains both the Loop and ∆3RE mutations. The results are from six independent transfections, with error bars representing the standard deviation of the mean.
-
Figure 2—source data 1
EMSA analysis and luciferase reporter readouts.
- https://doi.org/10.7554/eLife.48193.011
Figure 2—figure supplement 1
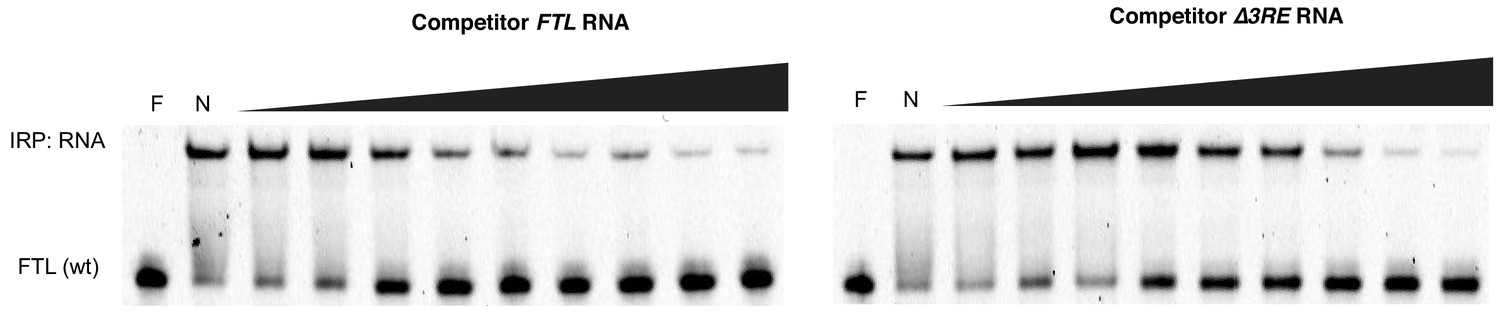
Native gels resolving RNA-IRP1 complexes formed after competition experiments.
Near IR (NIR) labeled RNA corresponding to the full-length WT FTL 5ʹ-UTR were incubated with recombinant IRP1 and increasing molar excess concentrations of unlabeled competitor FTL or ∆3RE RNA (1000x, 2000x, 4000x, 8000x, 12,000x, 16,000x, 20,000x, 50,000x, 75,000x), as indicated. F, lane with only NIR-labeled FTL RNA; N, no addition of competitor RNA to the NIR-RNA-IRP1 complex.
Figure 2—figure supplement 2
Luciferase readouts and mRNA stability during 6 hr mRNA transfections.
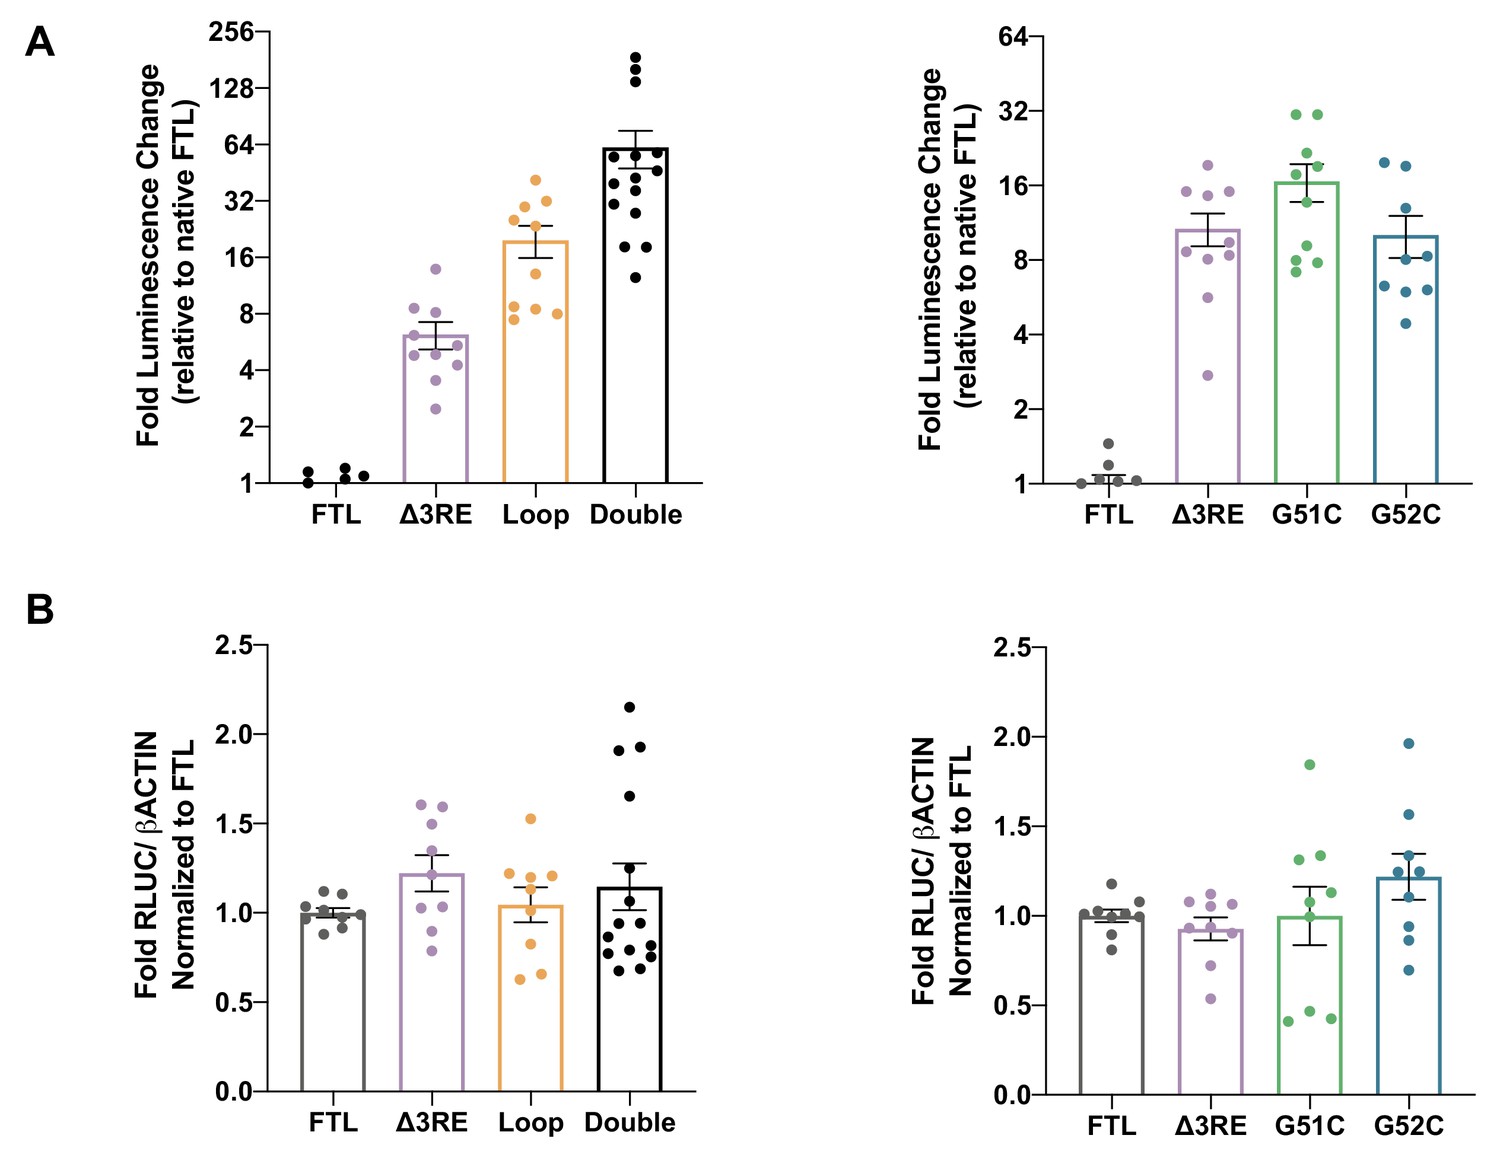
(A) Luciferase activity of HepG2 cells transfected with mRNAs encoding the WT FTL 5ʹ-UTR or various mutant mRNAs. The first graph shows experiments with the ∆3RE, Loop (A15G/G16C), and Double mutants, while the second graph shows experiments with the hyperferritinemia mutations (G51C and G52C), normalized to WT FTL reporter luciferase luminescence. The results are from nine biological replicates with error bars representing the standard error of the mean. (B) RNA extraction and RT-qPCR of cells harvested at 6 hr post-transfection with the various luciferase reporters. The ACTB mRNA was used as a control to normalize across samples. Error bars represent the standard error of the mean for three biological replicates, with three technical replicates each.
-
Figure 2—figure supplement 2—source data 1
Luciferase reporter and qPCR readouts relative to nativeFTL.
- https://doi.org/10.7554/eLife.48193.009
Figure 2—figure supplement 3
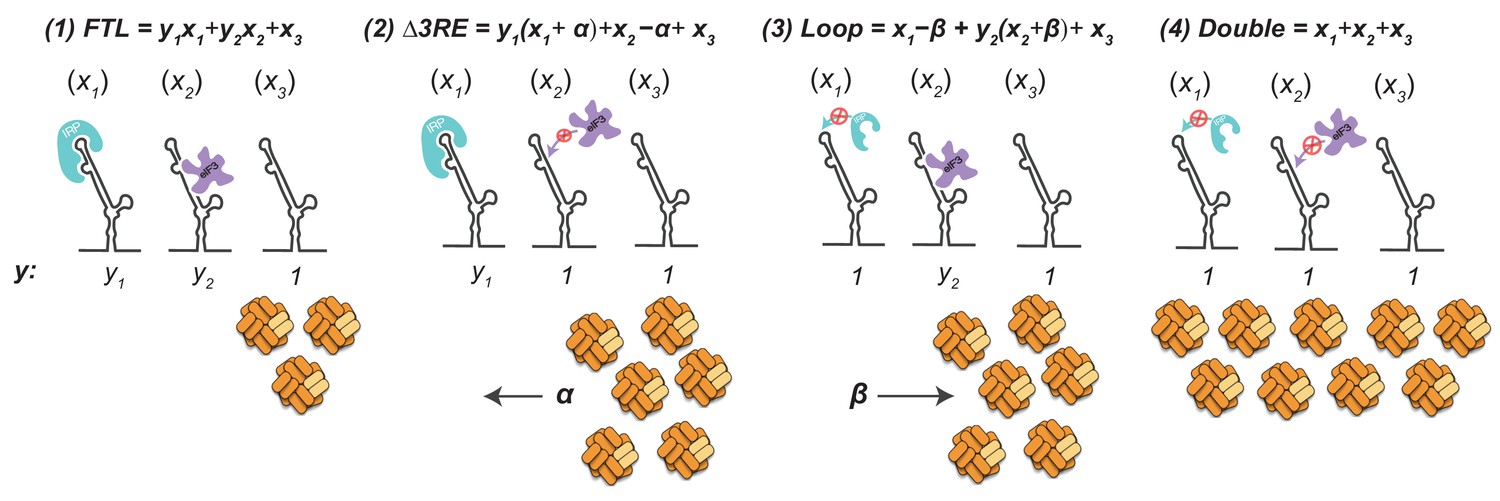
Mathematical modeling of IRP and eIF3 co occupancy on FTL mRNA.
Schematic for mathematical modeling based on luciferase activity shown in Fig.Figure 2F which demonstrates that IRP and eIF3 seem to work synergistically rather than exclusively. x1 represents the fraction of FTL mRNA bound by IRP. x2 represents the fraction of FTL mRNA bound by eIF3. x3 represents the fraction of unbound FTL mRNA. The orange complexes at the bottom of the figure represent the ferritin complexes produced by the various mRNA pools. α and β represent a fraction of the previously bound mRNA populations x2 and x1 respectively.
Figure 3 with 6 supplements
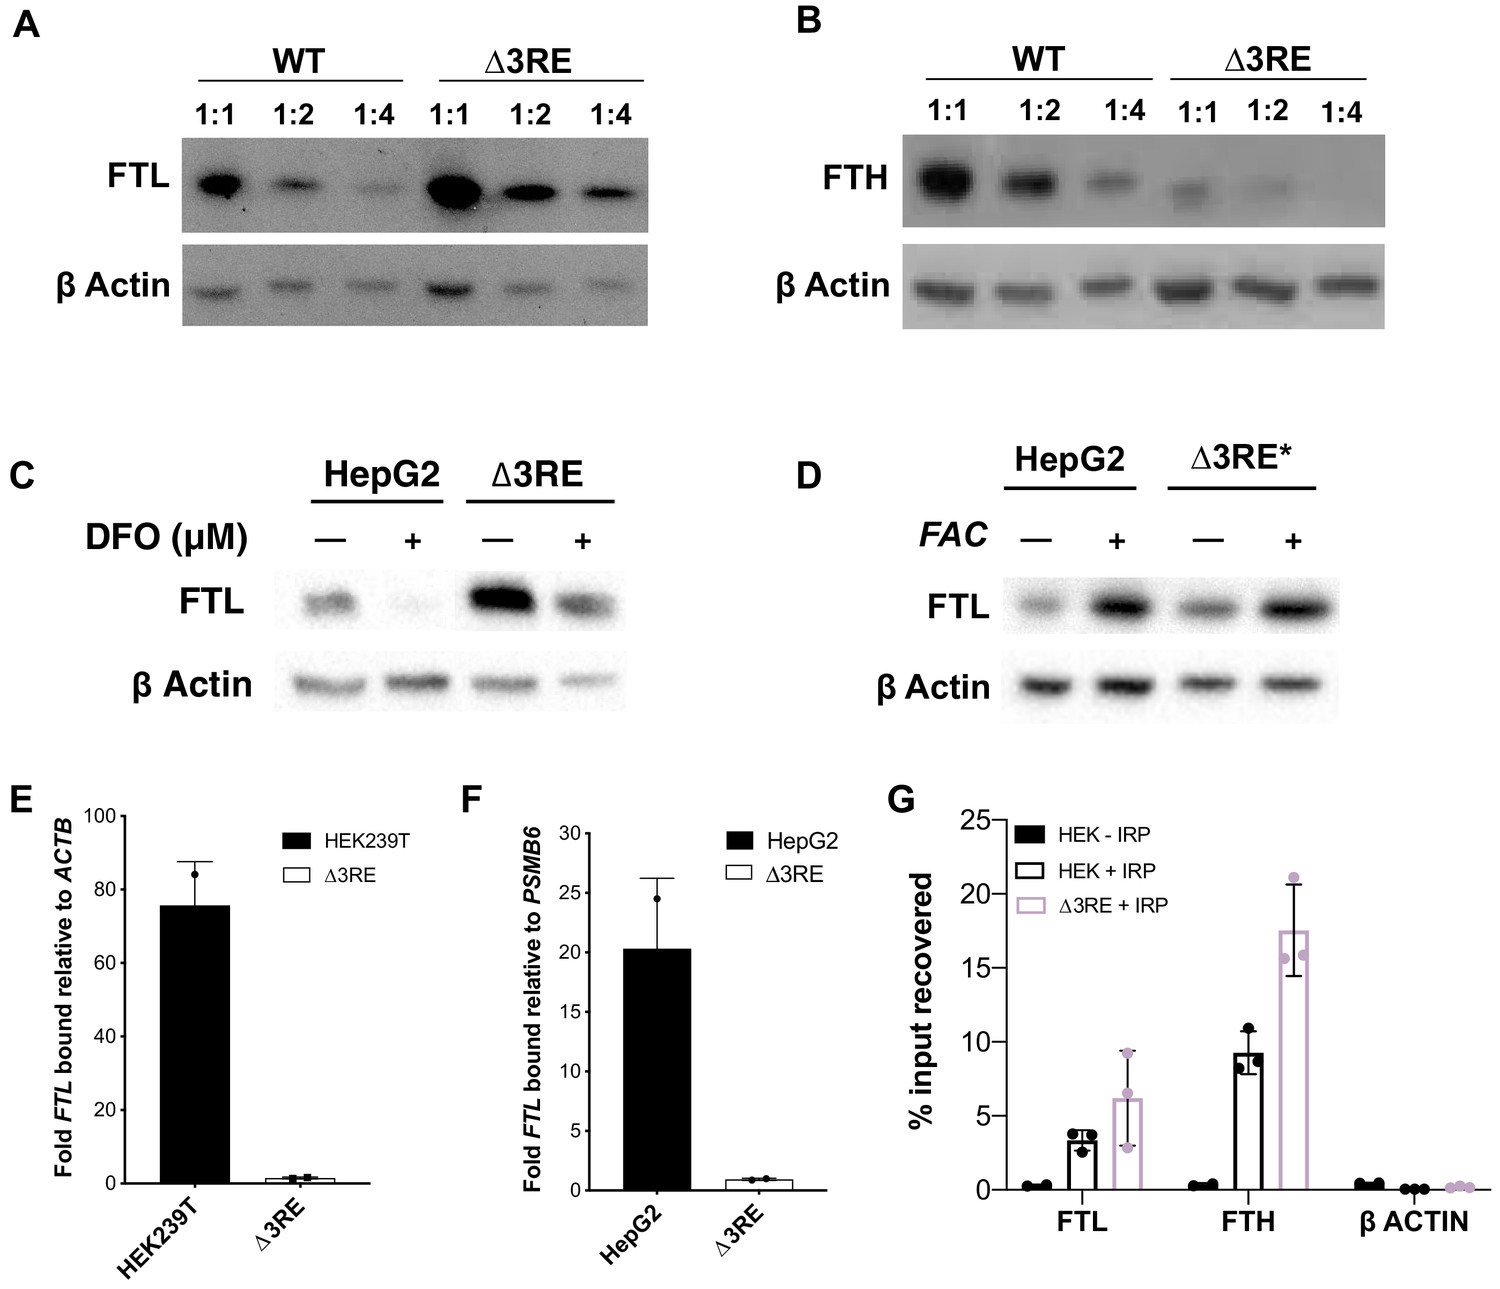
Physiological effects of the endogenous removal of the 3RE repressive element.
(A,B) Representative western blots of (A) FTL and (B) FTH levels in the edited (∆3RE) and WT HepG2 cells under normal iron conditions. Serial dilutions were used in order to better visualize the significance of the changes in FTL and FTH protein abundance. (C, D) Representative western blots of FTL levels in the edited (∆3RE) and WT HepG2 cells under high- or low-iron conditions. Iron donor treatment with FAC at 50 μg/mL for 24 hr, and Iron chelation treatment with DFO at 50 μM for 48 hr. The asterisk (*) indicates that lysate from ∆3RE cells were diluted two-fold, due to the higher overall levels of FTL in these cells. All FTL blots are representative of three or more replicates. (E, F) Determination of the preferential binding of eIF3 to FTL mRNA via EIF3B immunoprecipitation (IP) followed by RNA extraction and RT-qPCR in both (E) HEK293T and (F) HepG2 cell lines. Control mRNAs used to normalize IPs were PSMB6 and ACTB. Error bars represent the standard deviation of duplicate qPCR measurements from representative IP reactions. (G) Determination of IRP1 binding to FTL mRNA in WT (HEK + IRP) and ∆3RE (∆3RE + IRP) HEK293T cells via FLAG immunoprecipitation (IP) followed by RNA extraction and RT-qPCR. The ACTB mRNA was used to control for nonspecific binding to FLAG-tagged IRP. HEK – IRP reflects cells that were not transiently transfected, but were carried through the IP and following experiments. Error bars represent the standard deviation for triplicate measurements from representative IP reactions.
-
Figure 3—source data 1
Data anlysis of eIF3B and FLAG-tagged IRP1 immunoprecipitations.
- https://doi.org/10.7554/eLife.48193.022
Figure 3—figure supplement 1
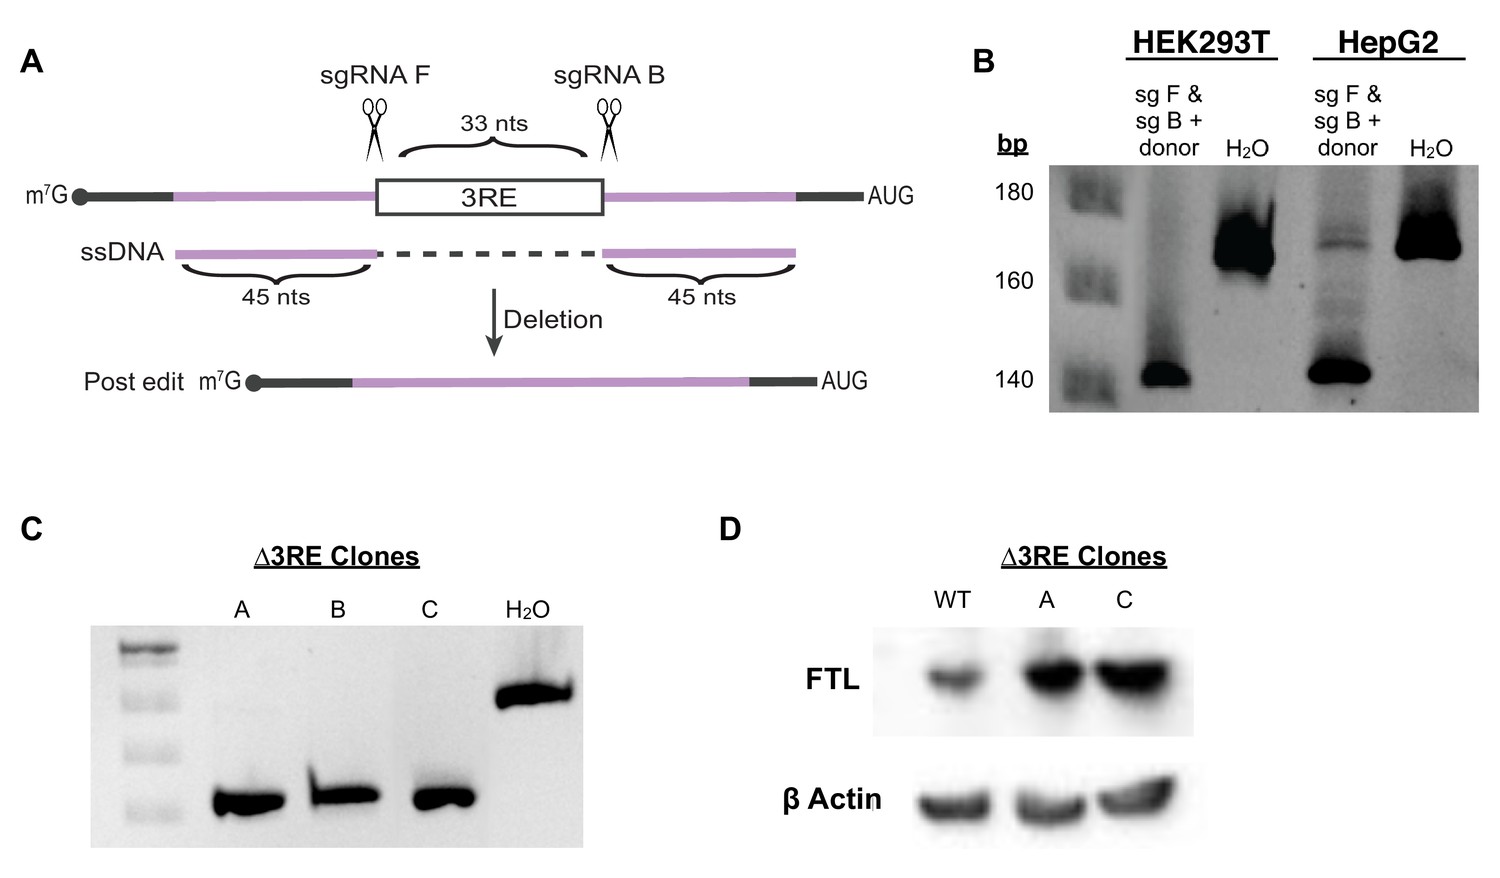
CRISPR-Cas9 editing to remove the proposed eIF3-FTL interaction site.
(A) CRISPR-Cas9 RNP editing schematic in which two sgRNAs target sequences immediately adjacent to the 3RE. Reactions were supplemented with 90-nt ssDNA that had full homology to the intended edited sequence. (B) Editing efficiency in both HEK293T and HepG2 cells, based on PCR of the region of interest and analysis on a native polyacrylamide gel. (C) Three successfully edited HepG2 clonal populations, as determined by sequencing the FTL locus. H2O represents cells nucleofected without sgRNA. These should represent fully wild-type cells. (D) Representative Western blots FTL in two of the edited (∆3RE) lines compared to WT HepG2 cells under normal iron condition.
Figure 3—figure supplement 2
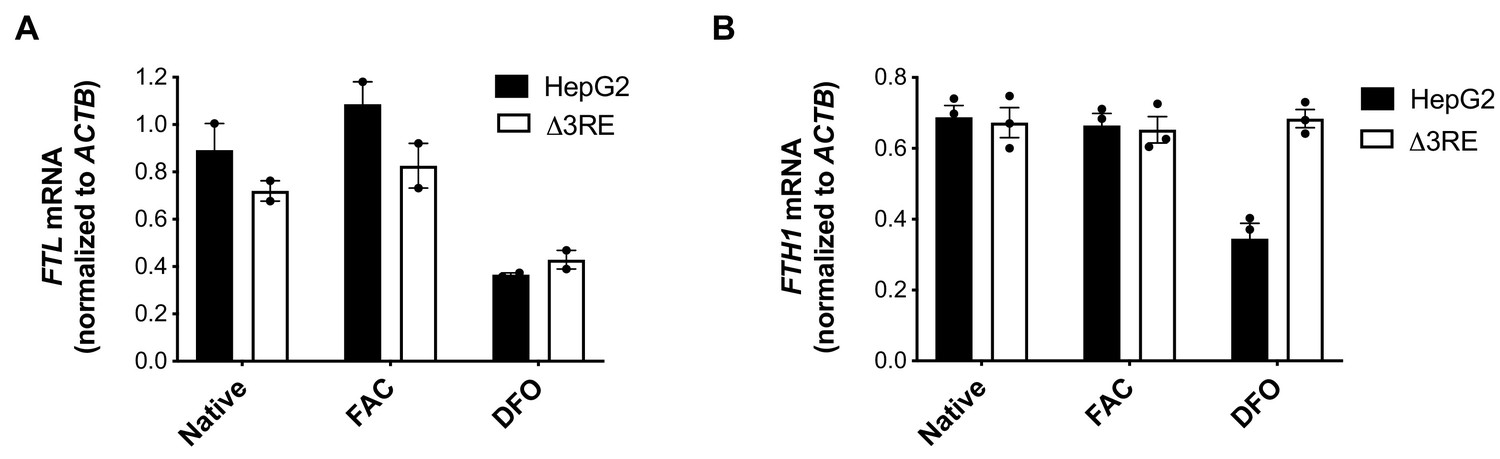
mRNA levels in edited cell lines.
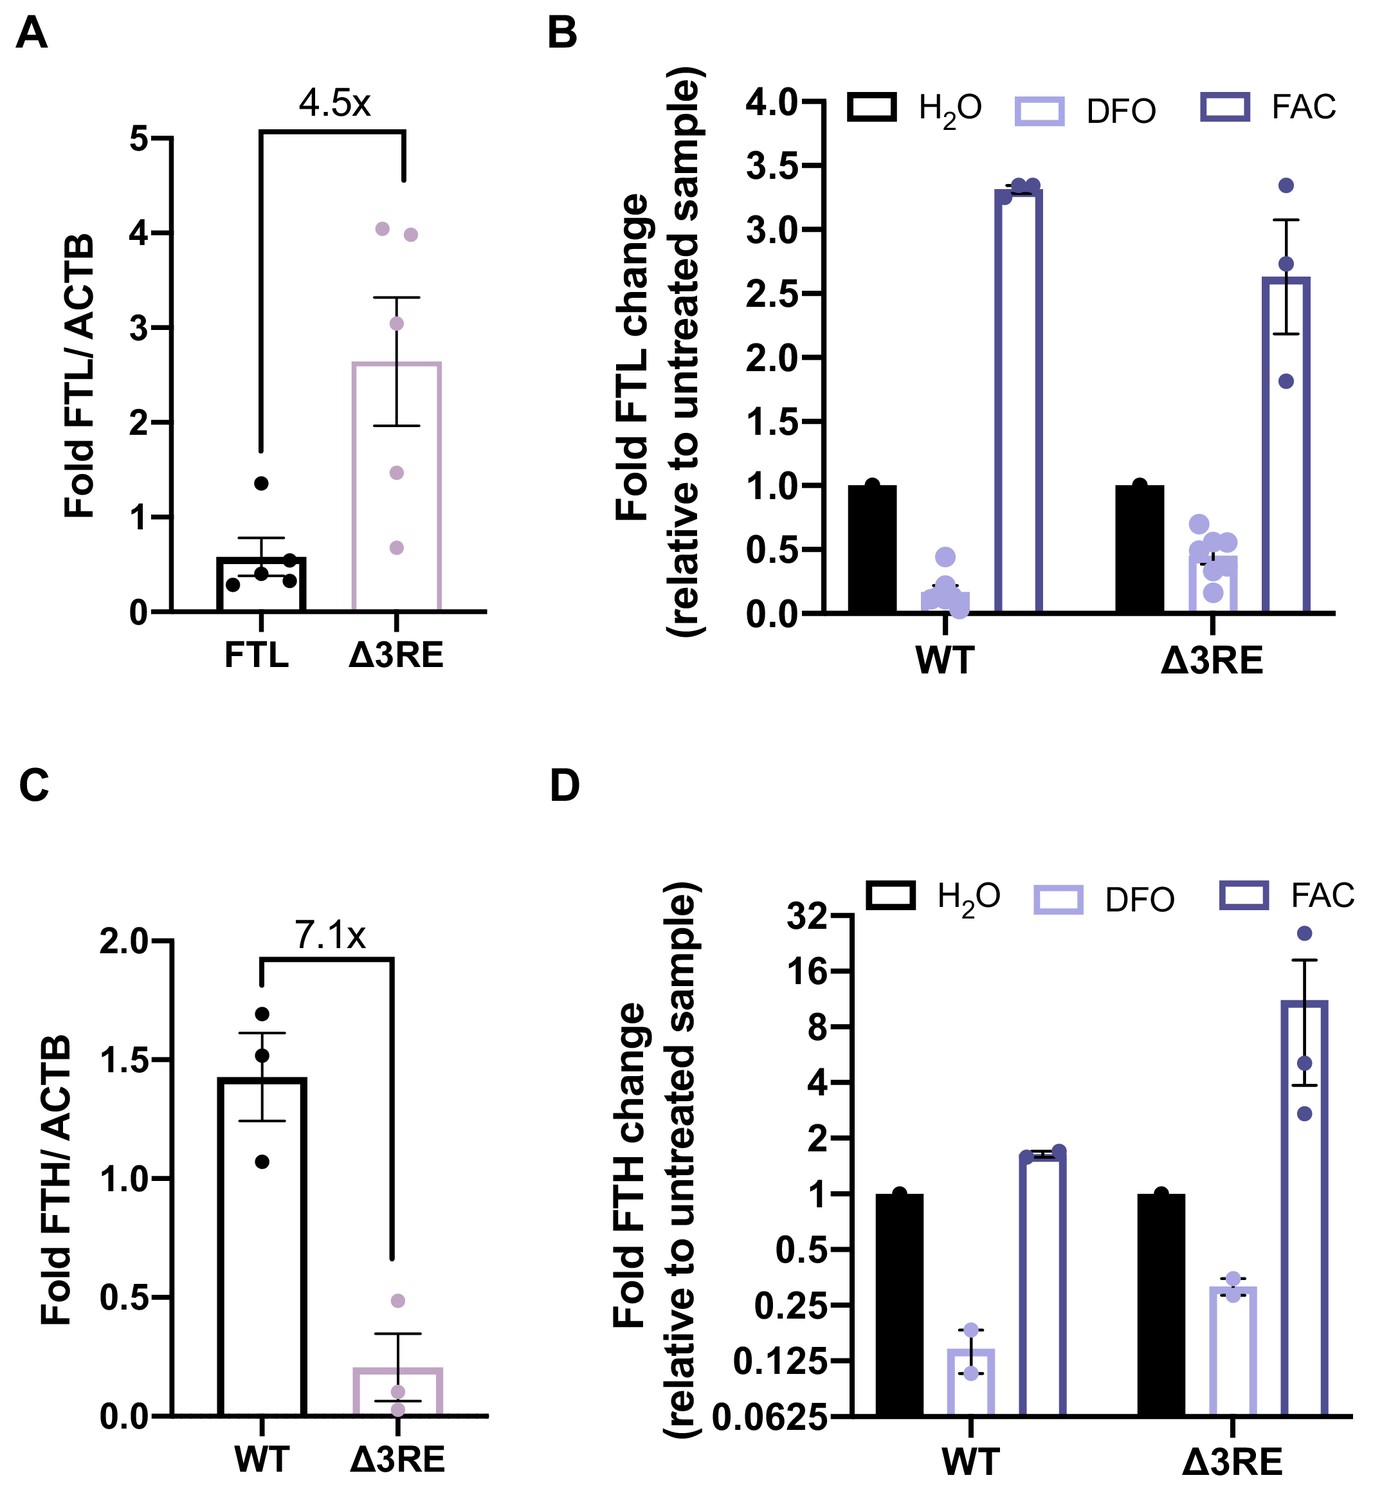
(A, B) mRNA levels of either (A) FTL or (B) FTH1 as determined by RNA extraction from HepG2 (solid black bars) or HepG2 ∆3RE (black outlined bars) cells and RT-qPCR. The mRNA levels for FTL and FTH1 were normalized to ACTB mRNA. Cells were grown in normal media, 50 µg/mL FAC treatment for 24 hr (FAC), or 200 µM DFO treatment for 24 hr (DFO). The results are from two or three technical replicate qPCR readouts, respectively, that reflect the data from two biological replicates, with error bars representing the standard deviation of the mean.
-
Figure 3—figure supplement 2—source data 1
qPCR readouts relative to nativeFTLacross various iron treament conditions.
- https://doi.org/10.7554/eLife.48193.015
Figure 3—figure supplement 3

Physiological effects of the endogenous removal of the 3RE on FTH protein levels.
(A, B) Representative western blots of FTH levels in the edited (∆3RE) and WT HepG2 cells under various iron conditions. (A) Iron donor treatment with FAC at 50 µg/mL for 24 hr; (B) Iron chelation treatment with DFO at 200 µM for 24 hr.
Figure 3—figure supplement 4
Quantification of FTL and FTH protein levels in HepG2 cells.
(A) Quantification of western blots comparing the levels of FTL in wild type vs ∆3RE HepG2 cells. Five biological replicates are represented with error bars representing standard error of the mean. (B) Quantification of western blots comparing the levels of FTL in wild type vs ∆3RE HepG2 cells under various iron conditions. Iron donor treatment with 50 µg/mL FAC for 24 hr or iron chelation treatment with 200 µM DFO at for 24 hr. Three biological replicates are represented for FAC treatment and six biological replicates are represented for DFO treatment. Error bars represent standard error of the mean. (C) Quantification of western blots comparing the levels of FTH in wild type vs ∆3RE HepG2 cells. Three biological replicates are represented with error bars representing standard error of the mean. (D) Quantification of western blots comparing the levels of FTH in wild type vs ∆3RE HepG2 cells under various iron conditions. Iron donor treatment with 50 µg/mL FAC for 24 hr or iron chelation treatment with 200 µM DFO for 24 hr.
-
Figure 3—figure supplement 4—source data 1
Western blot quantification of FTL and FTH in HepG2 cells.
- https://doi.org/10.7554/eLife.48193.018
Figure 3—figure supplement 5
Quantification of FTL and FTH protein levels in HEK293T cells.
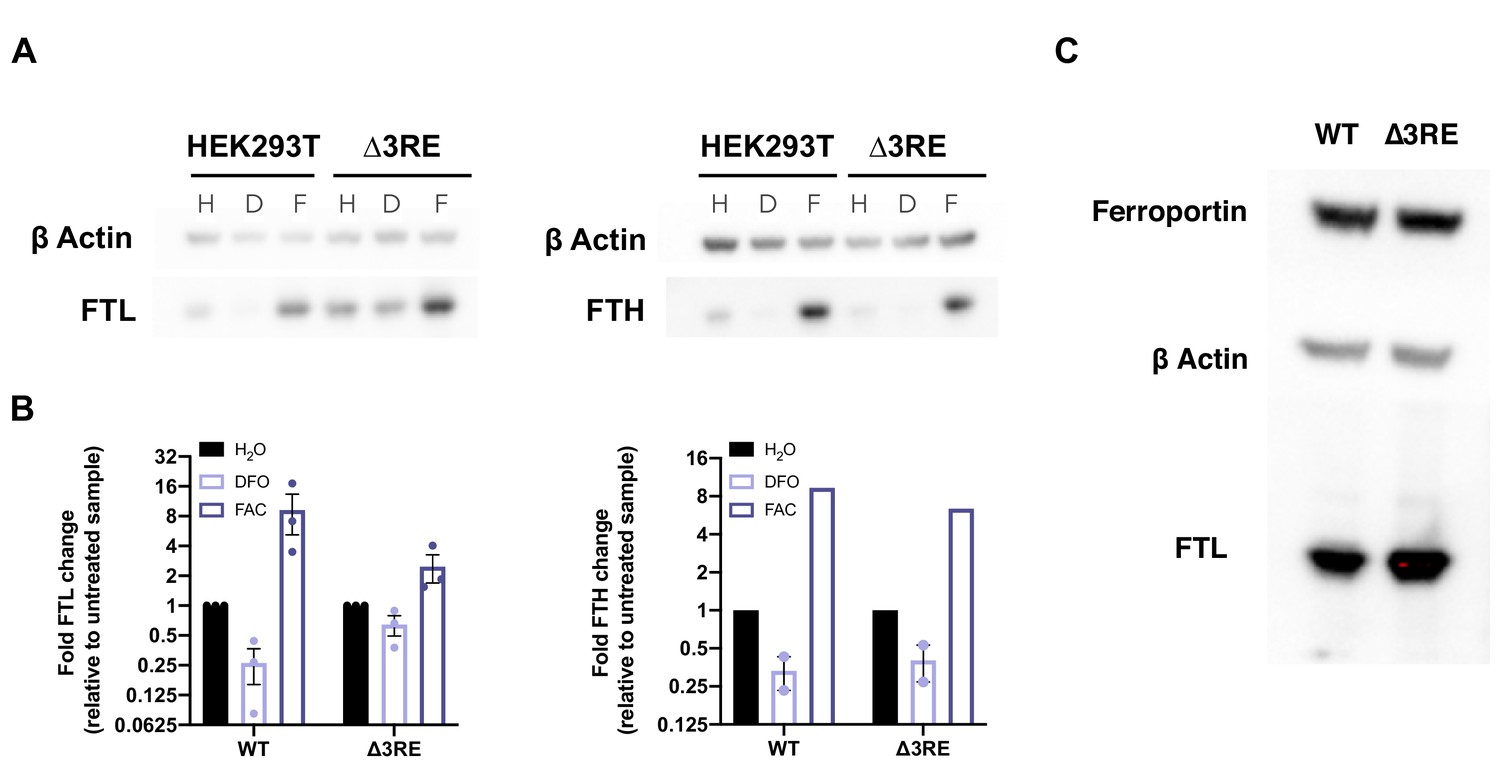
(A) Representative western blots comparing the levels of FTL and FTH in wild type vs ∆3RE under different iron treatment conditions. Iron donor treatment with FAC at 50 µg/mL for 24 hr or iron chelation treatment with DFO at 200 µM for 24 hr. (B) Quantification of western blots comparing the levels of FTL and FTH in wild type vs ∆3RE HEK293T cells. Three biological replicates are shown with error bars representing standard error of the mean for both of the FTL data sets. There are two biological replicates for FTH levels under DFO treatment and error bars represent standard error of the mean. There was only one quantifiable replicate for the ∆3RE FAC treatment. (C) Representative western blots comparing the levels of ferroportin in wild type vs ∆3RE (HepG2) cells under various iron conditions.
-
Figure 3—figure supplement 5—source data 1
Western blot quantification of FTL and FTH in HEK293T cells.
- https://doi.org/10.7554/eLife.48193.020
Figure 3—figure supplement 6

Analysis of the ferritin complex upon deletion of the 3RE in FTL mRNA.
Representative Coomassie stained native 4–12% gradient Tris-Glycine gel resolving ferritin complexes purified using methanol, from either 8 × 15 cm dishes of WT HepG2 cells treated with 50 µg/mL FAC for 24 hr or a single 15 cm dish of ∆3RE HepG2 cells under normal media conditions. An equal amount of protein was loaded for each sample.
Figure 4 with 2 supplements
Role of eIF3 in select cases of hyperferritinemia.
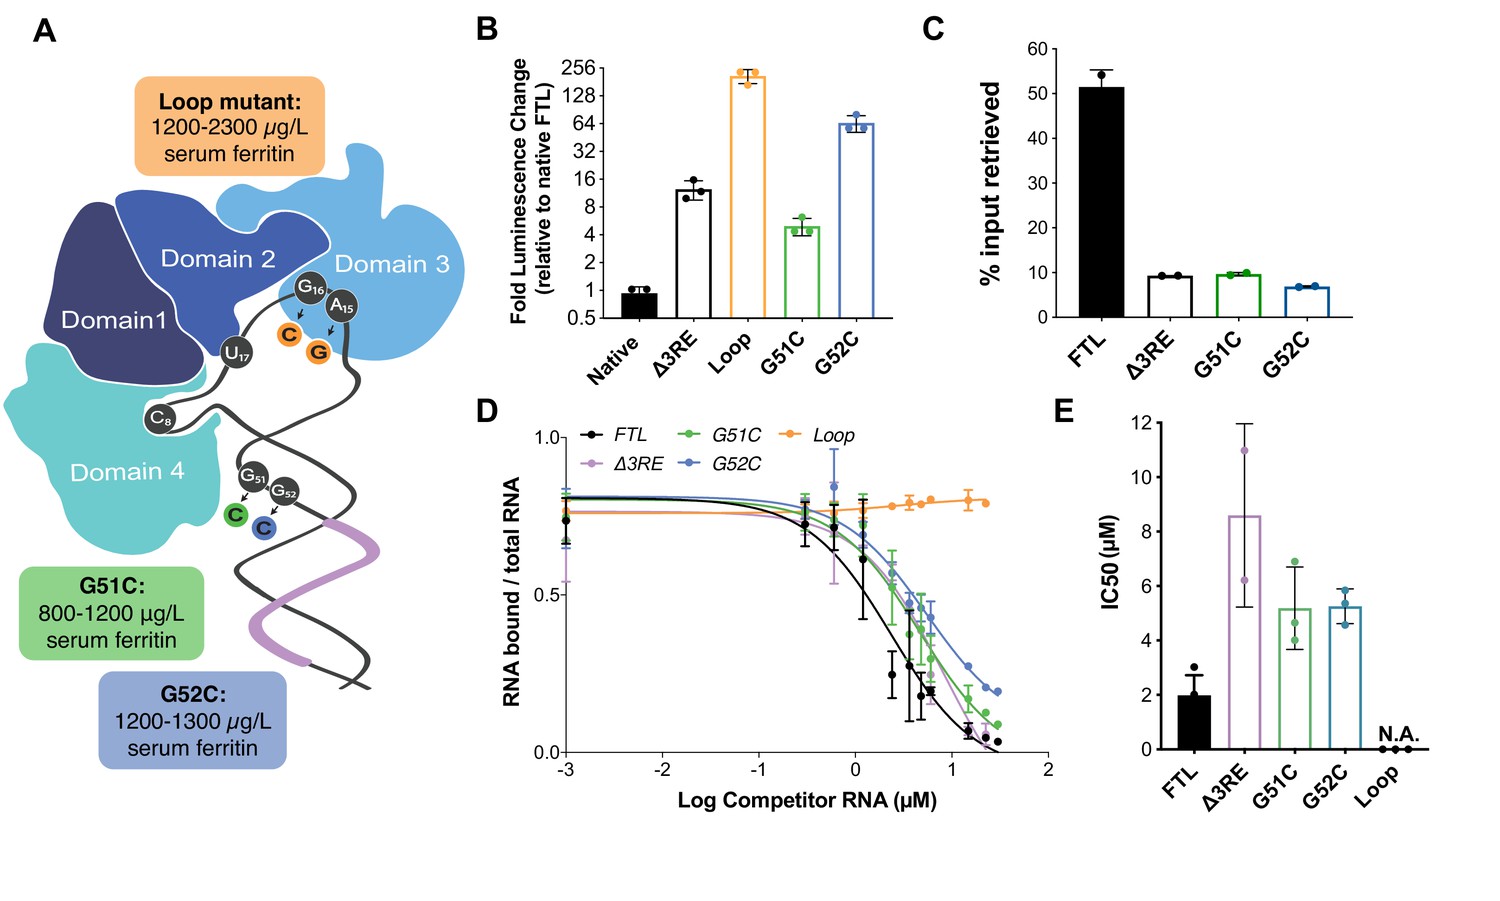
(A) Diagram of IRP binding to the IRE in FTL mRNA (Anderson and McLaren, 2012). Hyperferritinemia mutations are highlighted in orange (Cazzola et al., 1997), green (Camaschella et al., 2000), and blue (Luscieti et al., 2013) with their corresponding serum ferritin levels listed. Normal serum ferritin levels are under 300 µg/L. The 3RE is indicated in purple. Nucleotides that directly interact with the IRP are also identified (i.e. A15, G16, U17). (B) Luciferase activity of HepG2 cells transfected with mRNAs encoding the WT FTL 5ʹ-UTR or various hyperferritinemia mutations (G51C, G52C, or Loop mutant (A15G/G16C)), normalized to WT FTL reporter luciferase luminescence. The results are from three biological replicates, with error bars representing the standard deviation of the mean. (C) Binding of eIF3 to luciferase reporter mRNAs with WT or mutant forms of the FTL 5ʹ-UTR, using EIF3B immunoprecipitation (IP), followed by RNA extraction and RT-qPCR. Cells were harvested 8 hr post-transfection. Data are shown as the percent in the IP, compared to input levels. Error bars are the standard deviation of the mean of duplicate qPCR measurements from a representative IP. (D) Dose-response curve of RNA competition assays, based on gel shifts of NIR-labeled WT IRE-containing RNA, with WT, G51C, G52C, or Loop mutant (A15G/G16C) RNAs serving as cold competitors. Fold excess of competitor WT extended up to 100,000x. Recombinant IRP1 was used. Error bars represent standard deviations for each concentration of competitor. (E) The calculated IC50 values of the various competitor RNAs, based on the data in (D), with error bars representing the standard deviation from the mean IC50 value. N.A., the IC50 value could not be determined for the Loop mutant due to lack of any detectable competition. Note that the data for ∆3RE in panels (D) and (E) are from Figure 2B and C, measured in duplicate. The remaining experiments in (D) and (E) were carried out in triplicate.
-
Figure 4—source data 1
Luciferase reporter readouts, eIF3B Immunoprecipitation quantification, and EMSA analysis for hyperferritinemia mutants.
- https://doi.org/10.7554/eLife.48193.027
Figure 4—figure supplement 1
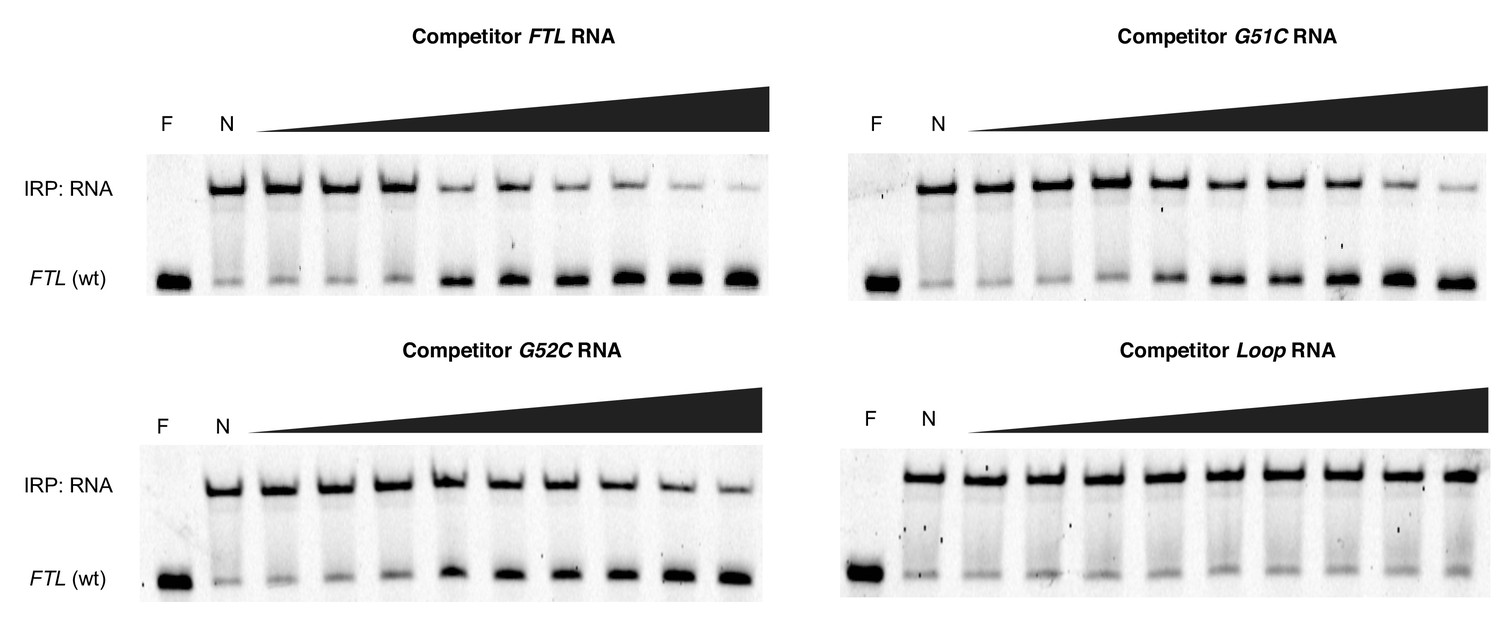
Native gels resolving RNA-IRP1 complexes formed after competition experiments with hyperferritinemia-related RNAs.
Near IR (NIR) labeled RNA corresponding to the full-length WT FTL 5ʹ-UTR were incubated with recombinant IRP1 and increasing molar excess concentrations of unlabeled competitor RNAs (1000x, 2000x, 4000x, 8000x, 12,000x, 16,000x, 20,000x, 50,000x, 75,000x), as indicated. F, lane with only NIR-labeled FTL RNA; N, no addition of competitor RNA to the NIR-RNA-IRP1 complex.
Figure 4—figure supplement 2
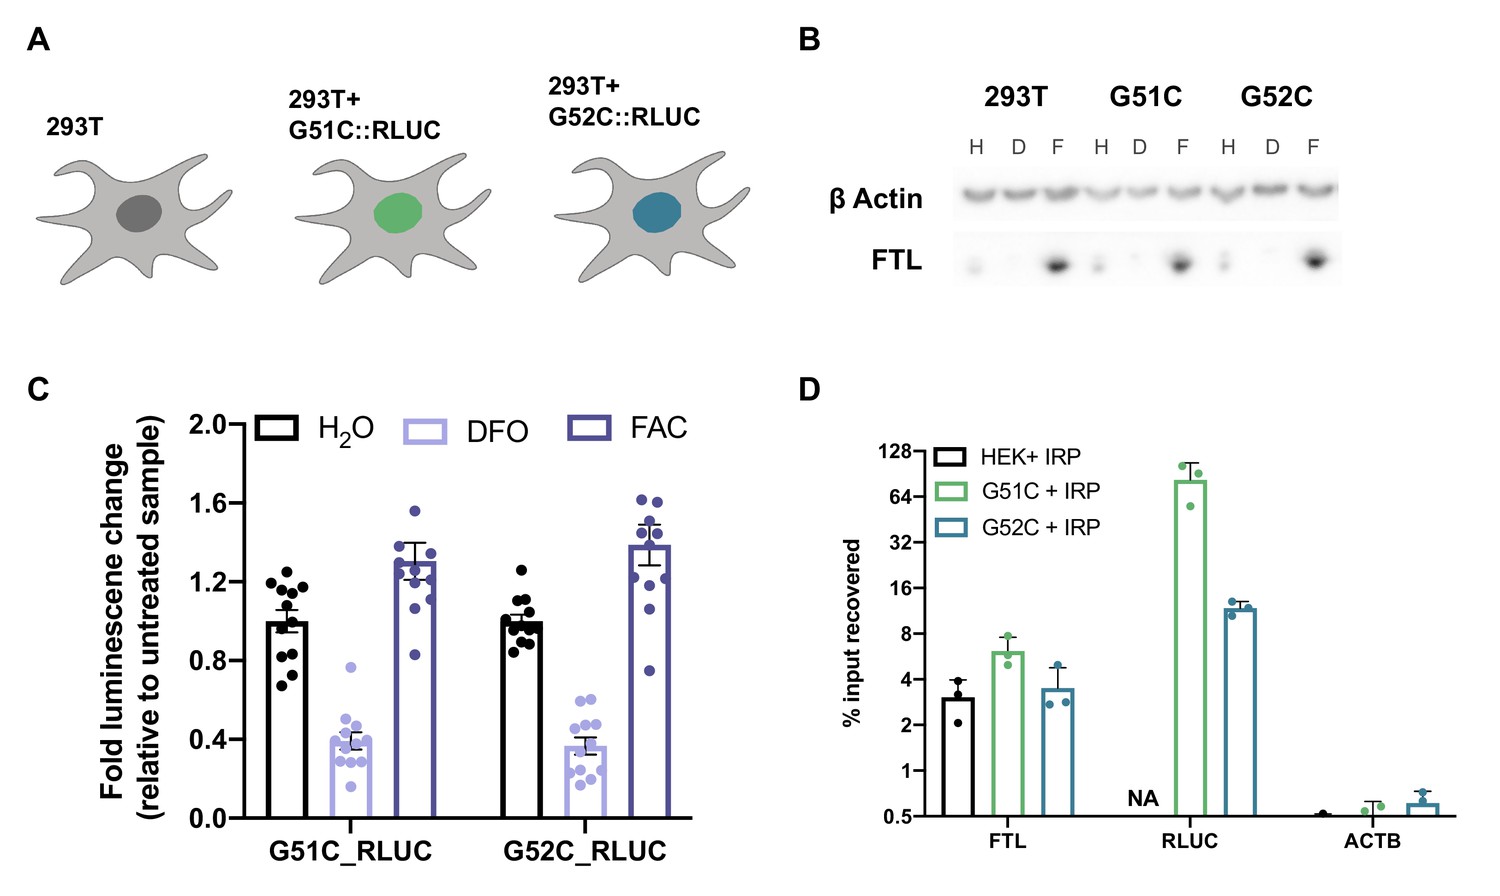
Iron responsiveness of hyperferritinemia associated SNPs in the FTL 5’-UTR.
(A) Schematic of the stable lentivirus lines generated that contain the rLUC reporters. (B) Representative western blot demonstrating the inherent iron responsiveness in the generated cell lines vs wild-type cells. This experiment was done in biological triplicate. Iron donor treatment with FAC at 50 µg/mL for 24 hr or iron chelation treatment with DFO at 200 µM for 24 hr. (C) Luciferase activity of the stable hyperferritinemia reporter cell lines after iron treatment. This experiment was done with 12 biological replicates. Error bars represent standard error of the mean. (D) Determination of IRP1 binding to FTL mRNA in WT (HEK + IRP) and various SNP reporter mRNAs (G51C + IRP, G52C + IRP) in HEK293T cells via FLAG immunoprecipitation (IP) followed by RNA extraction and RT-qPCR. The ACTB mRNA was used to control for nonspecific mRNA binding to FLAG-tagged IRP or beads. HEK – IRP reflects cells that were not transiently transfected, but were carried through the IP and following experiments. Error bars represent the standard deviation for the experiment carried out in biological triplicate, with measurements from representative IP reactions carried out in technical triplicate.
-
Figure 4—figure supplement 2—source data 1
Luciferase reporter readouts and data analysis of FLAG-tagged IRP1 immunoprecipitations.
- https://doi.org/10.7554/eLife.48193.026
Figure 5
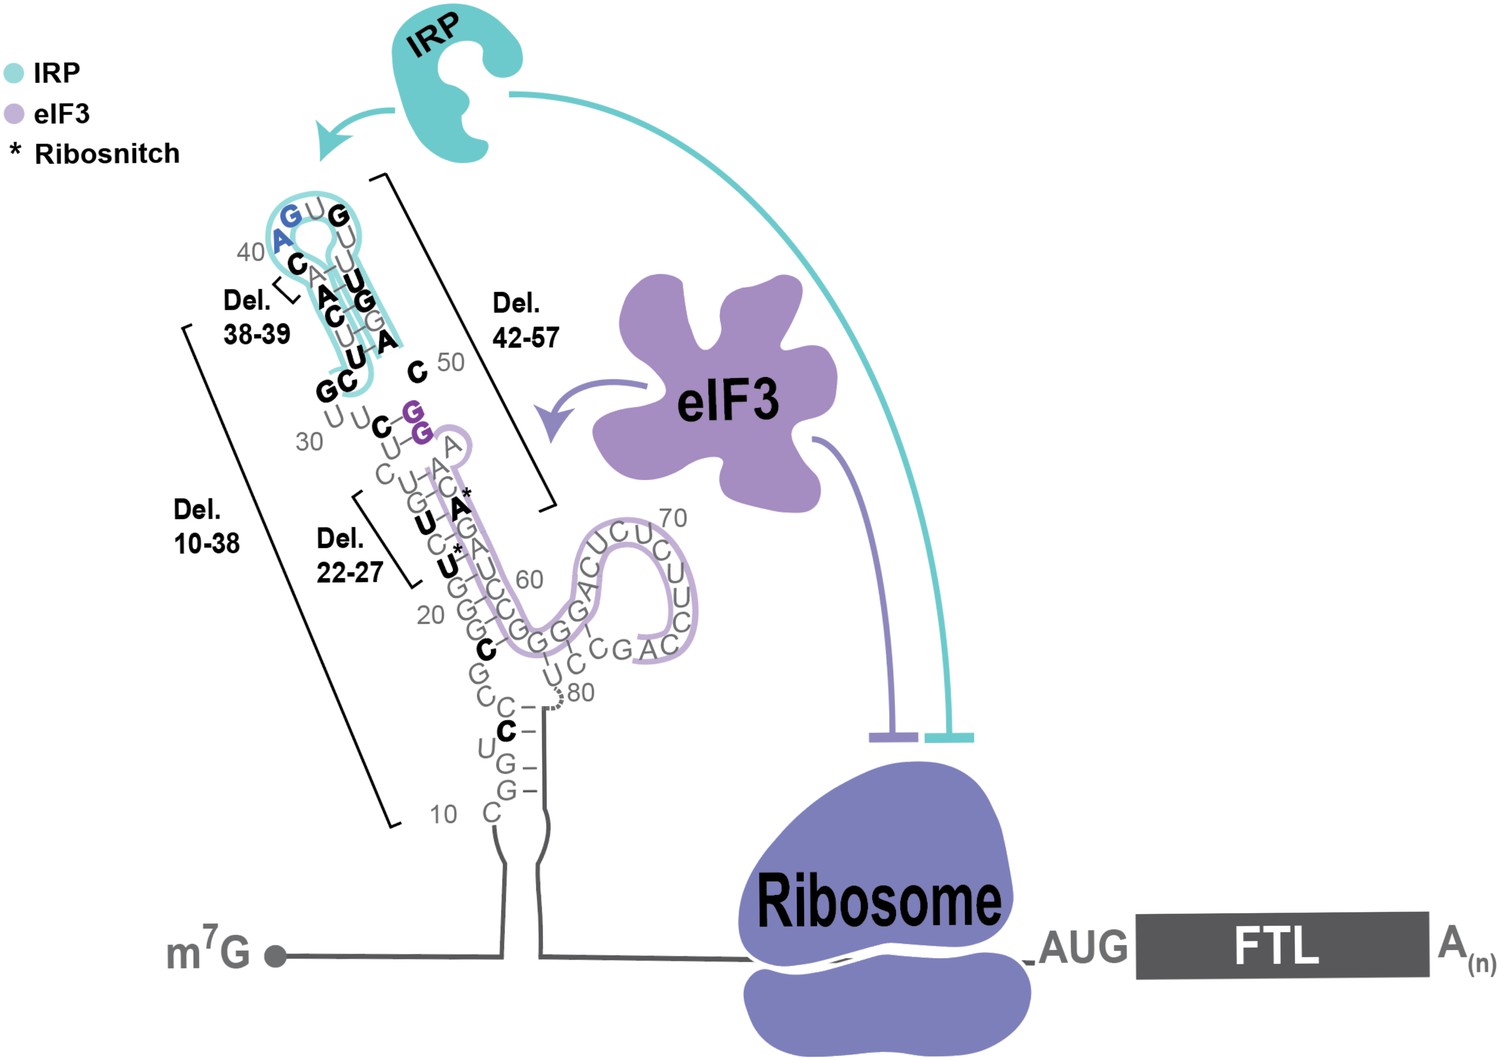
Model of post-transcriptional regulation of FTL mRNA.
IRPs repress FTL mRNA translation in an iron-dependent manner, whereas eIF3 represses FTL translation in an iron-independent manner. Coordination between IRP repression and eIF3 repression may differ by cell and tissue context. Various hyperferritinemia mutations (bolded) listed in the literature are mapped on the experimentall -determined secondary structure of the FTL mRNA 5ʹ-UTR (Martin et al., 2012), (Luscieti et al., 2013). The minimal annotation of the IRE is denoted by with a blue outline and the eIF3 PAR-CLIP defined interaction site is denoted with a purple outline. Mutations that disrupt IRP binding used in this study and determined here to disrupt eIF3 binding are bolded in blue and purple, respectively. (*) indicates nucleotides identified as ribosnitches (Martin et al., 2012).
Additional files
-
Transparent reporting form
- https://doi.org/10.7554/eLife.48193.029
Download links
A two-part list of links to download the article, or parts of the article, in various formats.
Downloads (link to download the article as PDF)
Open citations (links to open the citations from this article in various online reference manager services)
Cite this article (links to download the citations from this article in formats compatible with various reference manager tools)
Repression of ferritin light chain translation by human eIF3
eLife 8:e48193.
https://doi.org/10.7554/eLife.48193


