An mRNA-binding channel in the ES6S region of the translation 48S-PIC promotes RNA unwinding and scanning
- Universidad Autónoma de Madrid (UAM), Spain
- Centro de Biotecnología y Genómica de Plantas, Spain
Figures
Figure 1 with 1 supplement

Identification of mRNA contacts with 18S rRNA and ribosomal proteins (RPSs) on the solvent side of the 48S-PIC.
(a) Schematic diagram representing the method used to identify mRNA-18S rRNA contacts by specific crosslinking of 4-thio-U, followed by reverse transcriptase termination site (RTTS) assay and next-generation sequencing (NGS) (left panel). The middle and right panels show two solvent-side views of rabbit 40S (PDB: 4KZZ) that include the classical mRNA entry channel and the ES6S region. The positions of 4-thio-U residues in unstructured mRNA used for 48S PIC assembly are indicated, with the 18 most abundant crosslinking sites detected in 18S rRNA marked in red (see also Figure 1—figure supplement 1A for further details). Residues that have been reported to crosslink with eIF4G (Yu et al., 2011) are marked in green. uS5 (formerly RPS2) and eS4 (formerly RPS4X) are marked in brown, whereas the rest of the RPSs are shown in light blue. Note that, in this model, the ES6SA helix is in an ‘inward’ orientation towards the eIF3b. (b) Identification of RPSs that crosslink with unstructured mRNA assembled into the 48S PIC. Protein–mRNA interactions were captured throughout the mRNA (left panel); the 40 most-represented hits are shown in the right panel. Proteins marked in blue and black are those located on the solvent side and on the 60S subunit side, respectively. Note that uS5 was the hit with the highest representation.
Figure 1—figure supplement 1
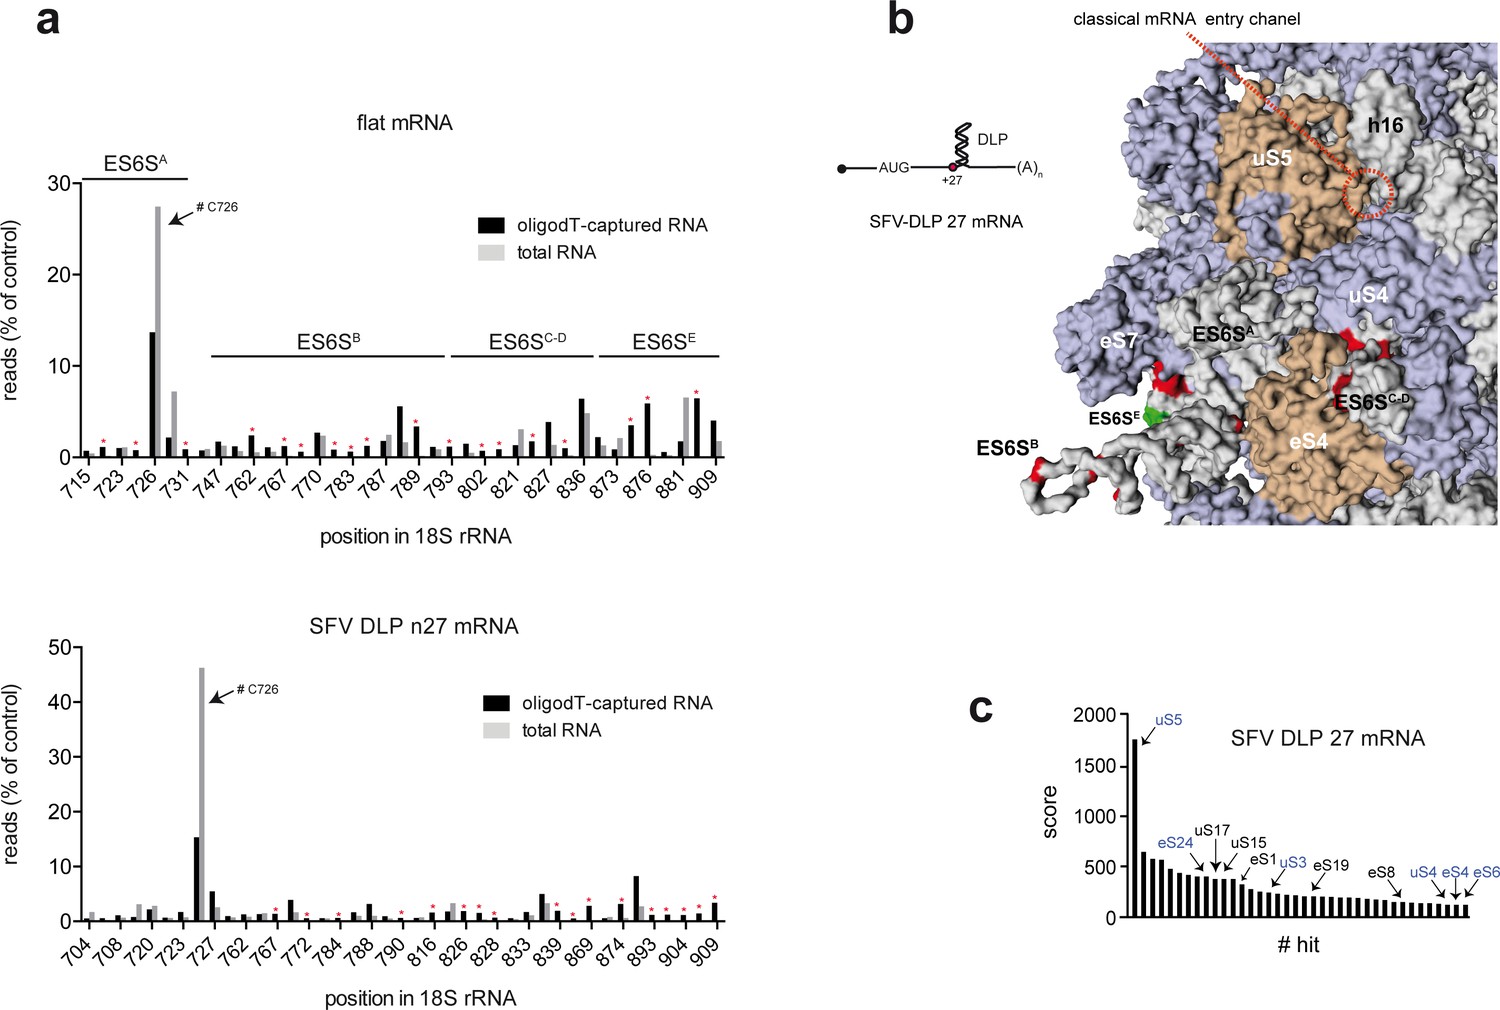
Identification of SFV-DLP 27 mRNA contacts with 18S rRNA and RPSs on the solvent side of the 48S-PIC.
(a) Histograms of 5′ reverse transcription (RT) arrests on 18S rRNA after crosslinking of unstructured and SFV-DLP n27 mRNAs assembled into the 48S-PIC. Total or oligo(dT)-purified RNA was subjected to reverse transcriptase termination site (RTTS) assay of 18S rRNA; only arrests representing >0.5% of total reads and showing a >4 fold enrichment in oligo(dT)-purified samples were selected for the analysis (marked with asterisks). The regions corresponding to the different ES6S helices are indicated. A strong RT arrest at C726 was observed in total RNA, although it is not known whether this was due to fragmentation of 18S rRNA during the purification process or to a modification of the residues surrounding C726. (b) Mapping of the crosslinking sites of SFV-DLP n27 mRNA in 18S rRNA. Data were processed as described in Figure 1A. (c) Identification of ribosomal proteins that crosslinked with SFV-DLP n27 mRNA assembled into the 48S-PIC. Data were processed and presented as in Figure 1B.
Figure 2 with 1 supplement
Identification of eIFs associated with mRNA in the ES6S region.
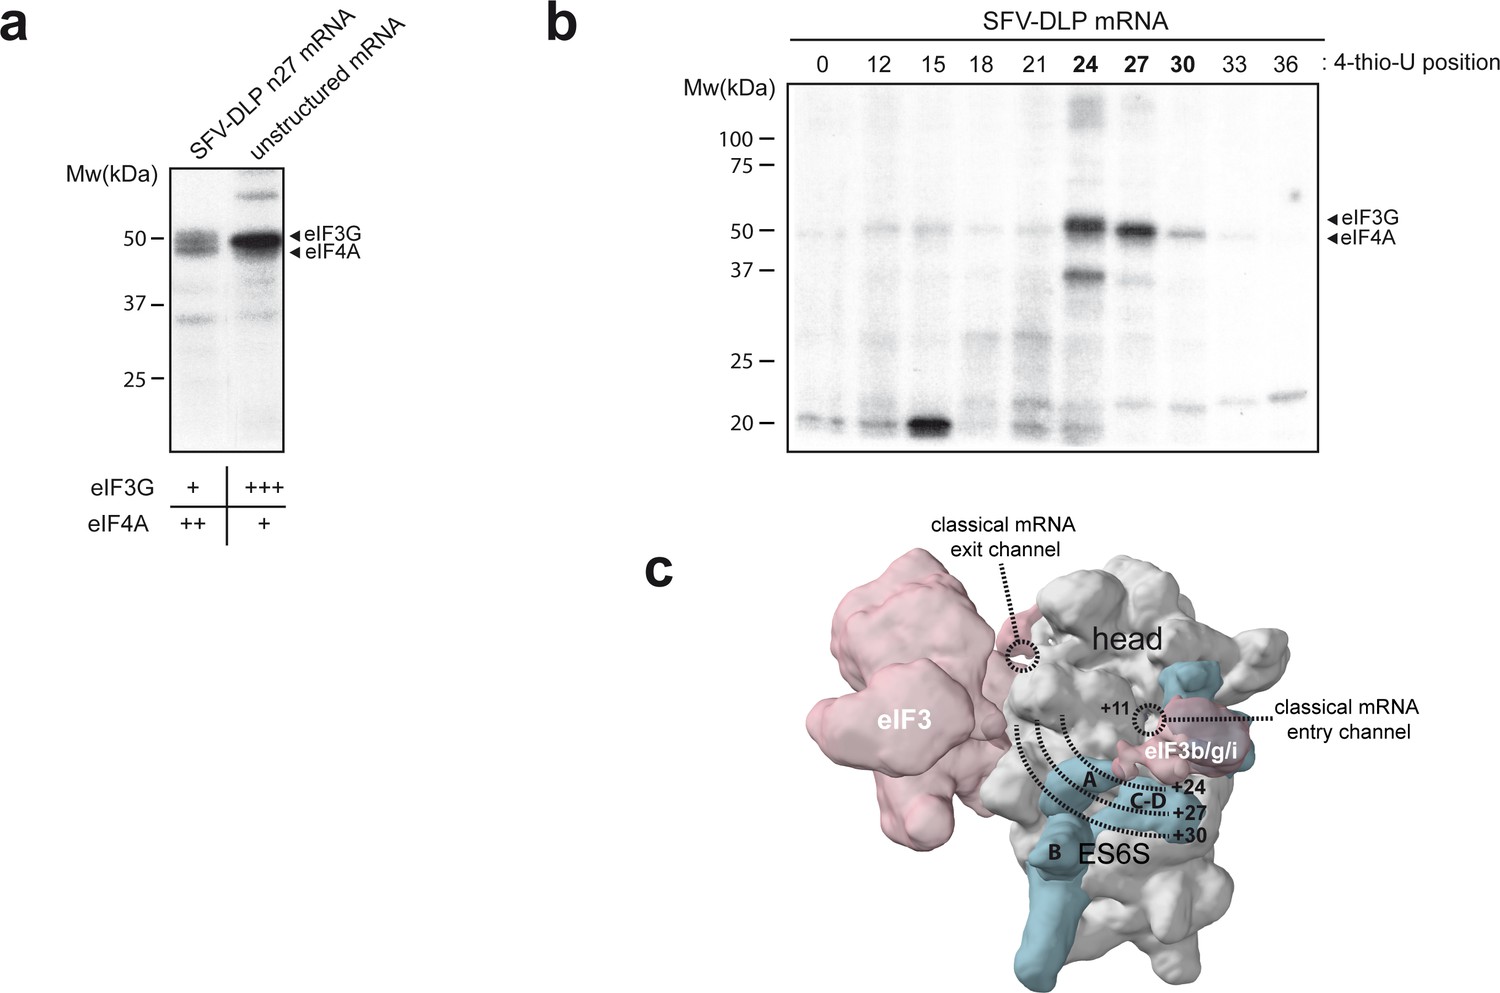
(a) Patterns of protein crosslinking generated with the indicated mRNAs, which are labeled with 4-thio-U and [α-32P]-GTP. The identified protein bands are indicated, with a relative quantification of the intensity of the protein bands shown below, according to this experiment and the one shown in Figure 2—figure supplement 1. (b) Mapping of the interaction of eIF4A and eIF3g with mRNA in the ES6S region. SFV-DLP mRNAs with a single 4-thio-U placed at the indicated positions were used to assemble the 48S-PIC, and the pattern of protein crosslinking was analyzed. (c) The positions of mRNA that crosslinked with eIF4A and eIF3g were projected on the solvent side of the PIC, assuming that the mRNA is threaded along the ES6S region. The +11 position of mRNA is placed at the mRNA entry channel (Lomakin and Steitz, 2013; Pisarev et al., 2008). A rise per base of 4.5 Å for a stretched RNA strand was used as described previously (Toribio et al., 2016a).
Figure 2—figure supplement 1
Confirmation that eIF4A and eIF3g crosslinked with mRNAs in 48S-PIC.
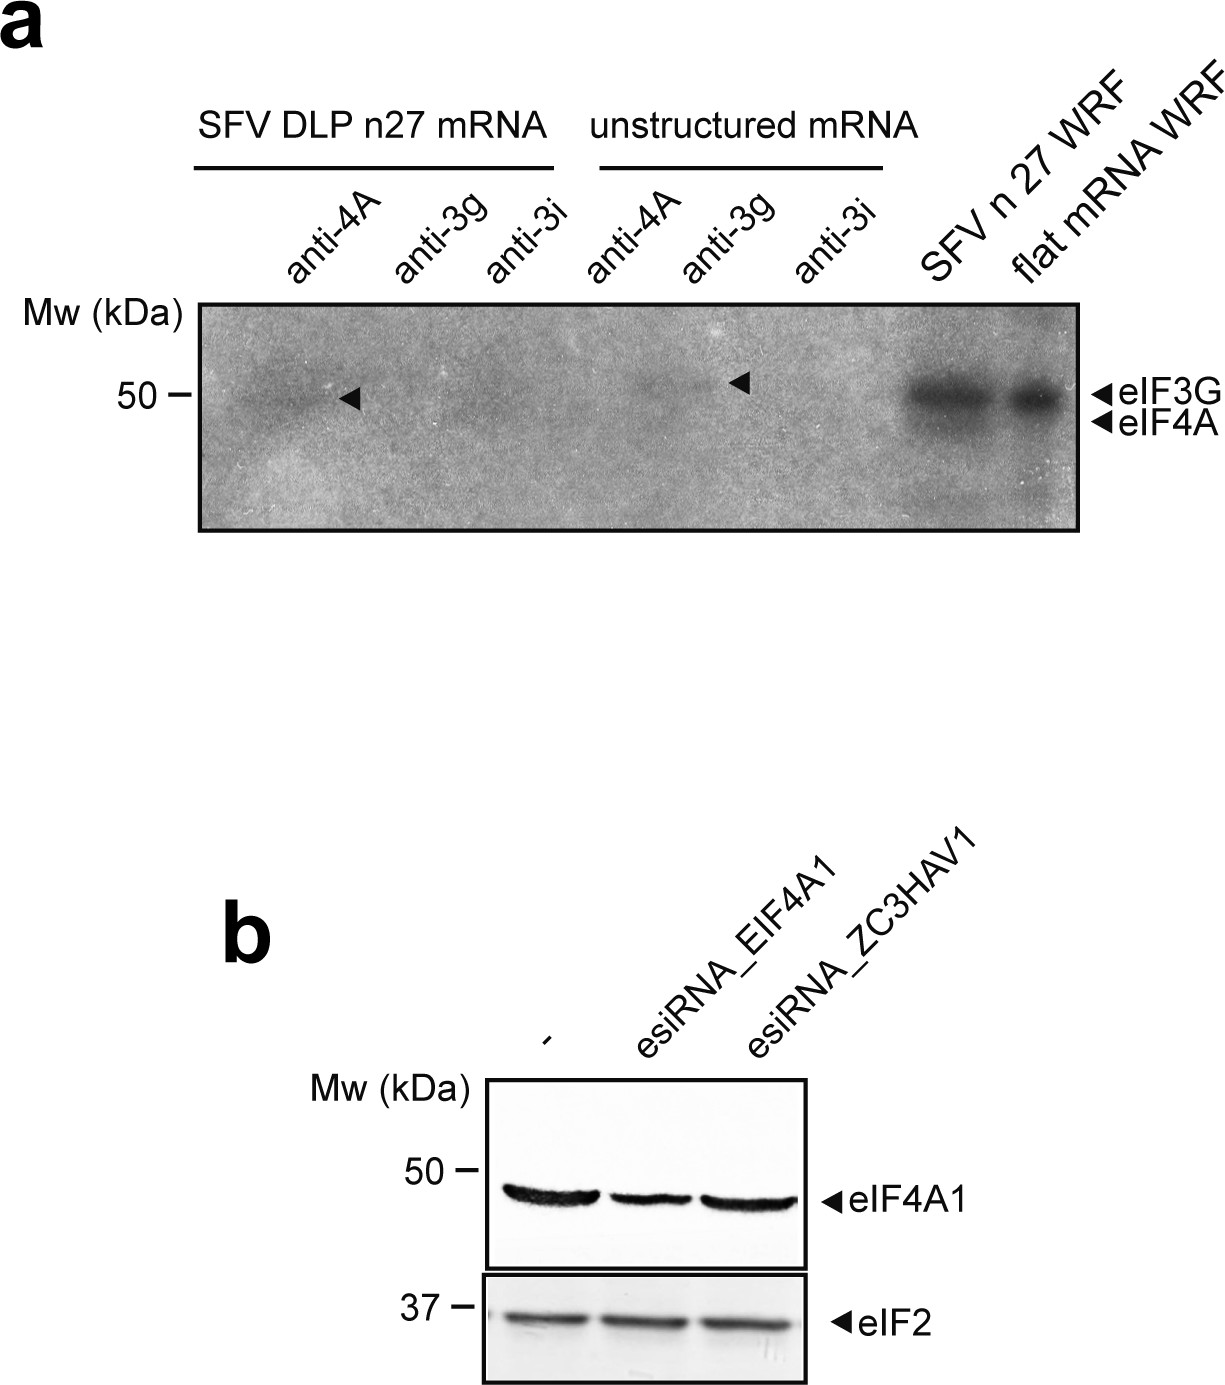
(a) Denaturing immunoprecipitation (dIP) of crosslinked 48S-PIC revealed the presence of eIF4A and eIF3g bound to the indicated mRNAs (arrowheads). (b) Western blot analysis showing the specificity of the eIF4A1 antibody. HeLa cells were transfected with the indicated esiRNA, and 72 hr later, the resulting cells extracts were probed with anti-eIF4A1 and anti-eIF2 antibodies. esiRNA against the human ZC3HAV1 gene was used as control.
Figure 3 with 5 supplements
ES6S blockage affects global translation.
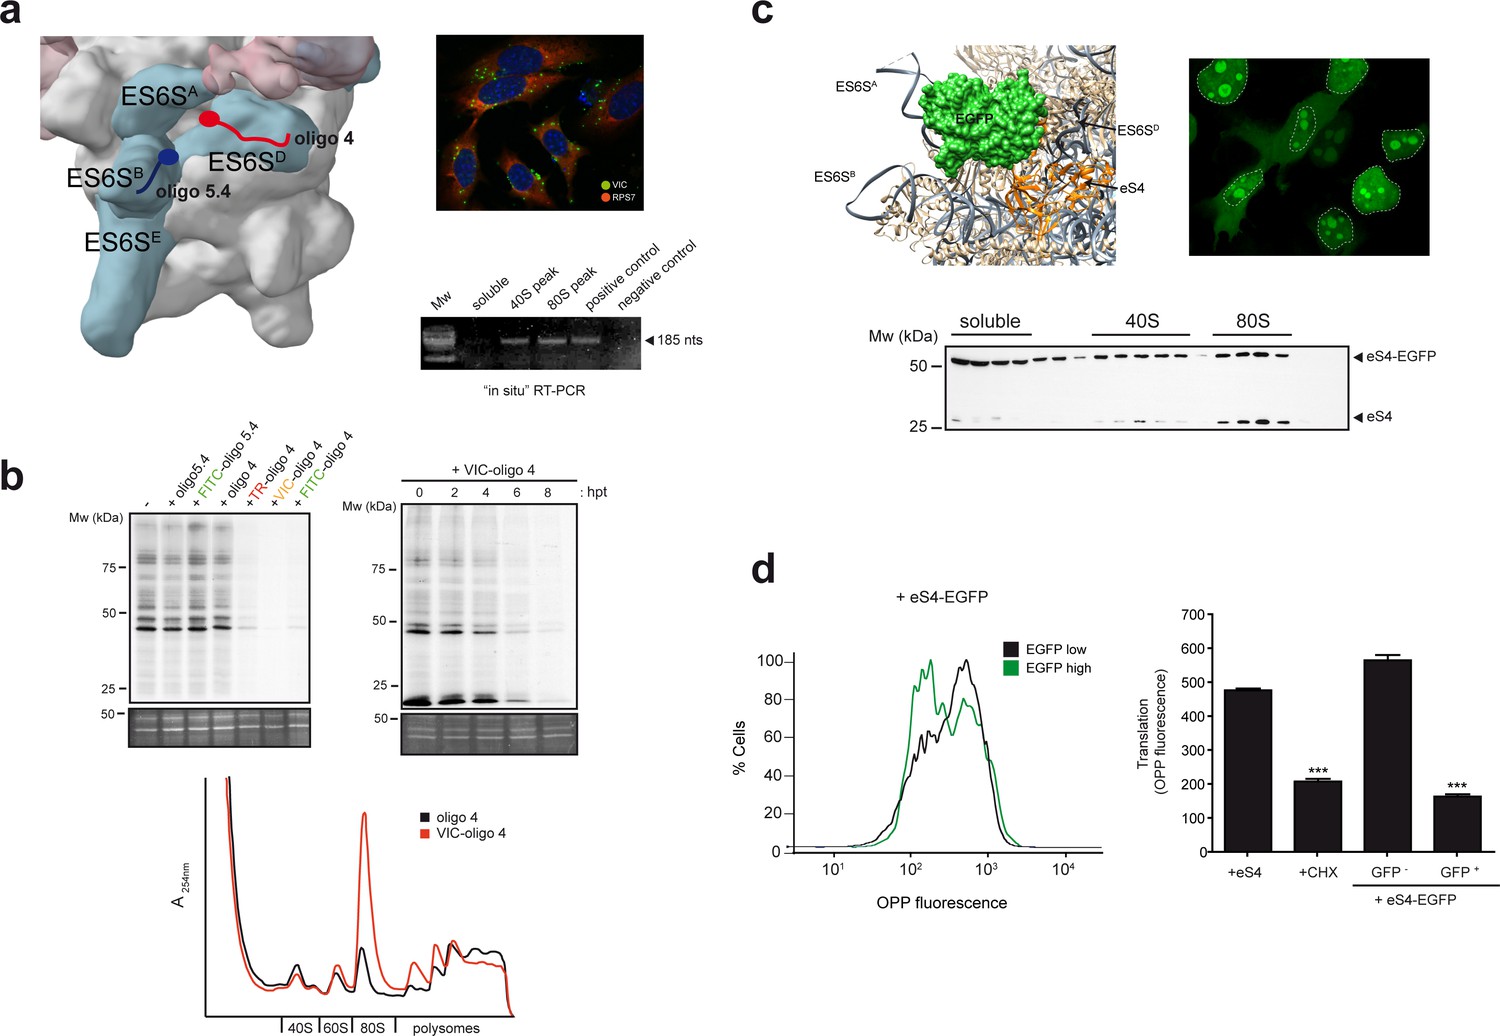
(a) Binding site of oligonucleotides 4 (red) and 5.4 (blue) in the ES6S region of the 40S subunit (left panel). Note that in this model of PIC (EMD-5658), the ES6SA helix is in an ‘outward’ orientation. Right panels show VIC-oligo 4 uptake and binding to ES6SD. The upper panel shows fluorescence microscopy of VIC-oligo 4 (green) combined with an IF staining of eS7 (red) and DAPI (blue) in MEF cells. Note the typical aggregation of the oligo inside the cells. The bottom panel shows an in situ RT-PCR of RNA extracted from the indicated fractions. cDNA was primed exclusively by the VIC-oligo 4, which remained bound to ES6SD during RNA extraction. Total RNA from untransfected cells was included as a negative control. (b) Metabolic labeling of MEF cells with [35S]-Met. Cells transfected with the indicated oligonucleotides were labeled for 30 min at 12 hr post-transfection (hpt), and analyzed by SDS-PAGE and autoradiography. A SYPRO staining of the middle part of gels is shown as loading control (–). The upper right panel shows a time-course analysis of the VIC-oligo 4 effect on translation. The lower panel shows a polysome profile of MEFs transfected with VIC-oligo 4 (red) or with unconjugated oligo 4 (black). Extracts were separated in a 10–40% sucrose gradient and fractionated as described in the Materials and methods; the identities of the main peaks are indicated. (c) Fusion protein-mediated blockage of ES6S affects global translation. Model of EGFP (green) fused to eS4 (orange) of the 40S subunit. Note that in this model of human 40S, the ES6SA helix is in an ‘outward’ orientation (upper left panel). Fluorescence microscopy of HeLa cells expressing eS4–EGFP fusion protein (upper right panel). Micrographs were taken at 36 h. Nuclei are encircled by a dashed line; note the bright nucleolar and cytoplasmic staining. The bottom panel shows the distribution of eS4 and eS4-EGFP proteins in a 10–35% sucrose gradient from HEK293T cells transfected with eS4-EGFP. (d) Measurement of total protein synthesis by OPP fluorescence in transfected cells expressing no/low (black line) or high levels of eS4-EGFP (green line). Cells were first gated into two groups according to EGFP expression, and then the distribution of OPP fluorescence intensity was determined (left panel). The right panel shows OPP fluorescence measurements for cells transfected with eS4 alone, cells treated with 50 μg/ml CHX for 20 min, and cells transfected with eS4–EGFP that express (or do not express) EGFP. Data are the mean of three independent experiments ± standard deviations (SD).
Figure 3—figure supplement 1
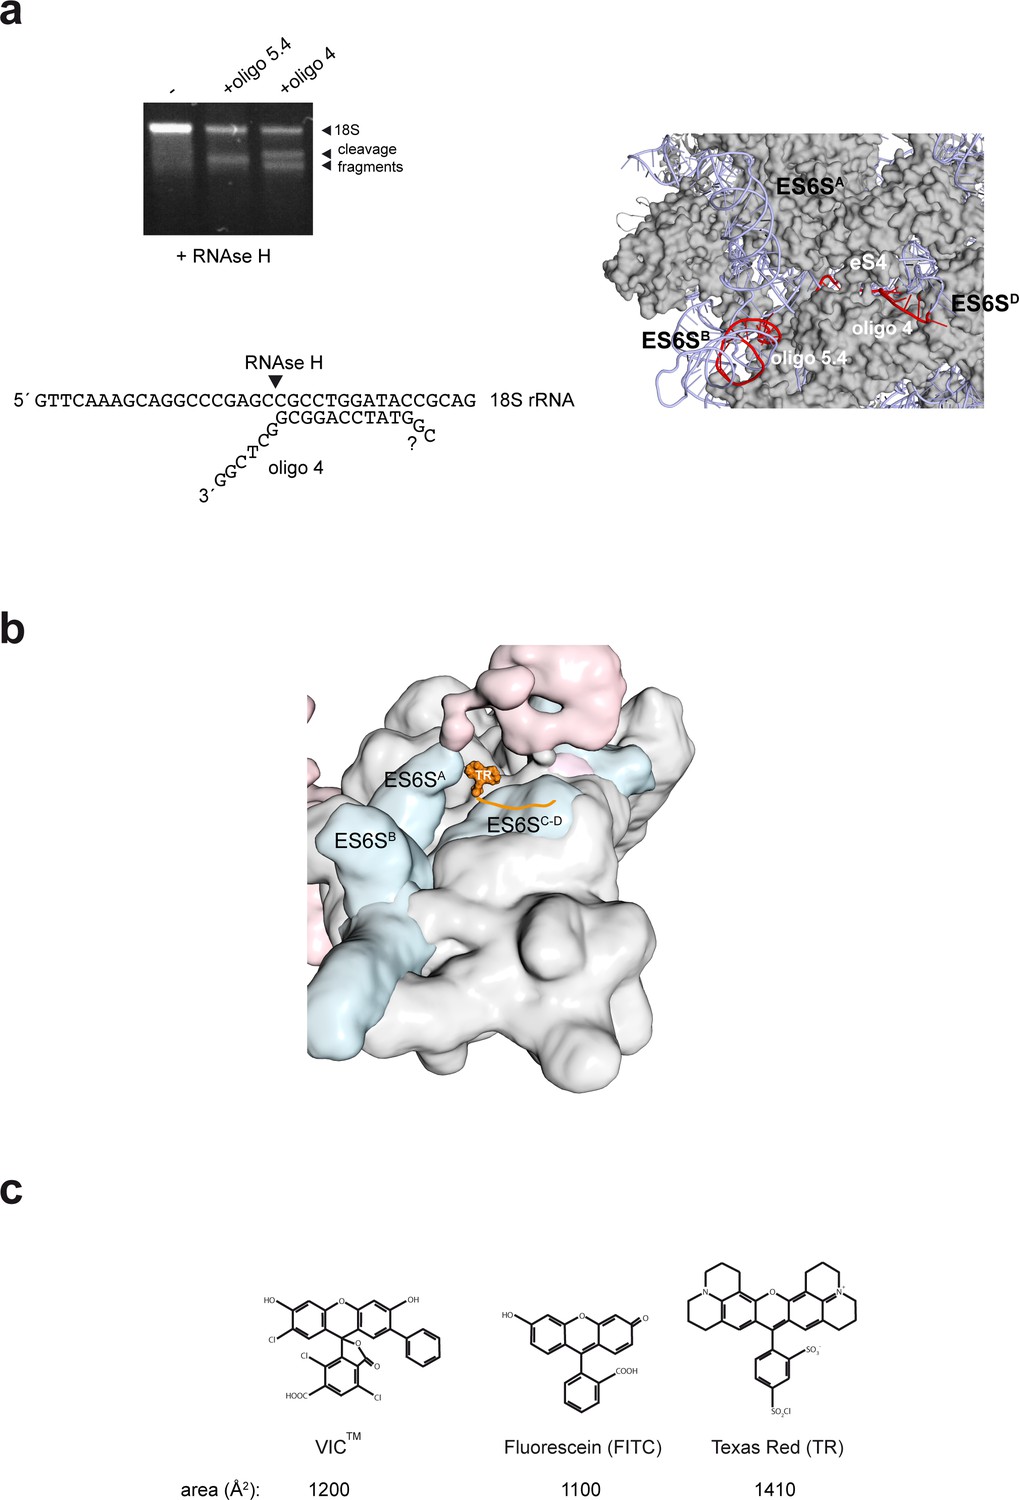
Mapping and modeling of the oligo 4 bound to 48S-PIC.
(a) Mapping oligo 4–18S pairing. RNAse H assay showing the cleavage fragments that are generated upon binding of oligo 4 and 5.4 to 40S subunits. It was determined that the last 6 nt of the 3′ end of VIC-oligo4 remained unpaired, but we could not determine whether the last two 5′ nt of oligo 4 were paired or not (lower panel). The target sequences for oligo 4 and 5.4 in the ES6SD and ES6SB helices, respectively, are marked in red (right panel). Note that in this human model of 40S, ES6SA is in the ‘outward’ conformation. (b) Model of TR–oligo 4 bound to PIC. The fluorophore is located between the ES6SA and ES6SD helices; note that in this model, ES6SA is in the ‘inward’ conformation. (c) Molecular structures of the IC, FITC and TR fluorophores.
Figure 3—figure supplement 2
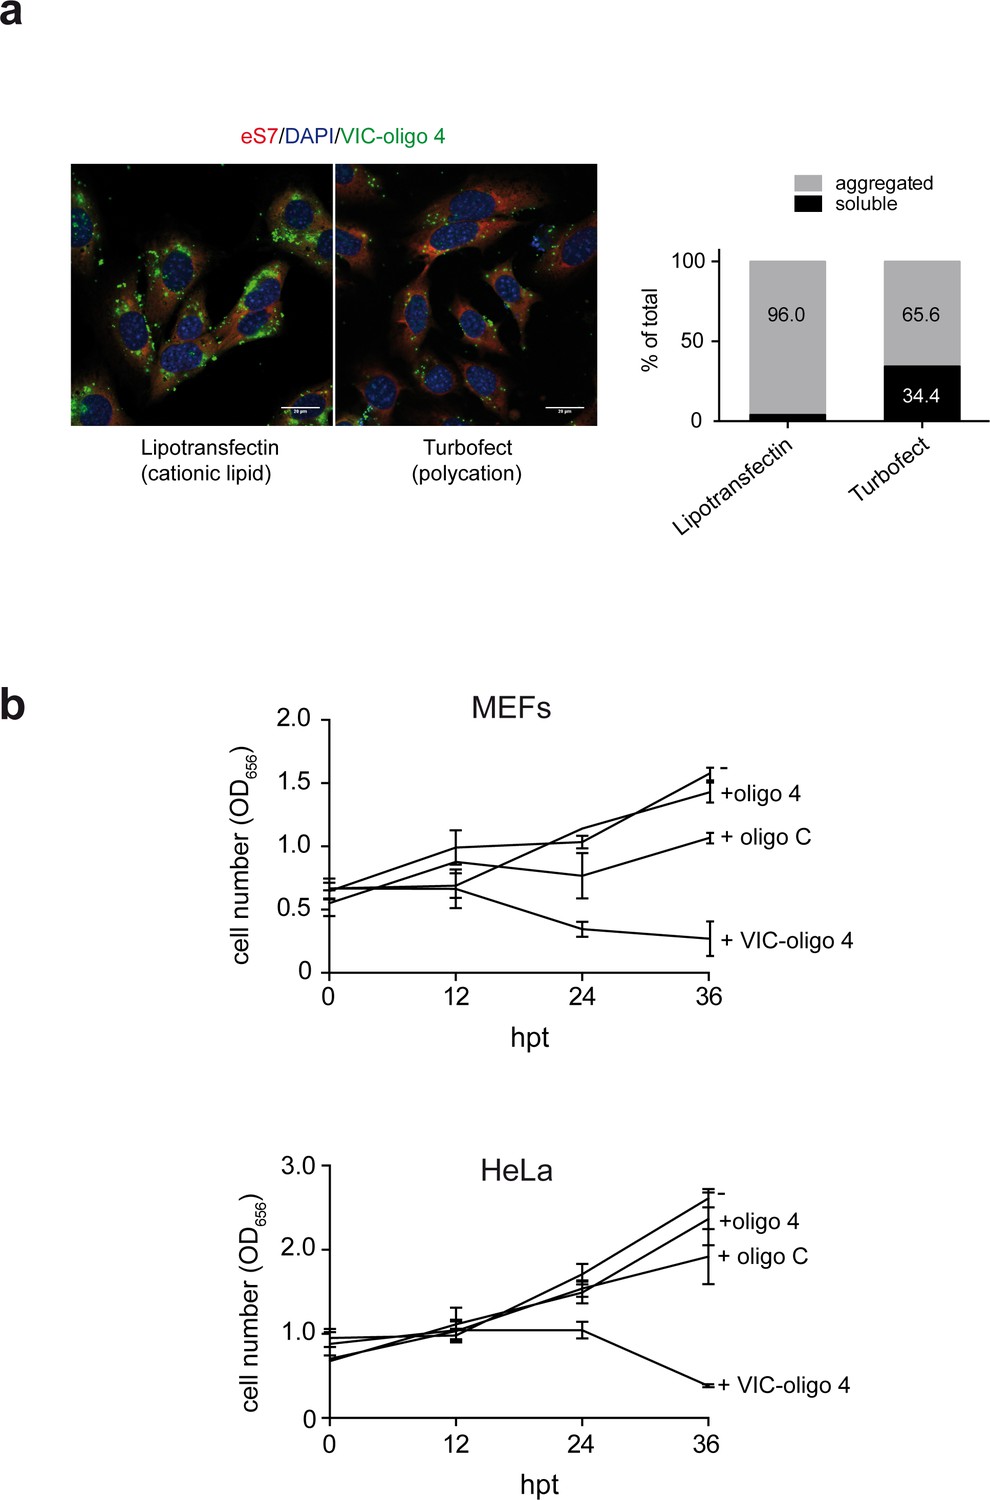
Accumulation of VIC-oligo 4 into the cells and its effect on proliferation.
(a) Comparative analysis of the effects of lipotransfectin and turbofect transfection reagents on intracellular accumulation of VIC–oligo 4. MEFs were transfected and fixed 12 hr later for immunofluorescence analysis (left), as in Figure 3. Parallel transfections were lysed in polysome buffer and postnuclear fractions were centrifuged at 10,000 rpm in a minifuge for 30 min to separate soluble from aggregated VIC–oligo 4. The relative amount of VIC-oligo 4 in each fraction was quantified by fluorescence and expressed as % of total. Note that the right micrograph corresponds to the one shown in Figure 3. (b) Effect of VIC–oligo 4 on the proliferation of MEFs and HeLa cells. At the indicated times post-transfection, cells were fixed with formaldehyde and stained with crystal violet. Then, monolayers were solubilized in 10% acetic acid and the corresponding absorbance at 656 nm was measured. Data are the mean ± SD of three independent experiments.
Figure 3—figure supplement 3
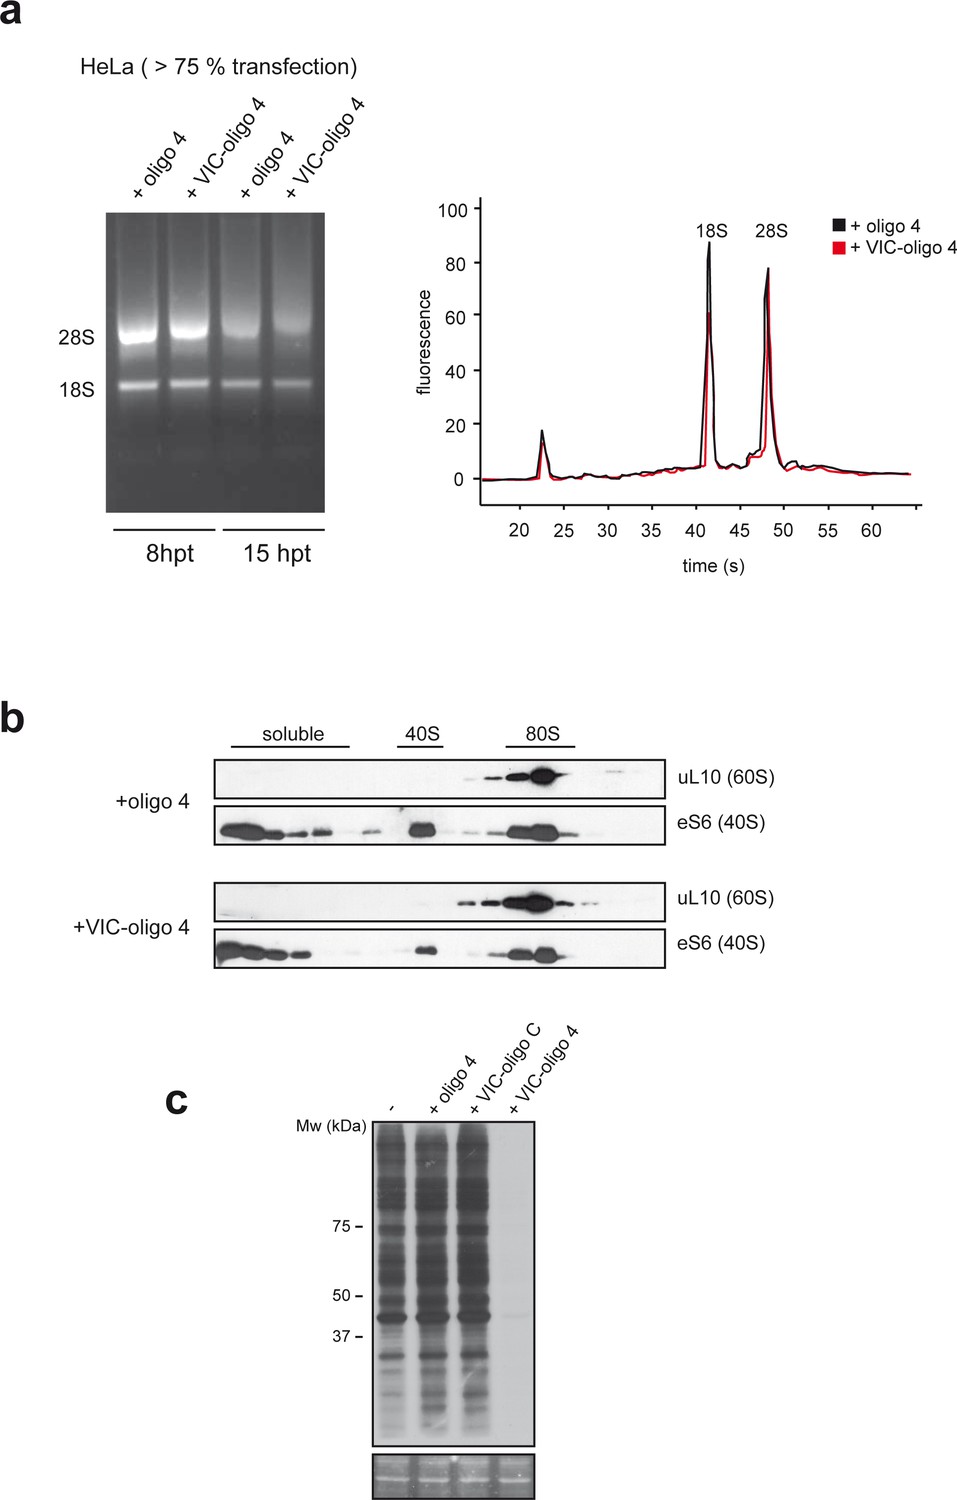
VIC-oligo 4 does not significantly affect 40S subunit biogenesis.
(a) Effect of VIC–oligo 4 on the 18S rRNA content of HeLa cells at 8 and 15 hr post-transfection (hpt) (left panel). The 28S/18S ratio of HeLa cells at 15 hpt was measured using an RNA bioanalyzer. (b) Effect of VIC–oligo 4 on 40S and 80S analyzed by western blot against eS6 and uL10. Fractions of the polysome analysis showed in Figure 3b were subjected to western blot as described in the Materials and methods. (c) Comparative effect of oligo 4, VIC–oligo C and VIC–oligo 4 on translation in MEFs cells. The experiment was carried out as in Figure 3b.
Figure 3—figure supplement 4
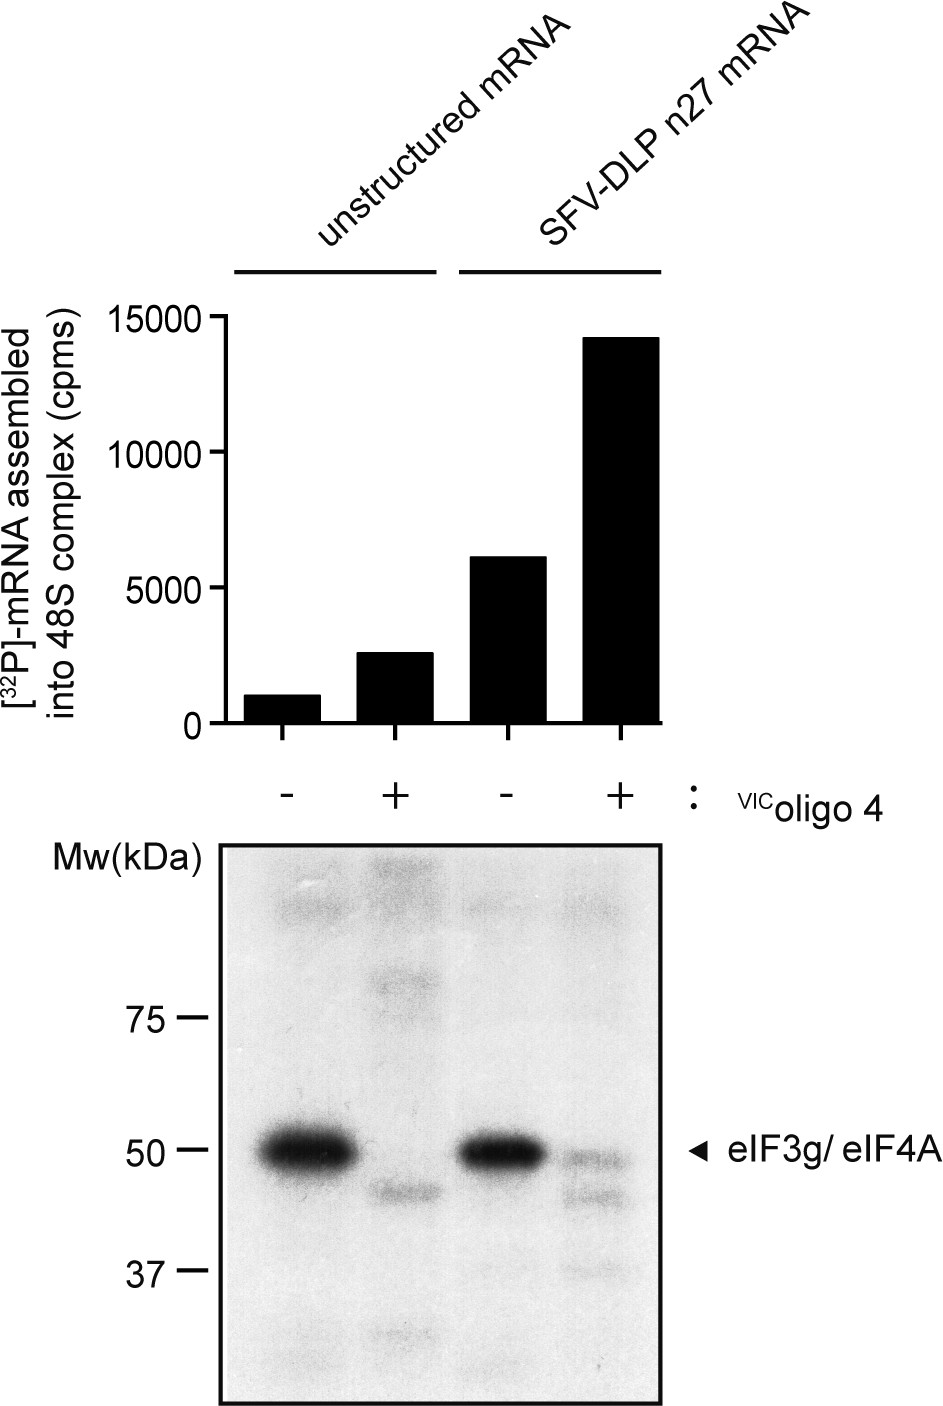
Effect of VIC–oligo 4 on protein crosslinking in 48S complexes assembled with unstructured or SV-DLP n27 mRNAs.
The amount of [32P]-mRNA bound to WRF is indicated (upper panel), showing the pattern of protein crosslinking with the indicated mRNAs in the absence and presence of VIC–oligo 4. The unresolved eIF3g and eIF4A bands are shown (lower panel).
Figure 3—figure supplement 5
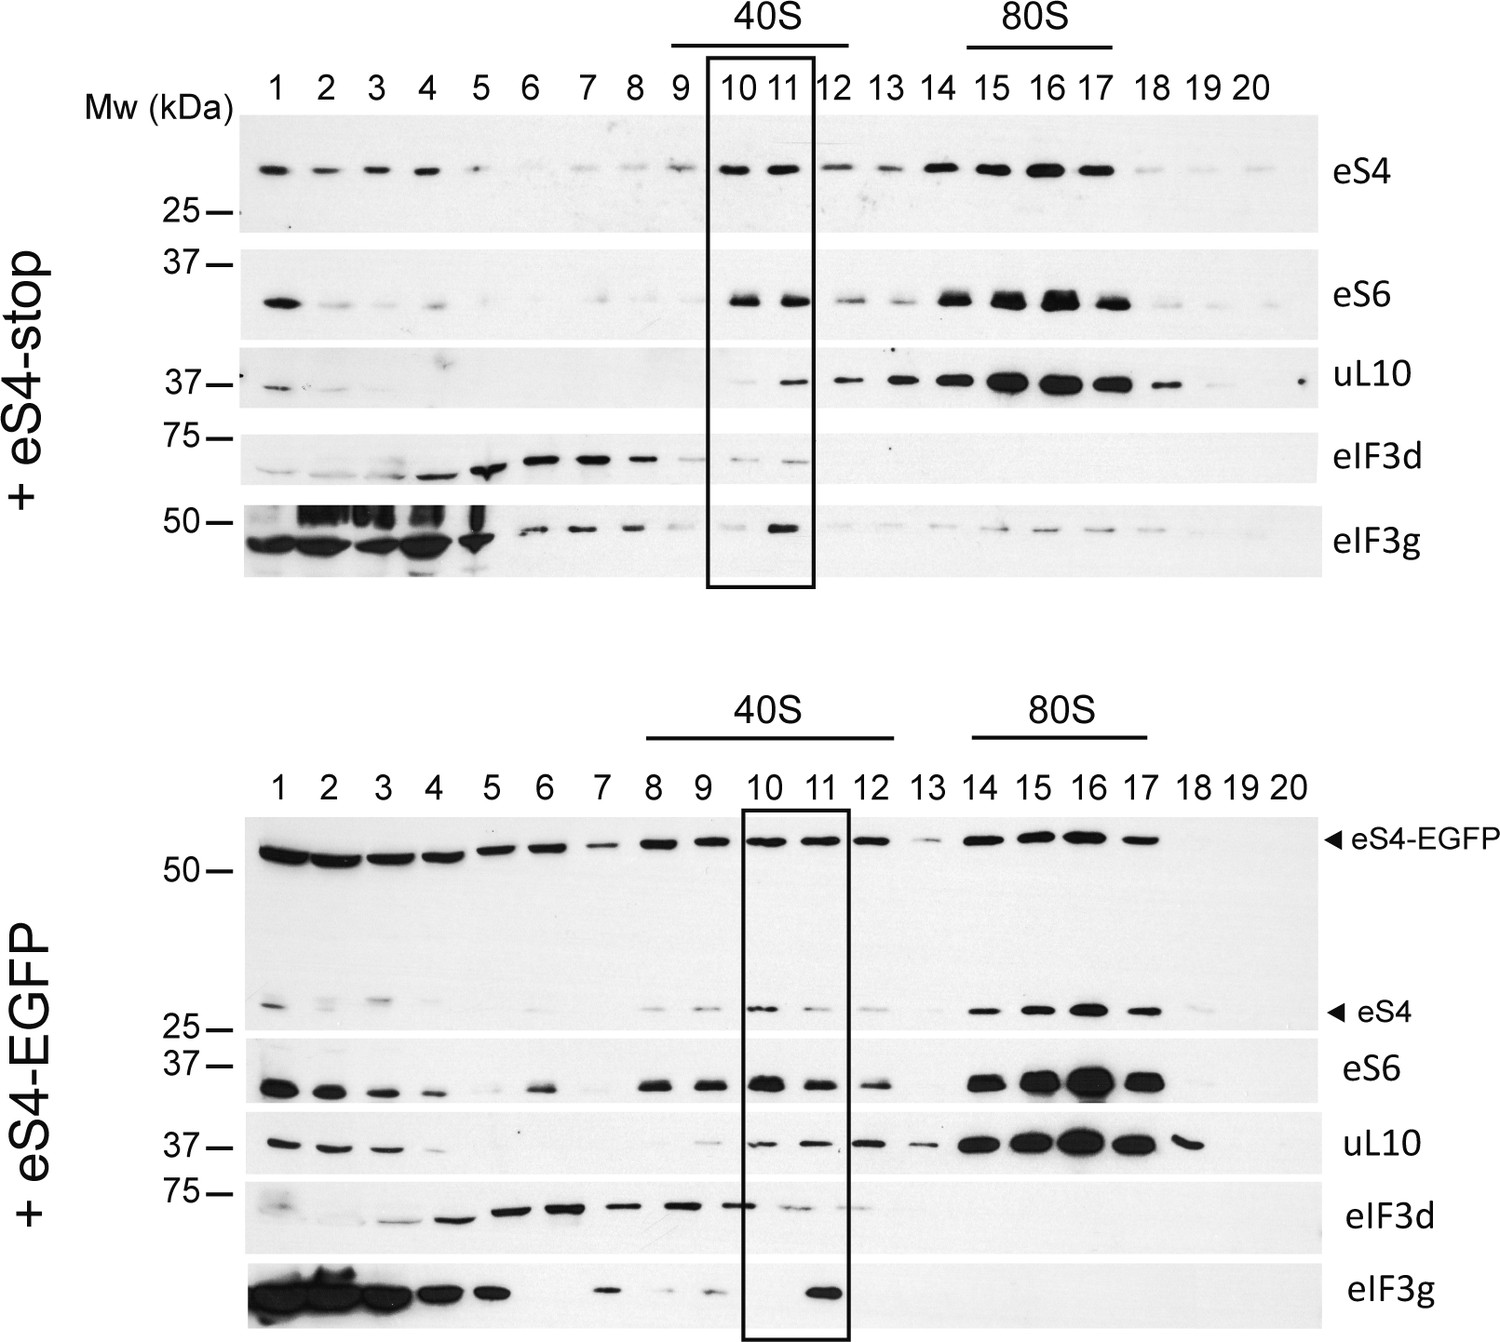
Effect of eS4–EGFP overexpression on the formation of 40S and the PIC.
HEK293T cells were transfected with the indicated construct and analyzed by centrifugation in 10–30% sucrose gradients. Fractions were collected for western blot analysis with the indicated antibodies; those corresponding to 40S and PIC are boxed.
Figure 4 with 1 supplement
Differential effect of ES6S blockage on cap-dependent translation.
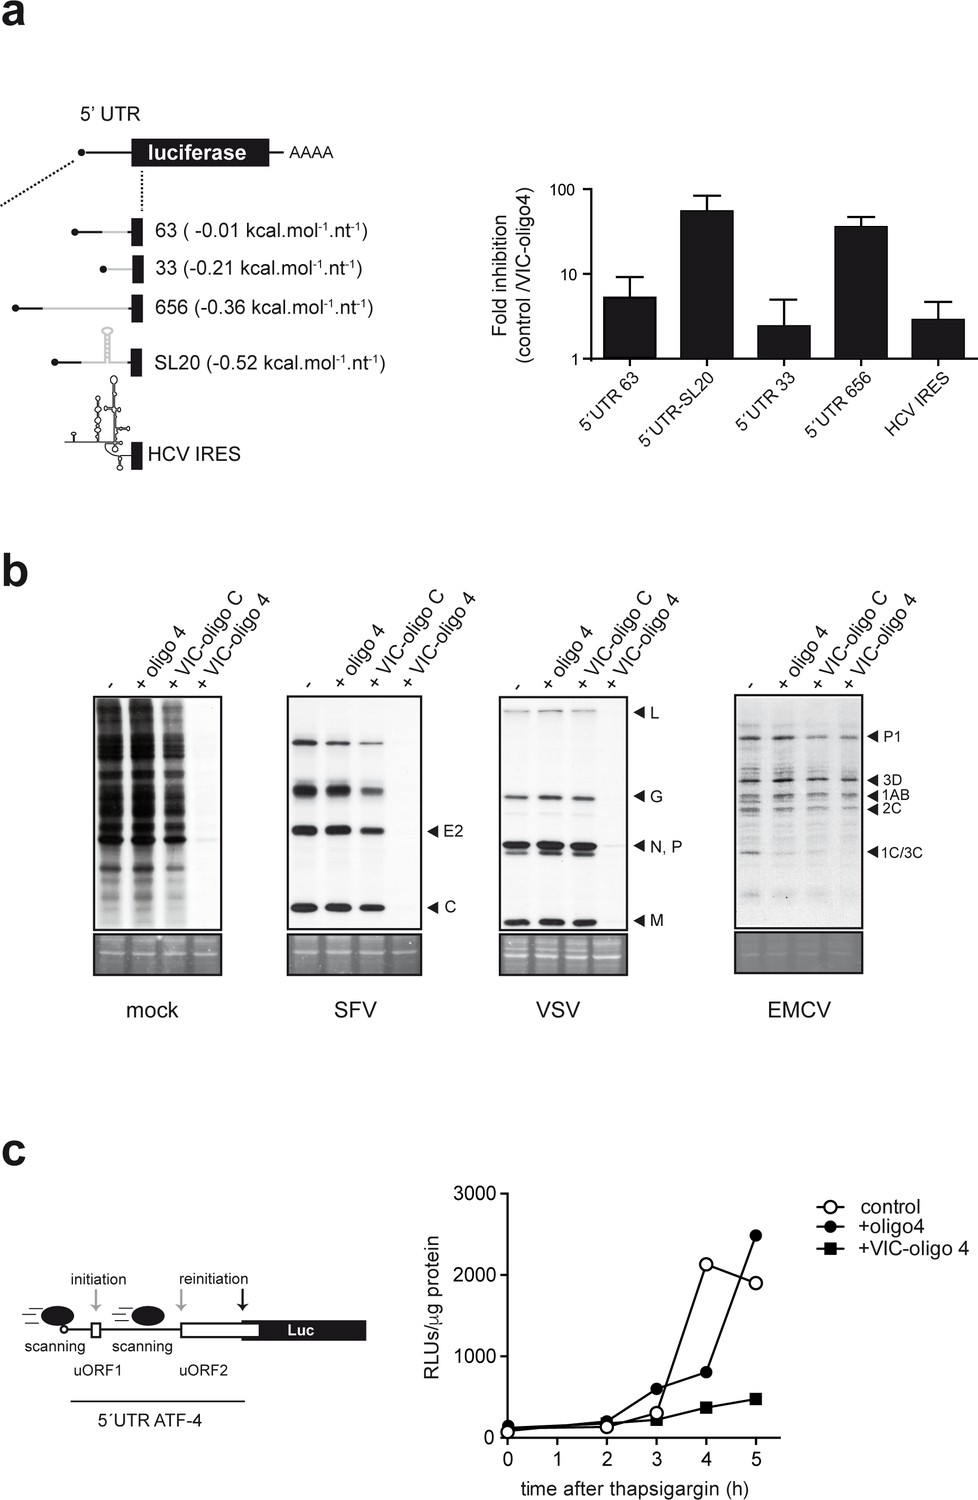
(a) Schematic diagram of luc mRNAs bearing different 5′ UTRs (details in Supplementary file 1). Note that the cap-proximal sequences are identical for the 63, 656 and SL20 mRNAs (denoted with a black line). HCV, hepatitis C virus. MEF cells were cotransfected with 1 μg of the indicated luc plasmid and 10 pmol of VIC–oligo 4; transfections with oligo 4 and VIC–oligo capsid did not significantly affect luc expression, and are included as controls. Data are expressed as fold inhibition with respect to oligo 4 control from four independent experiments (mean ± SD). (b) Effect of VIC-oligo 4 on translation of viral mRNAs. MEFs were transfected with the indicated oligonucleotides and infected 6 hr later with the indicated viruses at a multiplicity of infection (MOI) of 10 pfu/cell. At 4 hr post-infection, cells were metabolically labeled with [35S]-Met for 30 min and analyzed as described in the Materials and methods. The positions of the main viral protein bands are indicated. (c) Effect of VIC–oligo 4 on luc translation driven by the 5′ UTR of ATF-4 mRNA. MEFs constitutively expressing 5′ UTR ATF-4–Luc mRNA were transfected with the indicated oligonucleotides, and treated 6 hr later with 2 μM thapsigargin for the indicated times.
Figure 4—figure supplement 1
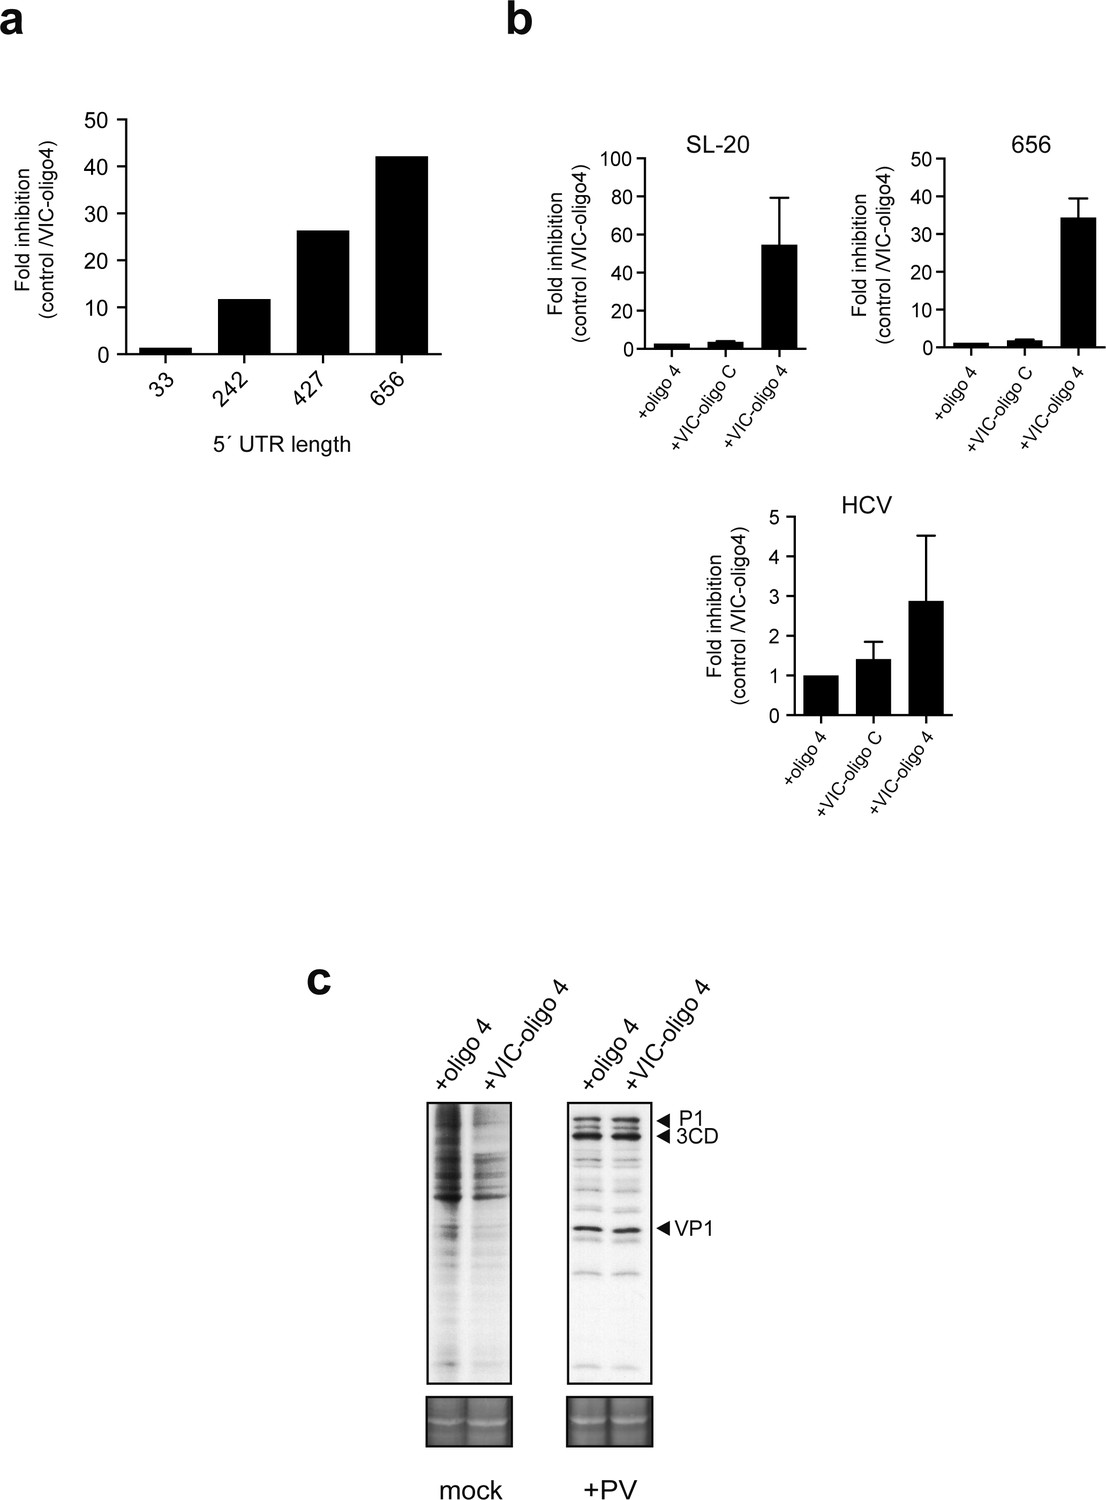
Effect of 5' UTR length of luc mRNAs on the sensitivity to VIC-oligo 4-mediated translational block.
(a) Effect of 5′ UTR length on cap-dependent translation ofluc mRNAs in the presence of VIC-oligo 4. Data are the mean of two independent experiments performed in MEF cells as described in Figure 4a. (b) Comparative analysis of the effect of oligo 4, VIC–oligo C and VIC–oligo 4 on the translation of the indicated mRNAs. Data are the mean ± SD from at least four independent experiments in MEF cells. (c) Effect of VIC–oligo 4 on the translation of poliovirus (PV) mRNA. HeLa cells were transfected with the indicated oligonucleotides, and infected 12 hr later with PV1 (Mahoney strain) at a multiplicity of infection (MOI) of 10 pfu/cell. The cultures were metabolically labeled with [35S]-Met at 6 hr post-infection and analyzed as described in the Materials and methods; SYPRO staining was included as the loading control.
Figure 5 with 2 supplements
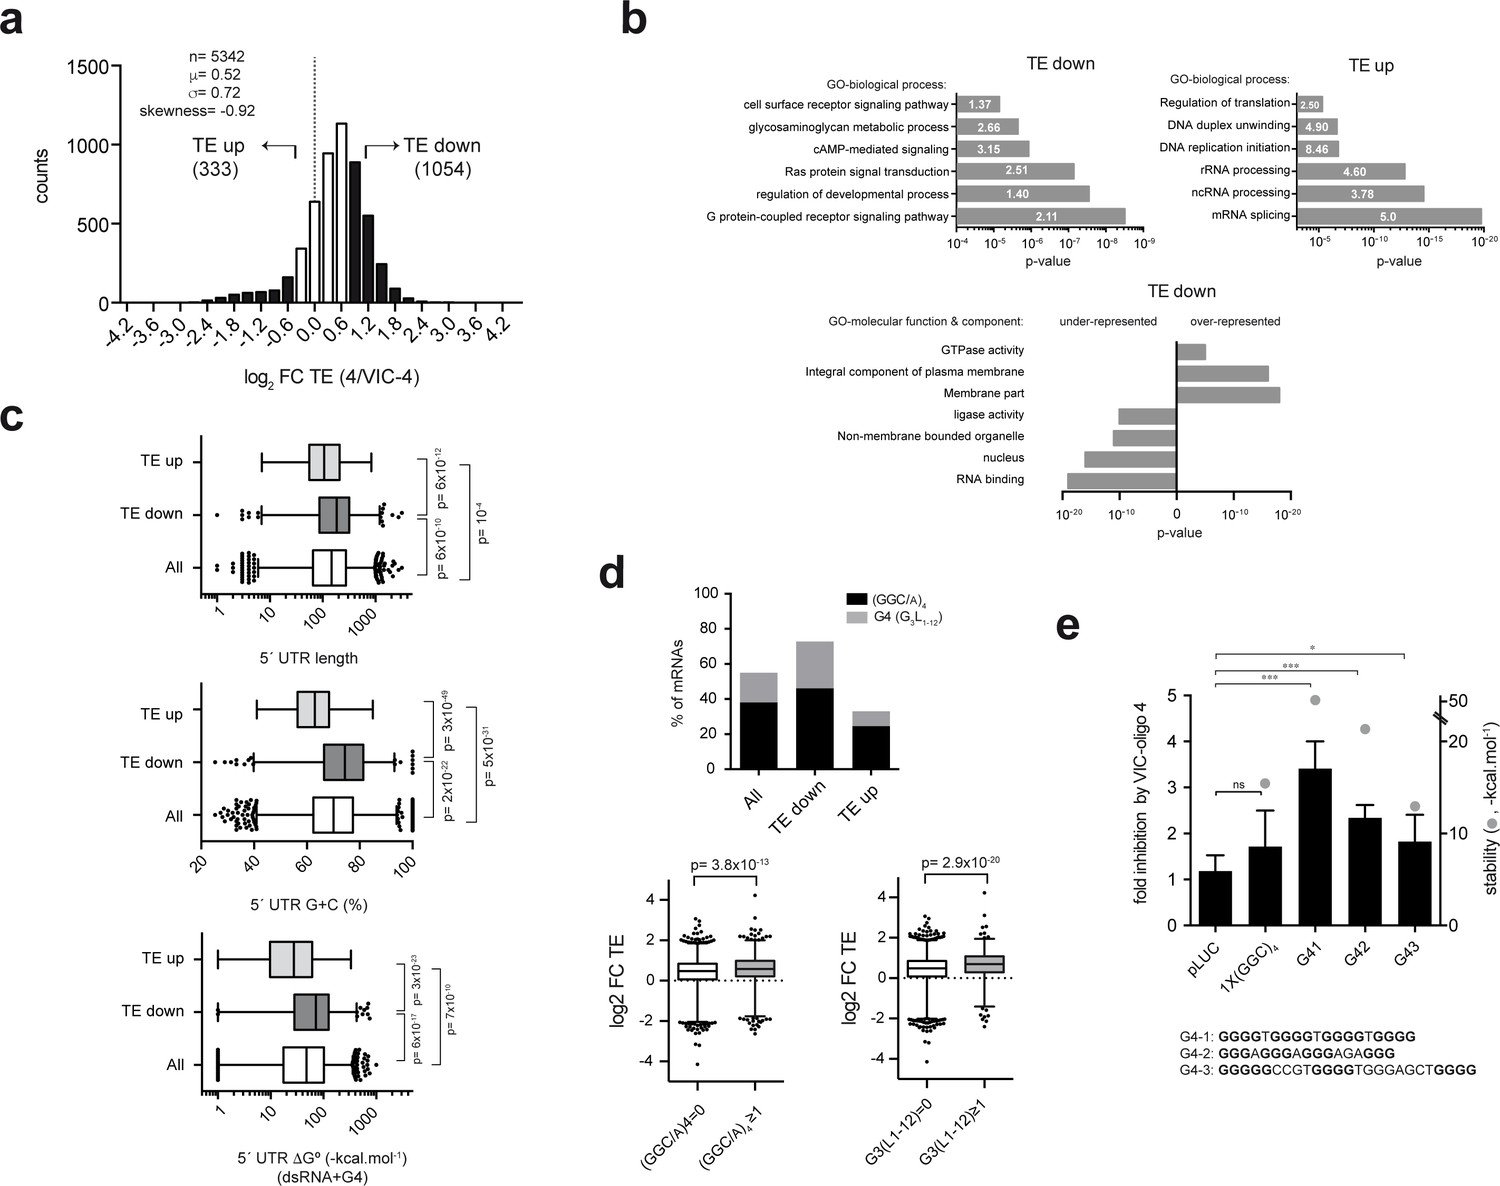
Genome-wide effect of ES6S blockage on translation.
(a) Distribution of translational changes induced by VIC–oligo 4 transfection of HEK293T cells. Only mRNAs showing a p-adj <0.05 between replicas were selected; data are expressed as log2 fold change (FC) of translation efficiency (TE) (4/VIC-4). The tails of the distribution with FC TE >1 (TE down) and FC TE <−0.7 (TE up) were selected for further analysis. (b) Gene ontology (GO) analysis of the ‘TE down’ and ‘TE up’ groups, showing the six terms (biological processes) with the highest significance (p-value) and fold-enrichment (numbers within the bars) (upper panels). The lower panel shows the differential enrichment of the 'TE down' group in terms of GO-molecular function and GO-molecular component. The under- and over-represented terms are shown. (c) Analysis of the 5′ UTR features of mRNAs in TE groups. The length, G+C composition and RNA structure content of 5′ UTRs were analyzed and compared among groups using the Mann-Whitney U test (p-values are shown). (d) Differential enrichment in the (GGC/A)4 and G4 (G3L1-12) motifs found in the 5′ UTR of ‘TE down’ mRNAs. Data represent the accumulated percentage of mRNAs that show at least one of the indicated motifs (left panel); p-value<10−5 after χ2 test. The lower panel shows a box plot of the log2 FC TE of mRNAs showing at least one (GGC/A)4 motif (left) or one G4 (G3L1-12) motif (right) compared with the corresponding subset of mRNA showing no motifs. The p-values generated by U tests are shown. (e) Effect of VIC–oligo 4 on the translation of Luc mRNAs bearing the indicated motifs in the 5′ UTR. Translations were carried out in RRL as described in the Materials and methods. Data represent the mean ± SD of six (pLuc and 1x(GGC)4) or three (G41, G42 and G43) independent experiments. The calculated stability of the motifs is shown as ΔG° (-kcal.mol−1, gray dots); the sequences of the G4 motifs are also indicated (bottom).
Figure 5—figure supplement 1
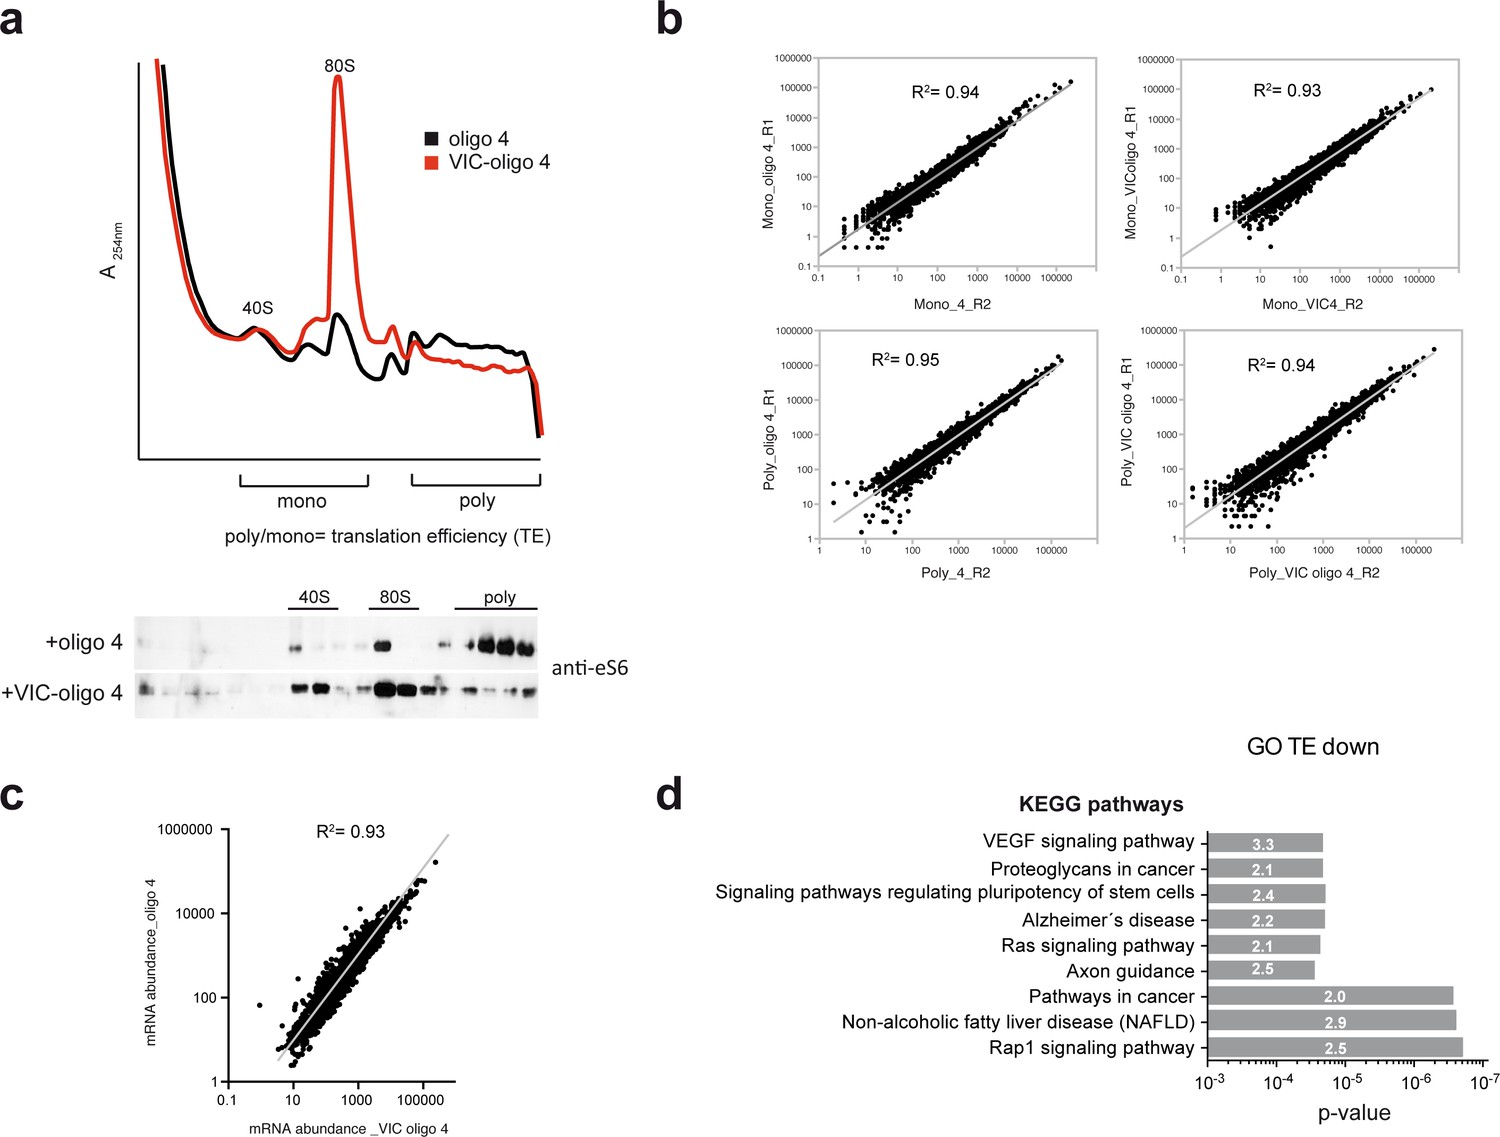
Quality and reproducibility of the experiment shown in Figure 5.
(a) Polysome profile of HEK293T cells transfected with the indicated oligonucleotides. This experiment corresponds to the replica_1 used for RNA-seq, indicating fractions pooled as monosomes or polysomes. The bottom panel shows a western blot analysis of the resulting fractions probed with anti-eS6 antibody. (b) Analysis of correlation between replicas using a normalized number of reads for every mRNA in the monosomal and polysomal samples. (c) Changes in mRNA abundance between oligo 4 and VIC–oligo-4-transfected cells. Data are the average from two replicates. (d) Enrichment in KEGG pathways detected in the ‘TE down’ group of mRNAs. The p-value and enrichment factor for each term are indicated.
Figure 5—figure supplement 2
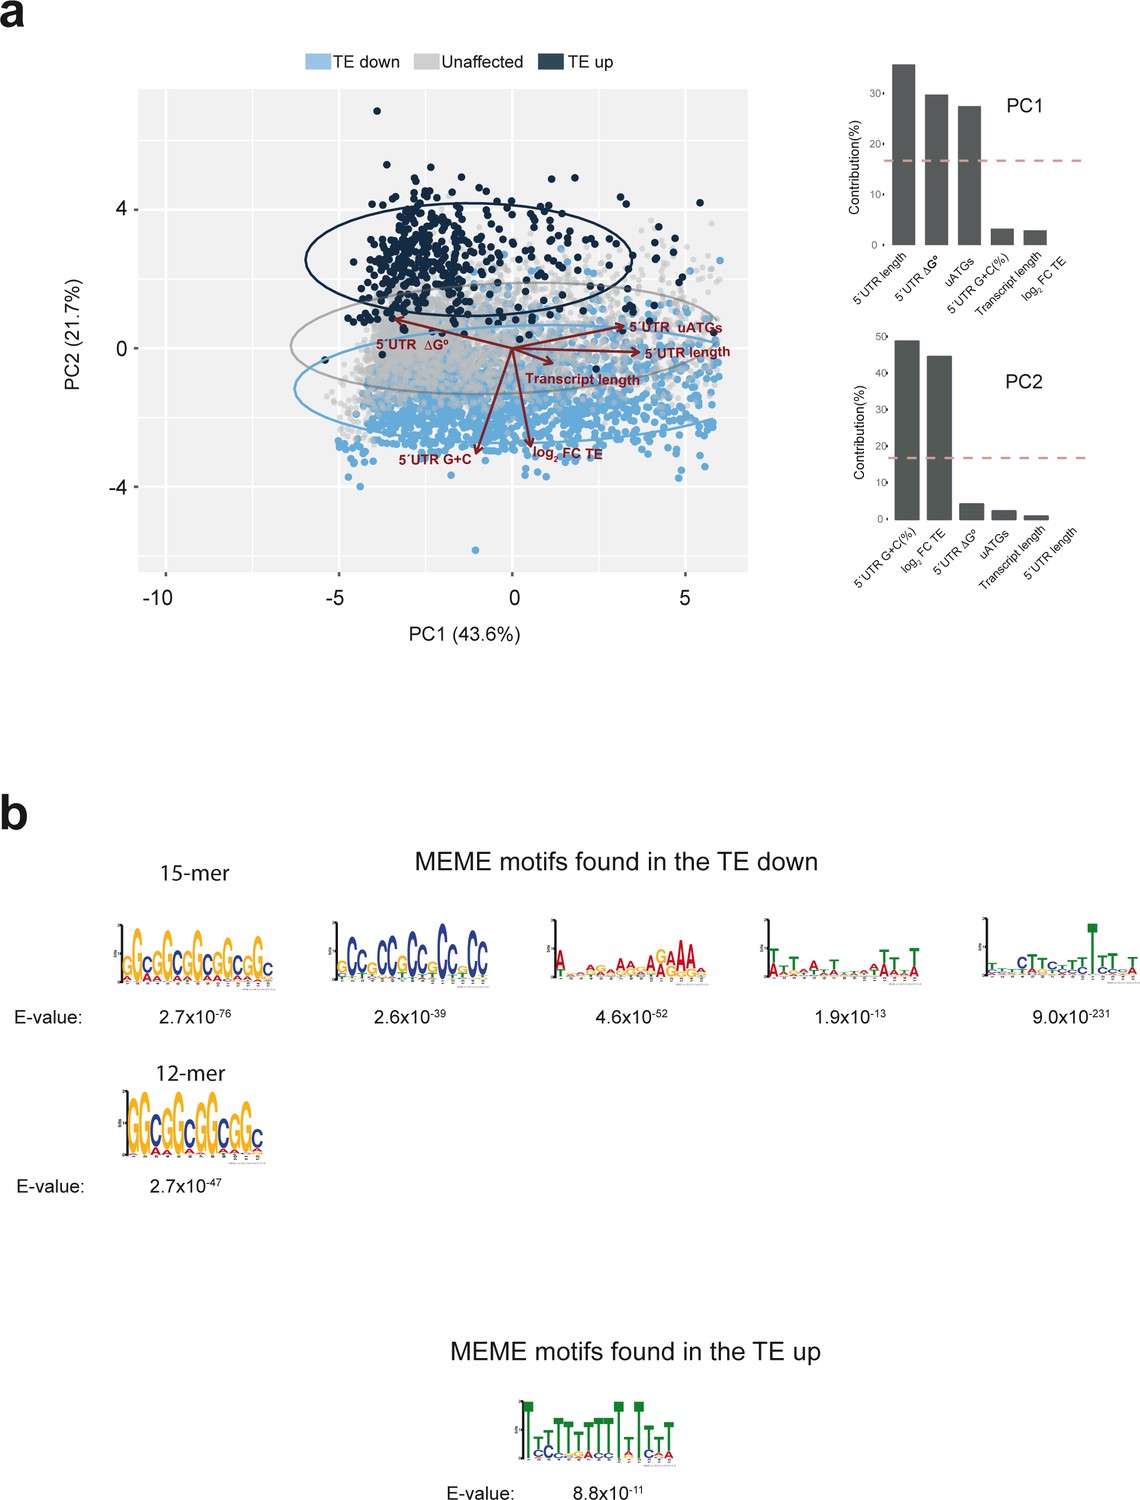
Further bioinformatic analysis of the data from experiment shown in Figure 5.
(a) Principal component analysis (PCA) of human mRNAs detected in our dataset using features describing transcript length, 5′ UTR length, 5′ UTR G+C(%), 5′ UTR ΔG°, 5′ UTR uATGs and the calculated log2FC TE. 'TE down', 'TE up' and unaffected mRNAs are in blue, black and gray, respectively. The contributions of the different variables to PC1 and PC2 are indicated. (b) Motifs found in the ‘TE down’ and ‘TE up’ groups of mRNAs using the MEME algorithm. E-values are indicated.
Figure 6 with 2 supplements
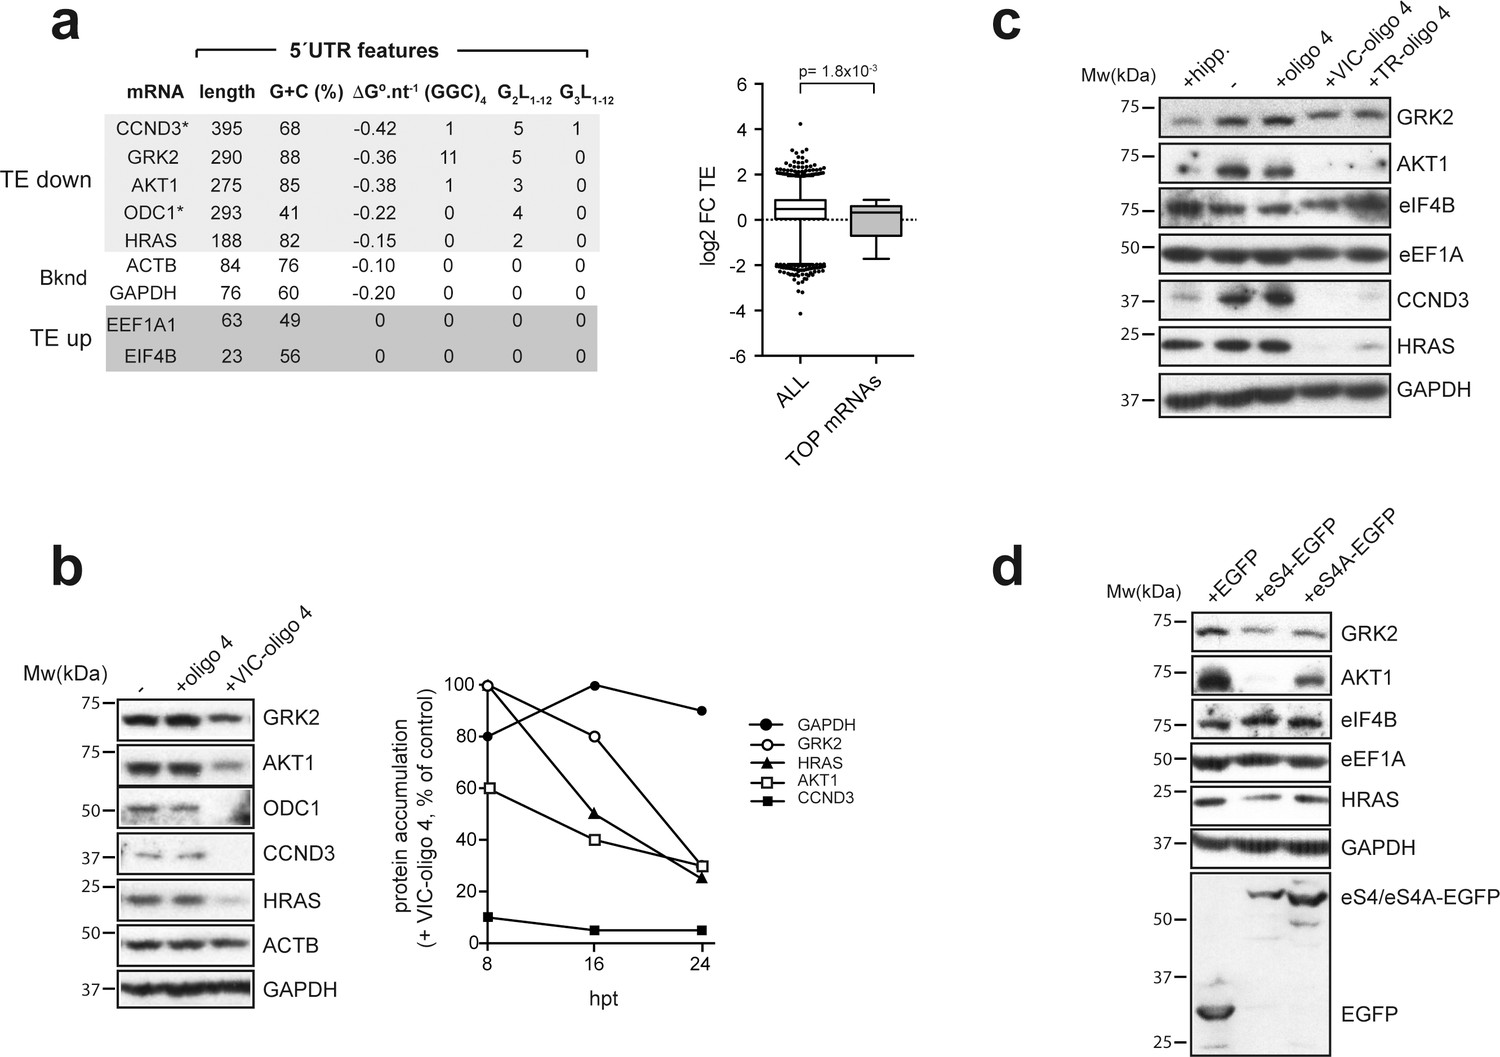
Effect of VIC–oligo 4 and TR–oligo 4 on the translation of mRNAs representative of the ‘TE down’ and ‘TE up’ groups.
(a) 5′ UTR features of the representative mRNAs selected for the analysis, with structure stability per nucleotide shown, as well as the presence of (GGC/A)4 and G4s (G2L1–12 and G3L1–12) (left panel). The right panel shows a comparative analysis of log2 FC TE between all mRNAs and those TOP mRNAs that we detected in our dataset (36). p-value after U test is shown. (b) (Left) Western blot of the accumulated proteins at 24 hr post-transfection (hpt) of the indicated oligos in HEK293T cells. (Right) Time course of protein accumulation at 8 hr, 16 hr and 24 hr post-transfection (hpt) of VIC–oligo 4, with data represented as percentage of the control values (+ oligo 4). (c) Comparative effect of hippuristanol (hipp), VIC–oligo 4 and TR–oligo 4 on the indicated protein levels. Data were analyzed by western blot at 24 hpt with the indicated oligonucleotides; hipp was used at 1 μM. (d) Effect of eS4–EGFP and eS4A–EGFP overexpression on the accumulation of some representative proteins. HEK293T cells were transfected with plasmids expressing the indicated proteins and cell extracts were analyzed by western blot at 48 hpt.
Figure 6—figure supplement 1
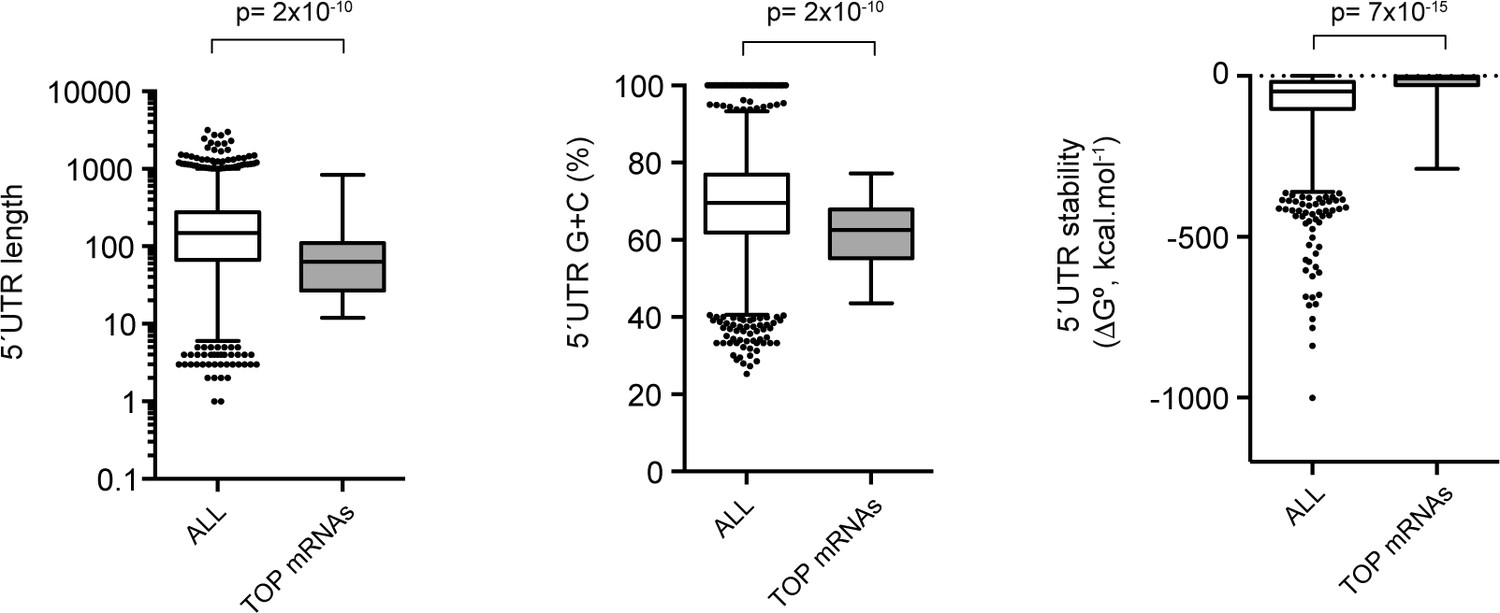
Comparative analysis of the 5′ UTR of TOP mRNAs detected in our dataset.
Of the list of 86 validated mRNAs with 5′ TOP elements, only 36 were detected in our dataset. 5′ UTR length and secondary structure content were compared with those of all mRNAs detected in our dataset. The p-values after U test are shown.
Figure 6—figure supplement 2
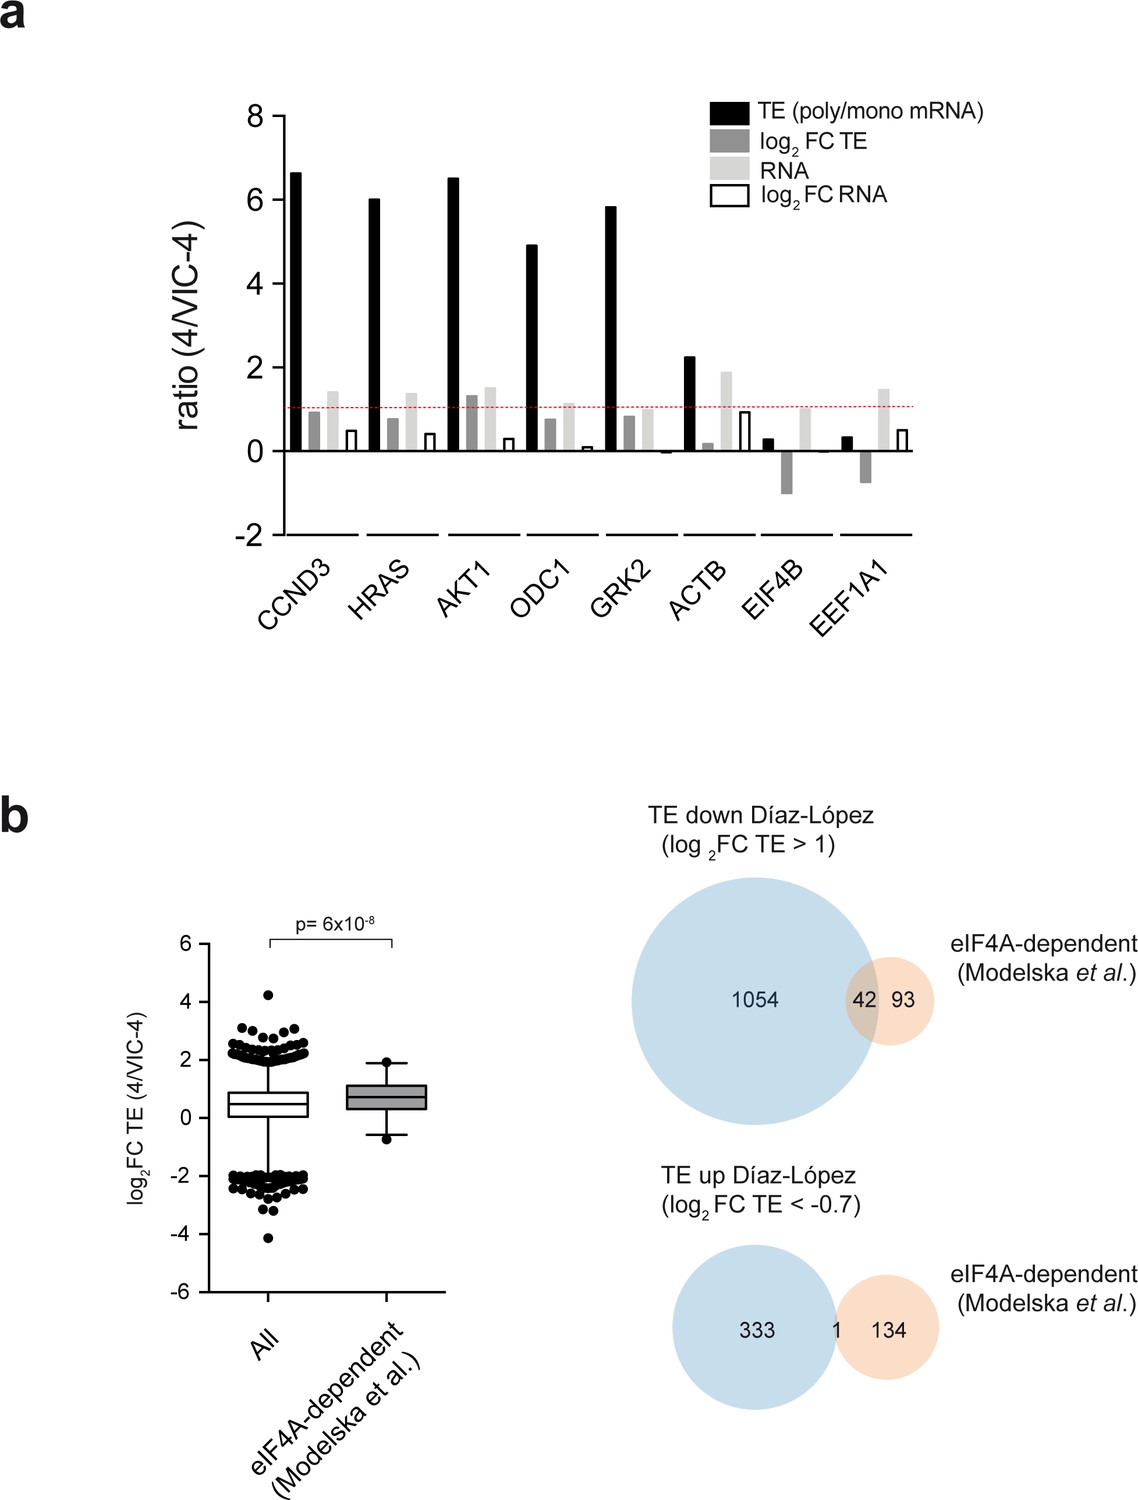
Raw and processed data for representative mRNAs and analysis of the functional overlapping between ES6S region and eIF4A.
(a) Data for representative mRNAs of the ‘TE down’ and ‘TE up’ groups extracted from the polysome profiling dataset. Log2 FC TE, log2 FC RNA and the unprocessed ratio of polysomal/monosomal mRNA and total mRNA are shown (TE). (b) (Left) The mRNAs reported to be susceptible to eIF4A downregulation (Modelska et al., 2015) were selected, and the corresponding log2 FC TE values for 135 of them were extracted from our dataset and compared with those of all of the mRNAs in our analysis. The p-value after U test is shown (left panel). (Right) Venn diagram showing the overlap between ES6S blockage (blue) and eIF4A silencing (orange). About half of the eIF4A-dependent mRNAs were also affected by ES6S blockage (Log2 FC TE > 1) (right panel).
Figure 7

mRNA threading into the ES6S region slows down scanning but makes it more processive.
(a) Effect of FITC-oligo 4 on the translation of Luc mRNAs with different 5′ UTRs in RRL. Translation mixtures were incubated for 90 min, which represented the endpoint measurement because no further increase in luc activity was detected. Data are represented as the mean ± SD from at least three independent experiments. (b) Luc activity accumulation in continuously recording experiments programmed with the indicated mRNAs. Measurements were taken every 3 min: gray line, no oligo; black line, +FITC–oligo 4. Hipp was added to the indicated samples at a concentration of 2 μM (dashed line). (c) Estimates of full translation time (FTT) for 5′ UTR G-less and 5′ UTR-SL20 mRNAs, and the effect of FITC–oligo 4 and hipp on FTT. Data from panel (B) were processed as described before (Vassilenko et al., 2011). The determined FTT values were: 5′ UTR G-less = 9.53 min; 5′ UTR G-less+FITC–oligo 4 = 7.89 min; 5′ UTR-SL20 = 17.57 min; 5′ UTR-SL20+FITC–oligo 4 = 17.56 min; 5′ UTR-SL20+hipp = 19.44 min. (d) Synergistic inhibitory effect of VIC–oligo 4 and hipp on translation of 5′UTR SL30-Luc and 5′ UTR G4-1-Luc mRNAs in RRL. Translation mixtures were preincubated with 6 μM of VIC–oligo 4 and with increasing concentrations of hipp for 5 min. Then, mRNAs were added and measurements were taken 90 min later; the calculated combination index (CI) for each mRNA is indicated.
Figure 8
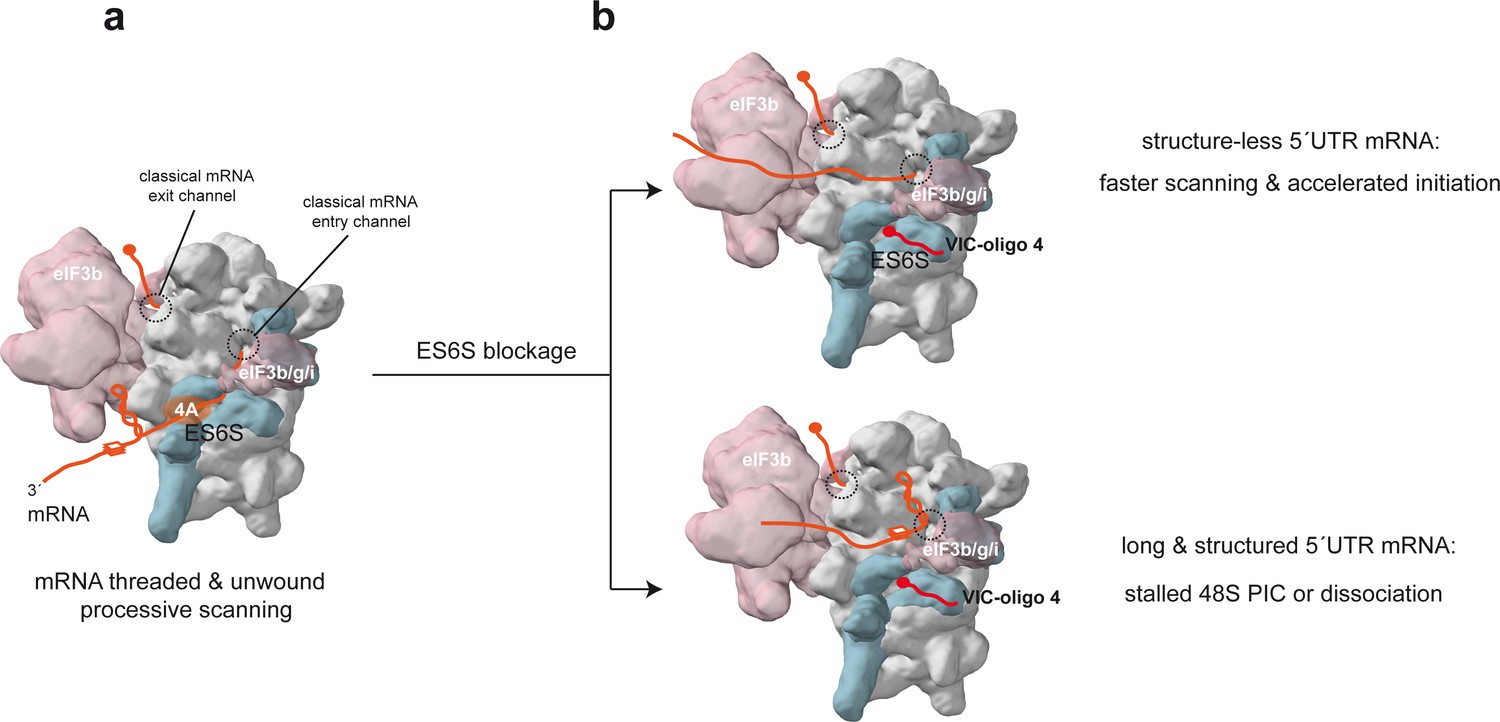
Model of the scanning 48S-PIC showing the path of mRNA through the ES6S region.
(a) Stem-loop (SL) and G4 (three layer square) represent elements of mRNA secondary structure; core eIF3 and some peripheral subunits (3b/3 g/3i) are shown. For simplicity, only the helicase component (eIF4A) of the eIF4F complex is shown. (b) Effect of ES6S blockage on mRNA threading. The model represents an extreme situation upon ES6S blockage that excludes mRNA from the ES6S region. For mRNAs with short and unstructured 5′ UTRs, bypassing the ES6S region could accelerate the scanning process (upper). For scanning-dependent mRNAs with long and structured 5′ UTRs, exclusion from the ES6S region would cause the stacking of secondary structural elements at the mRNA entry channel (shown), dissociation of the 48S-PIC, or even the aberrant threading of folded structures into the decoding groove (not shown).
Additional files
-
Supplementary file 1
Sequence and secondary structure of the 5′ UTRs used in study.
The predicted secondary structure (RNAfold) is depicted in dot-bracket notation. Stem-loops are marked in red together with the predicted stability (ΔG°). The predicted stability for the entire 5′ UTR is shown, including the correction for 5′ UTR length. For the 5′ UTR of luc mRNAs, shared sequences are in bold.
- https://cdn.elifesciences.org/articles/48246/elife-48246-supp1-v1.docx
-
Supplementary file 2
Table of primers.
The sequences of oligonucleotides used for blocking the ES6S region and for PCR amplification are shown.
- https://cdn.elifesciences.org/articles/48246/elife-48246-supp2-v1.docx
-
Transparent reporting form
- https://cdn.elifesciences.org/articles/48246/elife-48246-transrepform-v1.docx
Download links
A two-part list of links to download the article, or parts of the article, in various formats.
Downloads (link to download the article as PDF)
Open citations (links to open the citations from this article in various online reference manager services)
Cite this article (links to download the citations from this article in formats compatible with various reference manager tools)
An mRNA-binding channel in the ES6S region of the translation 48S-PIC promotes RNA unwinding and scanning
eLife 8:e48246.
https://doi.org/10.7554/eLife.48246


