Activity dynamics of amygdala GABAergic neurons during cataplexy of narcolepsy
- Medical University of South Carolina, United States
Figures
Figure 1
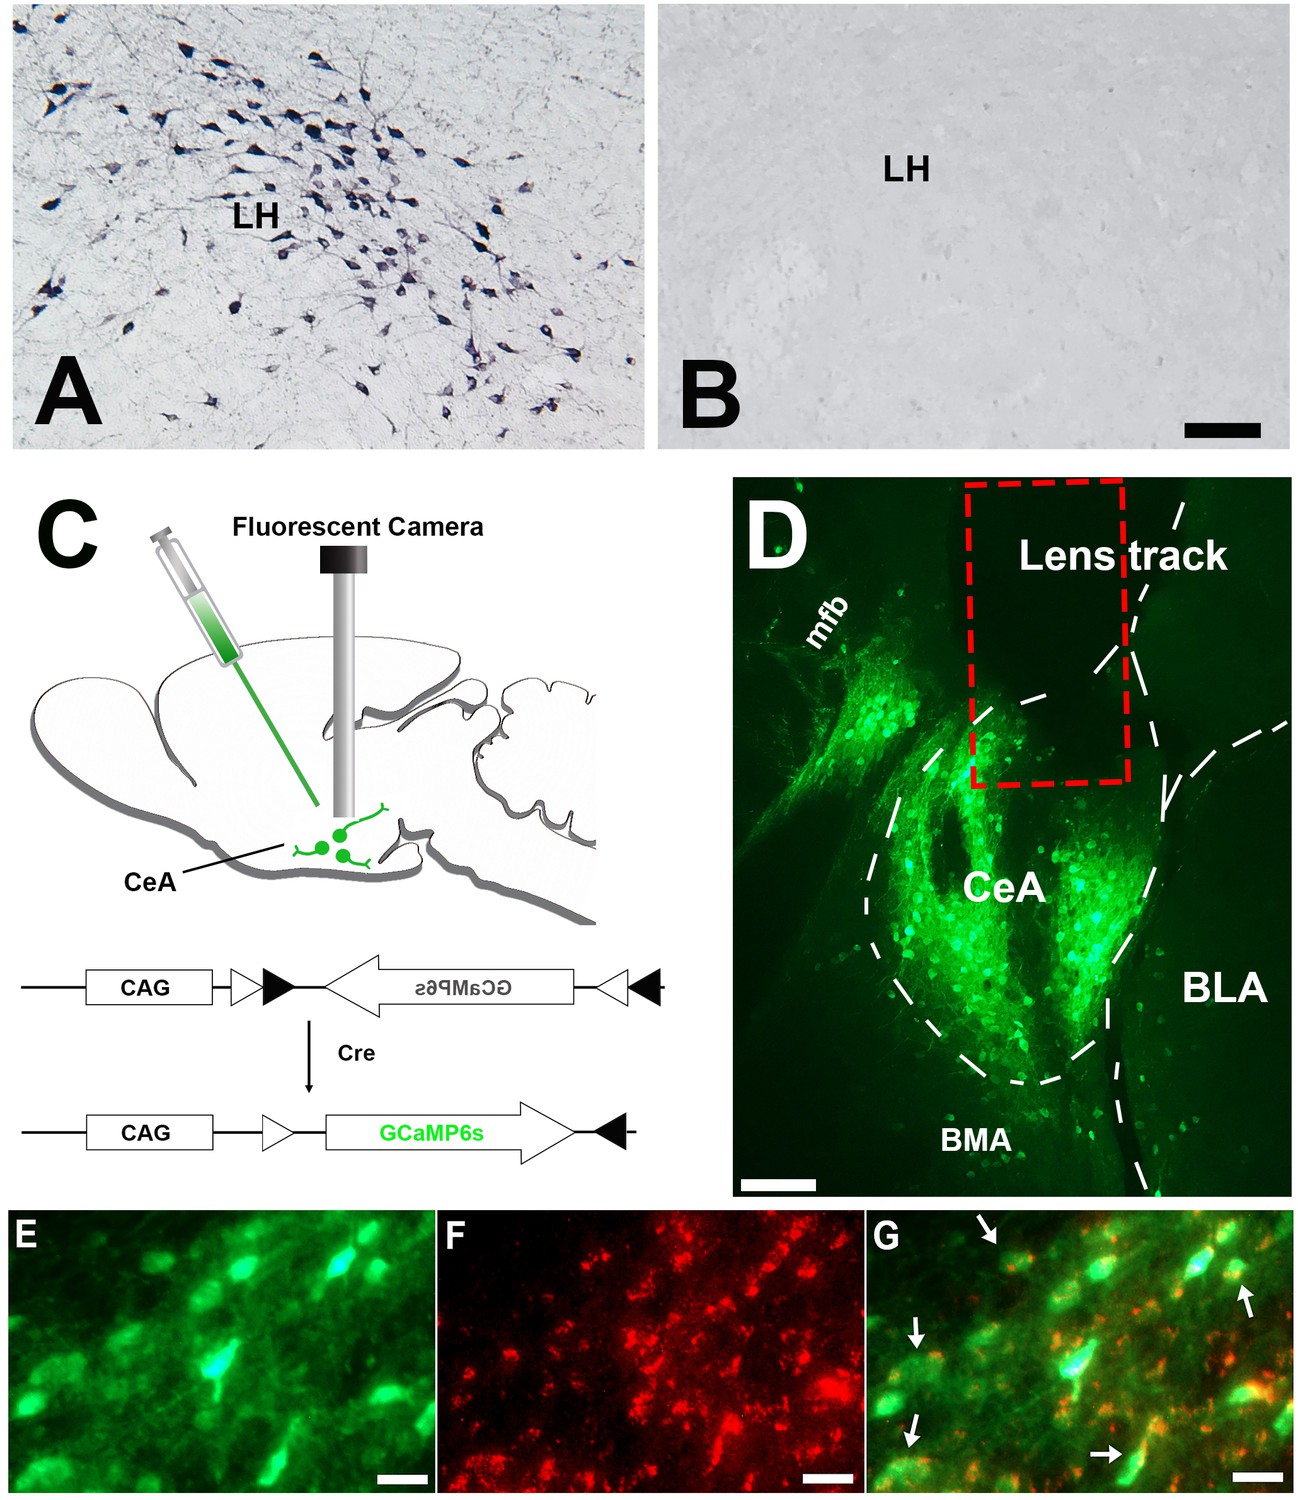
Histology results.
(A) Immunostaining demonstrating abundant orexin immunoreactive neurons and fibers in the LH of the control mice (n = 8). (B) orexin immunoreactive somata and fibers were utterly absent in LH of the narcoleptic VGAT-Cre mice, n = 10). (C) Illustration of vector injection and miniature camera installation. (D) Lens track and abundant GCaMP6 expression in CeA and adjacent areas. (E) GCaMP6 expression in neuronal somata and axons in CeA. (F) cytoplasm VGAT immunoreactivities in the same area as E. (G) Co-localization of GCaMP6 and VGAT. About 95% GCaMP6 expressing neurons in CeA also contain VGAT immunoreactivities (arrows point to some of the double-labeled neurons). CeA: the central nucleus of the amygdala. BLA: basolateral amygdala. BMA: basomedial amygdala. LH: lateral hypothalamus. mfb: medial forebrain bundle. Scale bars in A, D = 50 µm. Scale bar in E-G = 10 µm.
-
Figure 1—source data 1
Cell counts of neurons expressing GCaMP6 and VGAT in the amygdala of one set of coronal sections from the narcoleptic mice used for calcium data analysis (n = 5).
Percentages inside the parenthesis in column (A) were calculated as of total GCaMP6 expressing neurons in the amygdala structure. More than 80% of GCaMP6 expressing neurons were located in CeA. About 95% of them also contained VGAT. CeA: central nucleus of the amygdala, BLA: basolateral amygdala, BMA: basomedial amygdala.
- https://doi.org/10.7554/eLife.48311.003
Figure 2
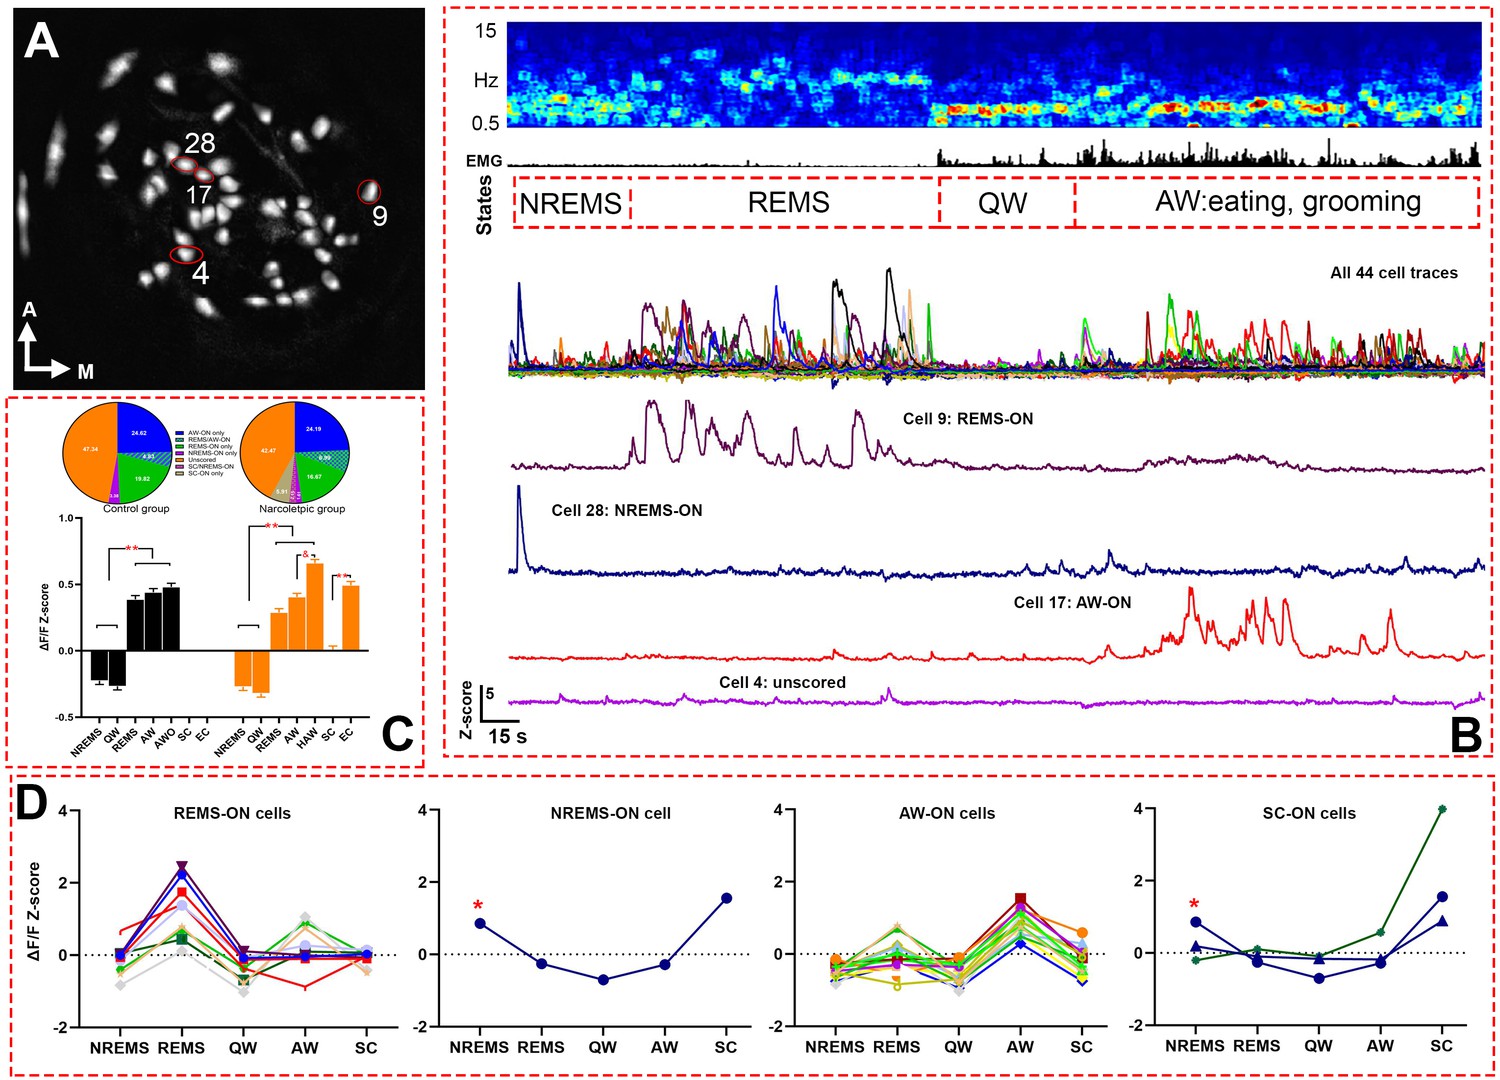
Live Ca2+ activity recording and cell classification.
(A) Map of 44 recorded cells from narcoleptic mouse LR02082418. (B) A serial figures showing (top to bottom) EEG spectrogram, EMG, brain states, cell traces of a total of 44 cells, cell traces of four example cells outlined in A. (C) bar graph (bottom) of Z-scores in each brain state and Bonferroni pairwise comparison results, and pie charts (top) of ON cell percentages in each brain states. **: p<0.001 compared to NREMS and QW in both groups, or SC in the narcoleptic group. and : p<0.001 compared to AW in the narcoleptic group. (D) Z-scores graphs of ‘ON’ cells in each brain state during undisturbed recording period in mouse LR02082418, including 10 REMS-ON, 1 NREMS-ON, 15 AW-ON, and 3 SC-ON cells. The only NREMS-ON cell (marked with *) was also one of the SC-ON neurons. AWO: active waking after odor exposure in control mice. HAW: hyperactive AW after odor exposure in the narcoleptic mice. SC: spontaneous cataplexy during undisturbed recording. EC: emotion-induced cataplexy during odor exposure.
-
Figure 2—source data 1
Z-score data for Figure 2, C and D.
- https://doi.org/10.7554/eLife.48311.005
Figure 3
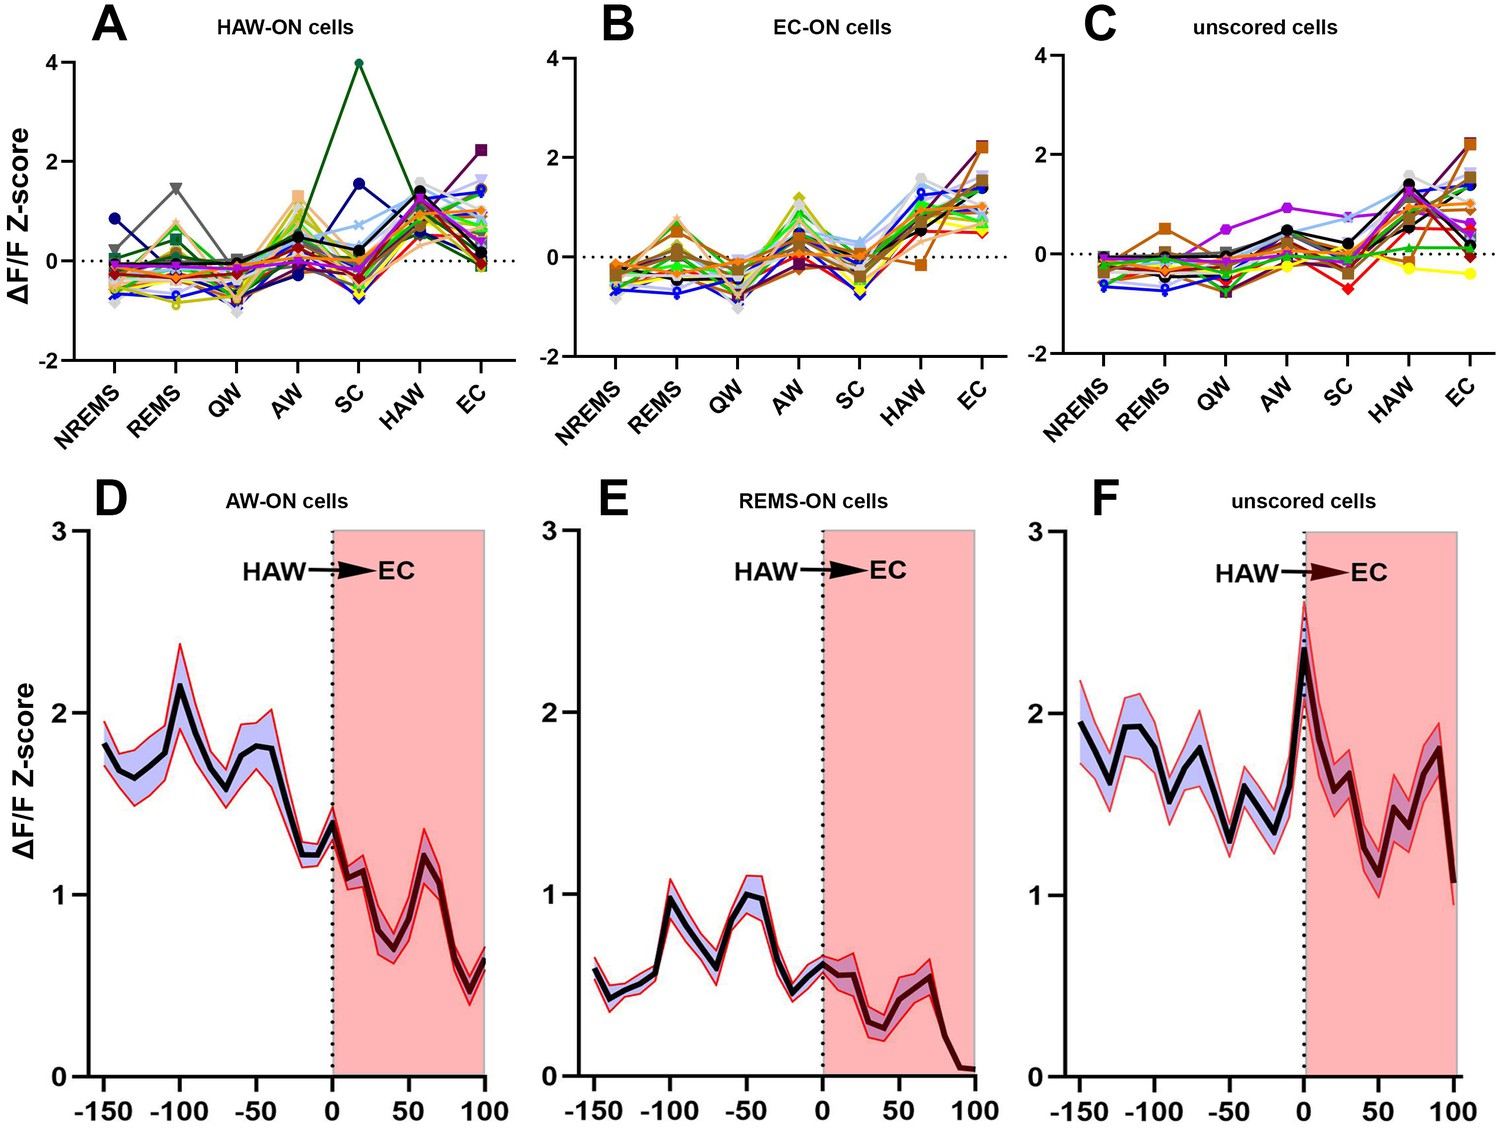
Activities of sorted neurons during sleep/wake cycle and cataplexy.
(A–C) Neuronal activity graphs of 28 HAW-ON cells, 19 EC-ON cells and 17 unscored cells in the narcoleptic mouse LR02082418. Most of the unscored cells displayed significantly elevated activities during HAW and EC (C). (D–F) average Z-score changes during HAW--EC transition from 112 HAW-ON cells, 44 REMS-ON cells, and 79 unscored cells in the narcoleptic group. The durations of cataplexy bouts were normalized as a percentage between 0–100. The average activity of HAW-ON cells stayed high upon odor exposure but gradually decreased during the transition into EC (D). Compared to the low activity of REMS-ON cells (E), unscored cells displayed stronger activation upon odor exposure and maintained the high activity level during EC (F).
-
Figure 3—source data 1
Z-score data for transition map.
- https://doi.org/10.7554/eLife.48311.007
Figure 4 with 1 supplement
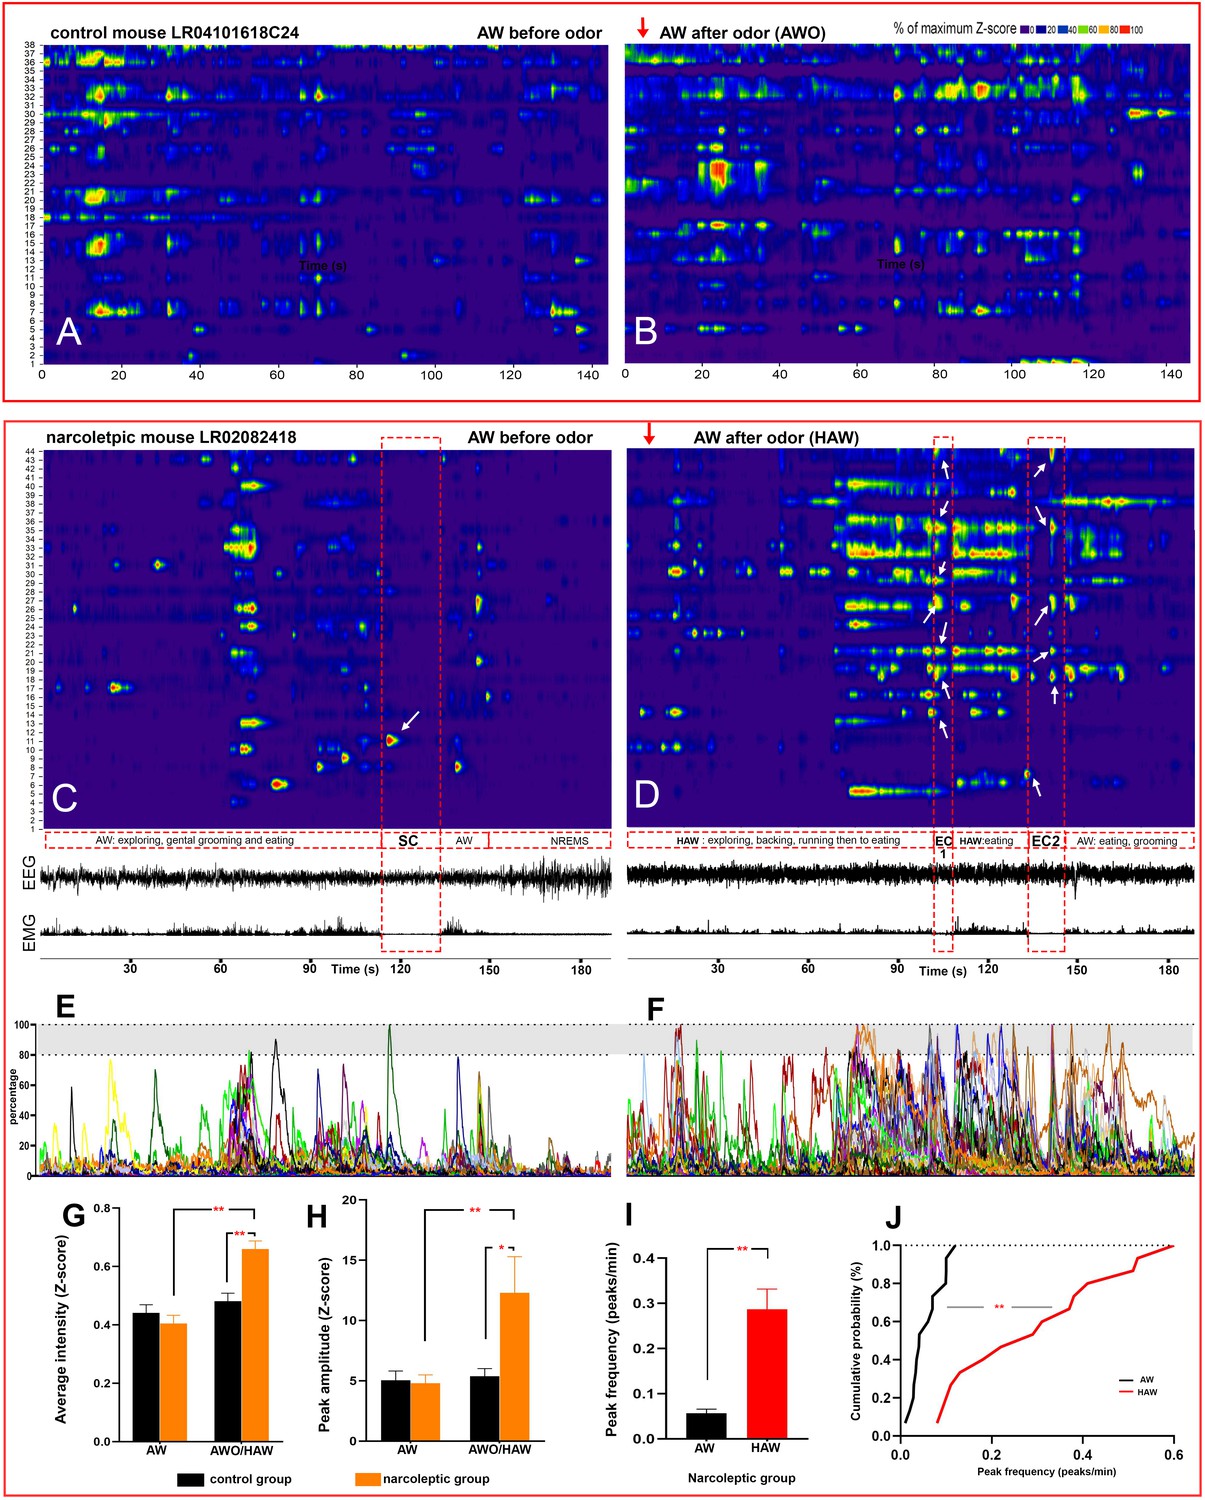
Hyperactivity of amygdala GABAergic neurons before and during emotion-induced cataplexy.
(A–D), heat maps of Ca2+ fluorescent intensity changes before and after coyote urine exposure (red arrows show the starting time of exposure) in control mouse LR04101618. (A and B) and narcoleptic mouse LR02082418 (C, D). The control mouse displayed moderate increases on activity (B) upon exposure to coyote urine. In contrast, the narcoleptic mouse showed dramatic activity changes, with significantly more neurons reaching their maximal activities during the first 3 min of exposure (D and F). A spontaneous cataplexy bout (SC) following a regular AW episode and an SC-ON cell (arrow in C) are shown in (C). Two emotion-induced cataplexy episodes (EC1 and EC2) closely following hyperactive AW (HAW) bouts induced by coyote urine are shown in (D), in which many EC-ON cells reached their maximal activities (arrows). (E, F): Graphs of the percentage to its maximal activity Z-score of each cell in (C) and (D), respectively. Prominent calcium transient peaks (examples are shown in the shadow areas of E and F) were selected for statistical analysis. Odor exposure significantly increased the average calcium signal intensity (G), peak amplitude (H), and peak frequency (I) in the narcoleptic group (*: p<0.05; **: p<0.001). (J): Cumulative probability function shows a significant shift toward a much higher peak frequency after coyote urine exposure in the narcoleptic mice (Matlab Kolmogorov-Smirnov Test: k = 0.73, p<0.001).
-
Figure 4—source data 1
Percentage source data for Figure 4 heat maps and graphs (A–D, I, J).
- https://doi.org/10.7554/eLife.48311.013
Figure 4—figure supplement 1

Calcium transient intensity ΔFF (Z-score) graphs (1-4) are incorporated into each heat maps in Figure 4, A-D, respectively, to demonstrate the dramatic intensity increase in the narcoleptic mice after coyote urine exposure.
Legend is the same as Figure 4.
Figure 5
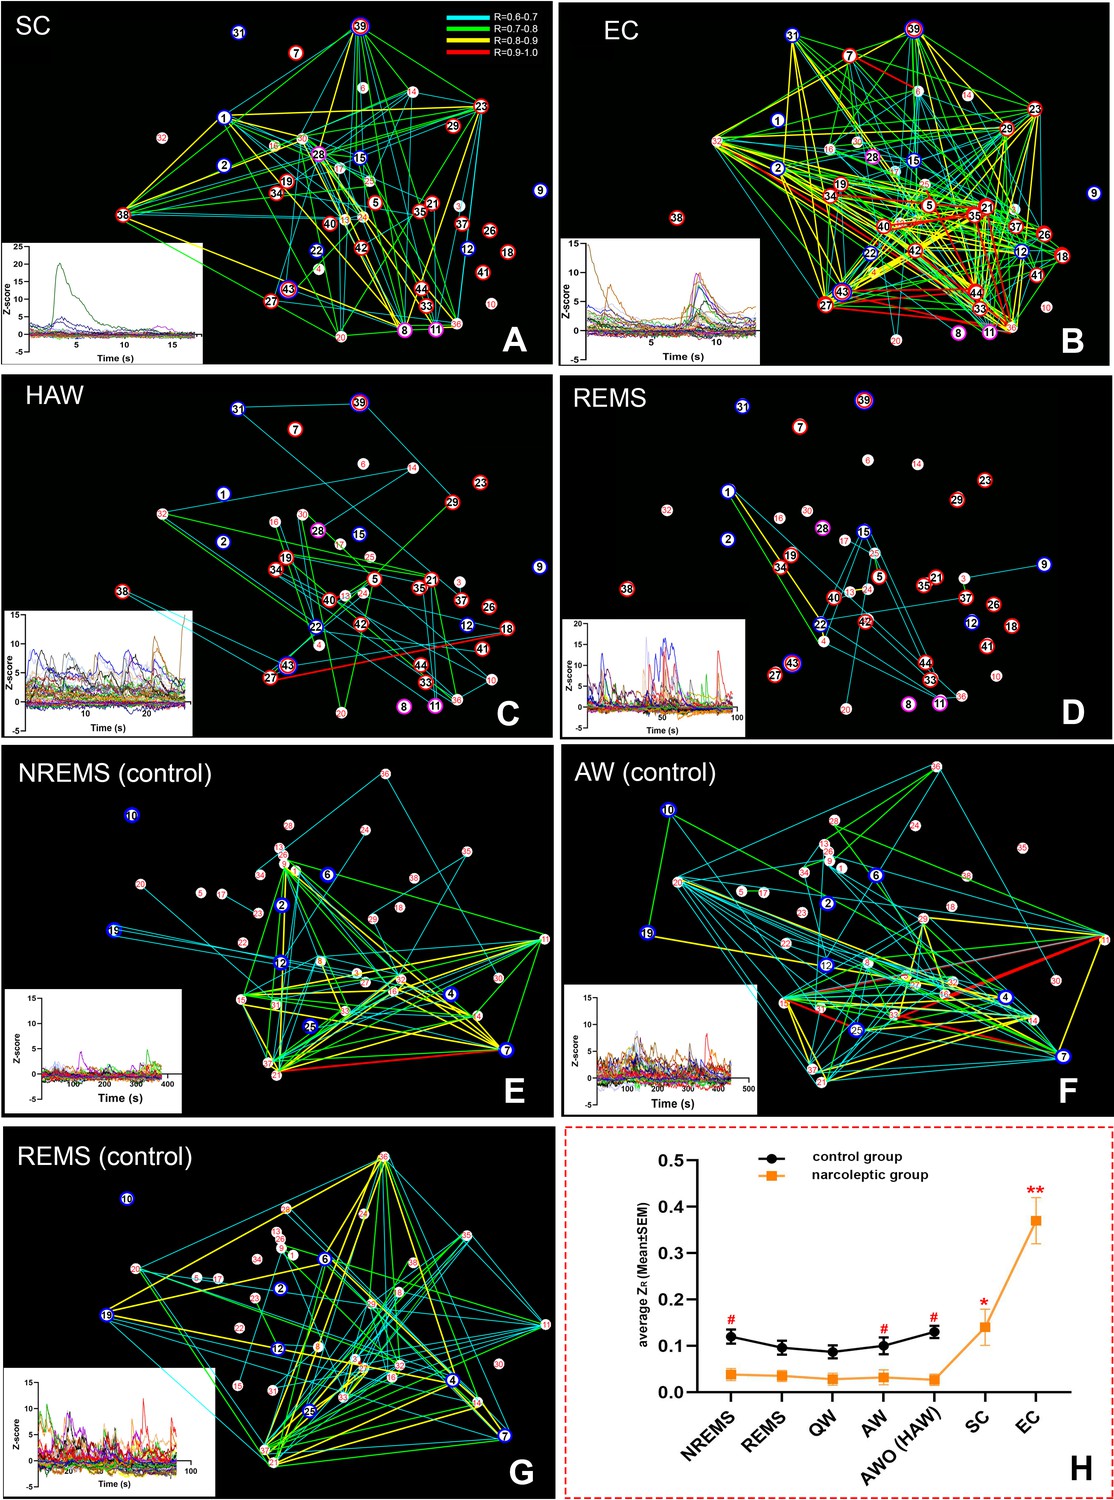
Spatial connectivity maps and graphs.
Colored lines represent a strong positive correlation R value between 0.6 (blue) to 1.0 (red). (A–D): correlation maps of an SC (A), EC (B), HAW (C) and REMS (D) bout from narcoleptic mouse LR02082418. (E–G): correlation maps of an NREMS (E), AW (before odor exposure, (F) and REMS (G) bout from control mouse LR04101618. Ca2+ signal intensity (ΔF/F Z-score) plots of corresponding brain states were placed on the bottom left of each panel. There were discernible dissociations between intensity (Z-score) and correlations R values. For instance, HAW bout in (C) had the highest Z-scores while had the least correlation lines, leaving many cells unconnected. (H): the summary of the average ZR (corrected R) trends of both groups during various brain states. Overall, narcoleptic mice had significantly lower ZR than the control group mice during undisturbed sleep/wake states. However, this low ZR status was abruptly reversed during cataplexy. ZR during SC was back to wild type level while ZR during EC went far higher than the wild type level. #: p<0.05 as compared to narcoleptic mice. *: p<0.01 as compared to other states of narcoleptic mice. **: p<0.001 as compared to other states of both groups. EC-ON, SC-ON and REMS-ON cells were circled red, purple and blue, respectively.
-
Figure 5—source data 1
source data for correlation maps and graph.
- https://doi.org/10.7554/eLife.48311.018
Figure 6
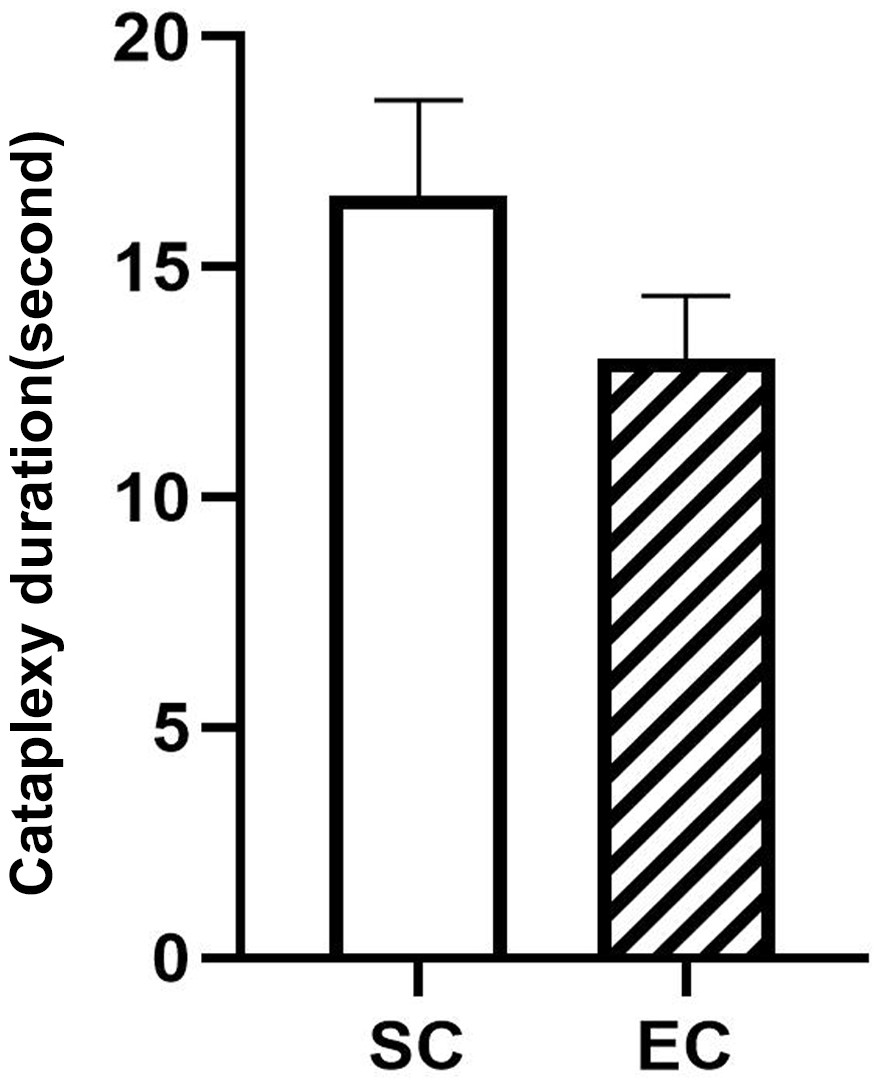
Durations of 10 spontaneous (SC) and 14 emotion-induced cataplexy (EC).
The duration difference between SC and EC are insignificant (F(1,22)=3.02, p=0.09).
-
Figure 6—source data 1
Source data for duration graph.
- https://doi.org/10.7554/eLife.48311.020
Videos
Video 1
A sample of raw calcium movies played at 64x speed.
https://doi.org/10.7554/eLife.48311.010
Video 2
Behaviors upon coyote urine exposure from a control mouse (Left) and a narcoleptic mouse (right).
https://doi.org/10.7554/eLife.48311.014
Video 3
Demonstrating the spontaneous cataplexy (SC) bout in Figure 4C, 8x speed.
https://doi.org/10.7554/eLife.48311.015
Video 4
Demonstrating the emotion-induced cataplexy (EC1) bout in Figure 4D, 8x speed.
https://doi.org/10.7554/eLife.48311.016Tables
Table 1
Number of recorded cells in each mouse.
https://doi.org/10.7554/eLife.48311.008| Mouse ID | Sex | Group | Numbers of cells |
|---|---|---|---|
| LR00062218 | Male | Narcoleptic | 27 |
| LR01062918 | Female | Narcoleptic | 35 |
| LR02082418 | Male | Narcoleptic | 44 |
| LR03091618 | Male | Narcoleptic | 42 |
| LR08012219 | Female | Narcoleptic | 38 |
| LR04101618 | Male | Control | 38 |
| LR12011419 | Male | Control | 28 |
| LR13022419 | Female | Control | 63 |
| LR14022819 | Female | Control | 35 |
| LR16031319 | Male | Control | 43 |
Table 2
components of HAW-ON and EC-ON neurons in the narcoleptic group.
https://doi.org/10.7554/eLife.48311.009| Unscored | AW-ON | REMS-ON REMS/AW-ON | NREMS-ON SC-ON | EC-ON | HAW-ON | |
|---|---|---|---|---|---|---|
| HAW-ON (112) | 50 (44.64%) | 40 (35.71%) | 13 (11.61%) | 8 (7.14%) | 63 (56.25%) | ------------ |
| EC-ON (74) | 40 (54.05%) | 17 (22.97%) | 17 (22.97%) | 0 | ------------ | 63 (85.14%) |
Key resources table
| Reagent type (species) or resource | Designation | Source or reference | Identifiers | Additional information |
|---|---|---|---|---|
| Genetic reagent (M. musculus) | VGAT-Cre | The Jackson laboratory | RRID: MGI:5141285 | PMID:21745644 |
| Genetic reagent (M. musculus) | Orexin KO | PMID:10481909 | RRID: IMSR_KOMP:VG11744-1.1-Vlcg | Dr. Masashi Yanagisawa (University of Texas) |
| Recombinant DNA reagent | AAV.Syn.Flex.GCaMP6s.WPRE.SV40 | http://www.addgene.org/100845/ | RRID:Addgene_100845 | PMID:23868258 Originally purchased from university of Pennsylvania gene therapy core |
| Antibody | anti-VGAT (Mouse monoclonal) | Synaptic System | Cat# 131011, RRID:AB_887872 | PMID:17444497 (1:500) |
| Antibody | anti-Orexin (Goat polyclonal) | Santa Cruz Biotechnology | Cat#: SC-8070, RRID:AB_653610 | PMID:16100511 (1:5000) |
| Software, algorithm | SPSS | IBM | RRID:SCR_002865 | |
| Software, algorithm | Matlab | MathWorks | RRID:SCR_001622 |
Additional files
-
Transparent reporting form
- https://doi.org/10.7554/eLife.48311.021
Download links
A two-part list of links to download the article, or parts of the article, in various formats.
Downloads (link to download the article as PDF)
Open citations (links to open the citations from this article in various online reference manager services)
Cite this article (links to download the citations from this article in formats compatible with various reference manager tools)
Activity dynamics of amygdala GABAergic neurons during cataplexy of narcolepsy
eLife 8:e48311.
https://doi.org/10.7554/eLife.48311


