RNA promotes phase separation of glycolysis enzymes into yeast G bodies in hypoxia
- Department of Biology, Johns Hopkins University, United States
- National Institute of Biological Sciences, China
- Department of Chemical Physiology, The Scripps Research Institute, United States
- Department of Biophysics, Johns Hopkins University, United States
Figures
Figure 1 with 1 supplement
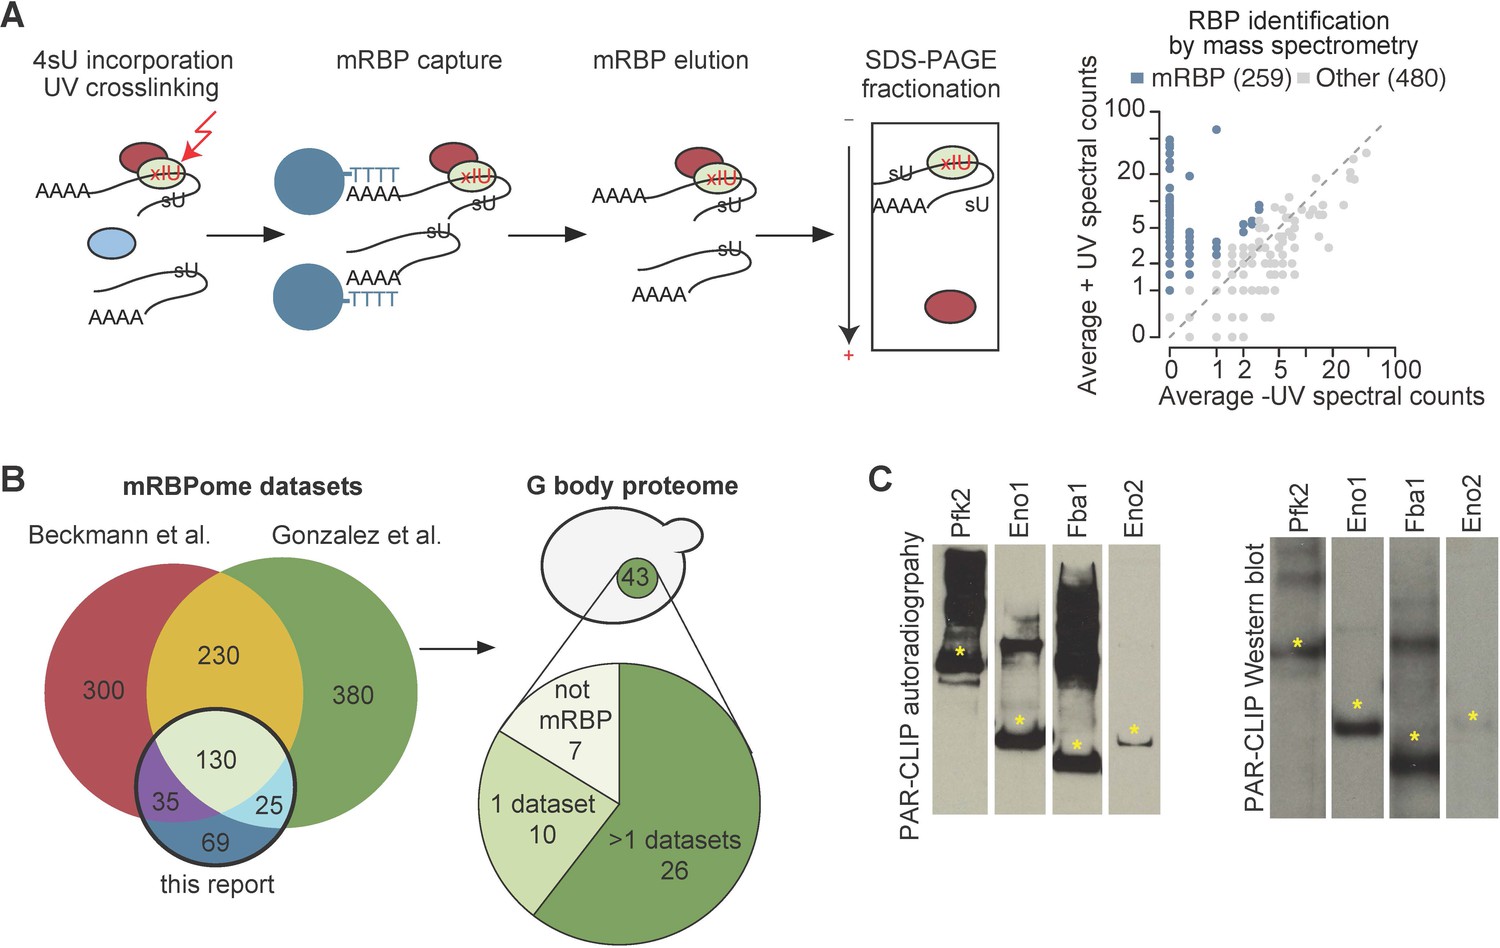
G bodies are enriched for RNA-binding proteins.
(A) Photoactivatable-ribonucleoside-enhanced cross-linking with oligo(dT) affinity purification and tandem mass spectrometry (PAR-CL-MS) pipeline. Briefly, 4-thiouridine (4SU) is incorporated by supplementation in media and crosslinked to protein with 365 nm UV light. mRBPs are captured with oligo-d(T) beads and eluted. RNPs are fractionated by SDS-PAGE and resulting proteins are analyzed by proteomic mass spectrometry. Average mass spectrometry spectral peak counts from biological replicate PAR-CL-MS versus non-UV-treated control. Proteins enriched in PAR-CL-MS (blue dots) had either (1)>2 spectral counts in PAR-CL and 0 spectral counts in -UV control or (2) had FDR < 10% as calculated by QSPEC (Choi et al., 2008). (B) Overlap of identified mRBPs with datasets generated with similar methodology. mRBP datasets are from Matia-González et al. (2015) and Beckmann et al., 2015. Distribution of G body proteome (union of colocalization validated G-body proteins from Jin et al., 2017 and Miura et al., 2013. (C) Autoradiography and western blot of PAR-CLIP of TAP-tagged proteins (Pfk2, Eno1, Eno2, and Fba1). Stars indicate the same band in autoradiography and western blot confirming RNA binding by each indicated protein.
Figure 1—figure supplement 1
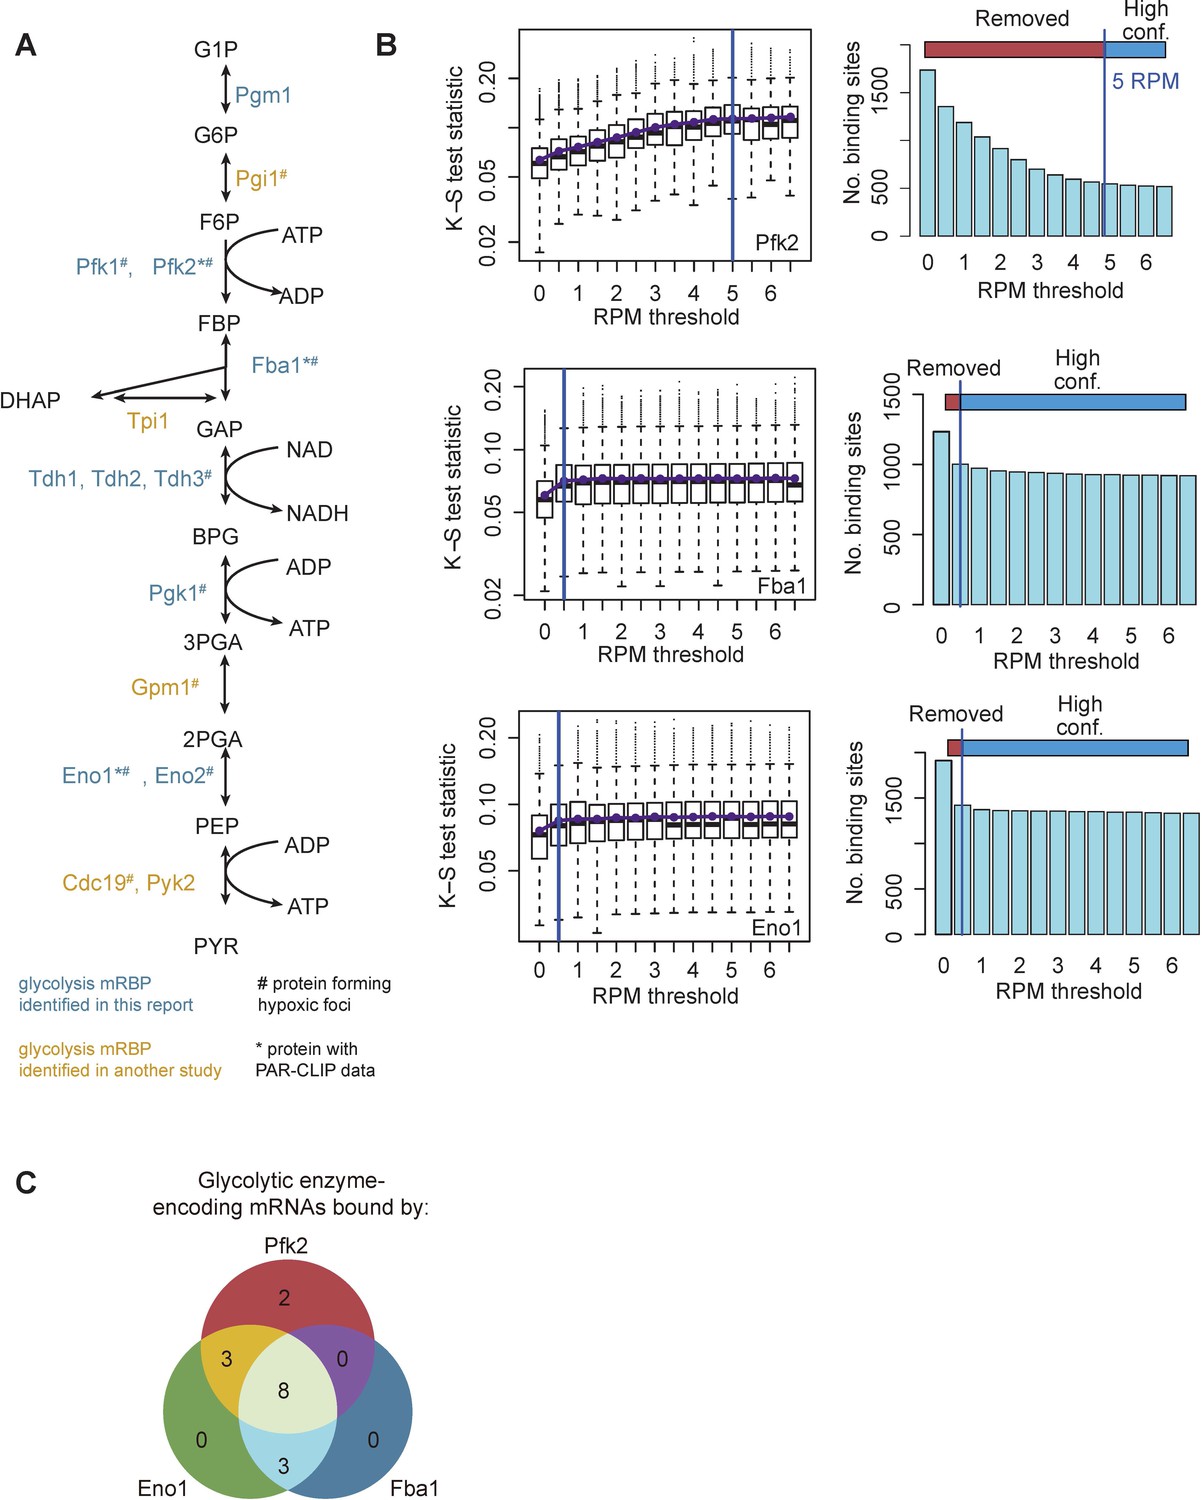
Identification of glycolysis enzyme binding sites.
(A) Glycolytic enzymes indicated in blue were identified in the dataset in this report among yeast mRBPs. Glycolytic enzymes indicated in yellow were identified in Beckmann et al. (2015) and/or Castello et al. (2012). # indicates glycolysis enzymes with observed punctate localization in hypoxia (Jin et al., 2017; Miura et al., 2013). * Indicates PAR-CLIP analysis of proteins appearing in this report. (B) Empirical determination of high-confidence RPM thresholds of 5 RPM for Pfk2 binding sites from PAR-CLIP-seq. Thresholds of 0.5 RPM were determined for sites bound by Eno1 and Fba1. (C) Sixteen glycolysis enzyme-encoding mRNAs are bound by Pfk2, Eno1, and/or Fba1.
-
Figure 1—figure supplement 1—source data 1
Source data for Figure 1—figure supplement 1E.
- https://cdn.elifesciences.org/articles/48480/elife-48480-fig1-figsupp1-data1-v1.xlsx
Figure 2 with 1 supplement

Glycolysis enzymes bind similar RNAs.
(A) Overlap of mRNAs bound by Pfk2, Eno1, and Fba1 as identified by PAR-CLIP-seq in normoxic conditions. (B) Gene ontology (GO) terms enriched among transcripts containing high-confidence Pfk2, Eno1 and Fba1 sites include glycolysis. Fisher’s exact test p-values are plotted. (C) Percent of total Pfk2, Eno1, and Fba1 PAR-CLIP-seq reads per million mapped reads (RPM), aligning with the indicated genic regions. (D) Identified sequence motifs among Pfk2, Eno1, and Fba1 binding sites. (E) Percent of binding sites for each PAR-CLIP-seq dataset that are bound by more than one glycolysis enzyme (identical sites), overlap a binding site of another glycolysis enzyme (overlapping sites), or are bound by only one glycolysis enzymes (unique sites) (F) (Top) Binding sites present in multiple datasets or overlapping other binding sites tend to have greater read depth. Boxplot of log10 (Binding Site RPM) for each class of binding site. p-values represent unpaired student’s T Tests. (Bottom) Glycolysis enzymes tend to bind tighter to unique sites. Boxplot of log10 ratio of binding site RPM to gene RPKM from mRNA seq. p-values represent unpaired student’s T tests. *p<10−5. **p<10−7. ***p<10−9. ****p<10−20.
Figure 2—figure supplement 1
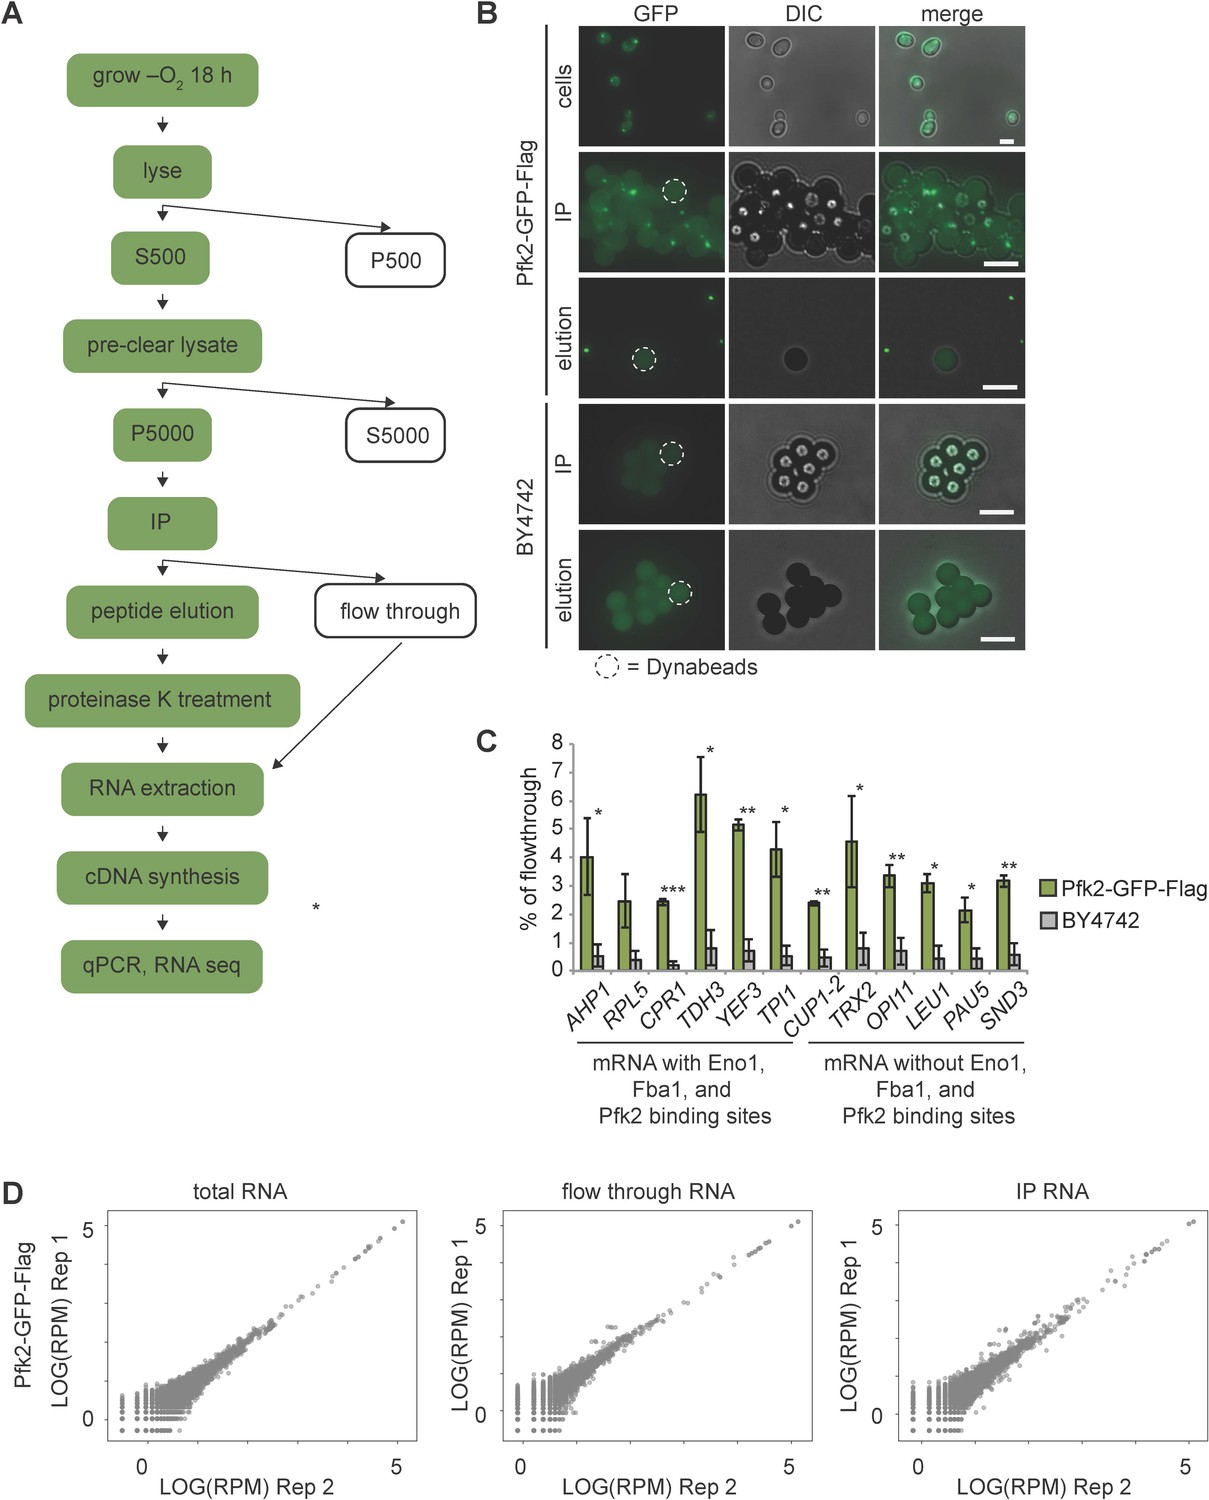
G bodies co-purify with RNA.
(A) Schematic of G body RIP purification. Green colored steps indicate presence of G bodies. (B) Images from various steps of purification. Cells expressing Pfk2-GFP-Flag form G bodies. In immunoprecipitations with Pfk2-GFP-Flag, large foci (small brightly fluorescent structures) are present on the surface of Dynabeads (large weakly fluorescent structures), while there are no foci in immunoprecipitations of BY4742 lysates. Elution with Flag peptide releases foci from the surface of Dynabeads, allowing recovery of G bodies. Dotted outline represents an example of a Dynabead in each image with Dynabeads. All scale bars are 5 µm (C) qPCR of 12 mRNAs. Mean and standard deviation of percent of flow through RNA in G body RIPs or control RIPs is plotted for three biological replicates. AHP1, RPL5, CPR1, TDH3, YEF3 and TPI1 mRNAs have binding sites for glycolysis enzymes identified by PAR-CLIP. CUP1-2, TRX2, OPI11, LEU1, PAU5 and SND3 do not. (D) Correlation plots for each set of replicates sequenced for G body RIPs.
-
Figure 2—figure supplement 1—source data 1
Source data for Figure 2—figure supplement 1C.
- https://cdn.elifesciences.org/articles/48480/elife-48480-fig2-figsupp1-data1-v1.xlsx
Figure 3 with 1 supplement

G body associated RNAs overlap with RNAs bound by glycolysis enzymes in normoxia.
(A) Volcano plot of RNAs enriched in G body RIPs over flow through RNAs. (B) Volcano plot of RNAs comparing G body RIPs and total RNA. (A–B) RNAs highlighted in green represent RNAs > 2 fold enriched over flow through with p<0.05 (T Test), n = 297. (C) Overlap of enriched RNAs with RNAs identified by PAR-CLIP binding to Eno1, Fba1 or Pfk2. Enriched RNAs are >2 fold enriched in RPM in G body RIPs with p<0.05 (T Test) comparing to indicated datasets. (D) Bar graph of % of genes mRNAs with normoxic binding sites for Eno1, Fba1 or Pfk2. P-value is Chi squared test. (E) smFISH representative images of Pfk2-GFP, Fba1-GFP and Eno2-GFP colocalization with FAS1 mRNA. Scale bar is 5 µm. (Bottom) Schematic of distance measurement to determine colocalization. Shortest distance from G body center to mRNA was measured. (F) Percent of mRNAs in a single Z slice within one pixel of the G body center determined by Eno2-GFP, Fba1-GFP or Pfk2-GFP plotted against log10 enrichment in G body RIP-seq over total RNA. Average and standard deviation of two biological replicates plotted. (G) Fold change of cumulative distribution of distances from G body center for each mRNA tested over OLE1 mRNA. n = 3773 CDC19, 3781 FAS1, 3532 UTH1, 3036 YML133C and 5159 OLE1 mRNAs.
-
Figure 3—source data 1
Source data for Figure 3C,D.
- https://cdn.elifesciences.org/articles/48480/elife-48480-fig3-data1-v1.xlsx
-
Figure 3—source data 2
Source data for Figure 3F.
- https://cdn.elifesciences.org/articles/48480/elife-48480-fig3-data2-v1.xlsx
-
Figure 3—source data 3
Source data for Figure 3G.
- https://cdn.elifesciences.org/articles/48480/elife-48480-fig3-data3-v1.xlsx
Figure 3—figure supplement 1
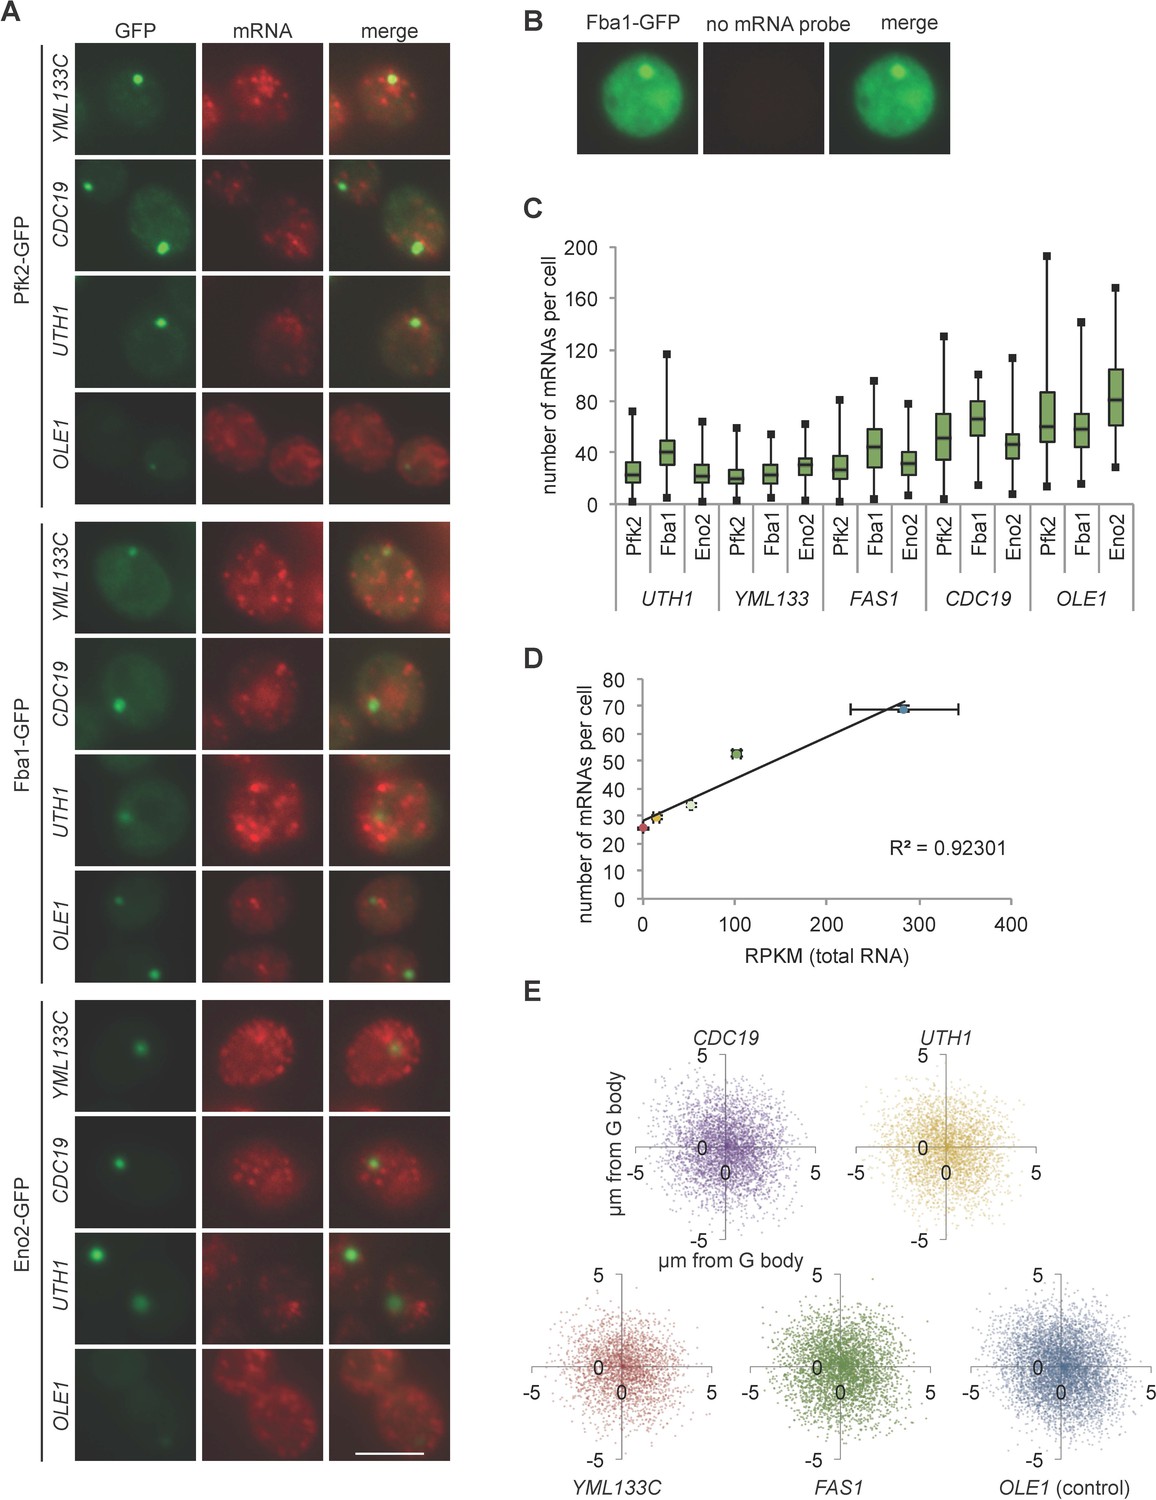
Validation of smFISH colocalization with G body markers.
(A) Representative images of colocalization of G body markers (GFP) with mRNAs (UTH1, CDC19, OLE1, and YML133C). (B) Representative image of smFISH protocol with no probe included. (C) Box plots of mRNAs detected per cell with each GFP tagged protein. (D) Relationship of log(RPKM) for each mRNA imaged by smFISH against average number of mRNAs per cell. Error bars represent standard error of the mean of two biological replicates. (E) Position relative G body center is plotted for each mRNA. Each point represents one mRNA and its X,Y distance from G body center. Data represents the aggregate of experiments with Eno2-GFP, Pfk2-GFP and Fba1-GFP. n = 3773, 3781, 3532, 3036, and 5159 mRNAs for CDC19, FAS1, UTH1, YML133C, and OLE1 respectively. All scale bars are 5 µm.
-
Figure 3—figure supplement 1—source data 1
Source data for Figure 3—figure supplement 1C.
- https://cdn.elifesciences.org/articles/48480/elife-48480-fig3-figsupp1-data1-v1.xlsx
-
Figure 3—figure supplement 1—source data 2
Source data for Figure 3—figure supplement 1D.
- https://cdn.elifesciences.org/articles/48480/elife-48480-fig3-figsupp1-data2-v1.xlsx
-
Figure 3—figure supplement 1—source data 3
Source data for Figure 3—figure supplement 1E.
- https://cdn.elifesciences.org/articles/48480/elife-48480-fig3-figsupp1-data3-v1.xlsx
Figure 4 with 3 supplements

Tethering Pfk2 to an RNase prevents G-body formation.
(A) Schematic of Pfk2-MqsR constructs. All constructs were expressed from a centromeric plasmid under control of the CuSO4-inducible CUP1 promoter. (B) (Left) Representative images of hypoxic Pfk2-GFP localization with increasing concentrations of CuSO4 for cells expressing a vector control or cells expressing Pfk2-MqsR-Flag. (Right) Quantification of G body formation in cells with varying CuSO4 concentrations. (C) (Left) Representative images of hypoxic Pfk2-GFP localization comparing cells with a vector control, Pfk2-MqsR-Fl, or Pfk2-MqsR-Fl-MqsA with 50 µM CuSO4. (Right) Quantification of G body formation for cells with each plasmid with 0 and 50 µM CuSO4. (D) (Left) Representative images of hypoxic Pfk2-GFP localization at 50 µM CuSO4. (Right) Quantification of G body formation for cells with each plasmid with 0 and 50 µM CuSO4. (E) Schematic summary of results of G body formation with either a vector plasmid or plasmids expressing either MqsR-Flag, Pfk2-MqsR-Flag, or Pfk2-MqsR-Flag-MqsA. All scale bars are 5 µM. For each graph, data represent mean and standard deviation of three to four individual experiments (n > 100 cells per replicate per condition). Arrows indicate G bodies. Statistics were analyzed by unpaired student’s T tests with a Bonferroni correction for multiple testing. *p<0.05. **p<0.01. ***p<0.001.
-
Figure 4—source data 1
Source data for Figure 4B.
- https://cdn.elifesciences.org/articles/48480/elife-48480-fig4-data1-v1.xlsx
-
Figure 4—source data 2
Source data for Figure 4C.
- https://cdn.elifesciences.org/articles/48480/elife-48480-fig4-data2-v1.xlsx
-
Figure 4—source data 3
Source data for Figure 4D.
- https://cdn.elifesciences.org/articles/48480/elife-48480-fig4-data3-v1.xlsx
Figure 4—figure supplement 1
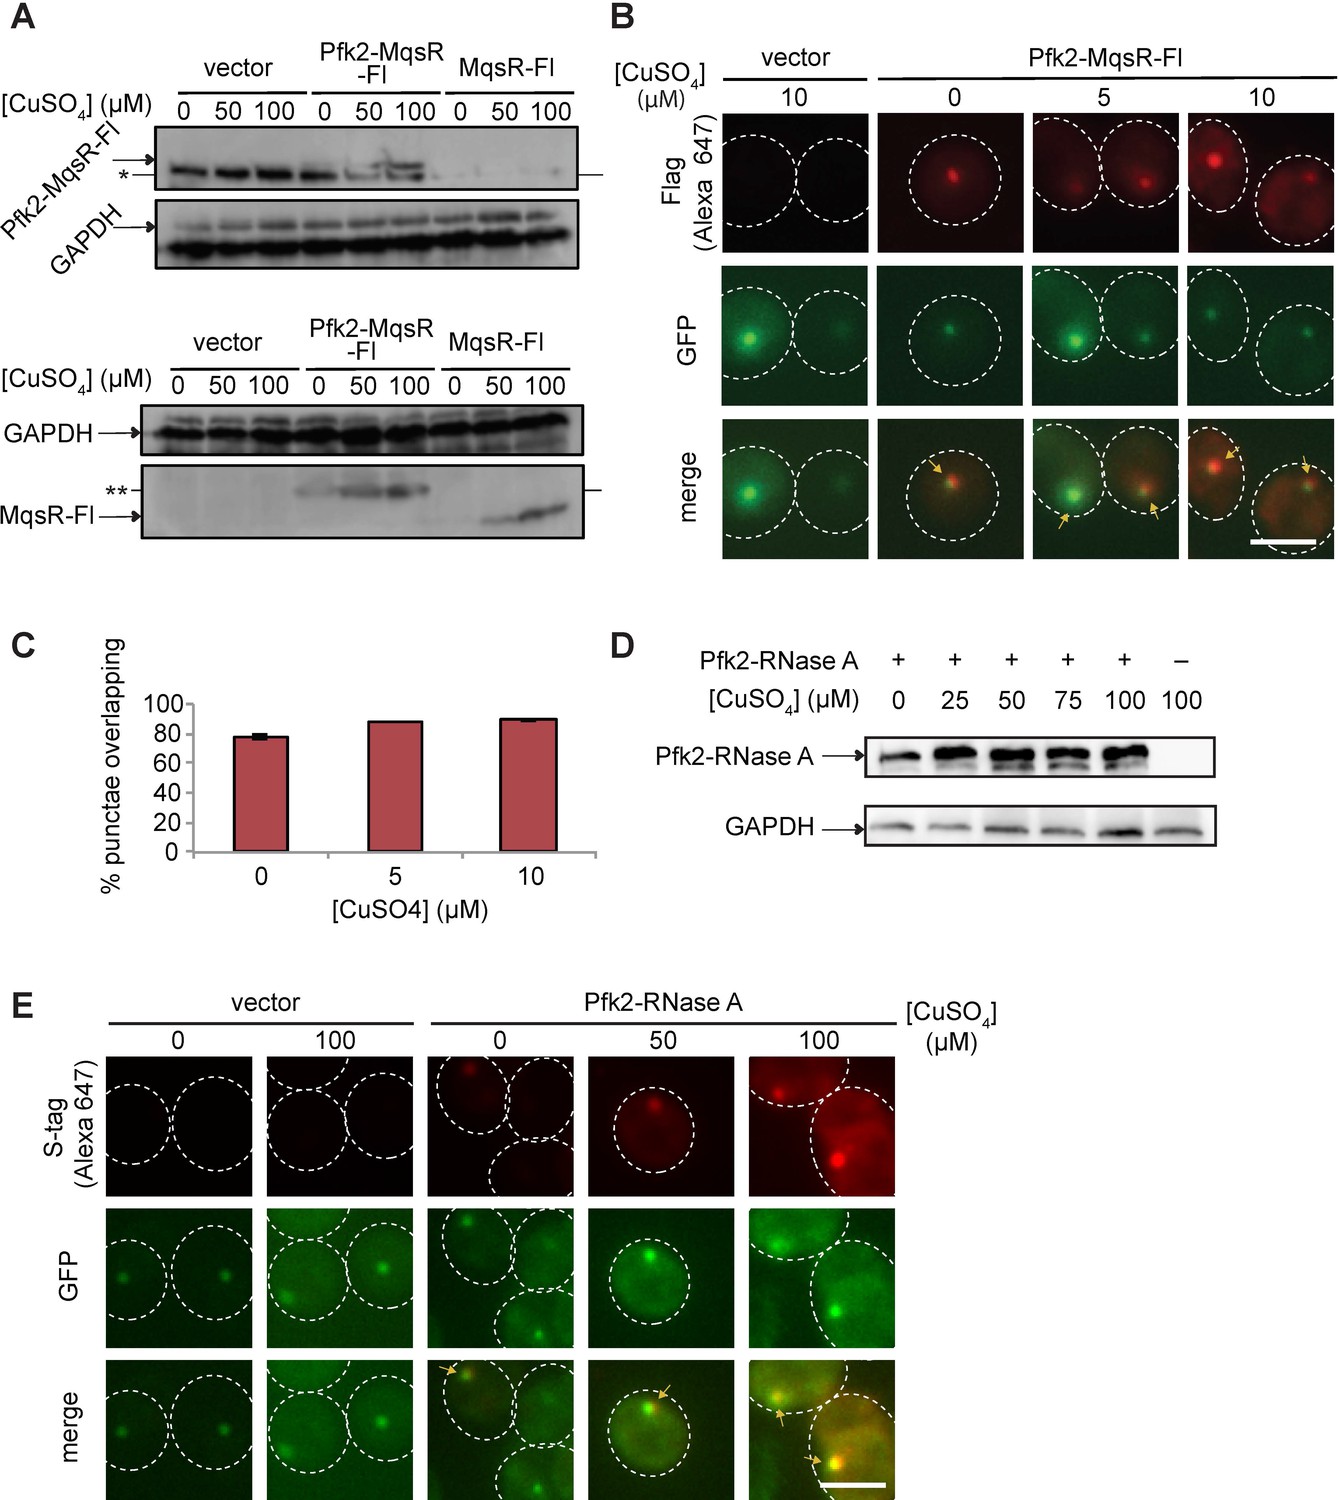
Validation of RNase tagged Pfk2 variants.
(A) Western blot showing induction and expression of Pfk2-MqsR-Fl and MqsR-Fl. Top blot was from an 8% polyacrylamide gel. Bottom blot was from a 12% polyacrylamide gel. GAPDH served as a loading control. Nonspecific band of approximately 100 kDa is present in all samples, whereas Pfk2-MqsR-Fl is present at 110 kDa. MqsR-Fl is about 12 kDa. MqsR-Fl and Pfk2-MqsR-Fl were probed with a monoclonal anti-Flag antibody. *indicates nonspecific band. **indicates degradation product. (B) Immunofluorescence of Pfk2-MqsR-Fl (red) probed by a monoclonal anti-Flag antibody shows colocalization with endogenous Pfk2-GFP signal (green). No Flag signal is present in vector control. (C) Quantification of Flag foci overlapping Pfk2-GFP foci. Data represent mean and standard deviation of two replicates (n > 100 per replicate). (D) Western blot of cells expressing Pfk2-RNase A at different concentrations of CuSO4 showing induction. Pfk2-RNase A was detected by a rabbit anti-S-tag antibody. GAPDH served as a loading control. (E) Immunofluorescence showing colocalization of Pfk2-RNase A (red) with Pfk2-GFP (green). GFP was probed with a monoclonal anti-GFP antibody. RNase A was probed with a rabbit anti-S-tag antibody. Arrows indicate G bodies. All scale bars are 5 µm.
-
Figure 4—figure supplement 1—source data 1
Source data for Figure 4—figure supplement 1C.
- https://cdn.elifesciences.org/articles/48480/elife-48480-fig4-figsupp1-data1-v1.xlsx
Figure 4—figure supplement 2
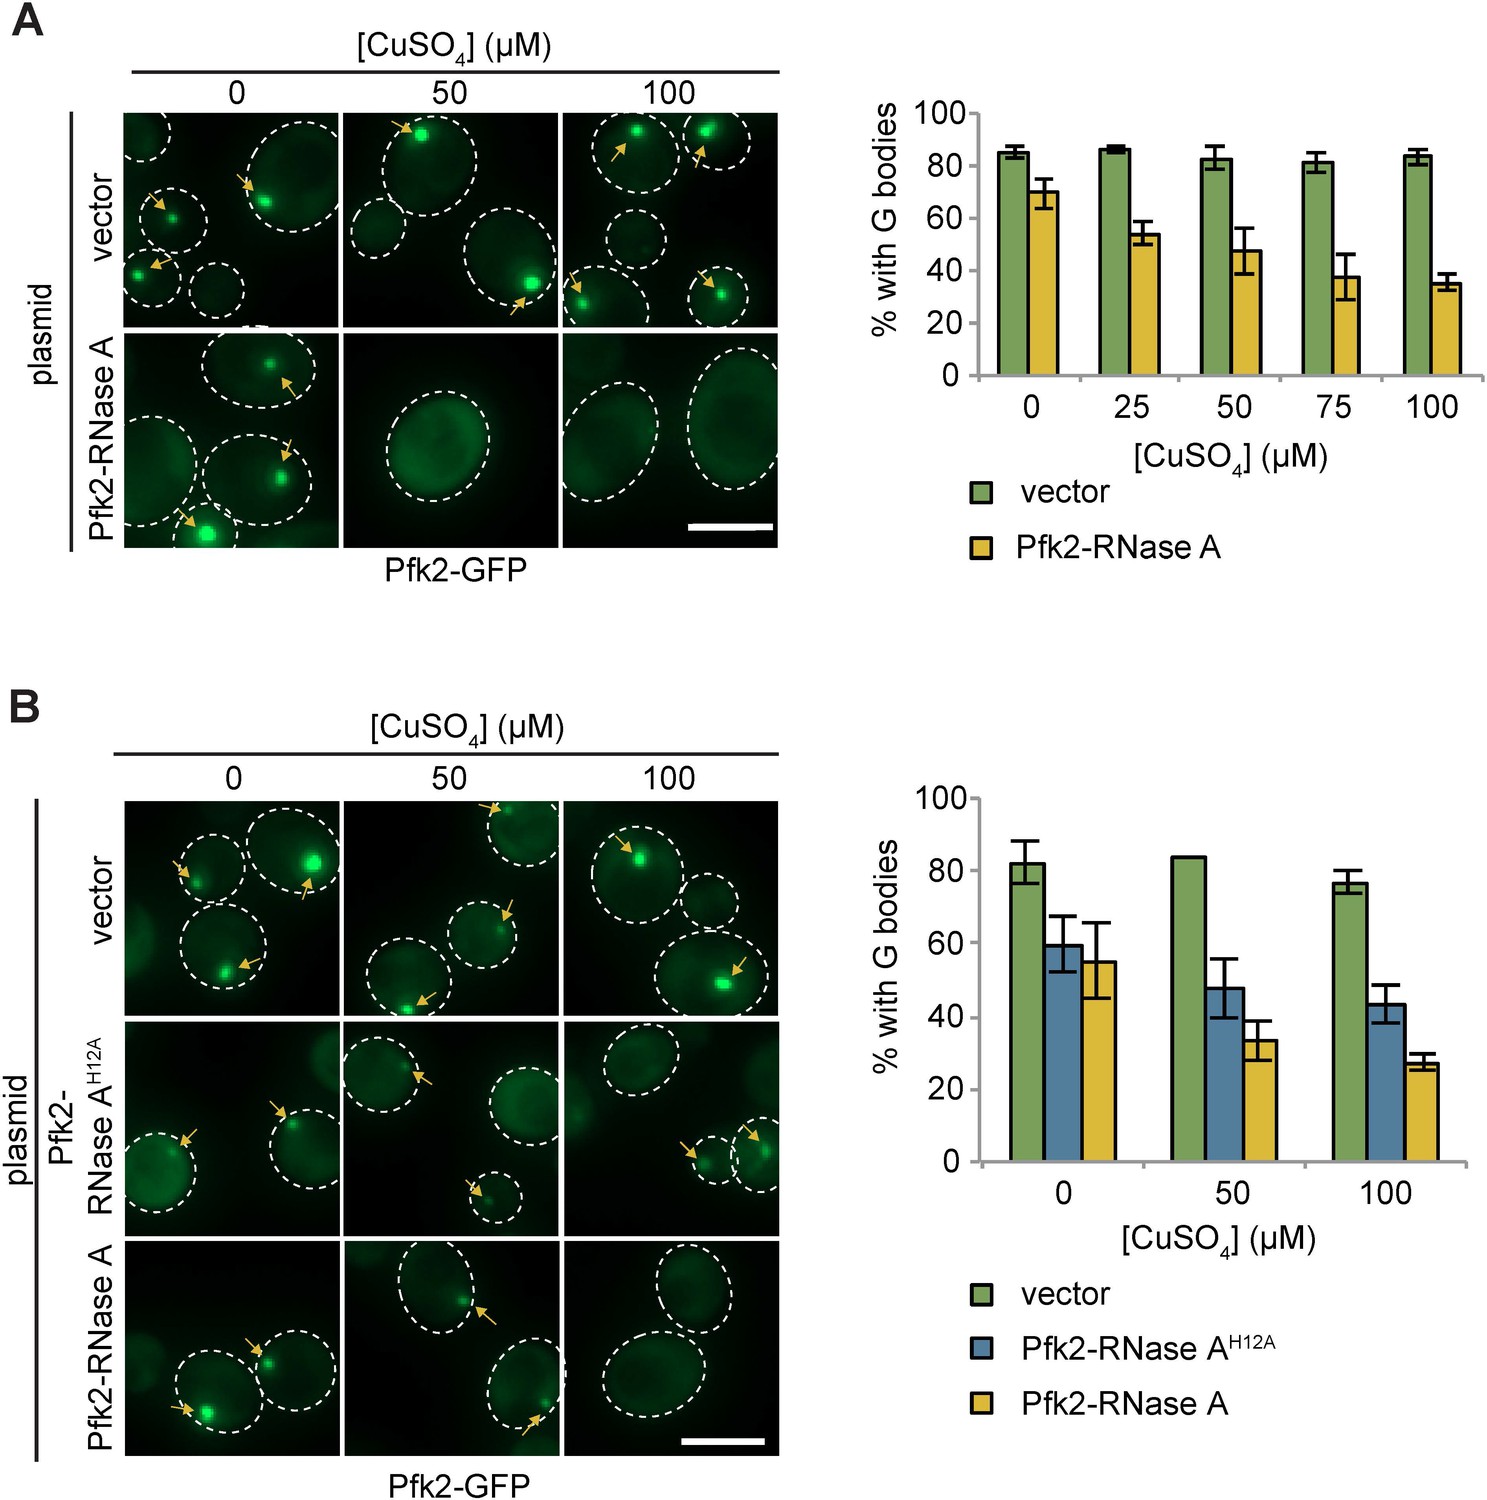
Pfk2-RNase A inhibits G-body formation.
(A) (Left) Representative images of hypoxic Pfk2-GFP localization with varying concentrations of CuSO4 in cells with a vector control or plasmid expressing Pfk2-RNase A lacking the RNase A signal peptide. (Right) Quantification of G body formation in cells expressing plasmids with varying concentration of CuSO4. (B) (Left) Representative images of hypoxic Pfk2-GFP localization with varying concentrations of CuSO4 in cells with a vector control or plasmid expressing Pfk2-RNase A or Pfk2-RNase AH12A, a variant with a mutation inhibiting RNase activity. (Right) Quantification of G body formation in cells expressing plasmids with varying concentration of CuSO4. (A–B) For all graphs, data represent mean and standard deviation of two individual experiments with n > 100 per replicate per condition. Arrows indicate G bodies. All scale bars are 5 µm.
-
Figure 4—figure supplement 2—source data 1
Source data for Figure 4—figure supplement 2A.
- https://cdn.elifesciences.org/articles/48480/elife-48480-fig4-figsupp2-data1-v1.xlsx
-
Figure 4—figure supplement 2—source data 2
Source data for Figure 4—figure supplement 2B.
- https://cdn.elifesciences.org/articles/48480/elife-48480-fig4-figsupp2-data2-v1.xlsx
Figure 4—figure supplement 3
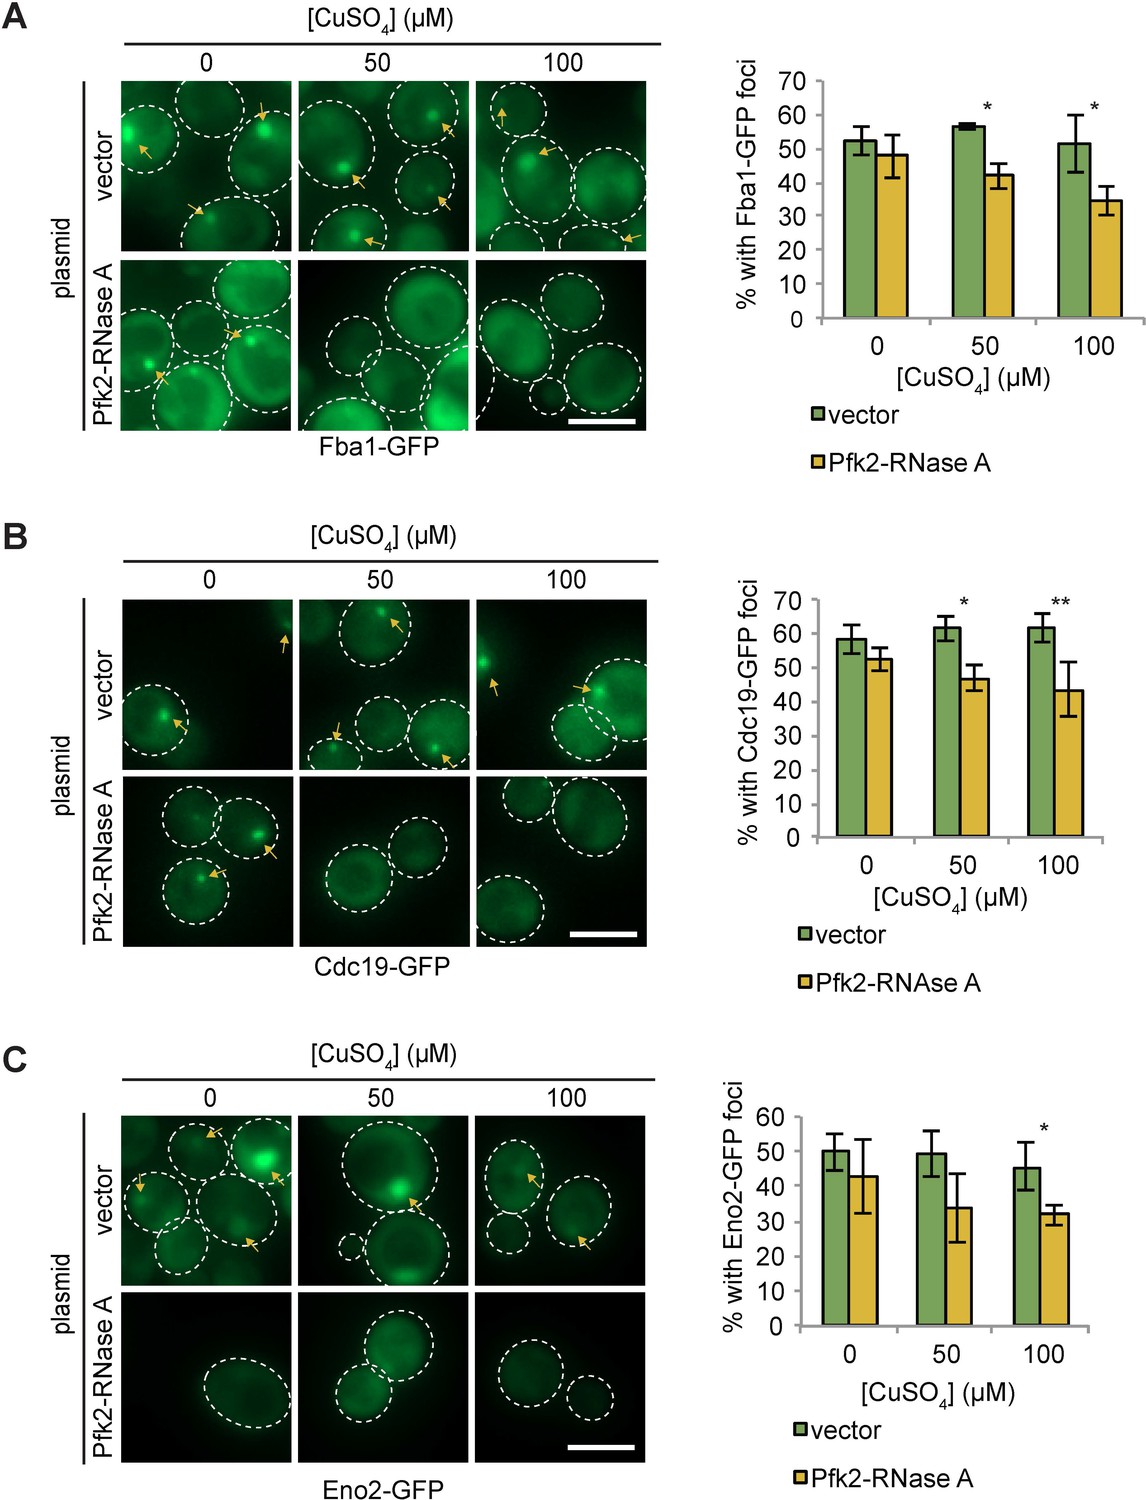
Pfk2-RNase A inhibits punctate formation of multiple G-body markers.
(A) (Left) Representative images of hypoxic Fba1-GFP localization in cells with a vector control and cells expressing Pfk2-RNase A. (Right) Quantification of punctate localization of cells. (B) (Left) Representative images of hypoxic Cdc19-GFP localization in cells with a vector control and cells expressing Pfk2-RNase A. (Right) Quantification of punctate localization of cells. (C) (Left) Representative images of hypoxic Eno2-GFP localization in cells with a vector control and cells expressing Pfk2-RNase A. (Right) Quantification of punctate localization of cells. All scale bars are 5 µm. Arrows indicate G bodies. For all graphs, data represent mean and standard deviation of three independent experiments (n > 100 cells per condition per replicate).
-
Figure 4—figure supplement 3—source data 1
Source data for Figure 4—figure supplement 3A.
- https://cdn.elifesciences.org/articles/48480/elife-48480-fig4-figsupp3-data1-v1.xlsx
-
Figure 4—figure supplement 3—source data 2
Source data for Figure 4—figure supplement 3B.
- https://cdn.elifesciences.org/articles/48480/elife-48480-fig4-figsupp3-data2-v1.xlsx
-
Figure 4—figure supplement 3—source data 3
Source data for Figure 4—figure supplement 3C.
- https://cdn.elifesciences.org/articles/48480/elife-48480-fig4-figsupp3-data3-v1.xlsx
Figure 5
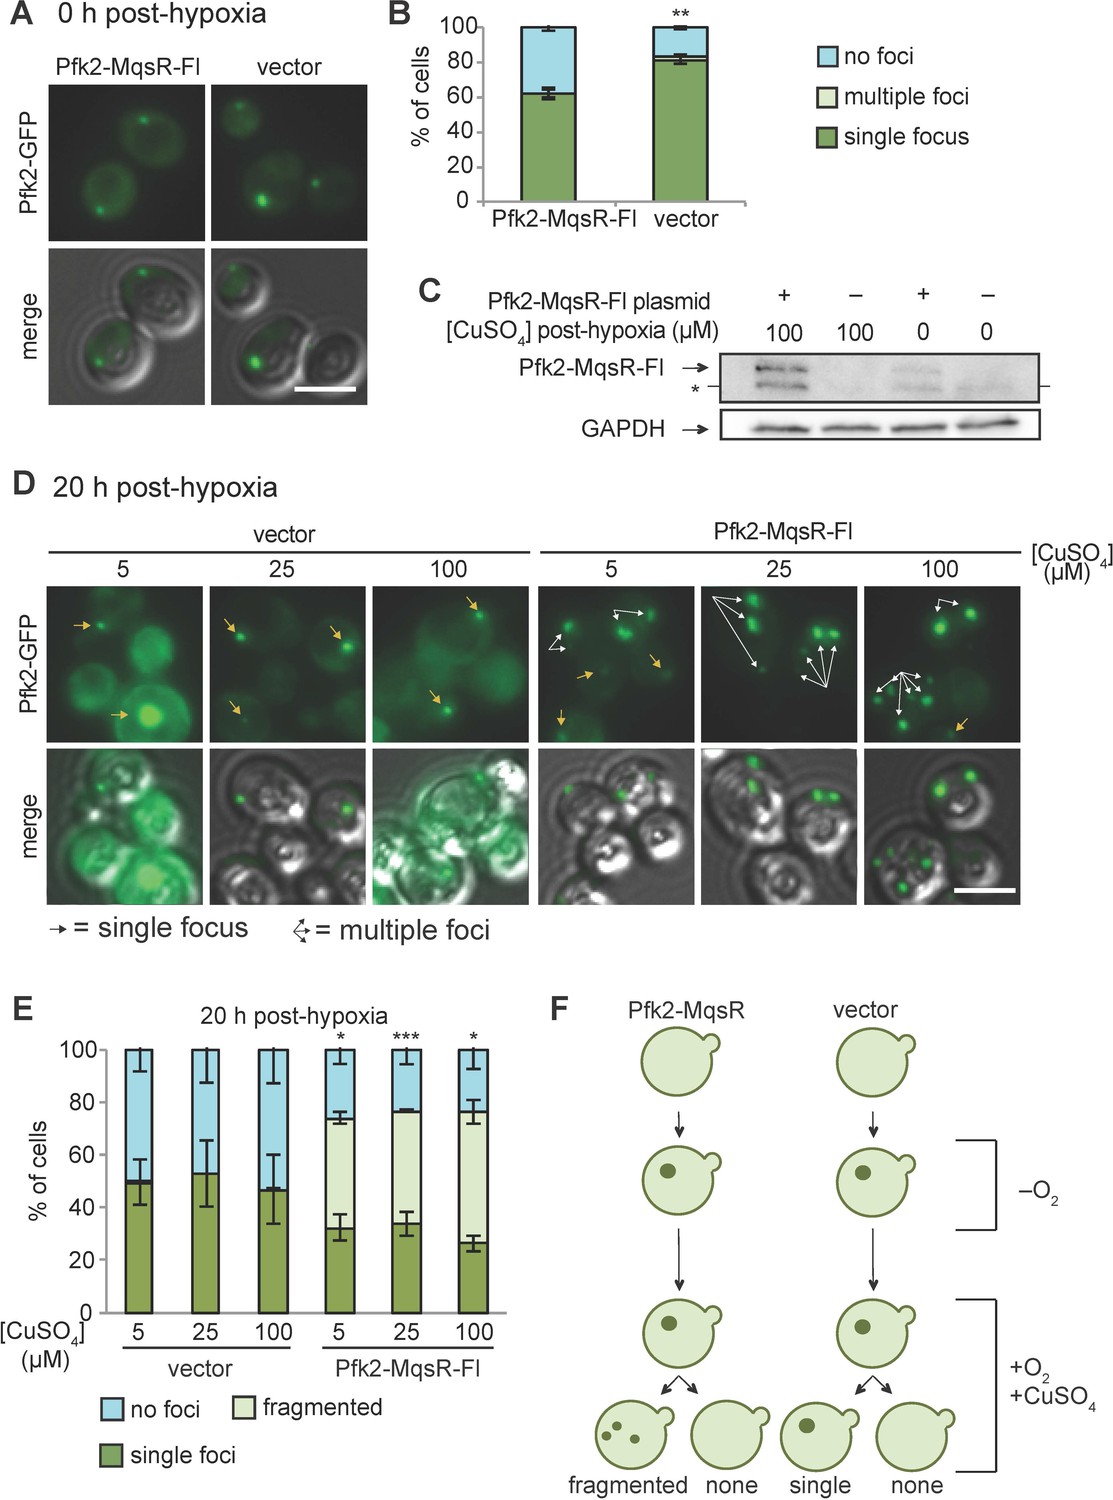
Pfk2-MqsR-Fl induction fractures existing G bodies.
(A) Cells with a plasmid inducibly expressing Pfk2-MqsR-Flag form G bodies in the absence of induction by CuSO4. Representative images of hypoxic Pfk2-GFP localization in cells expressing a vector control or Pfk2-MqsR-Fl with 0 µM CuSO4. (B) Quantification of G body formation of cells in (A). (C) Western blot showing induction of Pfk2-MqsR-Fl where CuSO4 is added after 20 hr in hypoxia and cells are subsequently cultured for 20 hr in normoxia. Pfk2-MqsR-Fl is probed with a monoclonal anti-Flag antibody. GAPDH serves as a loading control. * indicates a nonspecific band. (D) Representative images of Pfk2-GFP localization in cells expressing a vector control and cells expressing Pfk2-MqsR-Fl after 20 hr hypoxia followed by induction with varying concentrations of CuSO4 in normoxia for 20 hr. Cells with Pfk2-MqsR-Fl frequently have multiple large foci. (E) Quantification of cells with a single focus, multiple foci, or no foci for cells in (D). (F) Cartoon showing Pfk2-GFP localization before hypoxia, immediately after hypoxia, and after induction with CuSO4. All graphs show mean and standard deviation of three independent experiments (n > 100 cells per condition per replicate). Arrows indicate G bodies. Statistics calculated with unpaired student’s T tests. All scale bars 5 µm. *p<0.05. **p<0.01. ***p<0.001.
-
Figure 5—source data 1
Source data for Figure 5B.
- https://cdn.elifesciences.org/articles/48480/elife-48480-fig5-data1-v1.xlsx
-
Figure 5—source data 2
Source data for Figure 5E.
- https://cdn.elifesciences.org/articles/48480/elife-48480-fig5-data2-v1.xlsx
Figure 6
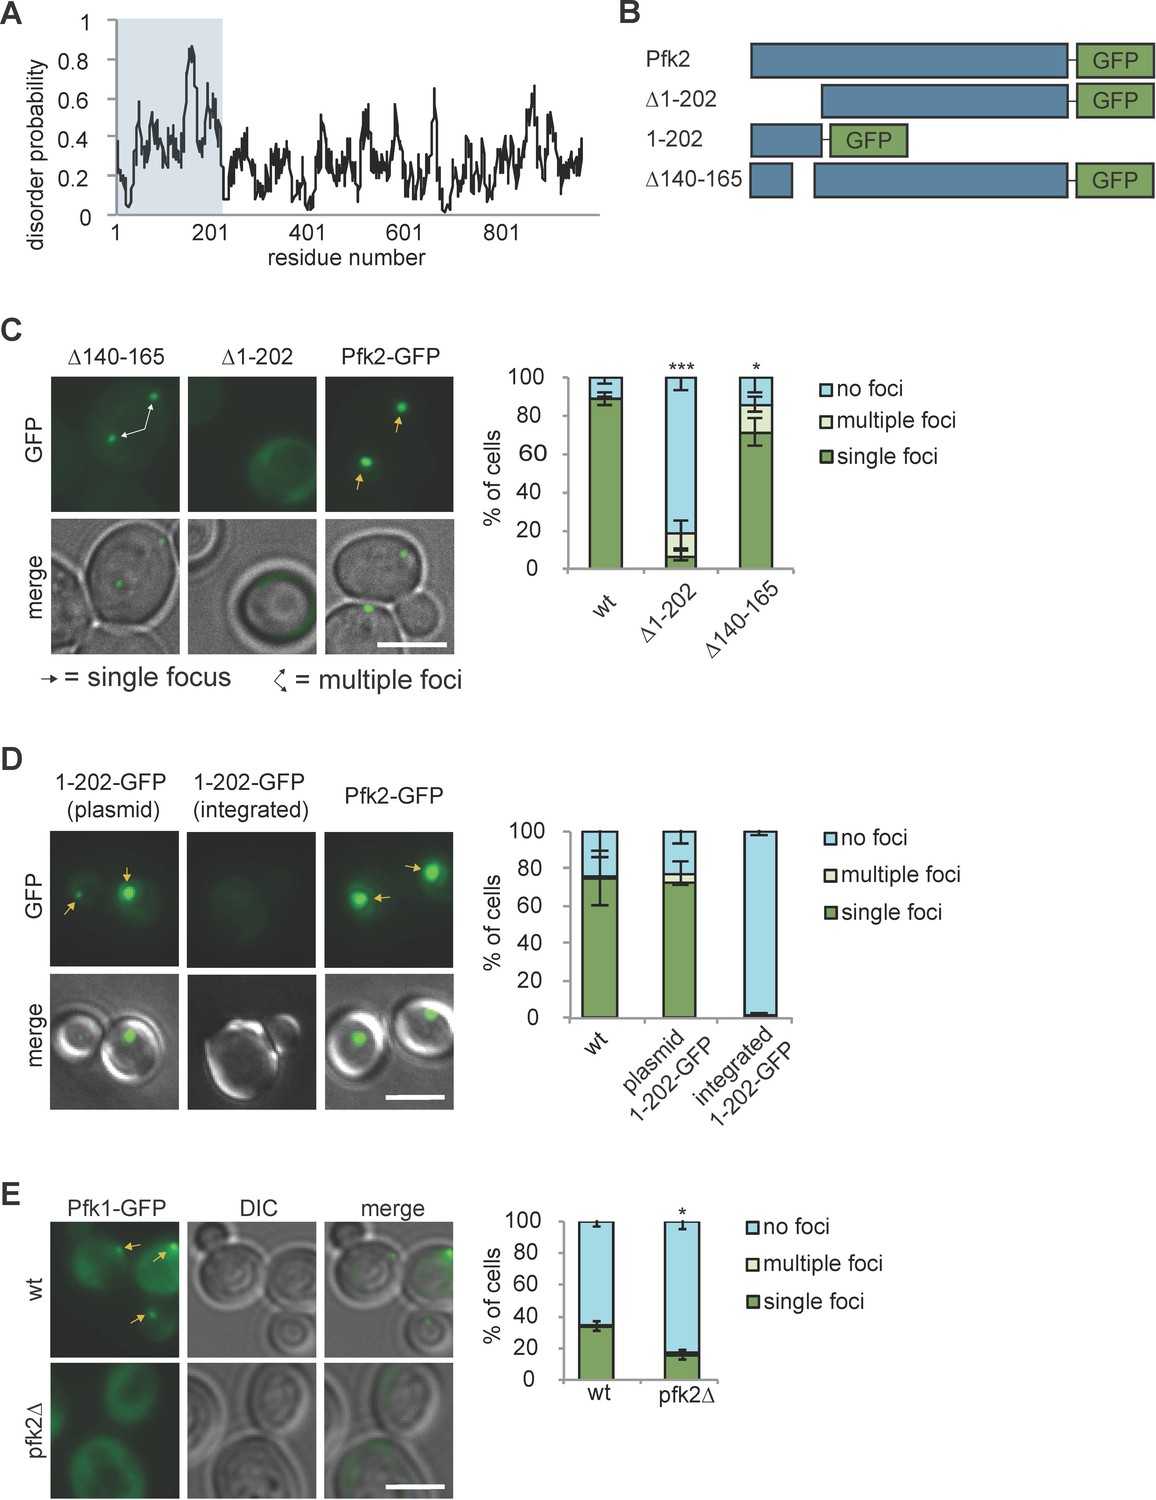
Protein recruitment to G bodies relies on multivalent interactions.
(A) IUPRED prediction of disorder in Pfk2. The first 202 amino acid residues (i.e., the Pfk2 N-terminus) are largely unstructured. (B) Schematic of Pfk2-GFP variants tested. (C) (Left) The Pfk2 N-terminus is required for G body localization. Representative images of Pfk2-GFP variant localization in hypoxia. (Right) Quantification of G body localization. (D) (Left) The Pfk2 N-terminus is not sufficient for G body localization. Representative images of Pfk2-GFP variant localization in hypoxia. When integrated (in the absence of full-length Pfk2), GFP fused to the Pfk2 N-terminus does not localize to G bodies. When expressed on a plasmid in a strain expressing full-length Pfk2, GFP fused to the Pfk2 N-terminus is able to localize to G bodies. (Right) Quantification of G body localization. (E) (Left) Pfk1-GFP recruitment to G bodies depends on Pfk2. Representative images of hypoxic Pfk1-GFP localization in wild-type and pfk2∆ cells. (Right) Quantification of Pfk1-GFP localization in wild-type and pfk2∆ cells in hypoxia. All scale bars are 5 µm. Arrows represent either G bodies or cells with multiple G bodies. For (C) and (E): Data represent mean and standard deviation of three replicates (n > 100 cells per condition per replicate). For (D): Data represent mean and standard deviation of two biological replicates (n > 100 cells per condition per replicate). Statistics are unpaired student’s T tests comparing G body formation. *p<0.05. **p<0.01. ***p<0.001.
-
Figure 6—source data 1
Source data for Figure 6C.
- https://cdn.elifesciences.org/articles/48480/elife-48480-fig6-data1-v1.xlsx
-
Figure 6—source data 2
Source data for Figure 6D.
- https://cdn.elifesciences.org/articles/48480/elife-48480-fig6-data2-v1.xlsx
-
Figure 6—source data 3
Source data for Figure 6E.
- https://cdn.elifesciences.org/articles/48480/elife-48480-fig6-data3-v1.xlsx
Figure 7 with 6 supplements
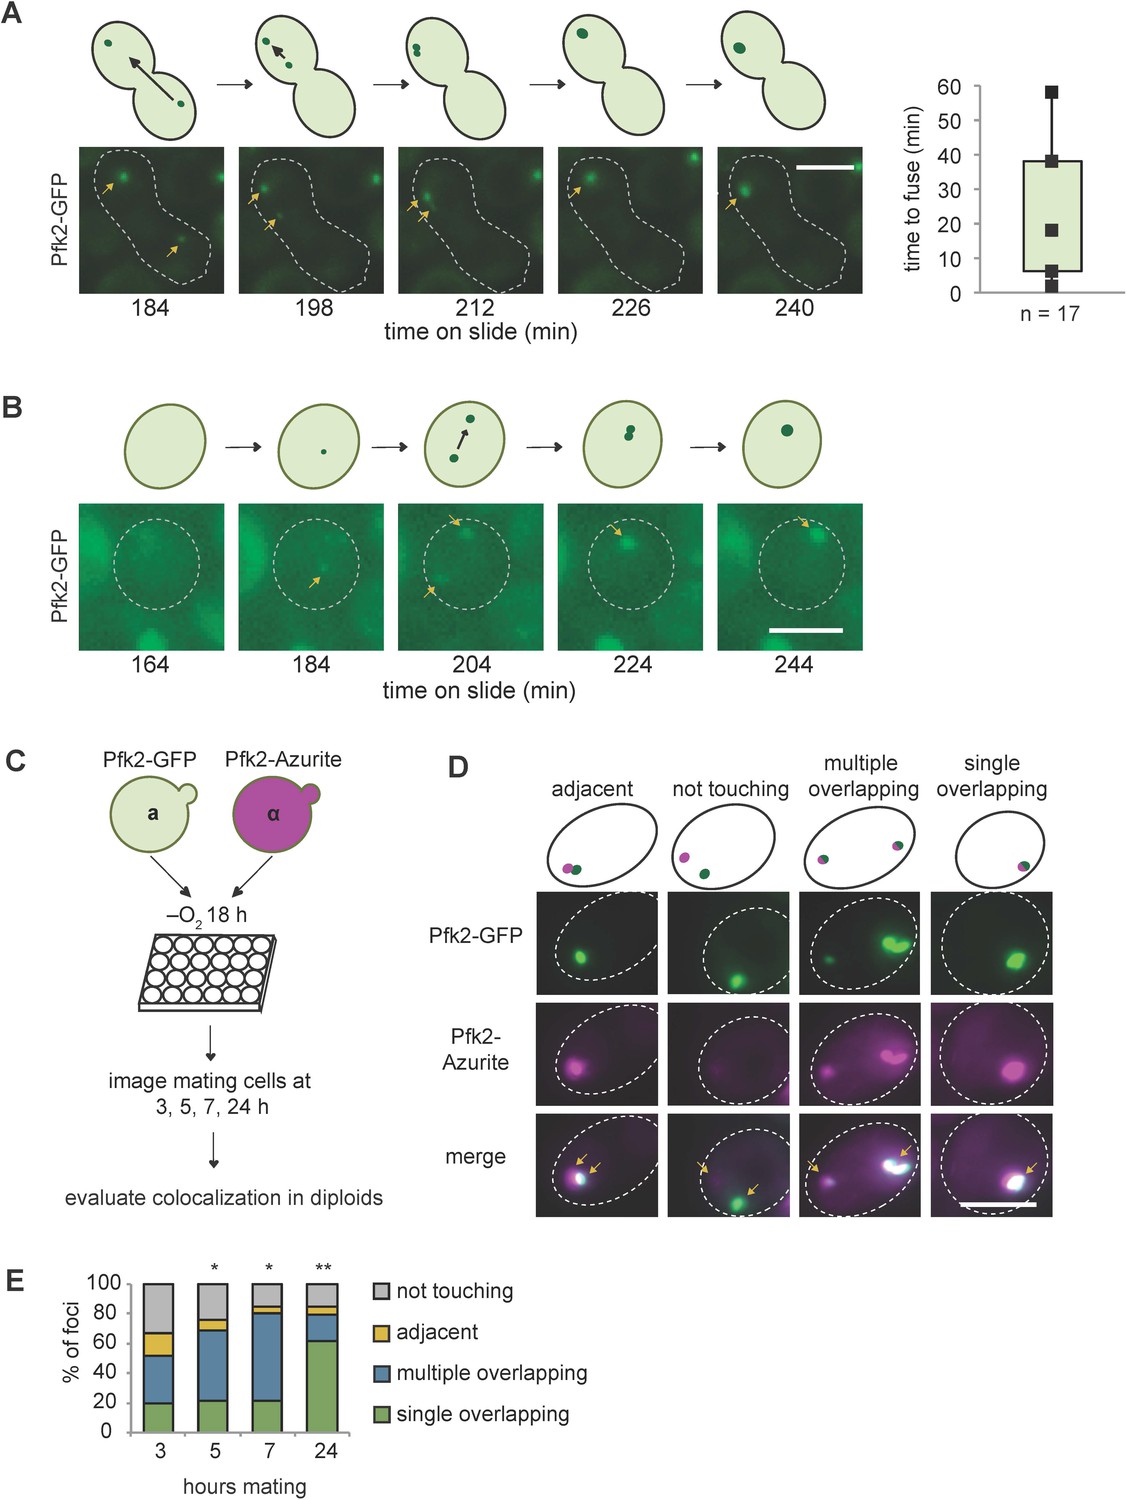
G bodies fuse in vivo.
(A–B) Still images from time-lapse imaging of Pfk2-GFP in mating cells with cartoon. a and α cells each expressing Pfk2-GFP were cultured together in hypoxia for 18 hr, mounted on a slide, and imaged every 2 min for 3–4 hr. (A) G body fusion. Initially, foci are present in opposite ends of mating cells. One G body crosses to the other end and gradually fuses with the other G body. (Right) Quantification of time to fuse for multiple G body fusion events from initial contact to fusion. (B) De novo G body formation. Initially, Pfk2-GFP is diffuse in the highlighted cell. Two small puncta appear and gradually fuse into one larger focus, becoming more intense over time. (C) Mating for quantification of G body fusion. a and α cells expressing Pfk2-GFP and Pfk2-Azurite, respectively, are grown in hypoxia together and allowed to settle in 24-well plates. Cultures are sampled at 3, 5, 7 and 24 hr and phenotypes are evaluated. (D) Representative images of mating Pfk2-Azurite and Pfk2-GFP cells displaying different colocalization phenotypes. (E) Quantification of G body fusion at each time point. Foci were classified as single foci in cells that were overlapping, multiple overlapping foci in cells, adjacent foci in cells, or foci not touching or associated in cells. Data represent mean of three independent experiments (n > 40 foci per timepoint per replicate). Arrows indicate G bodies. All scale bars are 5 µm. p-values represent largest Chi square test of difference between subsequent timepoints for a replicate. *p<10−5, **p<10−10.
-
Figure 7—source data 1
Source data for Figure 7A.
- https://cdn.elifesciences.org/articles/48480/elife-48480-fig7-data1-v1.xlsx
-
Figure 7—source data 2
Source data for Figure 7E.
- https://cdn.elifesciences.org/articles/48480/elife-48480-fig7-data2-v1.xlsx
Figure 7—figure supplement 1
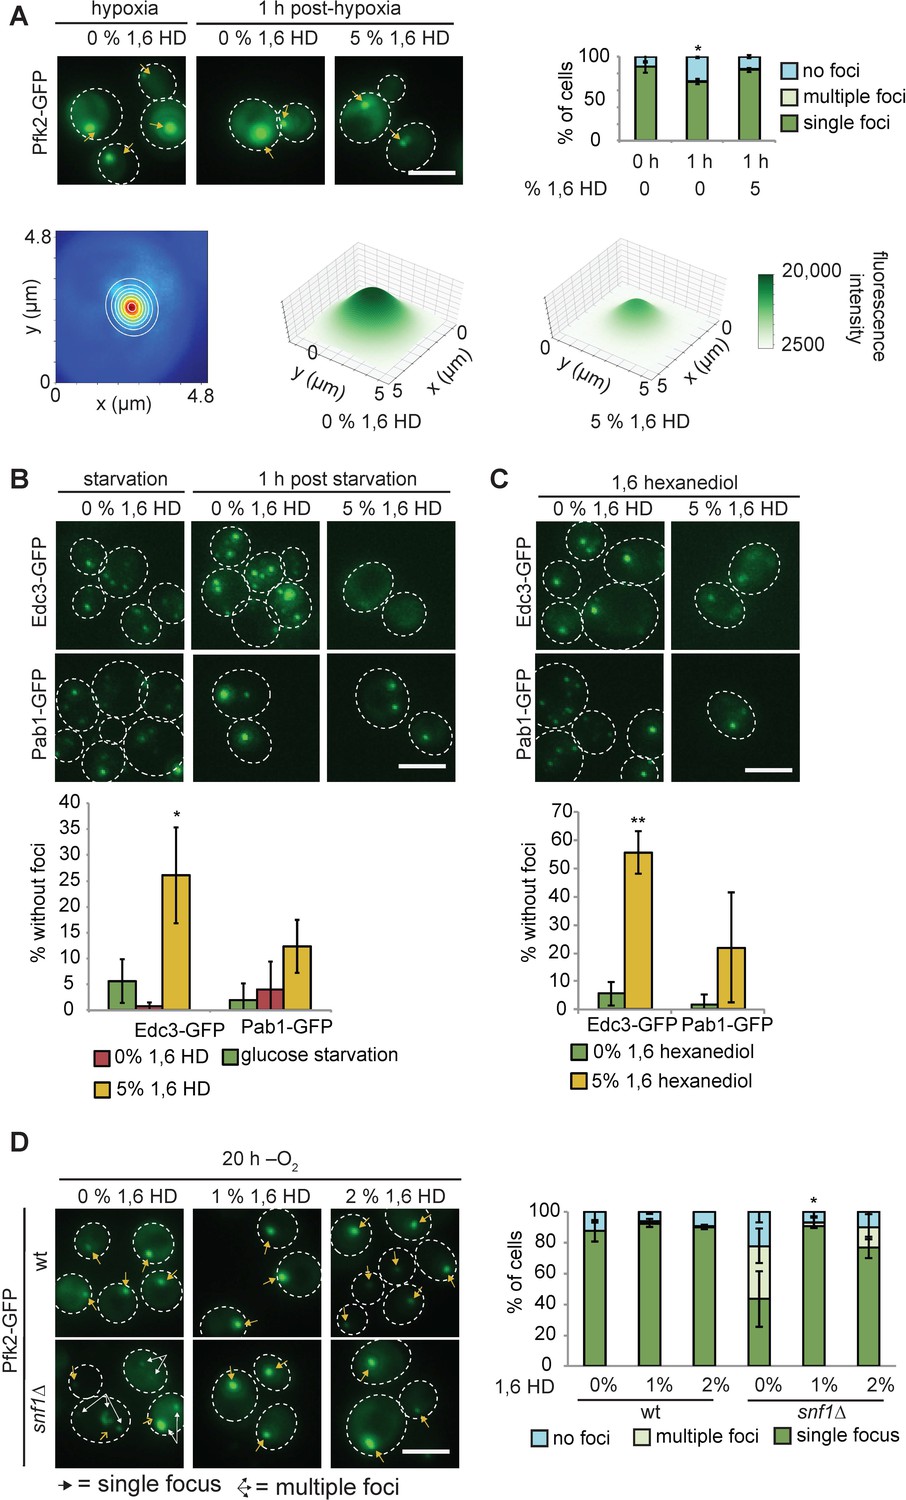
1,6-Hexanediol partially dissolves G bodies but does not inhibit their formation.
(A) (Top) 1,6-hexanediol treatment of cells with G bodies. 5% 1,6-hexanediol was added in PBST to cells with G bodies after 20 hr in hypoxia for 1 hr and cells were imaged. Left: Representative images. Top Right: Quantification. Bottom Left: Example of 2-dimensional Gaussian distribution of Pfk2-GFP focus overlaid on real data. Blue pixels have weak fluorescence relative red pixels. Right: Average 2-dimensional Gaussian distributions fit to Pfk2-GFP foci from 5% 1,6-hexanediol treated cells following hypoxia or untreated cells. Parameters were averaged across n = 253 and 310 fits, respectively. Notably, amplitude and standard deviations are smaller in 1,6 hexanediol treated cells (A = 18519 +/- 1308, σx = 1.1 +/- 0.07 µm, σy = 1.1 +/- 0.06 µm and A = 12054 +/- 857, σx = 0.72 +/- 0.055 µm and σy = 0.74 +/- 0.06 µm, respectively). (B) 1,6-hexanediol treatment of cells with Edc3-GFP (P-bodies) and Pab1-GFP (stress granules). Cells starved of glucose for 30 min were treated with 5% 1,6-hexanediol in PBST for 1 hr. Left: Representative images. Right: Quantification. (C) 5% 1,6-hexanediol treatment during 30 min glucose starvation. Left: Representative images. Right: Quantification. (D) 2% 1,6-hexanediol treatment during hypoxia in wildtype or snf1∆ cells. For wild-type cells with 0% 1,6 hexanediol, the same data is plotted in (A) for 0 hr with 0% 1,6 hexanediol. Left: Representative images. Right: Quantification. All scale bars 5 µM. Arrows indicate G bodies. All experiments represent average ± standard deviation of three independent experiments.
-
Figure 7—figure supplement 1—source data 1
Source data for Figure 7—figure supplement 1A.
- https://cdn.elifesciences.org/articles/48480/elife-48480-fig7-figsupp1-data1-v1.xlsx
-
Figure 7—figure supplement 1—source data 2
Source data for Figure 7—figure supplement 1B.
- https://cdn.elifesciences.org/articles/48480/elife-48480-fig7-figsupp1-data2-v1.xlsx
-
Figure 7—figure supplement 1—source data 3
Source data for Figure 7—figure supplement 1C.
- https://cdn.elifesciences.org/articles/48480/elife-48480-fig7-figsupp1-data3-v1.xlsx
-
Figure 7—figure supplement 1—source data 4
Source data for Figure 7—figure supplement 1D.
- https://cdn.elifesciences.org/articles/48480/elife-48480-fig7-figsupp1-data4-v1.xlsx
Figure 7—figure supplement 2

G body components exchange with the cytoplasm.
(A–D) (Left) Representative images of fluorescence recovery after photobleaching of G body markers before bleaching, immediately post-bleaching, and after 20 min of recovery. All scale bars are 5 µm. (Right) Average normalized recovery curves from indicated number of cells with greater than 60% of signal bleached and parameters resulting from fitting data (see Materials and methods). (A) (Top) FRAP of cells expressing Pfk2-GFP grown in hypoxia in YPD 18 hr. (Bottom) FRAP of cells expressing Pfk2-GFP grown in hypoxia in SMD 18 hr. (B) FRAP of cells expressing Fba1-GFP grown in hypoxia in YPD 18 hr. (C) FRAP of cells expressing Eno2-GFP grown in hypoxia in YPD 18 hr. (D) FRAP of cells expressing Pfk2-GFP in hypoxia in 5 µM CuSO4 in SMD(-Ura) after 18 hr in hypoxia with a plasmid expressing (Top) Pfk2D348S-MqsR-Flag or (Bottom) a vector control. Note that recovery curve parameters represent the first 25 min of recovery for data in (D). All error bars represent standard error of the mean of the indicated number of traces.
-
Figure 7—figure supplement 2—source data 1
Source data for Figure 7—figure supplement 2.
- https://cdn.elifesciences.org/articles/48480/elife-48480-fig7-figsupp2-data1-v1.xlsx
Figure 7—figure supplement 3
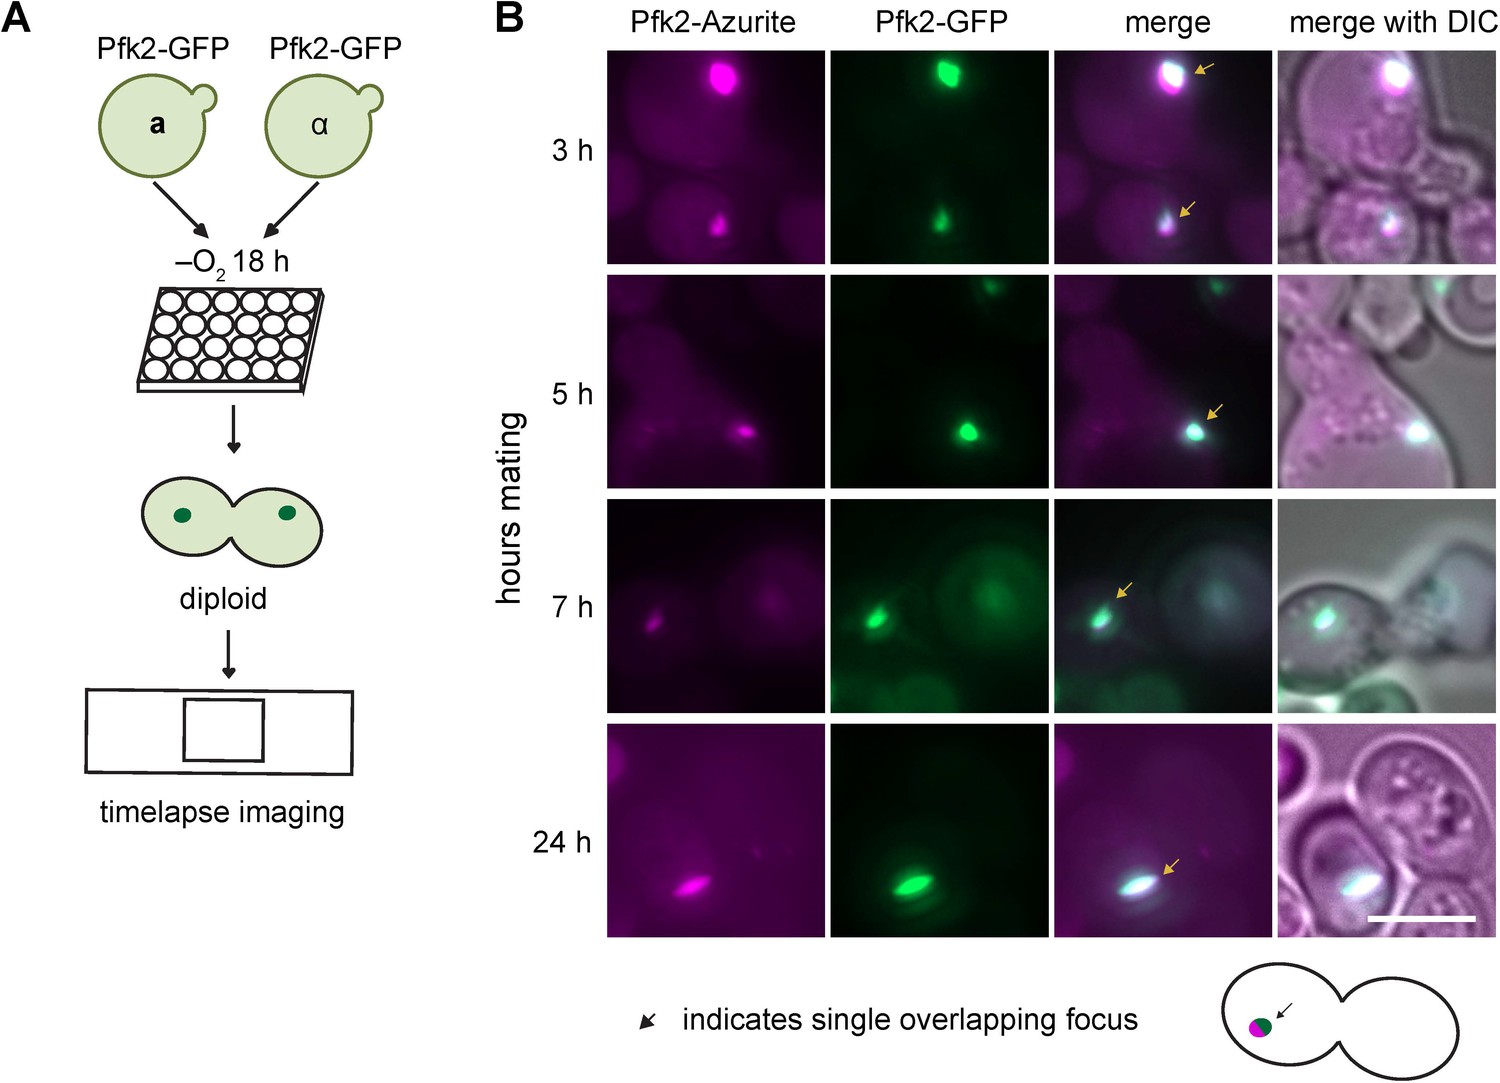
Schematics of mating experiments.
(A) Mating for kinetics measurements. a and α cells expressing Pfk2-GFP are grown together in hypoxia for 18 hr. Cells are placed under a cover slip and imaged for hours with images every 2 min. (B) Representative images of mating cells with colocalized Pfk2-Azurite and Pfk2-GFP at each timepoint tested. Arrows indicate G bodies. Scale bar is 5 µm.
Figure 7—figure supplement 4
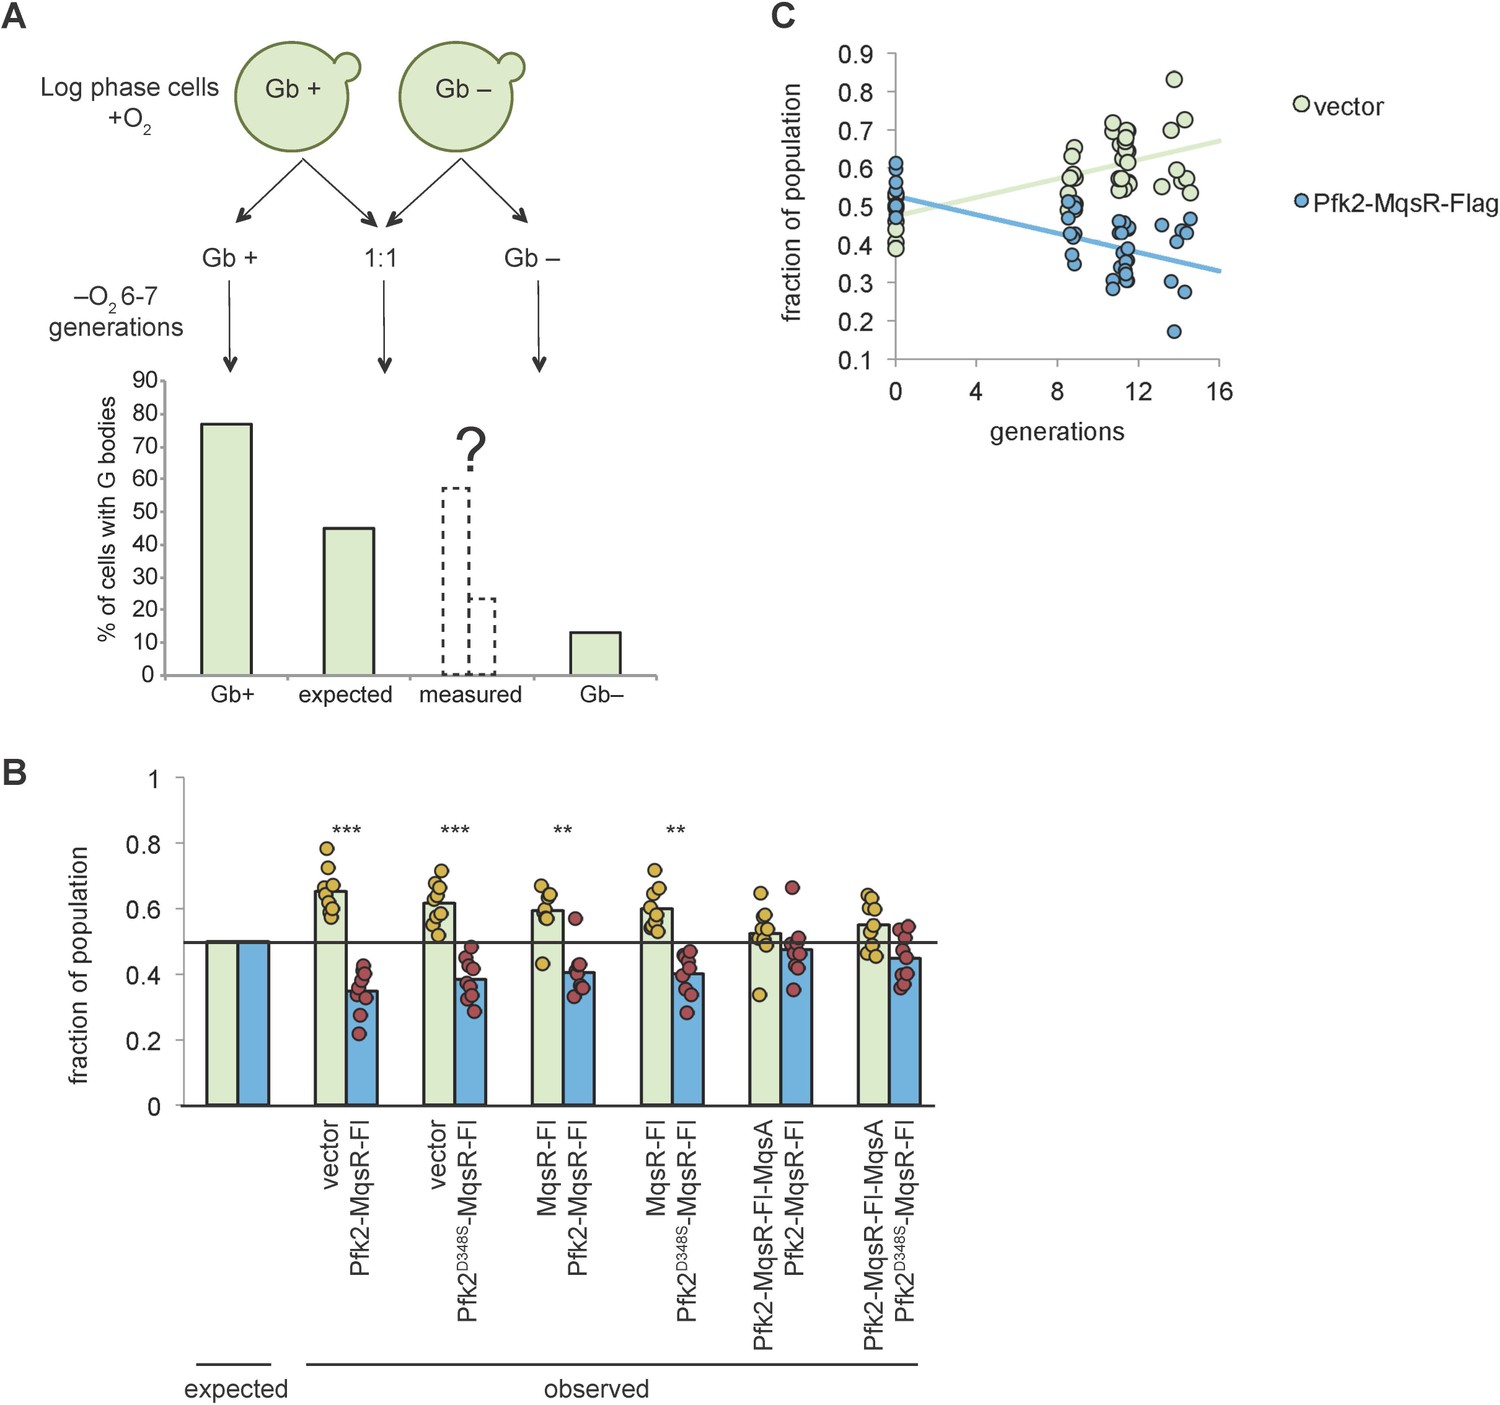
G body formation confers a selective advantage to cells in hypoxia.
(A) Scheme of the competition assay. Cells from a G body forming population (Gb+) and a strain incapable of forming G bodies (Gb-) are grown to log phase and shifted to hypoxia either alone or mixed 1:1. G body formation is assayed and the number of generations determined by OD600. The expected value is the mean percent of cells with G bodies from the Gb+ and Gb- populations. (B) Proportion of cells of total mixed population from each indicated strain after 20 hr in hypoxia. Expected value is the proportion at 0 hr in hypoxia (1:1 mix of each population). Bars represent the mean of 9 biological replicates. Each circle is an individual biological replicate. P-value represents one sample t test. (C) Proportion of the population from vector control (Gb+) or Pfk2-MqsR-Flag (Gb-) cells after varying numbers of generations in hypoxia. Cells were grown for 24–48 hr. Each circle is an individual population. Data points at 0 generations were determined by CFU determination by spotting on YPD plates each population alone. Subsequent data points were determined by G body formation as in (A). Linear relationships are plotted (R2 = 0.43, y = 0.0123 x + 0.47 and R2 = 0.43, y = −0.0123X + 0.53).
-
Figure 7—figure supplement 4—source data 1
Source data for Figure 7—figure supplement 4B.
- https://cdn.elifesciences.org/articles/48480/elife-48480-fig7-figsupp4-data1-v1.xlsx
-
Figure 7—figure supplement 4—source data 2
Source data for Figure 7—figure supplement 4C.
- https://cdn.elifesciences.org/articles/48480/elife-48480-fig7-figsupp4-data2-v1.xlsx
Figure 7—video 1
Fusion of G bodies.
Time-lapse microscopy of a and α cells expressing Pfk2-GFP mating under a coverslip after hypoxic treatment for 18 h. Z stacks were captured every 2 min and maximum intensity projections are presented. Time stamps represent amount of time under cover slip during imaging.
Figure 7—video 2
Fusion of G bodies.
Time-lapse microscopy of a and α cells expressing Pfk2-GFP mating under a coverslip after hypoxic treatment for 18 h. Z stacks were captured every 2 min and maximum intensity projections are presented. Time stamps represent amount of time under cover slip during imaging.
Additional files
-
Supplementary file 1
Mass spectrometry identification of mRNA binding proteins.
Related to Figure 1.
- https://cdn.elifesciences.org/articles/48480/elife-48480-supp1-v1.xlsx
-
Supplementary file 2
qPCR primers used.
Related to Figure 2—figure supplement 1.
- https://cdn.elifesciences.org/articles/48480/elife-48480-supp2-v1.xlsx
-
Supplementary file 3
Strains used in this study.
- https://cdn.elifesciences.org/articles/48480/elife-48480-supp3-v1.xlsx
-
Supplementary file 4
Results of G body RNA sequencing.
- https://cdn.elifesciences.org/articles/48480/elife-48480-supp4-v1.xlsx
-
Supplementary file 5
Source code used to analyze G body size in Figure 7—figure supplement 1A.
- https://cdn.elifesciences.org/articles/48480/elife-48480-supp5-v1.zip
-
Transparent reporting form
- https://cdn.elifesciences.org/articles/48480/elife-48480-transrepform-v1.docx
Download links
A two-part list of links to download the article, or parts of the article, in various formats.
Downloads (link to download the article as PDF)
Open citations (links to open the citations from this article in various online reference manager services)
Cite this article (links to download the citations from this article in formats compatible with various reference manager tools)
RNA promotes phase separation of glycolysis enzymes into yeast G bodies in hypoxia
eLife 9:e48480.
https://doi.org/10.7554/eLife.48480


