Computed tomography shows high fracture prevalence among physically active forager-horticulturalists with high fertility
- Université Toulouse 1 Capitole, France
- Institute for Advanced Study in Toulouse, France
- Arizona State University, United States
- University of Southern California, United States
- Emory University, United States
- Harbor-University of California at Los Angeles Medical Center, United States
- Chapman University, United States
- University of California, Santa Barbara, United States
Figures
Figure 1
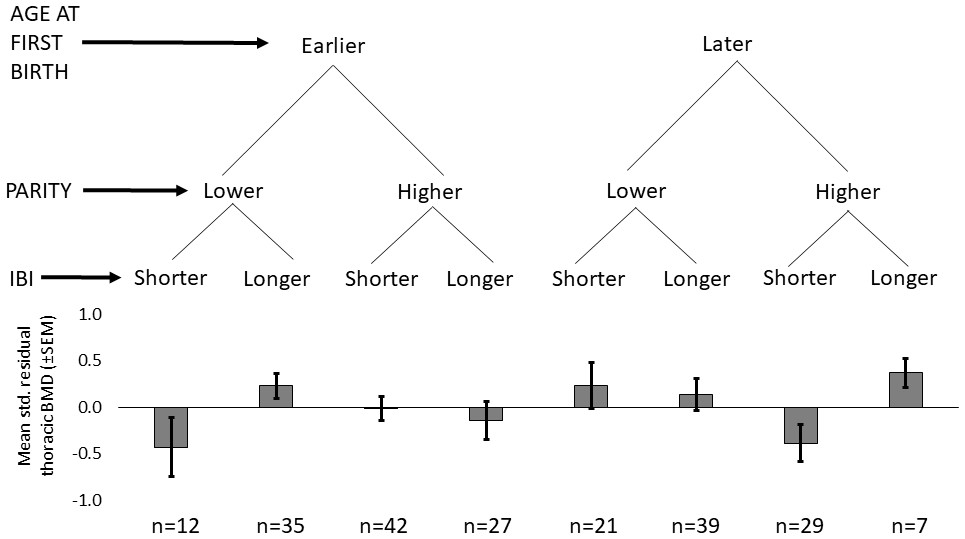
Standardized residual thoracic vertebral BMD (mean ±SEM; controlling for age and fat-free mass) by reproductive effort (n = 212 Tsimane women).
Earlier vs. later age at first birth is defined as <18 vs. ≥18 years (median split), respectively; lower vs. higher parity is defined as ≤9 vs. >9 live births (median split), respectively; and shorter vs. longer mean IBI is defined as <29.7 months vs. ≥29.7 (median split), respectively.
Figure 2
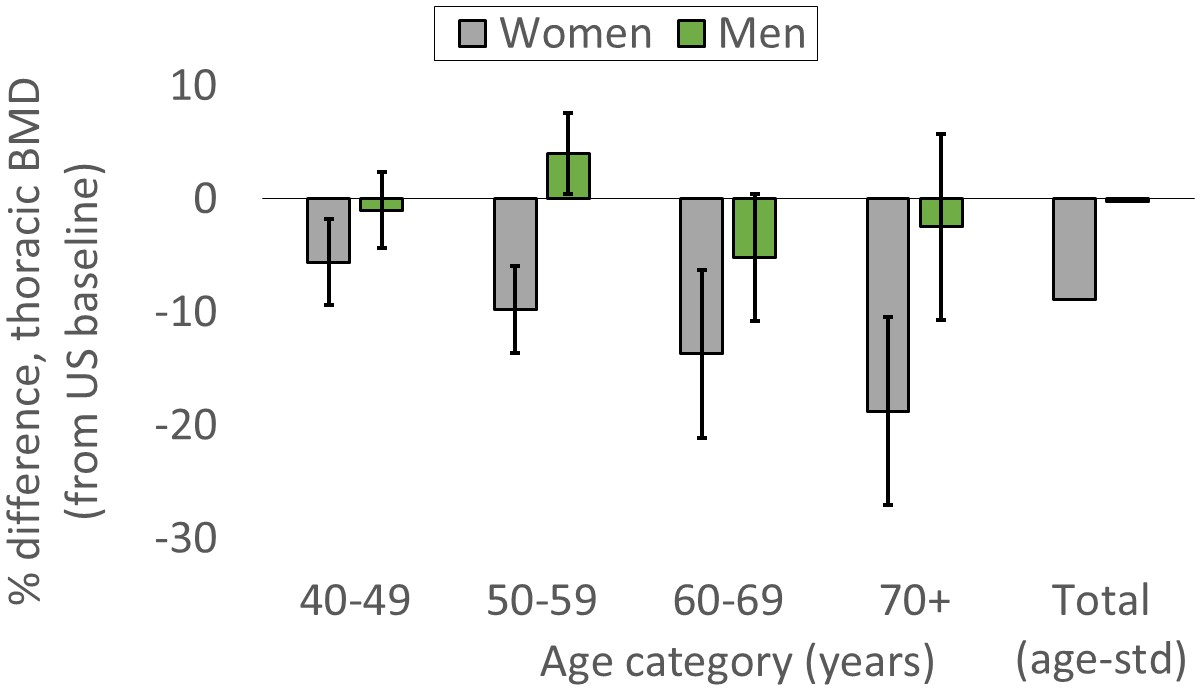
Tsimane versus American mean thoracic vertebral BMD (95% CIs) by age and sex.
The ‘total’ category is age-standardized (see Appendix 1—table 7 for values and details).
Figure 3
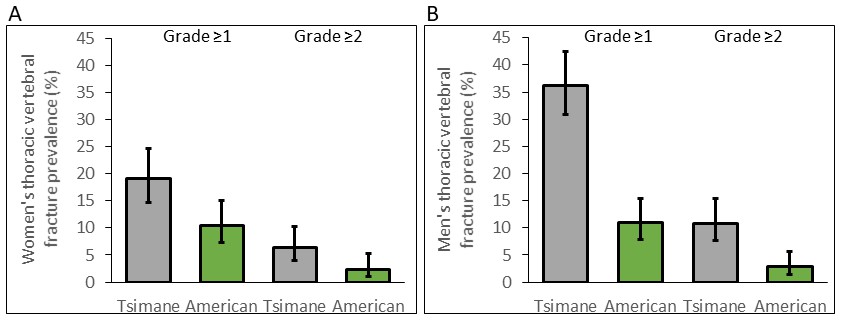
Thoracic vertebral (T6–T12) fracture prevalence (95% CIs) for Tsimane (in gray) and American (in green) women (A) and men (B) by fracture grade.
Prevalence based on a less (grade ≥1) and more (grade ≥2) conservative fracture definition is shown. Prevalence is estimated from log-binomial generalized linear models adjusting for age.
Figure 4
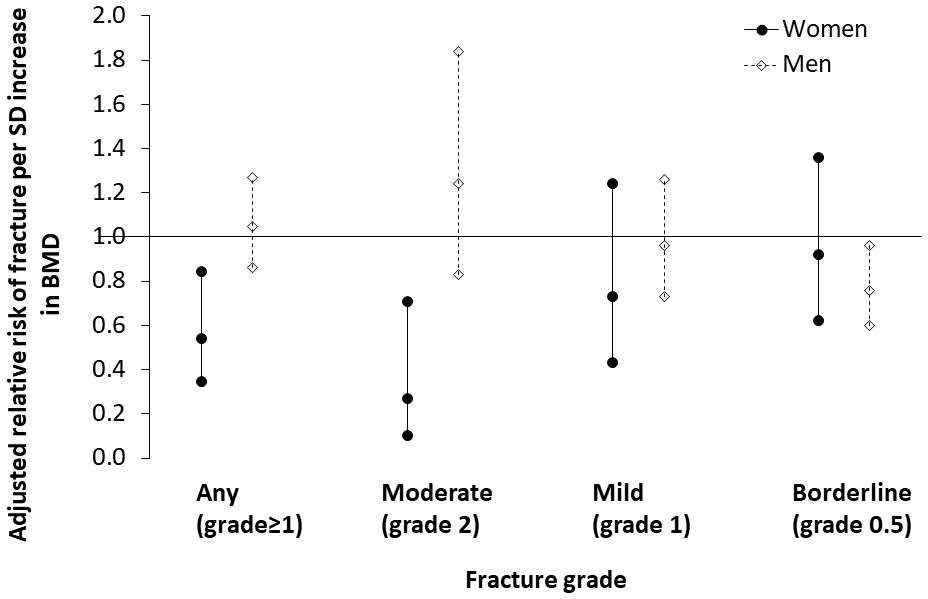
Association between thoracic vertebral BMD and thoracic vertebral (T6–T12) fracture risk (95% CI) for Tsimane.
Log-binomial generalized linear models are used to estimate relative risk after adjustment for age, height and fat mass. Mean IBI is also included as a covariate for women. Parameter estimates are shown in Appendix 1—tables 13–14 (women), and Appendix 1—tables 16–17 (men). Severe fractures (grade 3) are omitted due to their relative scarcity.
Appendix 1—figure 1
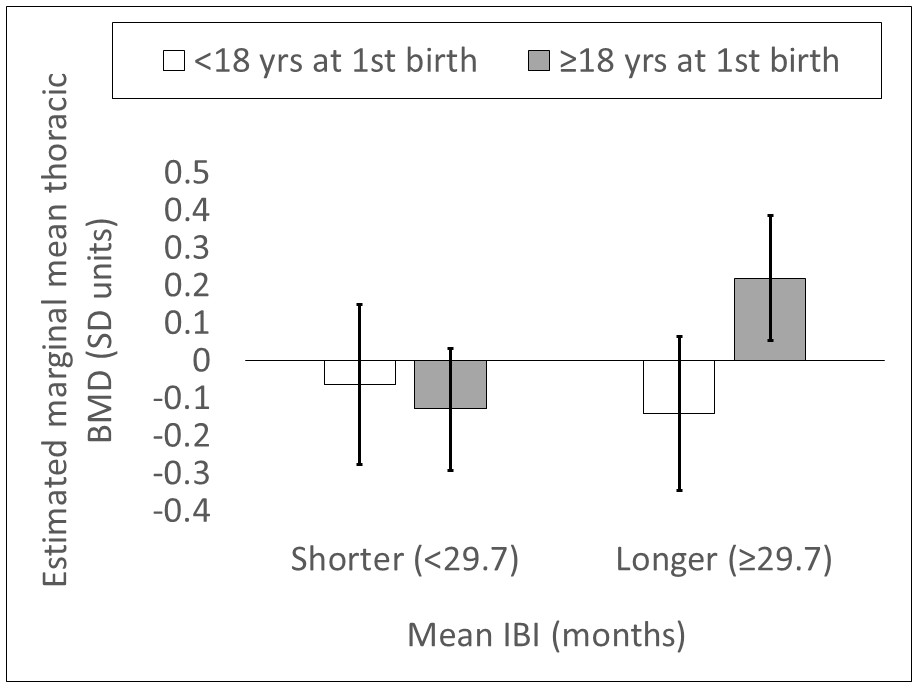
Estimated marginal mean thoracic vertebral BMD (SD units; 95% CI) by mean IBI and age at first birth (n = 212 Tsimane women).
Values are obtained from a general linear model including the following parameters: mean IBI <29.7 months dummy, age at first birth <18 years dummy, mean IBI <29.7 months dummy*age at first birth <18 years dummy, age, and fat-free mass. Mean IBI <29.7 months dummy*age at first birth <18 years dummy interaction p=0.027. Controls (age and fat-free mass) are held at sample means.
Author response image 1
Tables
Appendix 1—table 1
General linear model: effect of age at first birth on thoracic vertebral BMD for Tsimane women.
https://doi.org/10.7554/eLife.48607.008| Parameter | Std. β | p |
|---|---|---|
| Age at 1st birth (years, loggeda) | 0.099 | 0.036 |
| Age (years) | −0.665 | <0.001 |
| Fat-free mass (kg) | 0.106 | 0.031 |
| Adjusted R2 | 0.508 | |
| N | 213 |
-
aAge at first birth is not normally distributed and is thus log-transformed (Std. βAge at 1st birth [years]=0.110, p=0.019, controlling for age and fat-free mass).
Appendix 1—table 2
General linear models: effects of parity and age at first birth on thoracic vertebral BMD for Tsimane women.
Continuous and categorical parity measures (models 1–2, respectively) were added to the baseline model shown in Appendix 1—table 1.
| Model 1: continuous parity measure | Model 2: categorical parity measure | |||
|---|---|---|---|---|
| Parameter | Std. β | p | Std. β | p |
| # birthsa | −0.069 | 0.216 | ----- | ----- |
| >9 births (vs. ≤ 9 birthsb) | ----- | ----- | −0.123 | 0.219 |
| Age at 1st birth (years, logged) | 0.075 | 0.145 | 0.081 | 0.105 |
| Age (years) | −0.656 | <0.001 | −0.655 | <0.001 |
| Fat-free mass (kg) | 0.108 | 0.028 | 0.114 | 0.021 |
| Adjusted R2 | 0.509 | 0.509 | ||
| N | 213 | 213 | ||
-
aLogging # births does not substantively affect results.
bSubstituting other categorical measures of parity (e.g. quartiles) does not substantively affect results.
Appendix 1—table 3
General linear models: effects of mean IBI, parity and age at first birth on thoracic vertebral BMD for Tsimane women.
Continuous and categorical mean IBI measures (models 1–2 and models 3–4, respectively) were added to the models presented in Appendix 1—table 2. Variance inflation factors (all <1.6) do not indicate a high degree of multicollinearity.
| Model 1 | Model 2 | Model 3 | Model 4 | |||||
|---|---|---|---|---|---|---|---|---|
| Parameter | Std. β | p | Std. β | p | Std. β | p | Std. β | p |
| Mean IBI (monthsa) | 0.074 | 0.246 | 0.074 | 0.185 | ----- | ----- | ----- | ----- |
| Short mean IBI (<29.7 months; vs. ≥29.7b) | ----- | ----- | ----- | ----- | −0.185 | 0.084 | −0.184 | 0.075 |
| # births | −0.025 | 0.717 | ----- | ----- | −0.019 | 0.774 | ----- | ----- |
| >9 births (vs. ≤ 9 births) | ----- | ----- | −0.068 | 0.528 | ----- | ----- | −0.041 | 0.712 |
| Age at 1st birth (years, logged) | 0.090 | 0.092 | 0.089 | 0.076 | 0.102 | 0.060 | 0.102 | 0.046 |
| Age (years) | −0.664 | <0.001 | −0.661 | <0.001 | −0.661 | <0.001 | −0.659 | <0.001 |
| Fat-free mass (kg) | 0.107 | 0.029 | 0.111 | 0.025 | 0.106 | 0.031 | 0.108 | 0.029 |
| Adjusted R2 | 0.510 | 0.511 | 0.514 | 0.514 | ||||
| N | 212 | 212 | 212 | 212 | ||||
-
aLogging mean IBI does not substantively affect results.
bMean IBI is not calculated for parous women with only one birth (n = 1), hence the reduction in sample size relative to Appendix 1—tables 1–2.
Appendix 1—table 4
General linear model: reduced form including only significant (p<0.05) predictors of Tsimane women’s thoracic vertebral BMD.
https://doi.org/10.7554/eLife.48607.011| Parameter | Std. β | p |
|---|---|---|
| Short mean IBI (<29.7 months; vs. ≥ 29.7) | −0.201 | 0.032 |
| Age at 1st birth (years, logged) | 0.109 | 0.022 |
| Age (years) | −0.663 | <0.001 |
| Fat-free mass (kg) | 0.105 | 0.031 |
| Adjusted R2 | 0.517 | |
| N | 212 |
Appendix 1—table 5
General linear models: reduced model shown in Appendix 1—table 4 also controlling for indicators of modernization, that is, residential proximity to the closest market town of San Borja (models 1–3), Spanish fluency (model 2) and schooling (model 3).
| Model 1 | Model 2 | Model 3 | ||||
|---|---|---|---|---|---|---|
| Parameter | Std. β | p | Std. β | p | Std. β | p |
| Short mean IBI (<29.7 months;vs. ≥ 29.7) | −0.208 | 0.026 | −0.222 | 0.020 | −0.213 | 0.026 |
| Age at 1st birth (years, logged) | 0.124 | 0.010 | 0.141 | 0.004 | 0.139 | 0.005 |
| Age (years) | −0.665 | <0.001 | −0.673 | <0.001 | −0.675 | <0.001 |
| Fat-free mass (kg) | 0.105 | 0.031 | 0.112 | 0.023 | 0.113 | 0.022 |
| Close residential proximity to market town (<34.7 km; vs. ≥34.7a) | 0.165 | 0.080 | 0.147 | 0.126 | 0.157 | 0.102 |
| Spanish fluency (moderate or high vs. noneb) | ----- | ----- | −0.006 | 0.954 | ----- | ----- |
| Schooling (any vs. noneb) | ----- | ----- | ----- | ----- | 0.022 | 0.853 |
| Adjusted R2 | 0.521 | 0.521 | 0.522 | |||
| N | 212 | 207 | 207 | |||
-
aMedian split.
bData are missing for five women.
Appendix 1—table 6
General linear models: reduced model shown in Appendix 1—table 4 also controlling for residential proximity to the closest market town of San Borja (models 1–2), young age at menarche (model 1) and young age at menopause (model 2).
https://doi.org/10.7554/eLife.48607.014| Model 1 | Model 2 | |||
|---|---|---|---|---|
| Parameter | Std. β | p | Std. β | p |
| Short mean IBI (<29.7 months;vs. ≥ 29.7) | −0.177 | 0.068 | −0.250 | 0.020 |
| Age at 1st birth (years, logged) | 0.132 | 0.008 | 0.163 | 0.002 |
| Age (years) | −0.659 | <0.001 | −0.676 | <0.001 |
| Fat-free mass (kg) | 0.133 | 0.009 | 0.136 | 0.017 |
| Close residential proximity to market town (<34.7 km;vs. ≥ 34.7) | 0.112 | 0.253 | 0.078 | 0.464 |
| Young age at menarche (<13.3 years vs. ≥ 13.3 a,b) | 0.008 | 0.933 | ----- | ----- |
| Young age at menopause (<50 years vs. ≥ 50 a,c) | ----- | ----- | −0.176 | 0.120 |
| Adjusted R2 | 0.543 | 0.559 | ||
| N | 188 | 152 | ||
-
aMedian split.
bData are missing for 24 women.
-
cSome women either haven’t yet experienced menopause or cannot recall when they experienced menopause, hence the reduction in sample size for model 2.
Appendix 1—table 7
Mean thoracic vertebral BMD (mg/cm3) for Tsimane and Americansa by age category and sex.
https://doi.org/10.7554/eLife.48607.015| Age category (years) | Women | Men | Total | ||||||
|---|---|---|---|---|---|---|---|---|---|
| Tsimane (N) | USc(N) | % difference (from US baseline)d | Tsimane (N) | USc (N) | % difference (from US baseline)d | Tsimane (N) | USc (N) | % difference (from US baseline)d | |
| 40–49 | 192.89 (80) | 204.33 (492) | −5.60 (p=0.004) | 192.33 (77) | 194.32 (895) | −1.02 (p=0.547) | 192.62 (157) | 197.87 (1387) | −2.65 (p=0.040) |
| 50–59 | 160.43 (89) | 177.79 (1164) | −9.76 (p<0.001) | 180.06 (98) | 173.13 (1708) | 4.00 (p=0.027) | 170.72 (187) | 175.02 (2872) | −2.46 (p=0.076) |
| 60–69 | 132.79 (49) | 153.90 (1204) | −13.72 (p=0.001) | 150.26 (56) | 158.46 (1422) | −5.18 (p=0.069) | 142.11 (105) | 156.37 (2626) | −9.12 (p<0.001) |
| ≥70b | 103.29 (27) | 127.14 (1048) | −18.76 (p<0.001) | 135.82 (31) | 139.27 (1097) | −2.48 (p=0.543) | 120.68 (58) | 133.34 (2145) | −9.50 (p=0.005) |
| Totale | 163.85 (245) | 179.91 (3908) | −8.93 (-----) | 176.21 (262) | 176.64 (5122) | −0.24 (-----) | 170.37 (507) | 177.61 (9030) | −4.08 (-----) |
-
aUS data represent asymptomatic subjects from greater Los Angeles (described in Budoff et al., 2010). Briefly, 9585 subjects (43% female; mean age = 56) underwent coronary artery calcification (CAC) scanning for evaluation of subclinical atherosclerosis, after exclusion of participants with vertebral deformities or fractures. Subjects had no known bone disease.
bMaximum age for Tsimane women and men = 91 and 94 years, respectively (US maximum age = 90 for both sexes).
-
cUS means are weighted by sample sizes (shown in Table 1 of Budoff et al., 2010). This table reports age sub-groups in two-year intervals (e.g. 41–42, 43–44, etc.); for two-year intervals spanning multiple decades that overlap with the age categories shown in this table (i.e. 39–40, 49–50, 59–60 and 69–70), we assume that each year of the two-year interval contributes 50% of the sample.
dP-value from a one-sample t test, including as the test value the weighted mean from Budoff et al. (2010).
-
eAge-standardized means are shown to account for differences in age distributions across populations. We use the Tsimane adult age distribution (calculated from the 2015 THLHP census) as the standard. To calculate age-standardized means, means for each age category and population (i.e. unadjusted means for Tsimane and weighted means for US) are multiplied by the proportional representation of that age category in the 2015 THLHP census, and then summed across all age categories.
Appendix 1—table 8
Age-specific thoracic vertebral (T6-T12) fracture prevalence (% with fracture grade ≥1) for Tsimane and Americansa by sexb.
https://doi.org/10.7554/eLife.48607.016| Age category (years) | Women (n = 491) | Men (n = 524) | Total (n = 1,015) | |||
|---|---|---|---|---|---|---|
| Tsimane (95% CI) | US (95% CI) | Tsimane (95% CI) | US (95% CI) | Tsimane (95% CI) | US (95% CI) | |
| 40–49 | 14 (6–21) | 4 (<1–8) | 34 (23–45) | 12 (4–19) | 24 (17–30) | 8 (3–12) |
| 50–59 | 25 (16–34) | 15 (7–23) | 37 (27–46) | 9 (4–15) | 31 (24–38) | 12 (7–16) |
| 60–69 | 20 (9–32) | 13 (4–22) | 36 (23–49) | 11 (2–20) | 29 (20–37) | 12 (6–18) |
| ≥70c | 15 (<1–29) | 9 (<1–21) | 43 (25–62) | 16 (2–29) | 30 (18–42) | 13 (4–22) |
| Total (crude) | 19 (14–24) | 11 (7–14) | 36 (31–42) | 11 (7–15) | 28 (24–32) | 11 (8–14) |
| Total (age-standardizedd) | 18 | 9 | 36 | 11 | 27 | 10 |
-
aUS data are from two sources: 1) a subset of MESA study participants (described in Budoff et al., 2011), and 2) a subset of study participants in the greater Los Angeles area (described in Budoff et al., 2013). Briefly, the MESA cohort is a longitudinal, population-based study of 6814 adults (54% female; mean age = 62) free of clinical cardiovascular disease, representing six areas in the US: Baltimore, MD, Chicago, IL, Forsyth County, NC, Los Angeles, CA, New York, NY, and St. Paul, MN. Regarding participants from the greater Los Angeles area, data were collected among 4126 asymptomatic subjects (51% female; mean age = 64) who underwent CAC scanning for evaluation of subclinical atherosclerosis. MESA and Los Angeles-only subsets were first matched for age and sex with the Tsimane sample, and then merged to create a single US comparison sample.
bFor women (n = 245 Tsimane and 246 US), sample sizes for ages 40–49 are 80 Tsimane and 77 US, for ages 50–59 89 Tsimane and 86 US, for ages 60–69 49 Tsimane and 60 US, and for ages 70+ 27 Tsimane and 23 US. For men (n = 261 Tsimane and 263 US), sample sizes for ages 40–49 are 77 Tsimane and 69 US, for ages 50–59 98 Tsimane and 108 US, for ages 60–69 56 Tsimane and 54 US, and for ages 70+ 30 Tsimane and 32 US.
-
cMaximum age for Tsimane women and men = 91 and 94 years, respectively. Maximum age for US women and men = 92 and 91 years, respectively.
dAge-standardized prevalences are shown to account for differences in age distributions across populations. We use the Tsimane adult age distribution (calculated from the 2015 THLHP census) as the standard. Prevalence for each age category and population is multiplied by the proportional representation of that age category in the 2015 THLHP census, and then summed across all age categories.
Appendix 1—table 9
Age-specific thoracic vertebral (T6-T12) fracture prevalence (% with fracture grade ≥2) for Tsimane and Americans by sex.
https://doi.org/10.7554/eLife.48607.017| Age category (years) | Women (n = 491) | Men (n = 524) | Total (n = 1,015) | |||
|---|---|---|---|---|---|---|
| Tsimane (95% CI) | US (95% CI) | Tsimane (95% CI) | US (95% CI) | Tsimane (95% CI) | US (95% CI) | |
| 40–49 | 5 (<1–10) | 0 (--) | 5 (<1–10) | 1 (<1–4) | 5 (2–9) | 1 (<1–2) |
| 50–59 | 8 (2–14) | 3 (<1–7) | 14 (7–21) | 2 (<1–4) | 11 (7–16) | 3 (<1–5) |
| 60–69 | 4 (<1–10) | 3 (<1–8) | 9 (1–17) | 7 (<1–15) | 7 (2–12) | 5 (1–9) |
| ≥70 | 11 (<1–24) | 4 (<1–13) | 23 (7–39) | 3 (<1–9) | 18 (7–28) | 4 (<1–9) |
| Total (crude) | 7 (3–10) | 2 (<1–4) | 11 (8–15) | 3 (1–5) | 9 (7–12) | 3 (1–4) |
| Total (age-standardized) | 6 | 2 | 10 | 2 | 8 | 3 |
Appendix 1—table 10
Log-binomial generalized linear models: women’s adjusted relative risk of fracture (95% CI) by population and fracture grade controlling for age (n=491).
https://doi.org/10.7554/eLife.48607.018| Parameter | Model one outcome: grade 0.5 fracture (borderline) | Model two outcome: grade one fracture (mild) | Model three outcome: grade two fracture (moderate) | Model four outcome: grade three fracture (severe) |
|---|---|---|---|---|
| Tsimane (vs. American) | 1.14 (0.80–1.64) | 1.56¶ (0.91–2.65) | 3.01* (1.11–8.17) | 1.33 (0.09–18.92) |
| Age (per SD increase) | 1.04 (0.87–1.23) | 1.05 (0.82–1.34) | 1.02 (0.68–1.55) | 6.26** (1.46–26.79) |
-
**p≤0.01 *p≤0.05 ¶p≤0.1
Appendix 1—table 11
Log-binomial generalized linear models: men’s adjusted relative risk of thoracic vertebral (T6-T12) fracture (95% CI) by population and fracture grade controlling for age (n = 524).
https://doi.org/10.7554/eLife.48607.019| Parameter | Model one outcome: grade 0.5 fracture (borderline) | Model two outcome: grade one fracture (mild) | Model three outcome: grade two fracture (moderate) | Model four outcome: grade three fracture (severe) |
|---|---|---|---|---|
| Tsimane (vs. American) | 2.27*** (1.58–3.27) | 3.12*** (1.97–4.95) | 4.70*** (1.98–11.17) | 1.48 (0.21–10.63) |
| Age (per SD increase) | 0.88 (0.74–1.04) | 0.99 (0.81–1.19) | 1.16 (0.86–1.56) | 4.79*** (1.94–11.81) |
-
***p≤0.001 **p≤0.01 *p≤0.05 ¶p≤0.1
Appendix 1—table 12
Sample characteristics for Tsimane women (n = 245) with and without any thoracic vertebral (T6-T12) fracture (grade ≥1).
https://doi.org/10.7554/eLife.48607.020| A) Fracture (n=47a) | B) No fracture (n=198a) | A vs. Bb | |||
|---|---|---|---|---|---|
| Variable | Mean | SE | Mean | SE | |
| Thoracic vertebral BMD (mg/cm3) | 142.66 | 5.93 | 163.13 | 3.20 | p=0.006 |
| Age (years) | 56.67 | 1.45 | 56.09 | 0.73 | p=0.490 |
| Height (cm) | 149.79 | 0.63 | 150.47 | 0.38 | p=0.631 |
| Weight (kg) | 56.07 | 1.71 | 54.40 | 0.68 | p=0.404 |
| BMI (kg/m2) | 24.94 | 0.72 | 23.99 | 0.27 | p=0.355 |
| Body fat (%) | 26.83 | 1.34 | 25.49 | 0.55 | p=0.344 |
| Fat mass (kg) | 15.72 | 1.23 | 14.37 | 0.48 | p=0.403 |
| Fat-free mass (kg) | 40.14 | 0.93 | 40.03 | 0.37 | p=0.930 |
| Age at menarche (years) | 13.21 | 0.09 | 13.32 | 0.04 | p=0.352 |
| Age at menopause (years) | 49.76 | 0.64 | 49.16 | 0.30 | p=0.408 |
| Age at first birth (years) | 18.49 | 0.67 | 18.91 | 0.28 | p=0.427 |
| Parity (# births) | 9.72 | 0.54 | 8.89 | 0.22 | p=0.072 |
| Mean inter-birth interval (months) | 30.69 | 2.61 | 34.34 | 1.17 | p=0.010 |
| Residential proximity to market (km) | 49.01 | 5.28 | 50.63 | 2.71 | p=0.955 |
| Spanish fluency (1 = fluent/moderate; 0 = none) | 0.24 | 0.07 | 0.37 | 0.04 | p=0.114 |
| Schooling (# years) | 0.36 | 0.15 | 0.59 | 0.10 | p=0.318 |
-
aRepresents maximum possible sample size (i.e. no missing data).
bP-value from Mann-Whitney U or χ² test.
Appendix 1—table 13
Log-binomial generalized linear models: effects of thoracic vertebral BMD (models 1–2) and mean IBI (model 2) on the probability of thoracic vertebral (T6-T12) fracture (grade ≥1) for Tsimane women.
Relative risk (95% CI) is shown per SD increase.
| Model 1: controlling for age and anthropometrics | Model 2: + mean IBI | |||||
|---|---|---|---|---|---|---|
| Parameter | Exp(β) | 95% CI | p | Exp(β) | 95% CI | p |
| Thoracic vertebral BMD (mg/cm3) | 0.542 | 0.352–0.837 | 0.006 | 0.540 | 0.345–0.845 | 0.007 |
| Mean IBI (months) | ----- | ----- | ----- | 0.379 | 0.165–0.866 | 0.021 |
| Age (years) | 0.676 | 0.449–1.017 | 0.061 | 0.640 | 0.423–0.968 | 0.034 |
| Height (cm) | 0.868 | 0.660–1.141 | 0.310 | 0.881 | 0.662–1.172 | 0.385 |
| Fat mass (kg) | 1.278 | 0.978–1.670 | 0.073 | 1.291 | 1.006–1.658 | 0.045 |
| N | 219 | 212 | ||||
Appendix 1—table 14
Log-binomial generalized linear models: effects of thoracic vertebral BMD and mean IBI on the probability of thoracic vertebral (T6-T12) fracture for Tsimane women (n = 212) by fracture grade.
Grade 3 (severe) fracture risk is not modeled because no grade three cases are present for the sample of women with complete data. Relative risk (95% CI) is shown per SD increase.
| Parameter | Model one outcome: grade 0.5 fracture (borderline) | Model two outcome: grade one fracture (mild) | Model three outcome: grade two fracture (moderate) |
|---|---|---|---|
| Thoracic vertebral BMD (mg/cm3) | 0.92 (0.62–1.36) | 0.73 (0.43–1.24) | 0.27** (0.10–0.71) |
| Mean IBI (months) | 1.02 (0.81–1.29) | 0.33* (0.12–0.93) | 0.49 (0.09–2.72) |
| Age (years) | 1.06 (0.76–1.49) | 0.85 (0.51–1.41) | 0.34** (0.16–0.72) |
| Height (cm) | 1.01 (0.76–1.34) | 1.00 (0.71–1.40) | 0.63 (0.32–1.25) |
| Fat mass (kg) | 0.77¶ (0.57–1.05) | 1.26¶ (0.97–1.63) | 1.25 (0.64–2.45) |
-
**p≤0.01 *p≤0.05 ¶p≤0.1
Appendix 1—table 15
Sample characteristics for Tsimane men (n = 261) with and without any thoracic vertebral (T6-T12) fracture (grade ≥1).
https://doi.org/10.7554/eLife.48607.023| A) Fracture (n=95a) | B) No fracture (n=166a) | A vs. Bb | |||
|---|---|---|---|---|---|
| Variable | Mean | SE | Mean | SE | |
| Thoracic vertebral BMD (mg/cm3) | 169.61 | 3.84 | 173.64 | 2.80 | p=0.454 |
| Age (years) | 57.04 | 1.07 | 55.74 | 0.71 | p=0.392 |
| Height (cm) | 160.60 | 0.53 | 161.86 | 0.43 | p=0.034 |
| Weight (kg) | 63.33 | 0.94 | 61.96 | 0.57 | p=0.303 |
| BMI (kg/m2) | 24.49 | 0.29 | 23.63 | 0.19 | p=0.014 |
| Body fat (%) | 19.05 | 0.76 | 16.80 | 0.46 | p=0.026 |
| Fat mass (kg) | 12.46 | 0.63 | 10.56 | 0.35 | p=0.034 |
| Fat-free mass (kg) | 51.22 | 0.68 | 51.39 | 0.47 | p=0.936 |
| Residential proximity to market (km) | 51.28 | 3.80 | 56.60 | 3.07 | p=0.315 |
| Spanish fluency (1 = fluent/moderate;0 = none) | 0.77 | 0.05 | 0.82 | 0.03 | p=0.404 |
| Schooling (# years) | 2.02 | 0.38 | 1.70 | 0.24 | p=0.639 |
-
aRepresents maximum possible sample size (i.e. no missing data).
bP-value from Mann-Whitney U or χ² test.
Appendix 1—table 16
Log-binomial generalized linear model: effect of thoracic vertebral BMD on the probability of thoracic vertebral (T6-T12) fracture (grade ≥1) for Tsimane men (n=227a).
Relative risk (95% CI) is shown per SD increase.
| Parameter | Exp(β) | 95% CI | p |
|---|---|---|---|
| Thoracic vertebral BMD (mg/cm3) | 1.046 | 0.862–1.269 | 0.650 |
| Age (years) | 1.010 | 0.822–1.241 | 0.924 |
| Height (cm) | 0.822 | 0.701–0.963 | 0.015 |
| Fat mass (kg) | 1.366 | 1.176–1.587 | <0.001 |
-
aFracture data are missing for one man with BMD and anthropometric data. We also omitted a man whose height (138.2 cm) was 4.3 SDs below the mean.
Appendix 1—table 17
Log-binomial generalized linear models: effect of thoracic vertebral BMD on the probability of thoracic vertebral (T6-T12) fracture for Tsimane men by fracture grade.
Relative risk (95% CI) is shown per SD increase.
| Parameter | Model one outcome: grade 0.5 fracture (borderline) | Model two outcome: grade one fracture (mild) | Model three outcome: grade two fracture (moderate) | Model four outcome: grade three fracture (severe) |
|---|---|---|---|---|
| Thoracic vertebral BMD (mg/cm3) | 0.76*a (0.60–0.96) | 0.96 (0.73–1.26) | 1.24a (0.83–1.84) | 0.49 (0.02–11.09) |
| Age (years) | 0.81¶a (0.64–1.03) | 0.82 (0.61–1.10) | 1.40¶a (0.93–2.12) | 2.87 (0.24–34.91) |
| Height (cm) | 1.18¶b (0.98–1.42) | 0.75** (0.60–0.93) | 0.94c (0.65–1.37) | 0.70 (0.11–4.60) |
| Fat mass (kg) | 0.80*a (0.65–0.995) | 1.41*** (1.15–1.73) | 1.26a (0.90–1.78) | 0.81 (0.09–7.46) |
| N | 227a | 227 | 227a | 227 |
-
***p≤0.001 **p≤0.01 *p≤0.05 ¶p≤0.1
aModel parameters include BMD, age and fat mass (not height). Joint inclusion of both height and fat mass yields invalid estimates.
-
bModel parameters include BMD (adjusted RR = 0.75, 95% CI: 0.61–0.92, p=0.006), age (adjusted RR = 0.84, 95% CI: 0.66–1.07, p=0.159) and height (not fat mass, n = 253).
cModel parameters include BMD (adjusted RR = 1.21, 95% CI: 0.81–1.82, p=0.358), age (adjusted RR = 1.40, 95% CI: 0.92–2.14, p=0.116) and height (not fat mass, n = 253).
Appendix 1—table 18
Descriptives for all study variablesa.
https://doi.org/10.7554/eLife.48607.026| Variable | N | Mean | SD | Min | Max |
|---|---|---|---|---|---|
| Thoracic vertebral BMD (mg/cm3) | 507 | 165.85 | 41.27 | 68.91 | 314.99 |
| Any thoracic vertebral (T6-T12) fracture (% grade ≥ 1) | 506 | 0.28 | 0.45 | 0.00 | 1.00 |
| Age (years) | 507 | 56.25 | 9.95 | 41.00 | 94.00 |
| Sex (% male) | 507 | 0.52 | 0.50 | 0.00 | 1.00 |
| Height (cm) | 493 | 156.05 | 7.60 | 136.00 | 176.30 |
| Weight (kg) | 493 | 58.70 | 9.73 | 34.60 | 96.90 |
| BMI (kg/m2) | 493 | 24.05 | 3.33 | 16.33 | 38.11 |
| Body fat (%) | 448 | 21.57 | 8.00 | 5.00 | 46.70 |
| Fat mass (kg) | 448 | 12.88 | 6.04 | 1.95 | 42.12 |
| Fat-free mass (kg) | 448 | 45.80 | 7.85 | 27.81 | 73.08 |
| Age at menarche (years) | 214 | 13.30 | 0.56 | 11.75 | 16.29 |
| Age at menopause (yearsb) | 173 | 49.28 | 3.56 | 37.00 | 55.50 |
| Age at first birth (years) | 235 | 18.83 | 3.91 | 12.00 | 37.00 |
| Parity (# live births) | 245 | 9.05 | 3.27 | 0.00 | 17.00 |
| Mean inter-birth interval (months) | 231 | 33.68 | 16.27 | 14.02 | 142.37 |
| Residential proximity to market (km) | 507 | 52.62 | 38.22 | 4.71 | 153.61 |
| Spanish fluency (1 = fluent/moderate;0 = none) | 451 | 0.58 | 0.50 | 0.00 | 1.00 |
| Schooling (# years) | 450 | 1.19 | 2.47 | 0.00 | 15.00 |
-
aData were missing for various reasons (see supplementary text for details).
b185 of the 245 participating women (76%) were post-menopausal. 12 women were post-menopausal but could not recall their age at menopause. The remaining 60 women (245-185) were either pre-menopausal (n = 36) or missing data regarding menopausal status (n = 24). Women were categorized as post-menopausal if they reported during THLHP medical exams not having experienced a menstrual cycle in the past year, and were neither pregnant nor lactating at the time of the study.
Appendix 1—table 19
General linear models: anthropometric predictors of thoracic vertebral BMD (mg/cm3) for women.
Height is included in models 1 and 3, weight in models 2, 3 and 5, body mass index (BMI) in model 4, body fat (% or fat mass) in models 5–6, and fat-free mass in model 6. Age is controlled in all models. Standardized betas are shown (intercepts omitted).
| Parameter | Model 1 | Model 2 | Model 3 | Model 4 | Model 5 | Model 6 |
|---|---|---|---|---|---|---|
| Height (cma) | 0.040 | ----- | 0.013c | ----- | ----- | ----- |
| Weight (kga) | ----- | 0.080¶ | 0.075c | ----- | 0.130¶c | ----- |
| BMI (kg/m2a) | ----- | ----- | ----- | 0.070 | ----- | ----- |
| Body fat (%b) | ----- | ----- | ----- | ----- | −0.061c | ----- |
| Fat mass (kgb) | ----- | ----- | ----- | ----- | ----- | 0.021c |
| Fat-free mass (kgb) | ----- | ----- | ----- | ----- | ----- | 0.087c |
| Age (years) | −0.679*** | −0.670*** | −0.667*** | −0.681*** | −0.661*** | −0.659*** |
| Adjusted R2 | 0.484 | 0.489 | 0.487 | 0.488 | 0.498 | 0.498 |
| N | 238 | 238 | 238 | 238 | 219 | 219 |
-
***p≤0.001 **p≤0.01 *p≤0.05 ¶p≤0.1
aData are missing for seven women.
-
bData are missing for 26 women.
cVariance inflation factors do not indicate a high degree of multicollinearity.
Appendix 1—table 20
General linear models: anthropometric predictors of thoracic vertebral BMD (mg/cm3) for men.
Height is included in models 1 and 3, weight in models 2, 3 and 5, body mass index (BMI) in model 4, body fat (% or fat mass) in models 5–6, and fat-free mass in model 6. Age is controlled in all models. Standardized betas are shown (intercepts omitted).
| Parameter | Model 1 | Model 2 | Model 3 | Model 4 | Model 5 | Model 6 |
|---|---|---|---|---|---|---|
| Height (cma) | 0.028 | ----- | −0.062c | ----- | ----- | ----- |
| Weight (kga) | ----- | 0.137** | 0.170**c | ----- | 0.177**c | ----- |
| BMI (kg/m2a) | ----- | ----- | ----- | 0.135** | ----- | ----- |
| Body fat (%b) | ----- | ----- | ----- | ----- | −0.072c | ----- |
| Fat mass (kgb) | ----- | ----- | ----- | ----- | ----- | 0.022c |
| Fat-free mass (kgb) | ----- | ----- | ----- | ----- | ----- | 0.163**c |
| Age (years) | −0.578*** | −0.556*** | −0.561*** | −0.567*** | −0.508*** | −0.505*** |
| Adjusted R2 | 0.307 | 0.325 | 0.325 | 0.324 | 0.300 | 0.302 |
| N | 255 | 255 | 255 | 255 | 229 | 229 |
-
***p≤0.001 **p≤0.01 *p≤0.05 ¶p≤0.1
aData are missing for seven men.
-
bData are missing for 33 men.
cVariance inflation factors do not indicate a high degree of multicollinearity.
Additional files
-
Transparent reporting form
- https://doi.org/10.7554/eLife.48607.006
Download links
A two-part list of links to download the article, or parts of the article, in various formats.
Downloads (link to download the article as PDF)
Open citations (links to open the citations from this article in various online reference manager services)
Cite this article (links to download the citations from this article in formats compatible with various reference manager tools)
Computed tomography shows high fracture prevalence among physically active forager-horticulturalists with high fertility
eLife 8:e48607.
https://doi.org/10.7554/eLife.48607


