Tooth fracture frequency in gray wolves reflects prey availability
- University of California, Los Angeles, United States
- Michigan Technological University, United States
- National Park Service, Yellowstone National Park, United States
Figures
Figure 1
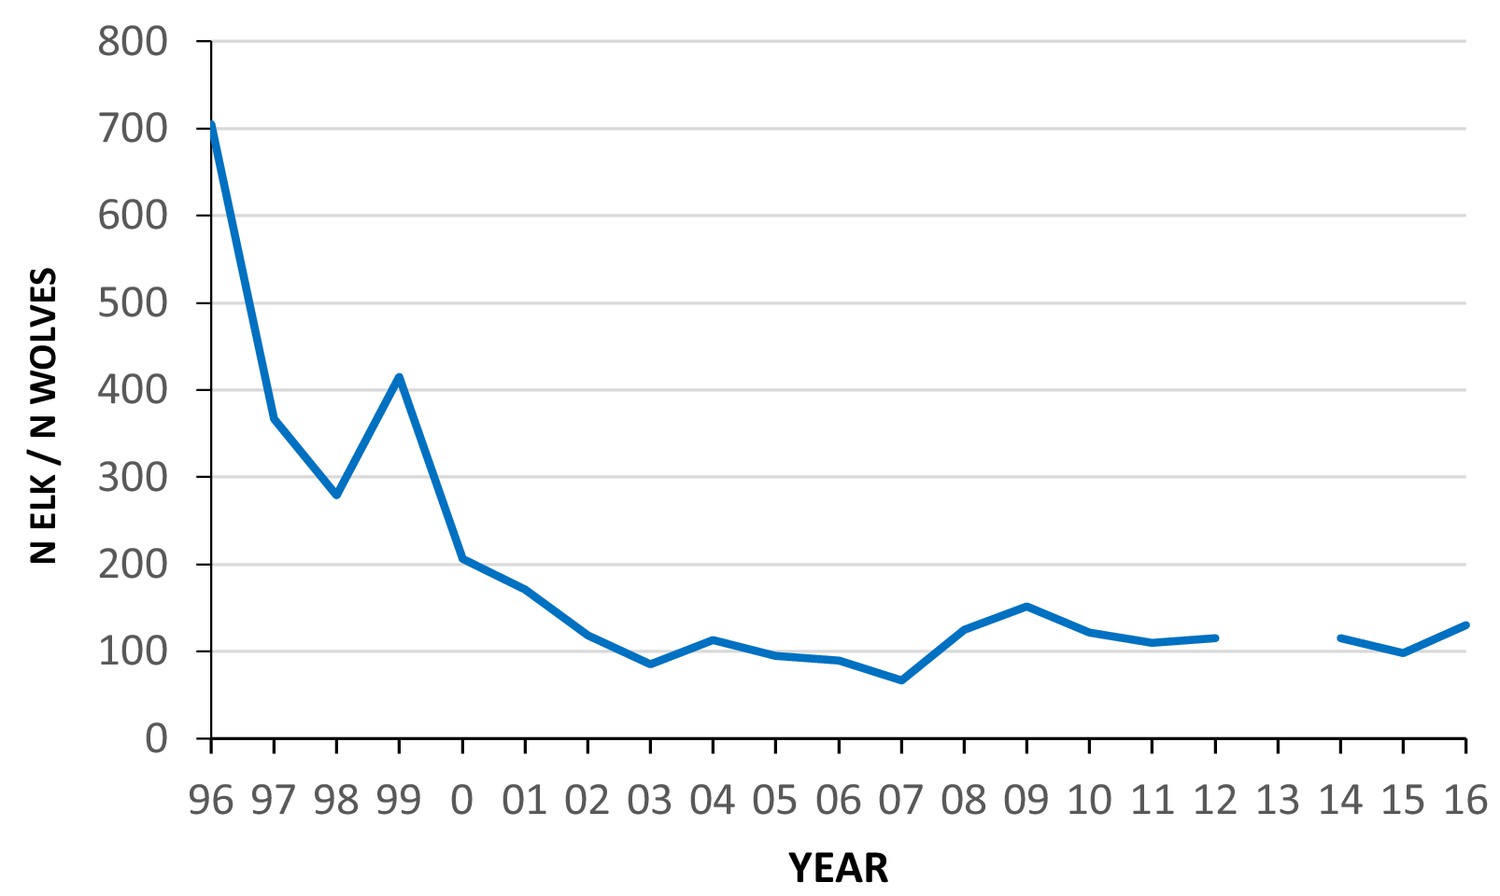
Estimated ratio of the number of elk (all ages, both sexes) to wolves in the northern range of Yellowstone National Park between 1996 and 2016.
Data from Northern Yellowstone Cooperative Wildlife Working Group and Yellowstone National Park.
Figure 2 with 1 supplement

with one supplement.
(Top) Percent of teeth broken for each tooth type within each sample. For tooth sample sizes see Supporting Information Supplementary file 1 Table S1. (Middle) Percentage of individuals assigned to each wear stage class within each sample. (Bottom) Percent of individuals in each age class (years) for the three samples with age data, YNP 1996–2006, YNP 2007–2016, and Isle Royale NP.
Figure 2—figure supplement 1
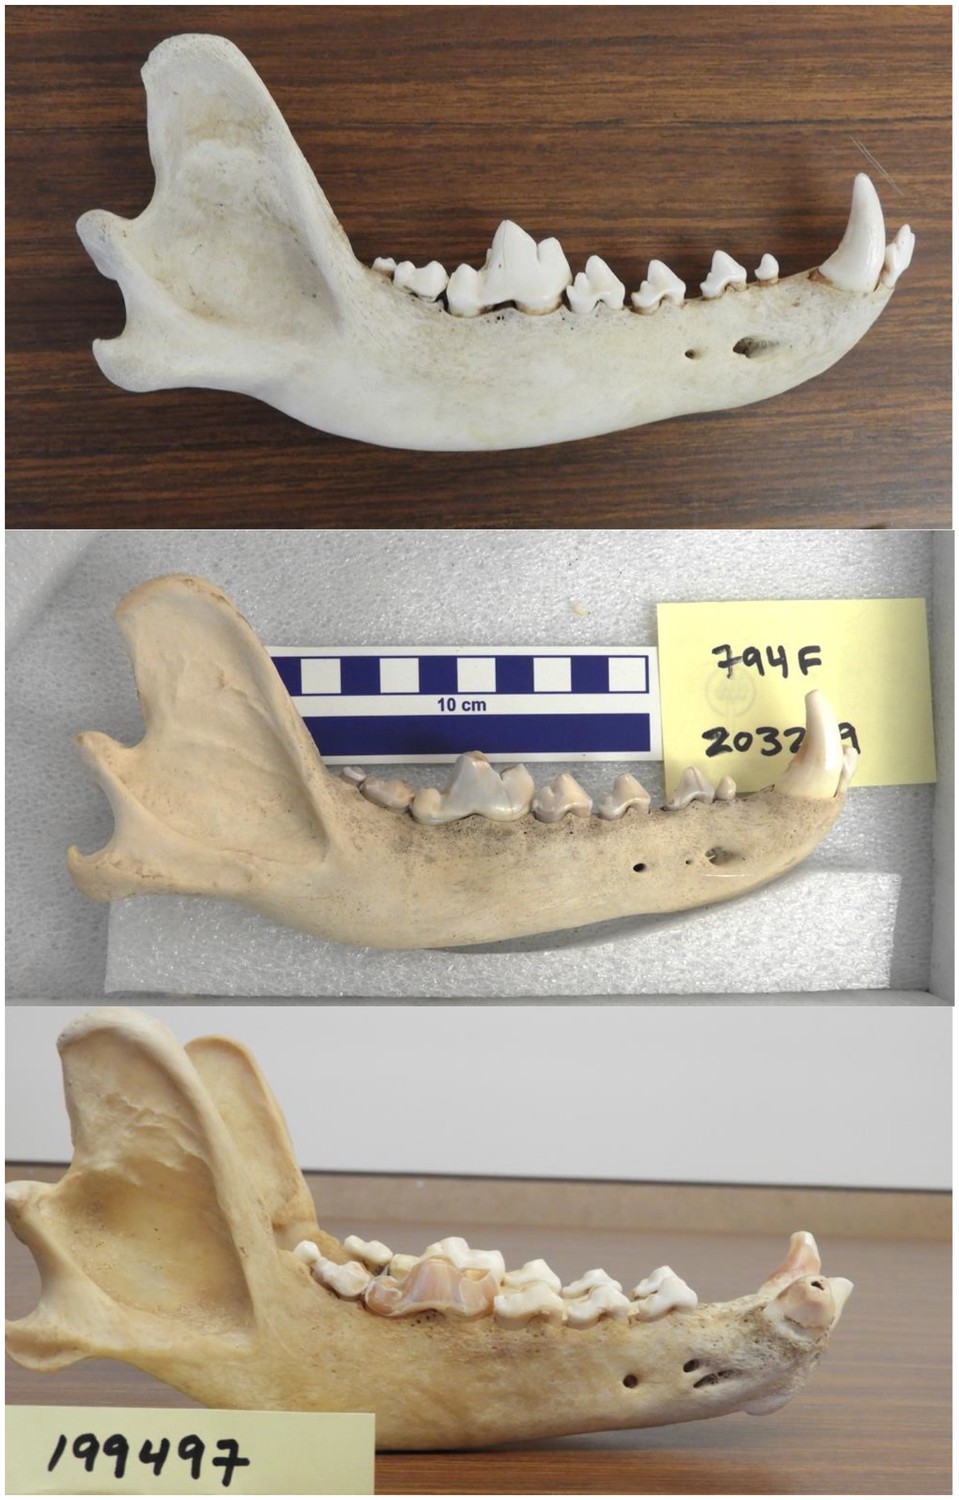
Examples of gray wolf mandibles showing slight (top), moderate (middle) and heavy (bottom) tooth wear.
Note the blunting of the cusps of the carnassial in the moderate and heavily worn individuals relative to the slightly worn individual. Note also the broken and worn lower right canine tooth in the heavily worn individual. The three specimens are Yellowstone National Park gray wolves housed in the Yellowstone Heritage and Research Center; specimen numbers as follows, YHRC 199495 (top), YHRC 203219 (middle), YHRC 199497 (bottom).
Figure 3
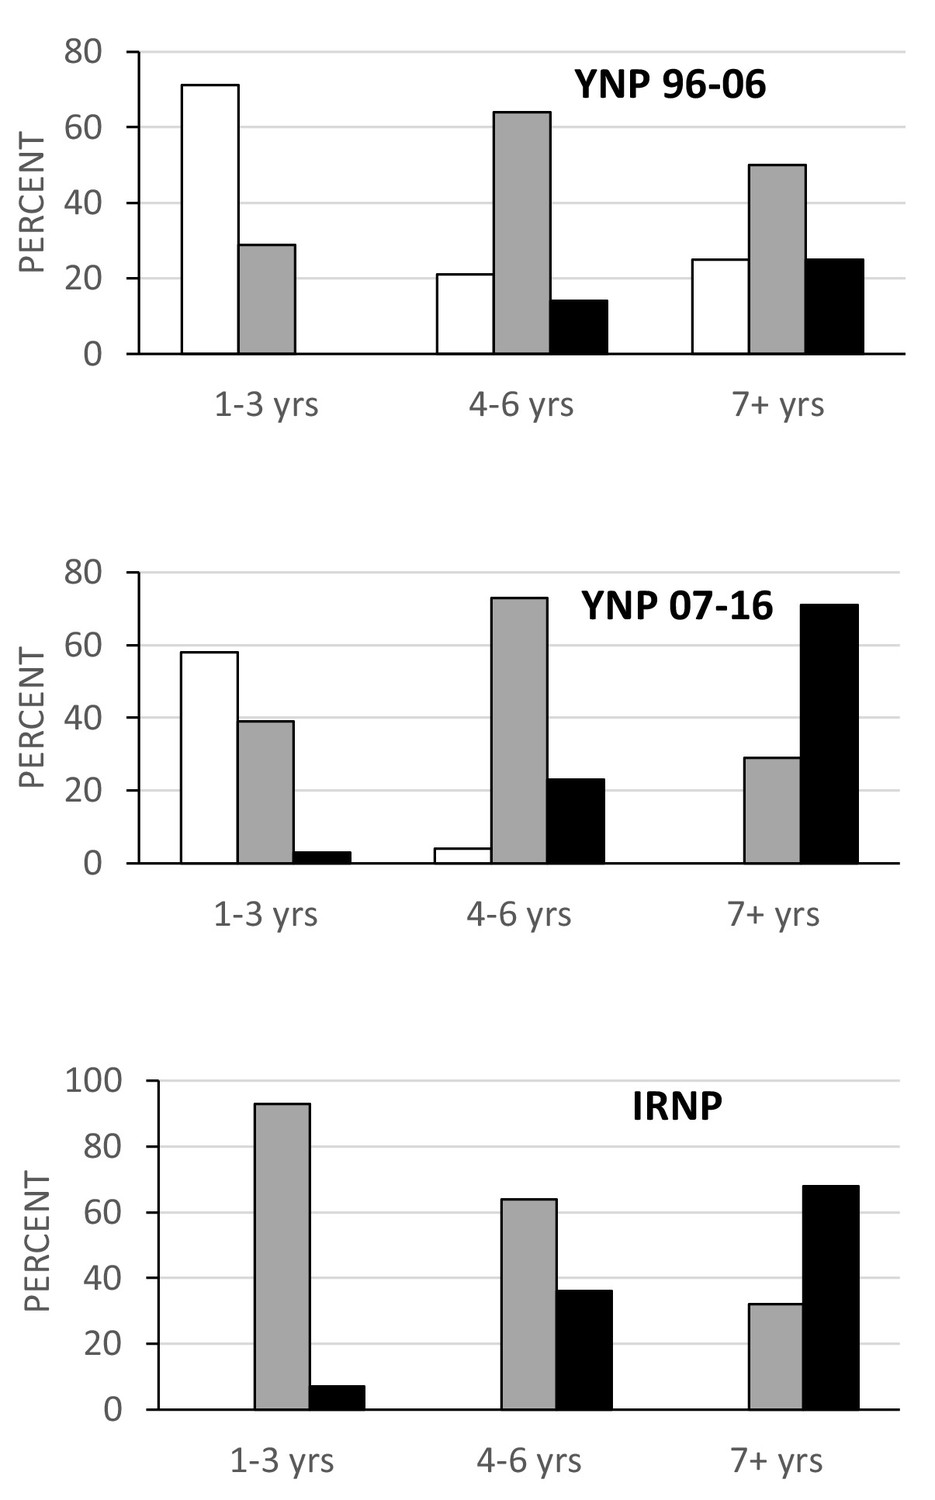
Proportion of individuals in each wear class grouped by age for the three samples with age data.
Wear class: slight, white; moderate, gray; heavy, black. Note the persistence of individuals in the slight wear class as they age in the early Yellowstone sample relative to the other two samples.
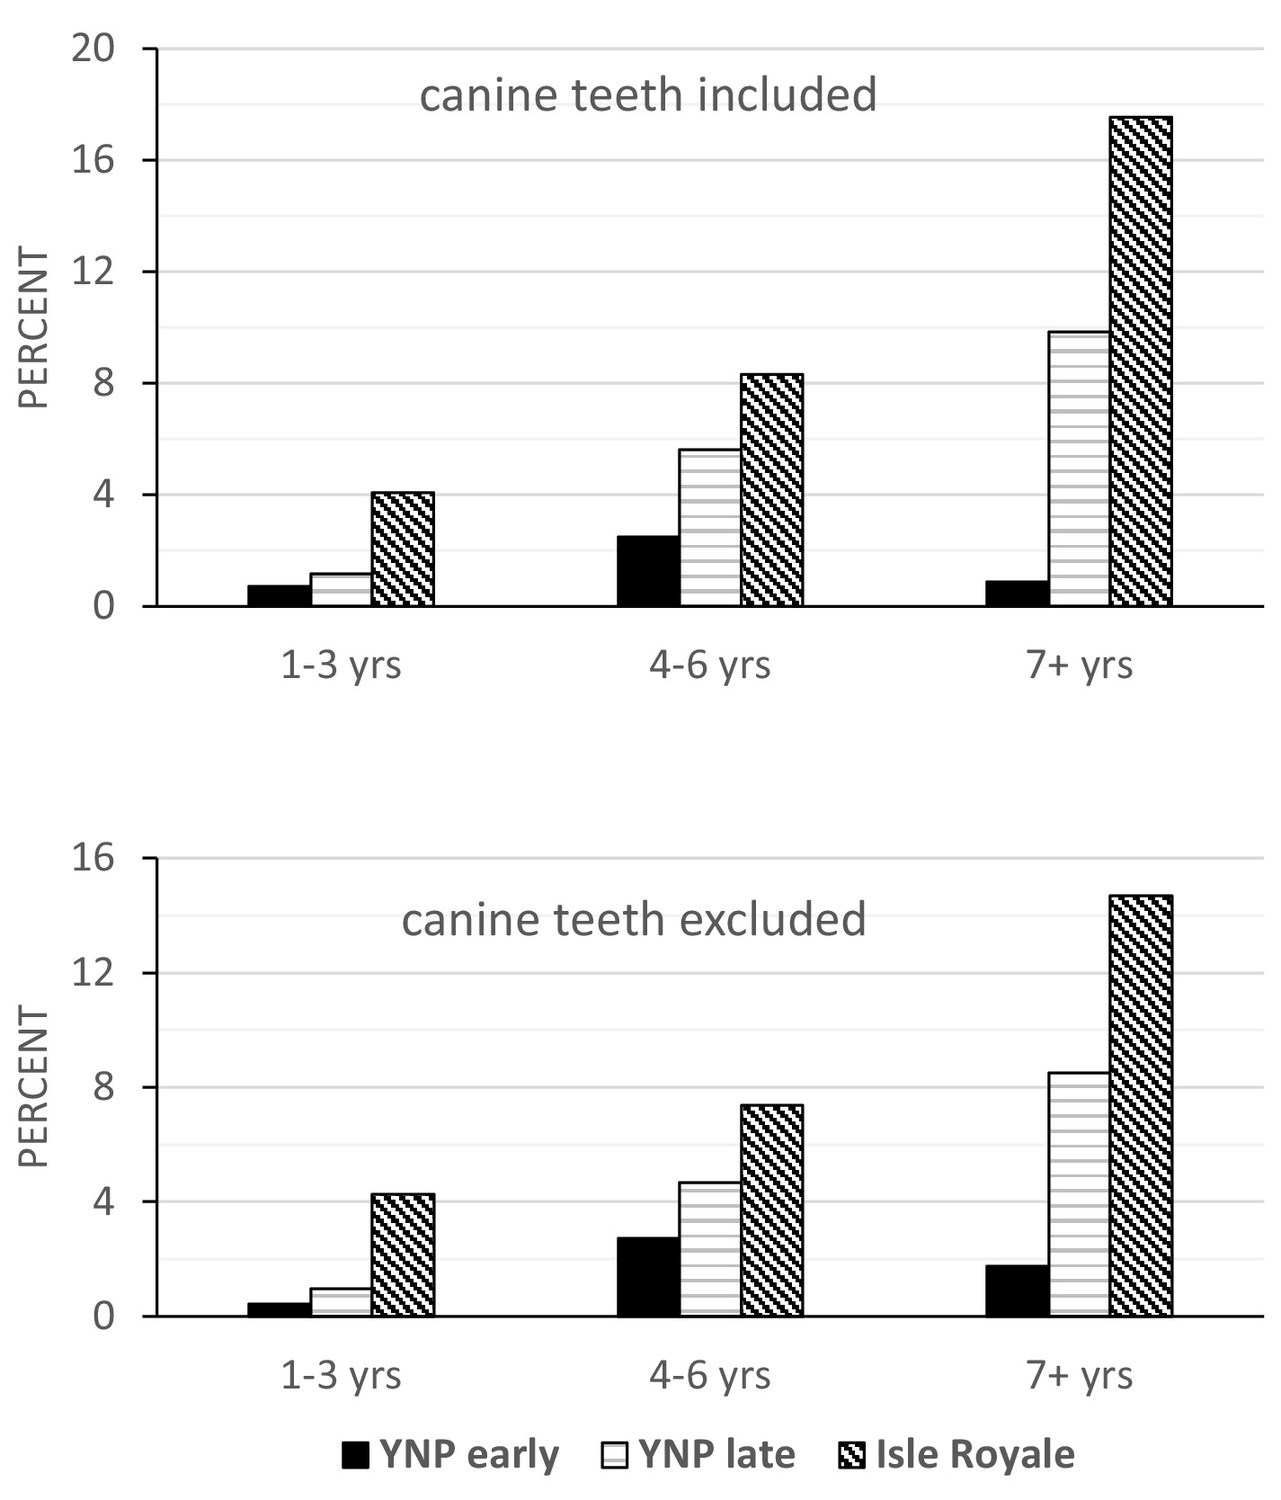
Figure 4 with 1 supplement
with one supplement.
Tooth fracture frequency on a per tooth basis relative to age class (in years) for Yellowstone 96–06, Yellowstone 07–16, and Isle Royale wolves, with canine teeth included (top) and excluded (bottom).
Figure 4—figure supplement 1
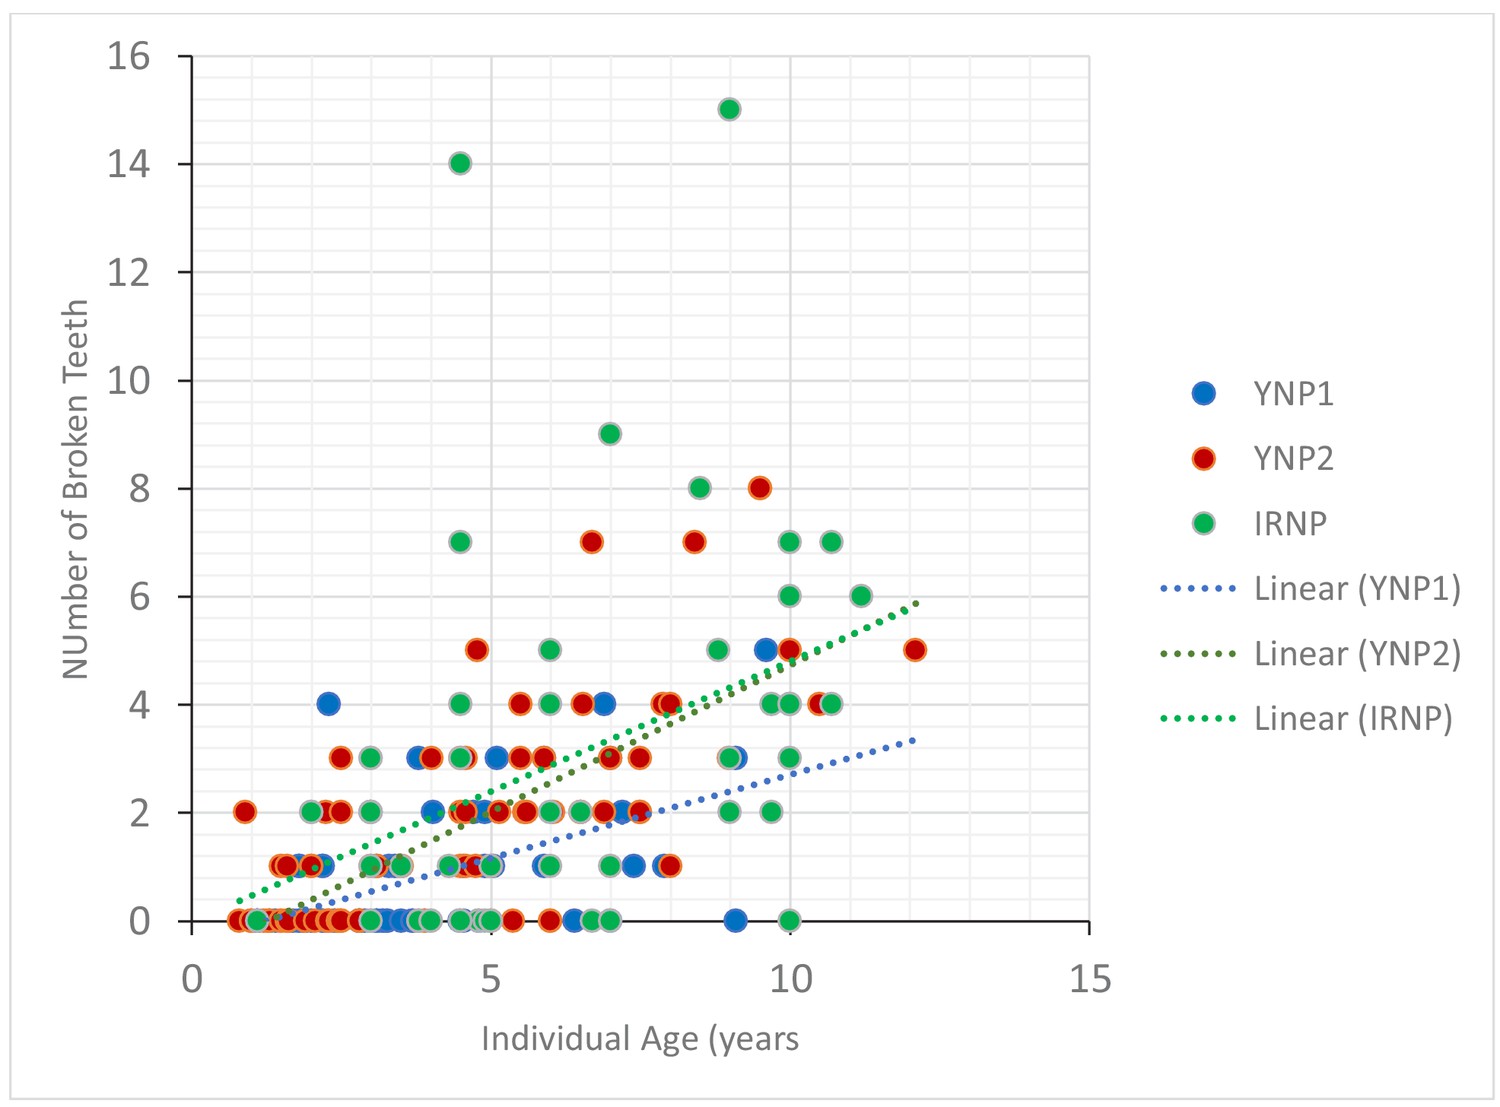
Scatter plot with separate linear regressions of the number of broken teeth relative to the age of an individual for the three samples with known-age wolves: blue, YNP1, Yellowstone 1997–2006; red, Yellowstone wolves, 2007–2016; green, Isle Royale National Park wolves.
Test for significant difference in slope values were negative when all three samples were compared, and between the YNP2 and IRNP samples. However, the slopes did differ significantly between the two Yellowstone samples. Regression equations: (YNP1) y = 0.31x-0.42, slope 95% C.I. 0.2–0.42; (YNP2) 0.54x-0.7, slope 95% C.I. 0.46–0.62; (IRNP) y = 0.48x-0.2, slope C.I. 0.31–0.66.
Figure 5
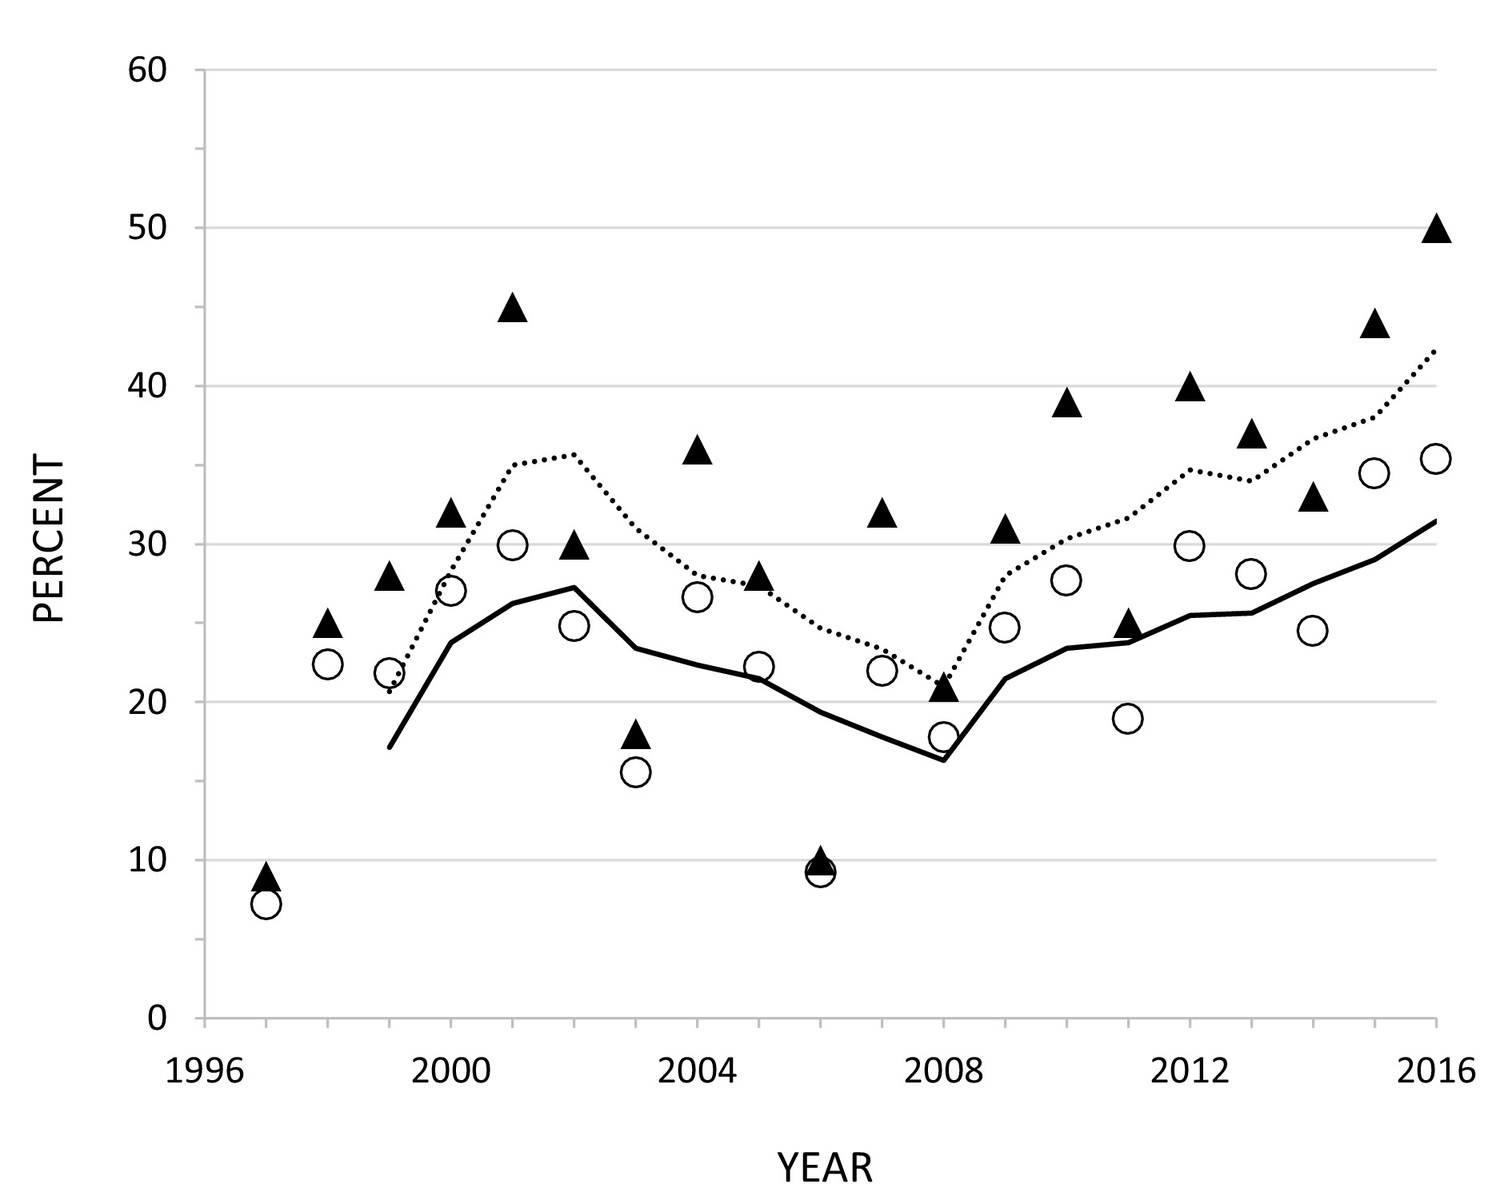
Proportion of all skeletal elements (open circles, solid line) and humeri only (triangles, dashed line) removed each year based on field necropsies of 2732 kills of adult elk in YNP between 1997 and 2016.
The lines represent 3 year simple moving averages. Supplemental Information Figure Legends.
Tables
Table 1
List of gray wolf skull samples indicating the number of individual skulls examined for each (N skulls), the total number of teeth (N teeth), the percent of individuals with at least one tooth broken, the percent of total teeth broken both with canine teeth included (% broken teeth) and excluded.
As noted in the text, fracture frequencies with and without canine teeth included did not differ significantly for any of the five samples.
| Sample | N (skulls) | N (teeth) | % individuals w/≥ 1 brkn tooth | % broken teeth | % broken teeth with canine teeth excluded |
|---|---|---|---|---|---|
| Isle Royale NP | 64 | 1866 | 71.9 | 8.6 | 7.4 |
| Scandinavia | 94 | 3778 | 33 | 1.7 | 1.5 |
| Other NA wolves* | 223 | 8619 | 47.1 | 3.4 | 3.1 |
| YNP, 1996–2006 | 77 | 2991 | 37.7 | 1.8 | 1.3 |
| YNP, 2007–2016 | 83 | 3237 | 64 | 4.6 | 3.9 |
-
*These include individuals from Alaska (n-74), Canada and Idaho (n = 66), and New Mexico and Texas (n = 83) For fracture frequency data for each of these, see Supplementary file 1, Table S1.
Additional files
-
Supplementary file 1
Additional data and figures on wolf tooth wear and fracture, as well as detailed carcass utilization data for Yellowstone National Park wolves.
- https://doi.org/10.7554/eLife.48628.011
-
Transparent reporting form
- https://doi.org/10.7554/eLife.48628.012
Download links
A two-part list of links to download the article, or parts of the article, in various formats.
Downloads (link to download the article as PDF)
Open citations (links to open the citations from this article in various online reference manager services)
Cite this article (links to download the citations from this article in formats compatible with various reference manager tools)
Tooth fracture frequency in gray wolves reflects prey availability
eLife 8:e48628.
https://doi.org/10.7554/eLife.48628


