Kinesin and dynein use distinct mechanisms to bypass obstacles
- University of California, Berkeley, United States
Figures
Figure 1 with 1 supplement
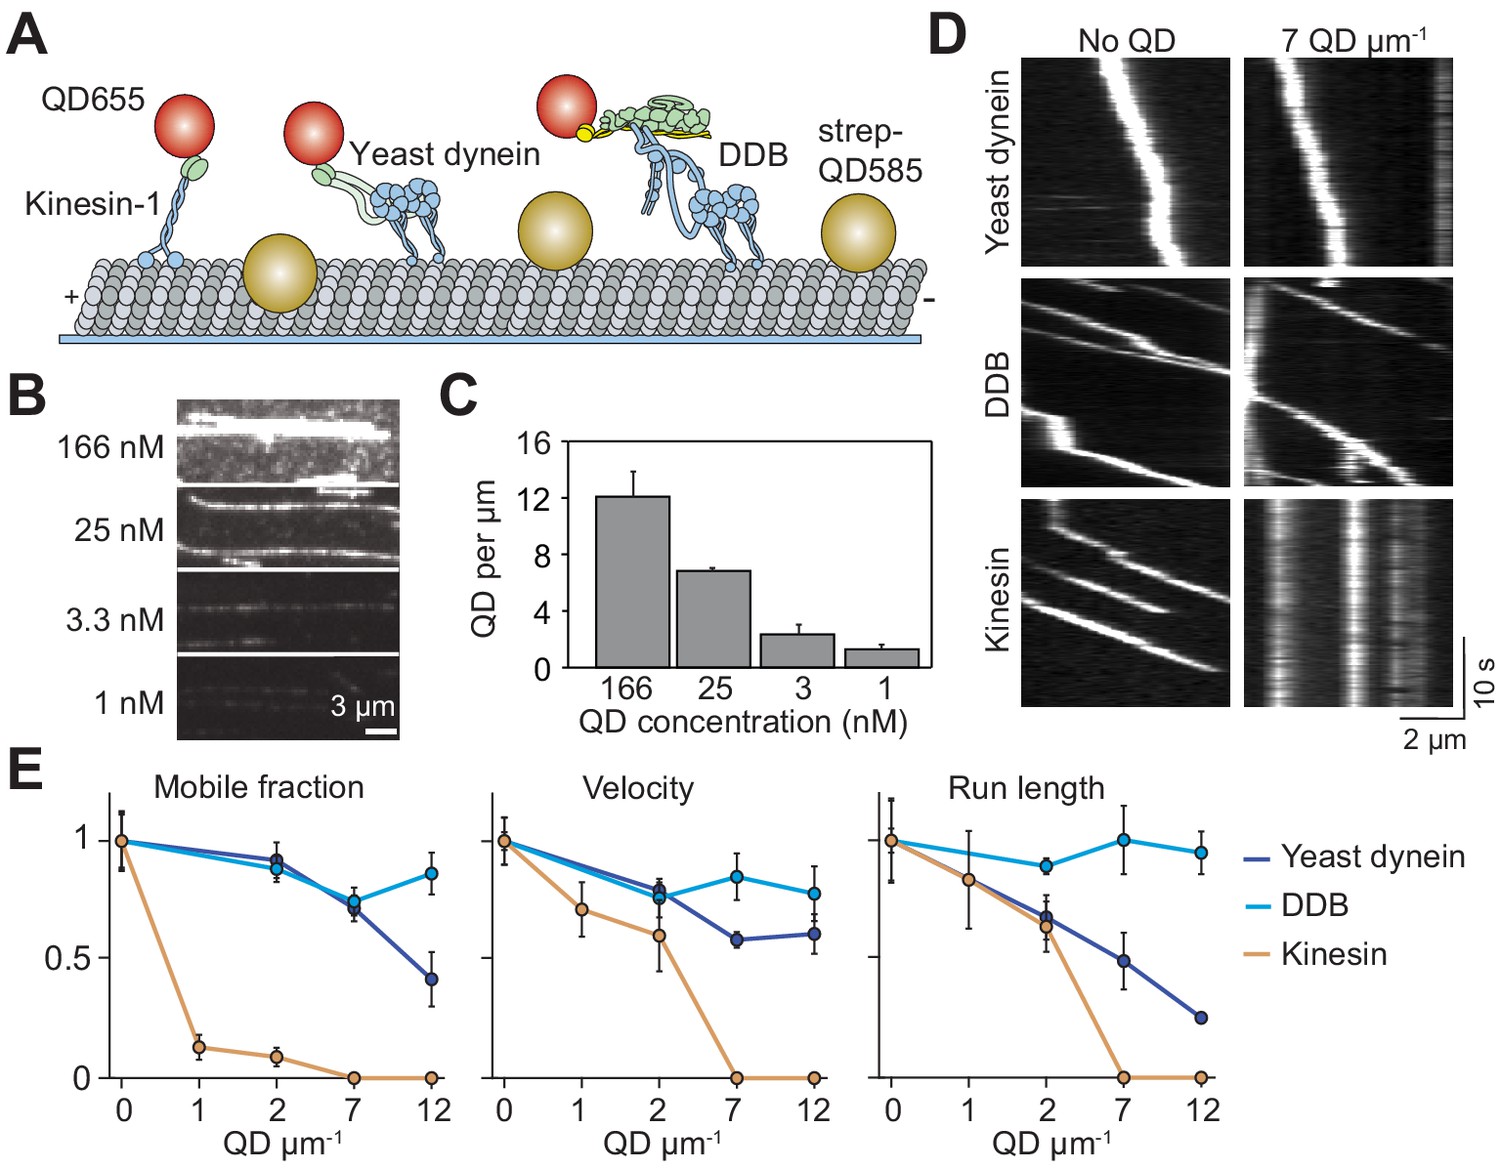
Single dynein motors, but not kinesin motors, bypass QD obstacles.
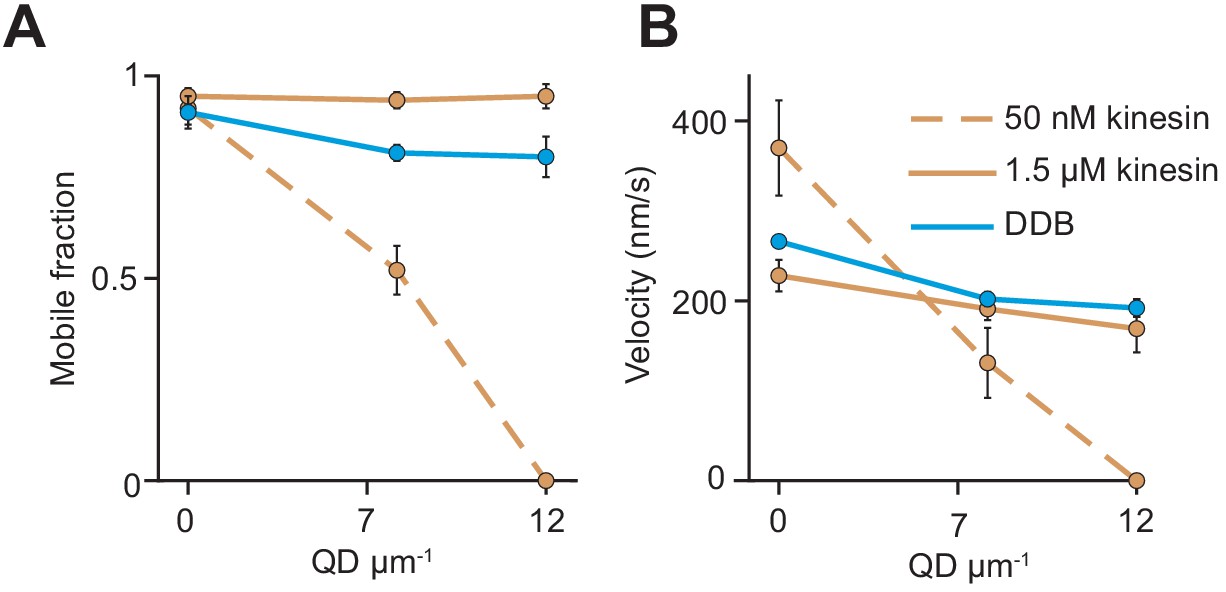
(A) Schematic of single-molecule motility assays on surface-immobilized MTs decorated with streptavidin-coated QD585 obstacles. Human kinesin-1, yeast dynein, and mammalian DDB are labeled with QD655 at their tail domain. (B) Example fluorescent images of QD585 obstacles on MTs at different QD concentrations. (C) The linear density of QDs on MTs at different QD concentrations (mean ± SD, from left to right n = 97, 98, 104 and 90 MTs from two technical replicates). (D) Kymographs show the motility of QD655-labeled motors on MTs with or without QD obstacles. The QD585 signal is not shown. (E) Mobile fraction, velocity and run length for all three motors were all normalized to the no QD condition (mean ± SD, three independent experiments). Run-length values represent decay constants derived from a single exponential decay fit. From left to right, n = 271, 423, 405 for kinesin, 315, 407, 197, 168 for yeast dynein, and 636, 502, 356, 509 for DDB.
Figure 1—figure supplement 1
Analysis of single-molecule trajectories on surface-immobilized MTs without normalization.
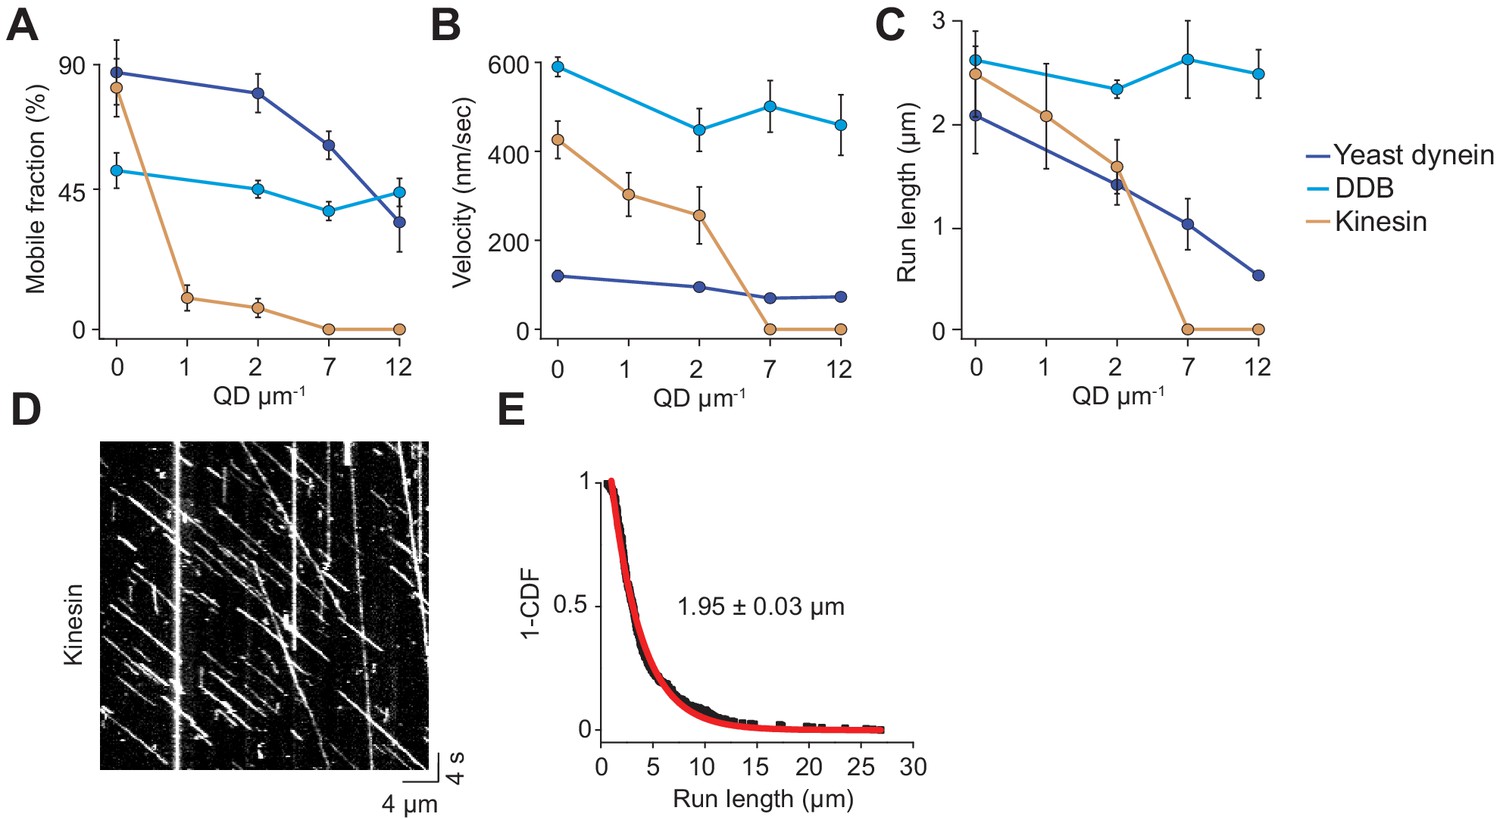
(A) Mobile fraction, (B) velocity and (C) run length of single motors on surface-immobilized MTs in the presence of QD obstacles (mean ± SD). From left to right, n = 271, 423, 405 for kinesin, 315, 407, 197, 168 for yeast dynein, and 636, 502, 356, 509 for DDB, three independent experiments. (D) A representative kymograph of TMR-kinesin motility in the absence of obstacles on surface-immobilized MTs. The assay was performed in 1 mM ATP. (E) The inverse cumulative distribution (1-CDF) of distances traveled by single TMR-labelled kinesin motors was fit to a single-exponential decay to calculate the motor run length (mean ± SEM, n = 422 traces from two independent experiments).
Figure 2 with 2 supplements
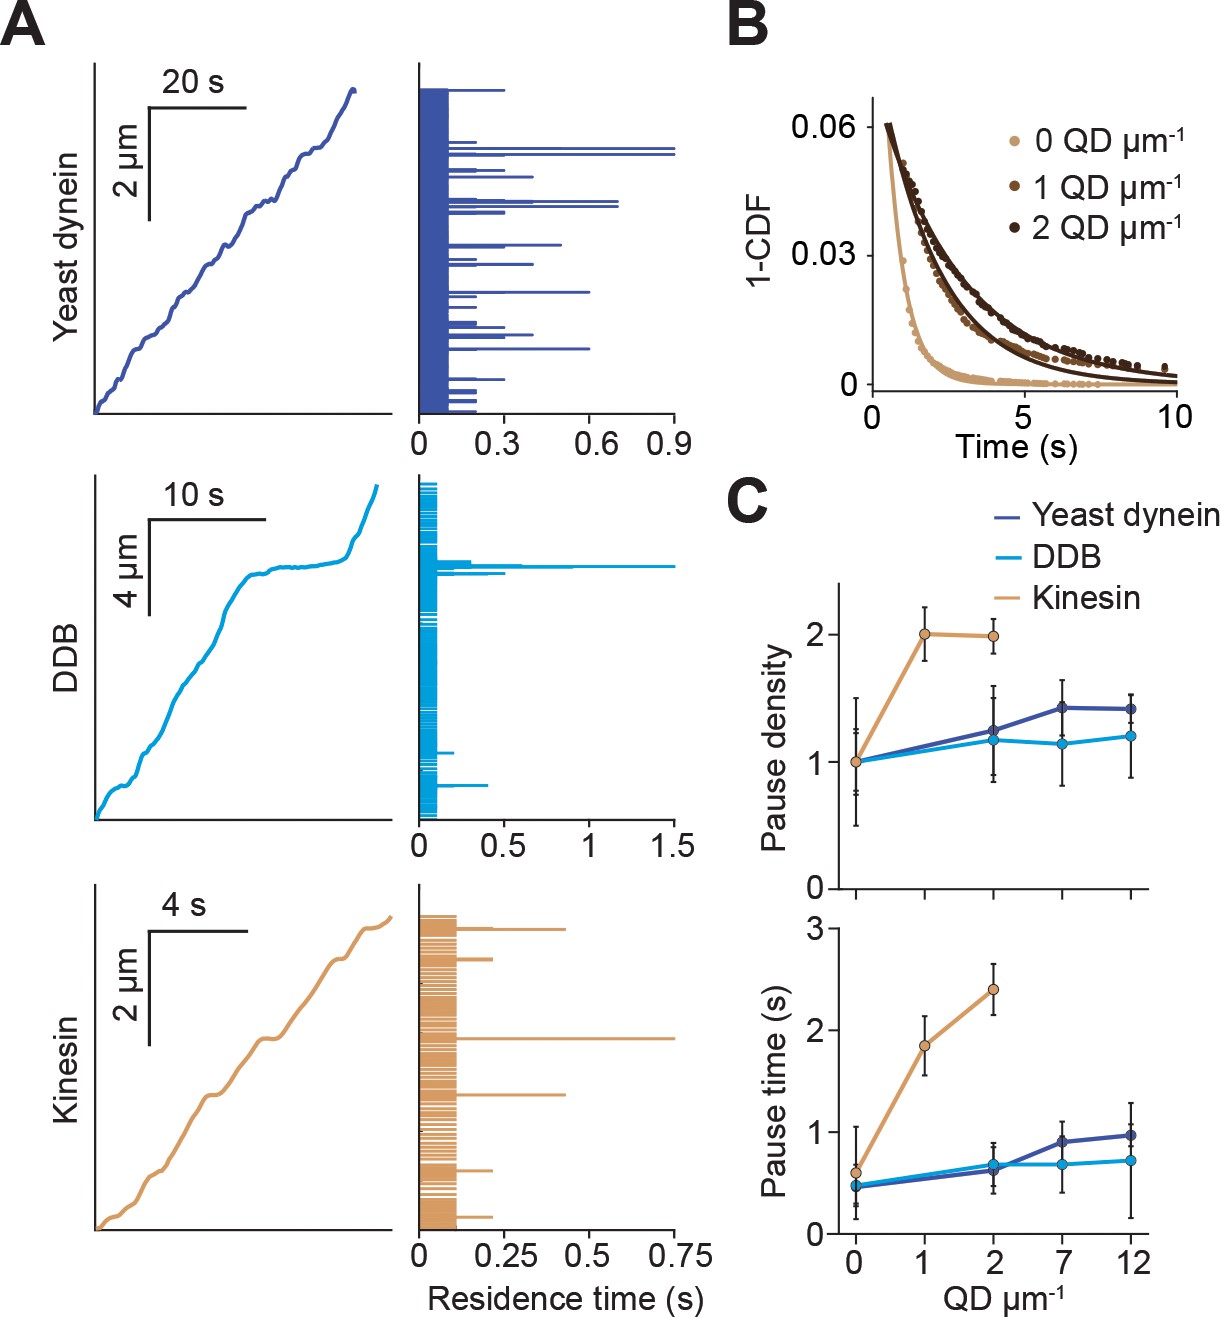
Kinesin pauses more frequently than dynein when encountering QD obstacles.
(A) (Left) Representative traces of yeast dynein, DDB, and kinesin in the absence of QD obstacles on surface-immobilized MTs. (Right) Residence times of the motors in each section of the traces. (B) The inverse cumulative distribution (1-CDF) of kinesin residence times at different obstacle concentrations were fit to a single exponential decay. The residuals of that fit (shown here) are fit to a single exponential decay (solid line) to calculate the density and duration of kinesin pausing. (C) Density and duration of the pauses of the three motors. Pause densities (pauses/µm) are normalized to the 0 QDs µm−1 condition. Kinesin pausing behavior at 7 and 12 QDs µm−1 could not be determined because the motor was nearly immobile under these conditions. From left to right, n = 535, 520, 158, 29 for yeast dynein, 511, 449, 391, 276 for DDB, and 570, 127, 112 for kinesin. Error bars represent SEM calculated from single exponential fit to residence times.
Figure 2—figure supplement 1

Kinesin pauses in the presence of QD obstacles.
Representative kymographs reveal frequent pauses in kinesin motility in the presence of 1 QD µm−1 (top row) or 2 QD µm−1 (bottom row). Most pauses were permanent throughout recording. Processive traces interspersed with transient pauses were used in pause analysis in Figure 2.
Figure 2—figure supplement 2
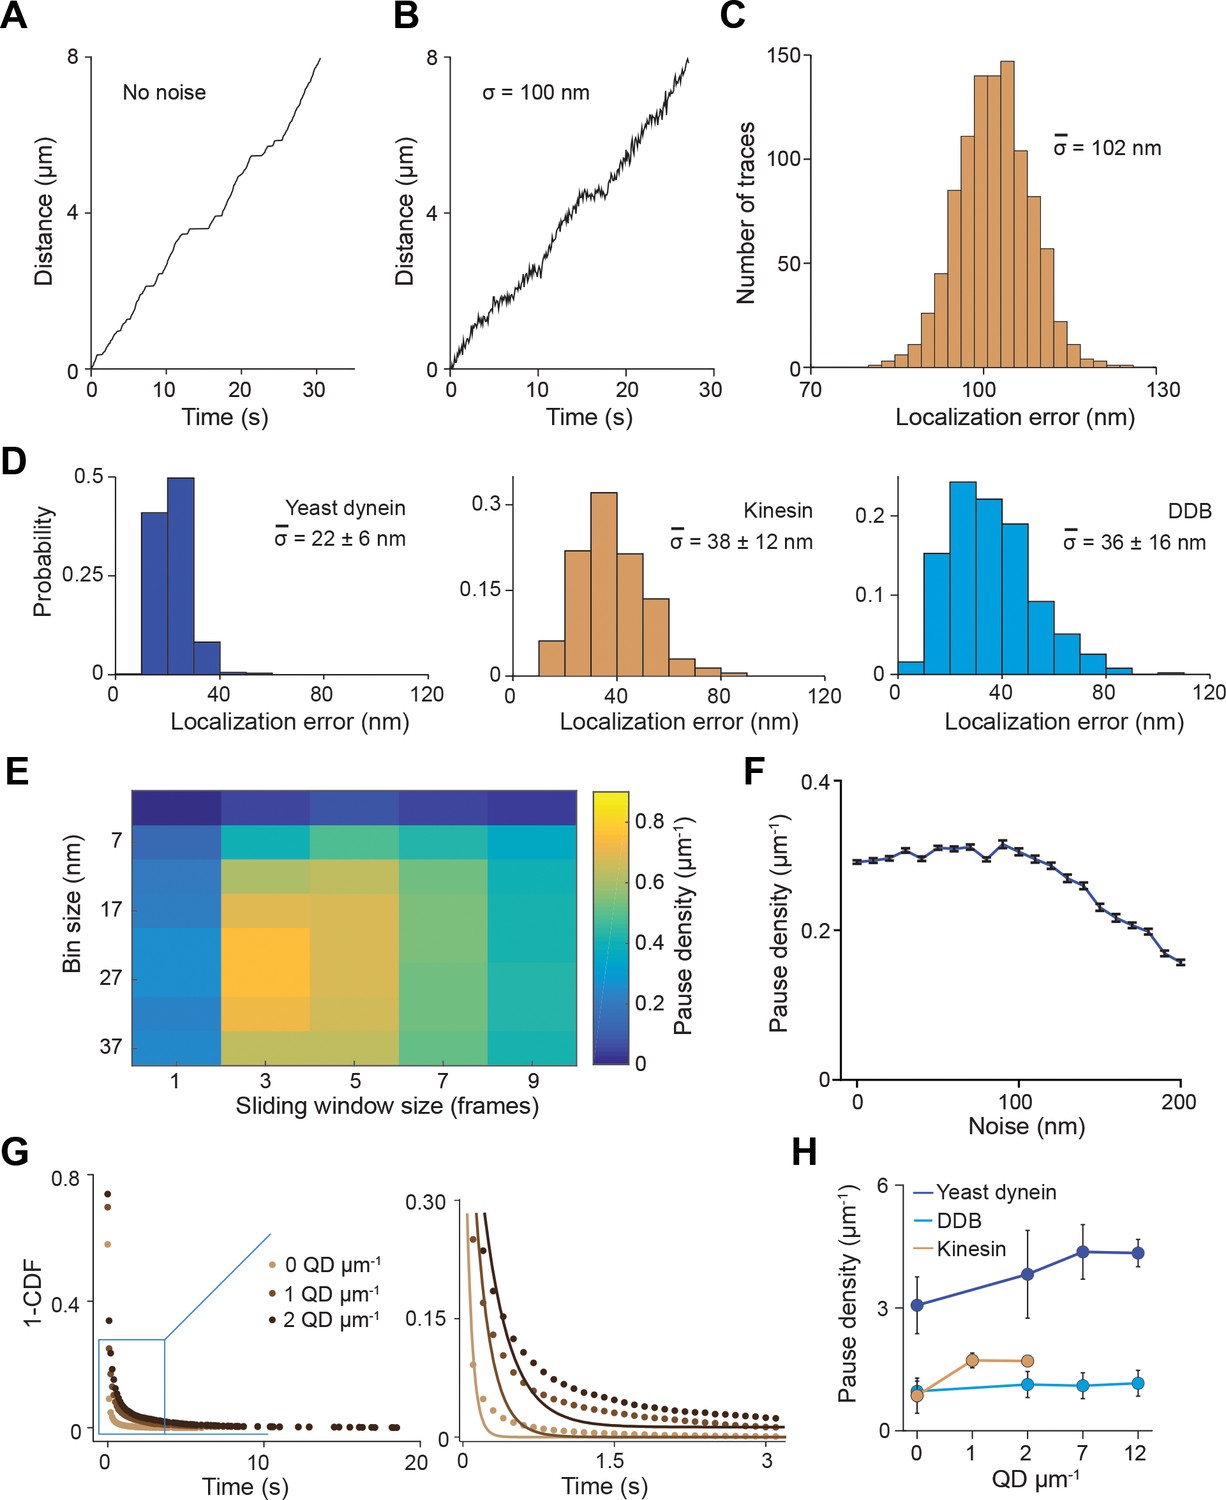
Simulations for the pause analysis.
(A) An example trajectory simulated with a pause density of 0.8 µm−1 in the absence of tracking noise (see Materials and methods for the parameters used to generate these trajectories). (B) An example trajectory simulated with 100 nm root mean squared (RMS) noise. (C) Localization error calculated for 1000 simulated traces closely agrees with 100 nm noise added to the traces. (D) Localization error calculated for 500 experimental traces of the three motors. (E) Optimization of the bin size and sliding window size for the pause analysis. Noisy traces were simulated using 0.8 µm−1 pause density, down-sampled with given window size (the number of data points) and residence time was calculated for a given bin size (distance traveled by motor). The analysis revealed that pause density was slightly underestimated even under optimal conditions. The combination of bin size and window size that resulted in the highest pause density was used to analyze experimental traces. (F) Traces were simulated with a pause density of 0.3 µm−1. Calculated pause density from simulations was insensitive to the 0–100 nm added tracking noise. The density of detected pauses decreases at higher noise. (G) The inverse cumulative distribution of pause density and duration were determined from residence time histograms through a two-step process. (Left) All non-zero residence times were fit to a single exponential distribution. (Right) Zoomed view of the blue rectangle on the left. The residuals of this fit (plotted in Figure 2B) were fit to a single exponential decay to determine pause time and density. (H) The pause density analysis of single motors on surface-immobilized MTs without normalization. From left to right, n = 535, 520, 158, 29 for yeast dynein, 511, 449, 391, 276 for DDB, and 570, 127, 112 for kinesin. Error bars represent SE calculated from single exponential fit to residence time histograms.
Figure 3 with 1 supplement
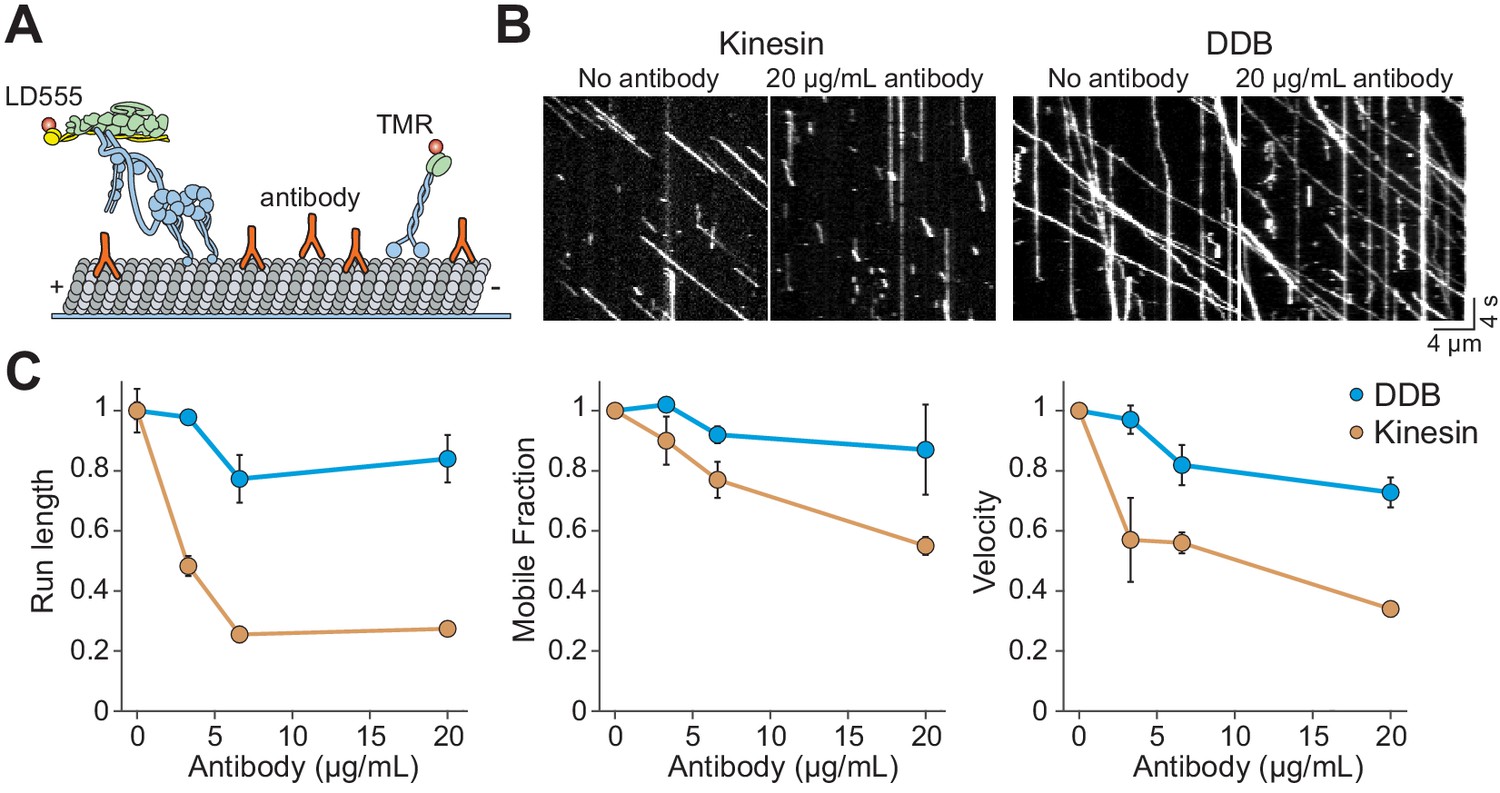
Kinesin detaches from MTs when encountering antibody obstacles.
(A) Kinesin and dynein were labeled with organic dyes and their motility was tested in the presence and absence of anti-tubulin antibody on MTs. (B) Kymographs of TMR-kinesin and LD555-DDB walking on MTs in the absence and presence of 20 µg/mL antibody obstacle. (C) Quantification of how antibody obstacles affect motor motility. All data are normalized to the no antibody condition (mean ± SD, two independent experiments). From left to right, n = 185, 232, 199, 197 motors for kinesin and 104, 224, 262, 308 motors for DDB.
Figure 3—figure supplement 1

Larger obstacles block access to more protofilaments on an MT.
The schematics represent the cross-sectional view of a motor bypassing an obstacle by taking sideways steps on an MT. Increasing the size of the obstacle or the cargo attached to the motor is expected to reduce the number of protofilaments that support motility (white). The protofilaments that are blocked by the obstacle/cargo are shown in red.
Figure 4 with 2 supplements
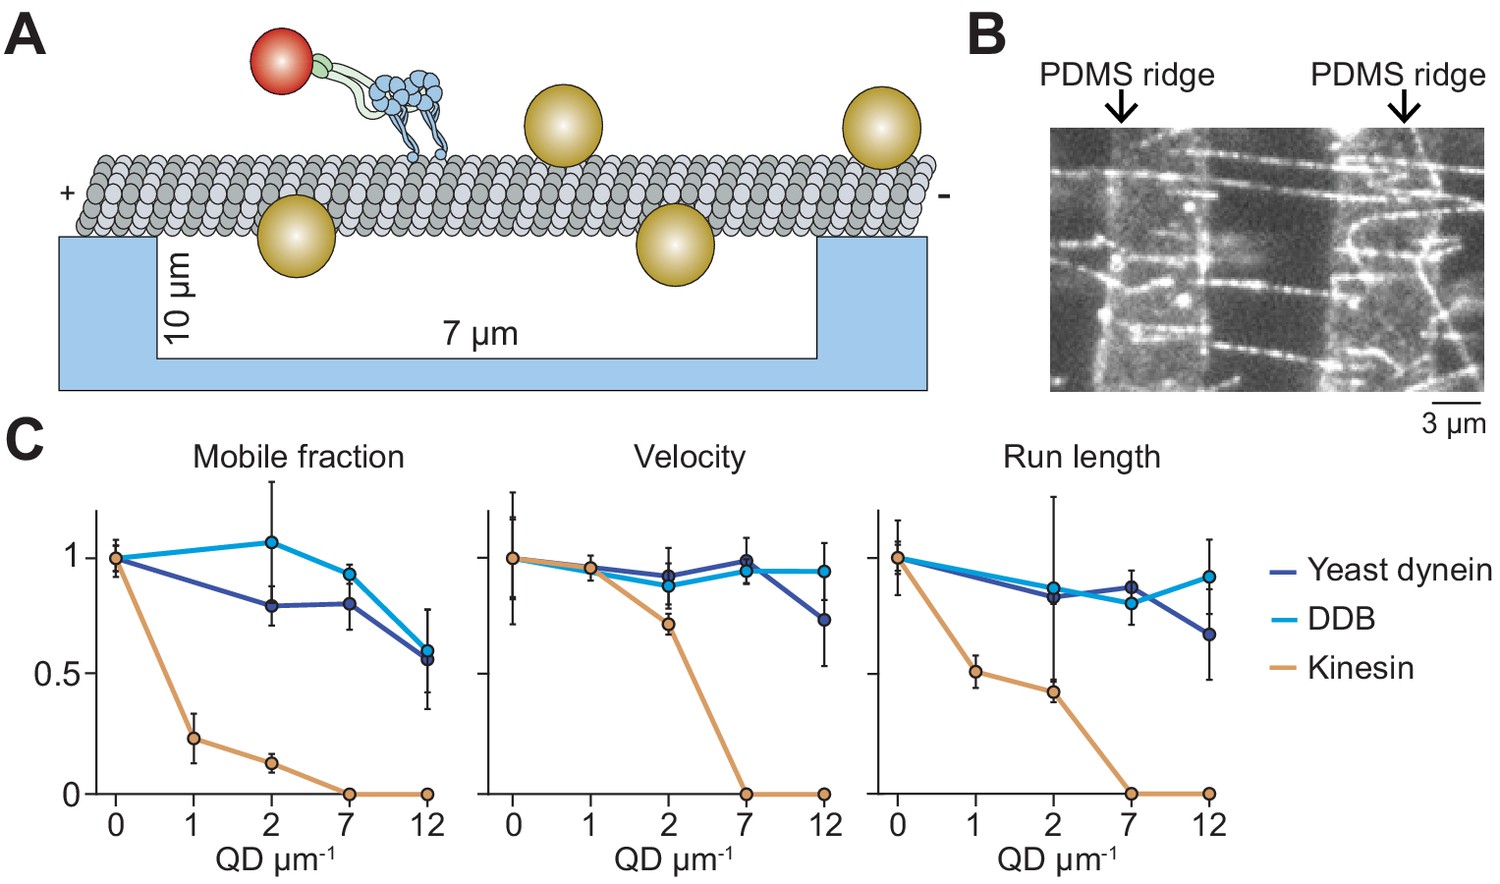
Suspending MTs from the surface does not aid kinesin in avoiding obstacles.
(A) Schematic of a single-molecule motility assay on MT bridges coated with QD obstacles (not to scale). (B) An example image of Cy5-labeled MT bridges in the microfabricated chamber. PDMS ridges (arrows) are visible due to the autofluorescence. (C) Mobile fraction, velocity and run length of motors along MT bridges were normalized to the no QD condition (mean ± SD, three independent experiments). From left to right, n = 199, 187, 106 for kinesin, 129, 107, 163, 135 for yeast dynein, and 192, 206, 330, 276 for DDB.
Figure 4—figure supplement 1
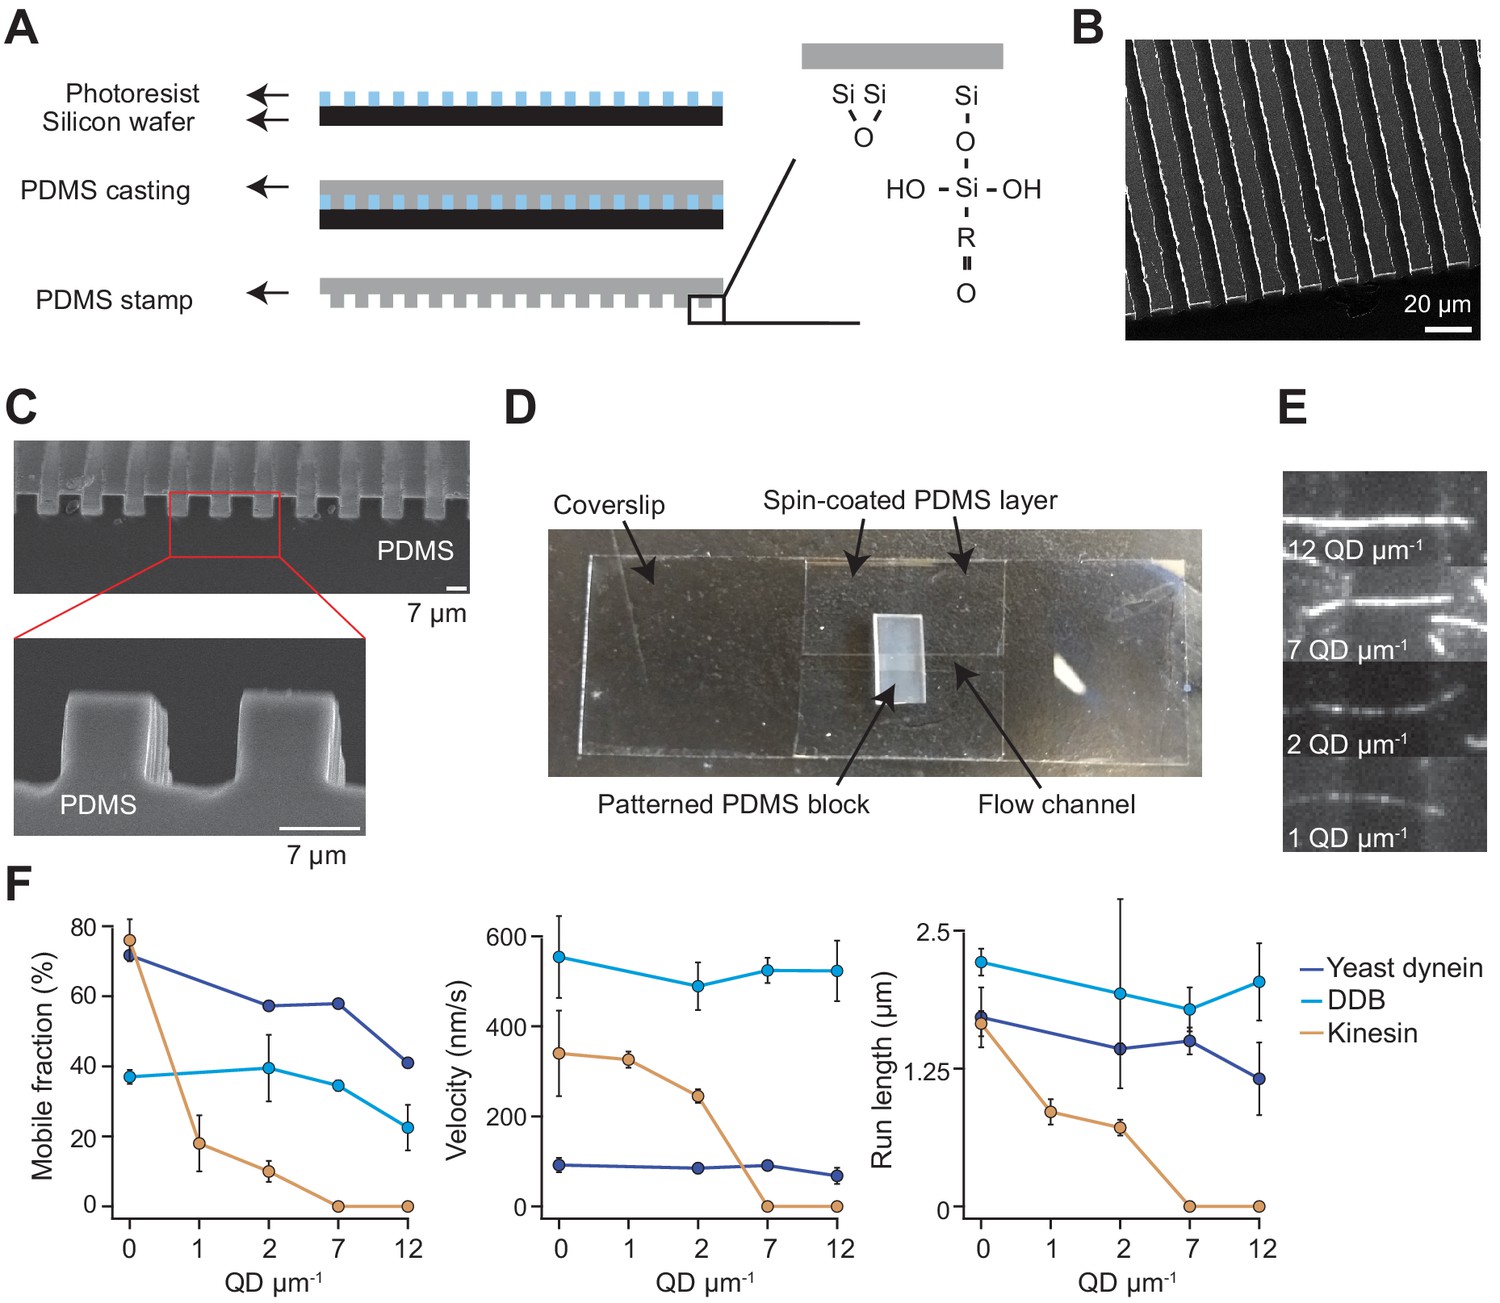
Chamber design and raw data of single-molecule motility along MT bridges.
(A) Workflow for bridge microfabrication. The photoresist is spun and patterned on a silicon wafer. PDMS is then cast on top of the photoresist and silanized to produce a reactive surface. (B) Helium ion microscopy shows a top view of patterned PDMS. (C) Scanning electron microscopy shows the side view of patterned PDMS (top) and the zoomed view of this image reveals that the walls have sharp edges (bottom). (D) Image of the flow chamber used for experiments. (E) Example fluorescent images of QD585 obstacles on MT bridges at different QD concentrations. (F) Mobile fraction, velocity and run length of single motors on MT bridges without normalization (mean ± SD, two independent experiments). From left to right, n = 199, 187, 106 for kinesin, 129, 107, 163, 135 for yeast dynein, and 192, 206, 330, 276 for DDB.
Figure 4—figure supplement 2
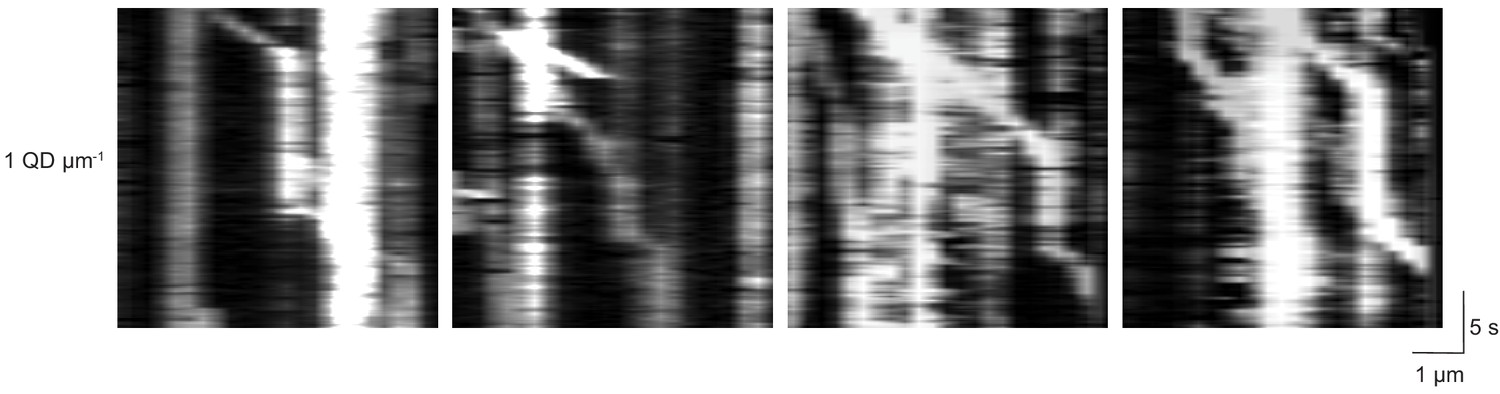
Kinesin pauses in the presence of QD obstacles on suspended MTs.
Representative kymographs reveal frequent pauses in kinesin motility in the presence of 1 QD µm−1 on suspended MT bridges. Most pauses were permanent throughout recording.
Figure 5 with 1 supplement
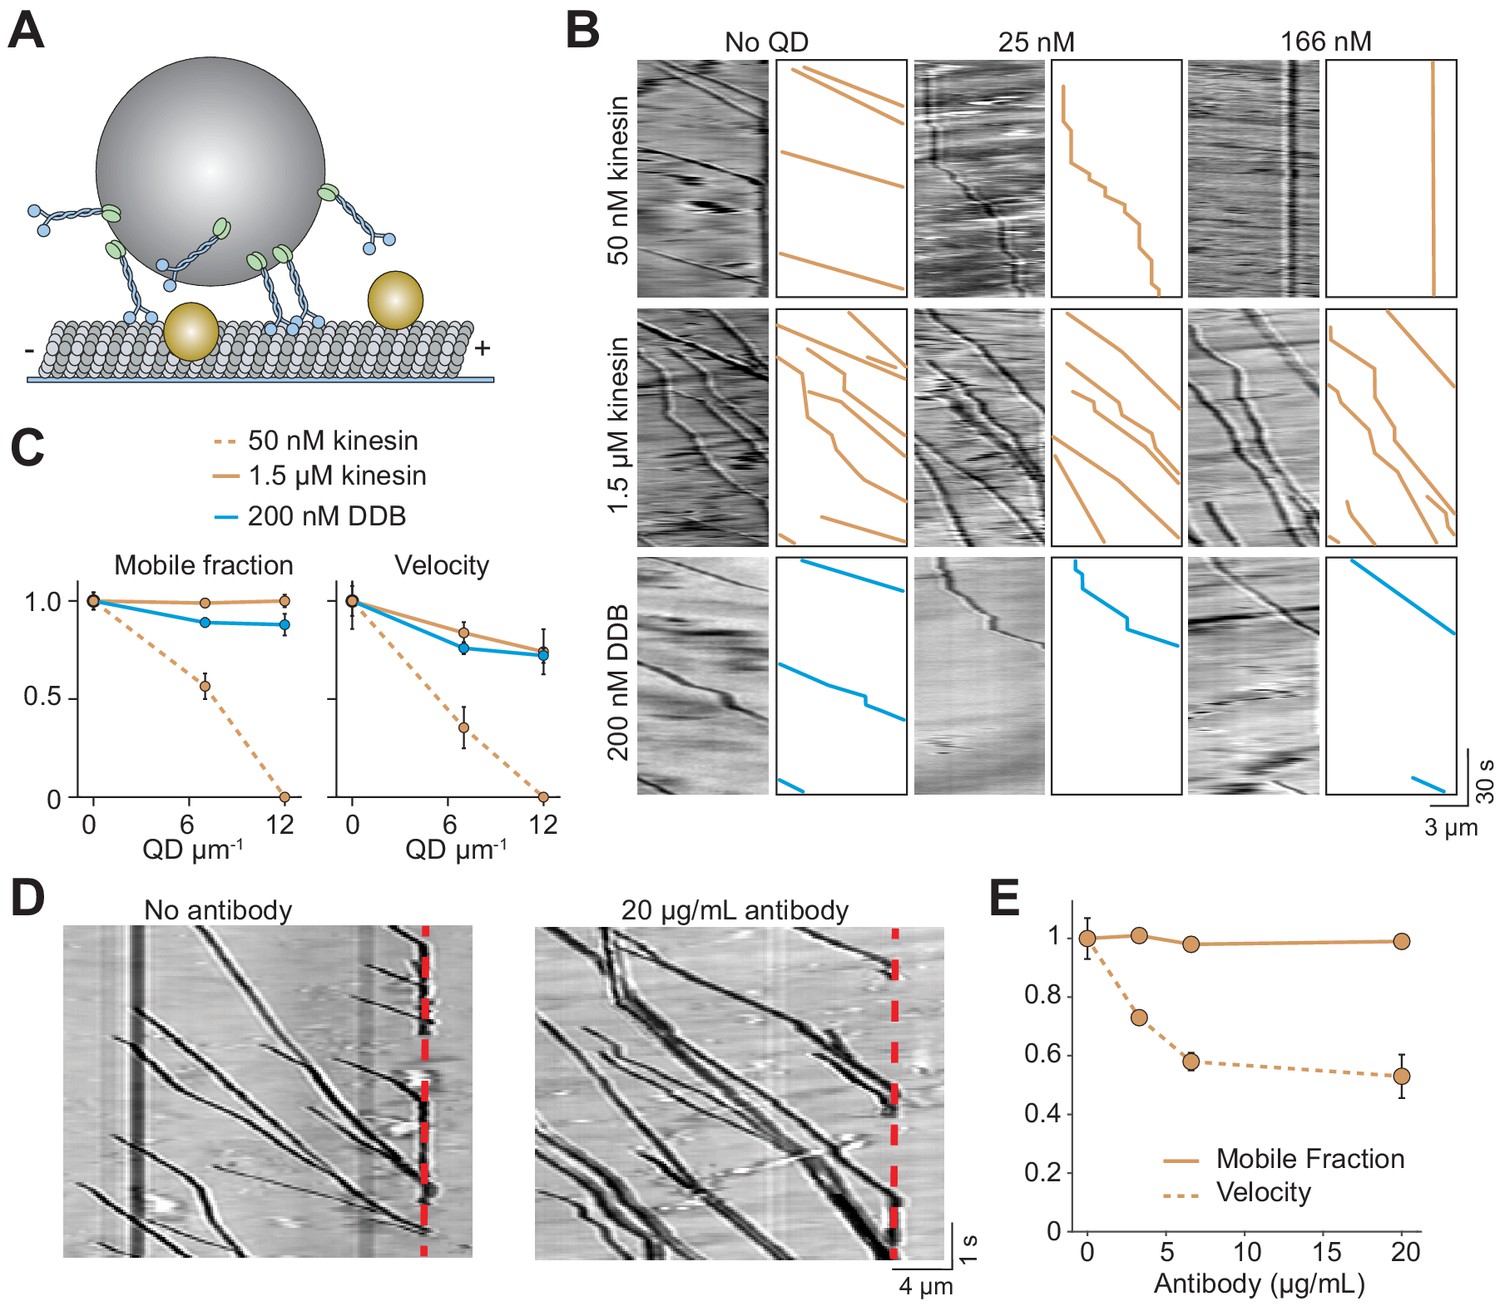
Cargos driven by multiple kinesins successfully bypass obstacles.
(A) Schematic of bead motility driven by multiple motors along surface-immobilized MTs decorated with QD obstacles (not to scale). (B) Kymographs reveal the motility of beads coated with kinesin or DDB in the presence and absence of QD obstacles. Diffusion of unattached beads creates a background in the kymograph. To the right of each kymograph is an illustration of the bead motility on the MT. (C) Mobile fraction and velocity of beads were normalized to the no QD condition (mean ± SD). From left to right, n = 154, 189 bead traces for 50 nM kinesin, 323, 338, 336 for 1.5 µM kinesin, and 279, 184, 67 for DDB from three independent experiments. (D) Representative traces for 1.5 µM kinesin on beads in the absence and presence of antibody obstacle. The dashed red line indicates the plus-end of the MT. (E) Quantification of mobile fraction and velocity of kinesin-driven beads. From left to right, n = 145, 198, 141, 201 beads.
Figure 5—figure supplement 1
The analysis of beads driven by multiple motors on surface-immobilized MTs without normalization.
(A) Mobile fraction and (B) velocity of beads driven by multiple motors on surface-immobilized MTs in the presence of QD obstacles (mean ± SD, three independent experiments). The mobile fraction of the beads was higher than 95% in the absence of QD obstacles. From left to right, n = 154, 189 traces for 50 nM kinesin, 323, 338, 336 traces for 1.5 µM kinesin, and 279, 184, 67 traces for 200 nM DDB.
Figure 6
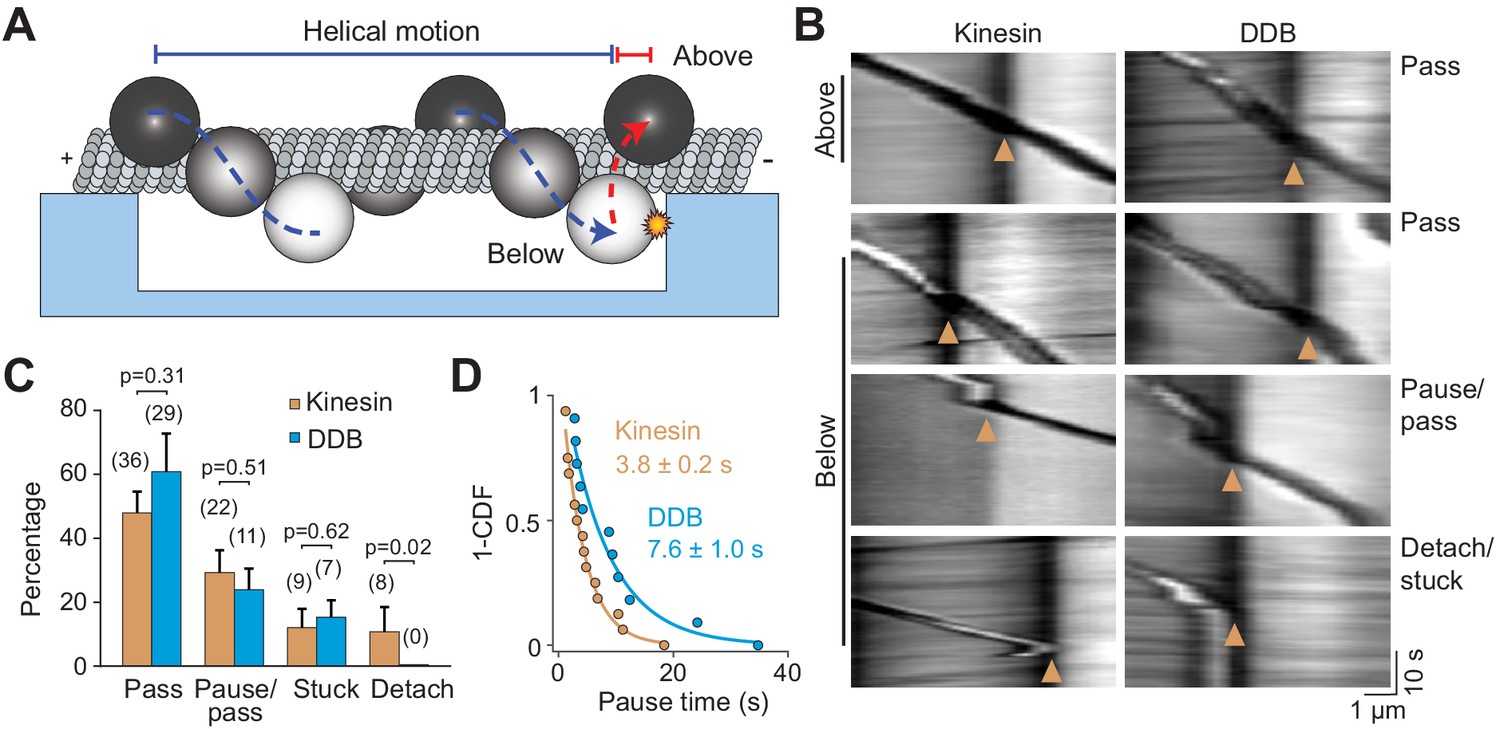
Cargos driven by multiple motors bypass large obstacles by rotating around the MT.
(A) Schematic of multi-motor bead motility on MT bridges. The position of the bead in the z-axis is determined from changes in bead intensity under brightfield illumination. If a bead is positioned below the MT when it reaches the PDMS wall, it must move to the top of the MT (red dotted curve) before continuing forward. (B) Kymographs reveal how beads driven by kinesins and DDBs move when they encounter the PDMS wall (below). (Pass) The bead rotates around the MT as evidenced by light to dark transitions in the bead intensity at the wall before continuing forward. (Pause/pass) The bead paused for more than 1 s at the wall before rotating around the MT and moving forward. (Detach/stuck) The bead failed to pass the wall and either detached (left) or got stuck on an MT (right). (C) The percentage of the pass, pause/pass and detach/stuck events for the beads positioned below the MT when they encounter the PDMS wall (mean ± SD, two independent experiments). The number of beads is shown in parentheses. p-values are calculated using two-tailed t-test for pass, pause/pass and stuck, and z-score calculation for detach. (D) The inverse cumulative distribution of pause times for kinesin and DDB beads. A fit to a single exponential decay (solid curves) revealed that pause duration of DDB-driven beads is longer than kinesin-driven beads (F-test, p=0.0001, n = 16 pauses for kinesin and 11 for DDB).
Videos
Video 1
Motility of DDB motors is not strongly affected by the QD obstacles.
DDB motors were labeled with QD655 at their N-termini. Single-molecule motility of DDB in the presence of no obstacles (top) or 25 nM QD585 obstacles (bottom) on surface-immobilized MTs. The fluorescence signal of QD585 obstacles was collected in a separate channel, and not displayed. The sample was excited with a 1.7 kW cm−2488 nm laser beam under the epifluorescence mode. Images were acquired at 10 Hz.
Video 2
Kinesin motors walk processively in the absence of QD obstacles, but motility was completely impaired in the presence of 25 nM QDs.
Kinesin motors were labeled with QD655 at their C-termini. Single-molecule motility of kinesin in the presence of no obstacles (top) or 25 nM QD585 obstacles (bottom) on surface-immobilized MTs. The fluorescence signal of QD585 obstacles was collected in a separate channel, and not displayed. The sample was excited with a 1.7 kW cm−2488 nm laser beam under the epifluorescence mode. Images were acquired at 10 Hz.
Video 3
Kinesin motors labeled with an organic dye are inhibited by antibody obstacles.
Kinesin motors labeled with TMR walk on MTs in the presence (right) and absence (left) of antibody obstacles. MT fluorescence was recorded in a separate channel (not shown). There was a notable reduction in velocity and run length in the presence of antibody on the MT. Images were acquired at 5 Hz under TIRF illumination.
Video 4
DDB motors labeled with an organic dye are not strongly inhibited by antibody obstacles.
DDB motors labeled with LD555 walk on MTs in the presence (right) and absence (left) of tubulin antibody obstacles. MT fluorescence was recorded in a separate channel (not shown). DDB motors were less affected by antibody obstacles than kinesin. Images were acquired at 5 Hz under TIRF illumination.
Video 5
Beads driven by multiple kinesins move processively at high QD obstacle concentrations.
500 nm diameter beads were labeled with 1.5 µM kinesin. Beads move along surface-immobilized MTs in the presence of no obstacles (left) or 166 nM obstacles (right). Boxes highlight the processive motility of beads along a surface-immobilized MTs (not labeled). In addition, freely diffusing beads in the chamber come in and out of focus during imaging. Images were acquired at 10 Hz under brightfield illumination.
Video 6
Beads driven by multiple kinesin motors walk processively on MTs coated with antibody obstacle.
Beads coated with 1.5 µM kinesin motors walk on MTs in the presence (right) and absence (left) of antibody obstacles. MT fluorescence was recorded in a separate channel (not shown). Images were acquired at 5 Hz under brightfield illumination. Motility of monodisperse beads was analyzed, while clumps of beads were excluded from the analysis.
Video 7
Beads driven by multiple kinesins bypass the PDMS wall.
The box highlights the processive motility of a bead driven by multiple kinesins on an MT bridge (unlabeled) suspended over the PDMS ridges. The valley (dark) is in the center of the movie while the PDMS ridges (light) are on either side. As the bead reaches the PDMS wall (light/dark interface), the bead intensity shifts from light to dark before the bead continues to walk on the PDMS ridge. Images were acquired at 10 Hz under brightfield illumination.
Video 8
Beads driven by multiple DDBs bypass the PDMS wall.
The box highlights the processive motility of a bead driven by multiple DDBs on an MT bridge (unlabeled) suspended over the PDMS ridges. The valley (dark) is in the center of the movie while the PDMS ridges (light) are on either side. As the bead reaches the PDMS wall (light/dark interface), the bead intensity shifts from light to dark before the bead continues to walk on the PDMS ridge. Images were acquired at 10 Hz under brightfield illumination.
Tables
Key resources table
| Reagent type (species) or resource | Designation | Source or reference | Identifiers | Additional information |
|---|---|---|---|---|
| Other | Amino quantum dot (655) | ThermoFisher | Q21521MP | |
| Other | Streptavidin quantum dot (585) | ThermoFisher | Q10111MP | |
| Chemical | APTES | Sigma | 440140 | |
| Antibody | Anti-tubulin antibody (mouse monoclonal) | Sigma, Tub 2.1 | T5201 | Dilution range 0–20 µg/mL |
| Peptide, recombinant protein | Human Kinesin-1 | Belyy et al., 2016 | N/A | |
| Peptide, recombinant protein | Yeast dynein heavy chain | Reck-Peterson et al., 2006 | N/A | |
| Peptide, recombinant protein | BicD2 (amino acids 1–400) | Schlager et al., 2014 | Addgene 111862 | |
| Peptide, recombinant protein | Human cytoplasmic dynein complex | Zhang et al., 2017 | N/A | |
| Chemical | Acetone | Sigma | 270725 | |
| Chemical | Ethanol | Sigma | 459828 | |
| Other | IgG Sepharose Beads | GE Healthcare | 17096902 | |
| Chemical | Glutaraldehyde | Fisher Scientific | G1511 | |
| Other | PDMS | Sylgard 184 Silicone Elastomer | N/A | |
| Other | Glucose oxidase | Sigma | G2133 | |
| Other | Catalase | Sigma | C3155 | |
| Chemical | Taxol | Sigma | T7191 | |
| Peptide, recombinant protein | Pig Brain Dynactin | Schlager et al., 2014 | N/A | |
| Peptide, recombinant protein | Pig Brain Tubulin | Castoldi and Popov, 2003 | N/A | |
| Chemical | ATP | Sigma | A3377 | |
| Other | Ni-NTA beads | Thermo Scientific | 88221 | |
| Chemical | Fugene HD transfection reagent | Promega | E2311 | |
| Chemical | HaloTag Ligand succinimidyl ester | Promega | P6751 | |
| Chemical | SU-8 2010 photoresist | Microchem | N/A | |
| Other | Super Active Latex Beads | Thermo Fisher | C37481 | |
| Chemical | Sulfo-NHS | Thermo Fisher | 24510 | |
| Chemical | EDC | Thermo Fisher | 22980 | |
| Software | U-track | Jaqaman et al., 2008 | N/A | |
| Antibody | Anti-GFP (anti-rabbit polyclonal) | Covance | N/A | Used at0.4 mg/mL |
| Peptide, recombinant protein | Mouse BicDR1 (full length) | Urnavicius et al., 2018 | Adapted from Addgene 111585 |
Additional files
-
Transparent reporting form
- https://doi.org/10.7554/eLife.48629.023
Download links
A two-part list of links to download the article, or parts of the article, in various formats.
Downloads (link to download the article as PDF)
Open citations (links to open the citations from this article in various online reference manager services)
Cite this article (links to download the citations from this article in formats compatible with various reference manager tools)
Kinesin and dynein use distinct mechanisms to bypass obstacles
eLife 8:e48629.
https://doi.org/10.7554/eLife.48629


