Design of biochemical pattern forming systems from minimal motifs
- Max-Planck-Institute of Biochemistry, Germany
- Ludwig-Maximilians-Universität München, Germany
- Microsoft Research, United Kingdom
Figures
Figure 1

Schematic of the modular approach we took to engineering MinE in the in vitro Min system.
While MinE has the core function to stimulate MinD’s ATPase, three additional properties help MinE to facilitate the emergence of spatiotemporal patterns. We show that two of these properties, dimerization and membrane targeting, can be modularly added to a minimal MinE peptide to facilitate pattern formation.
Figure 2 with 5 supplements
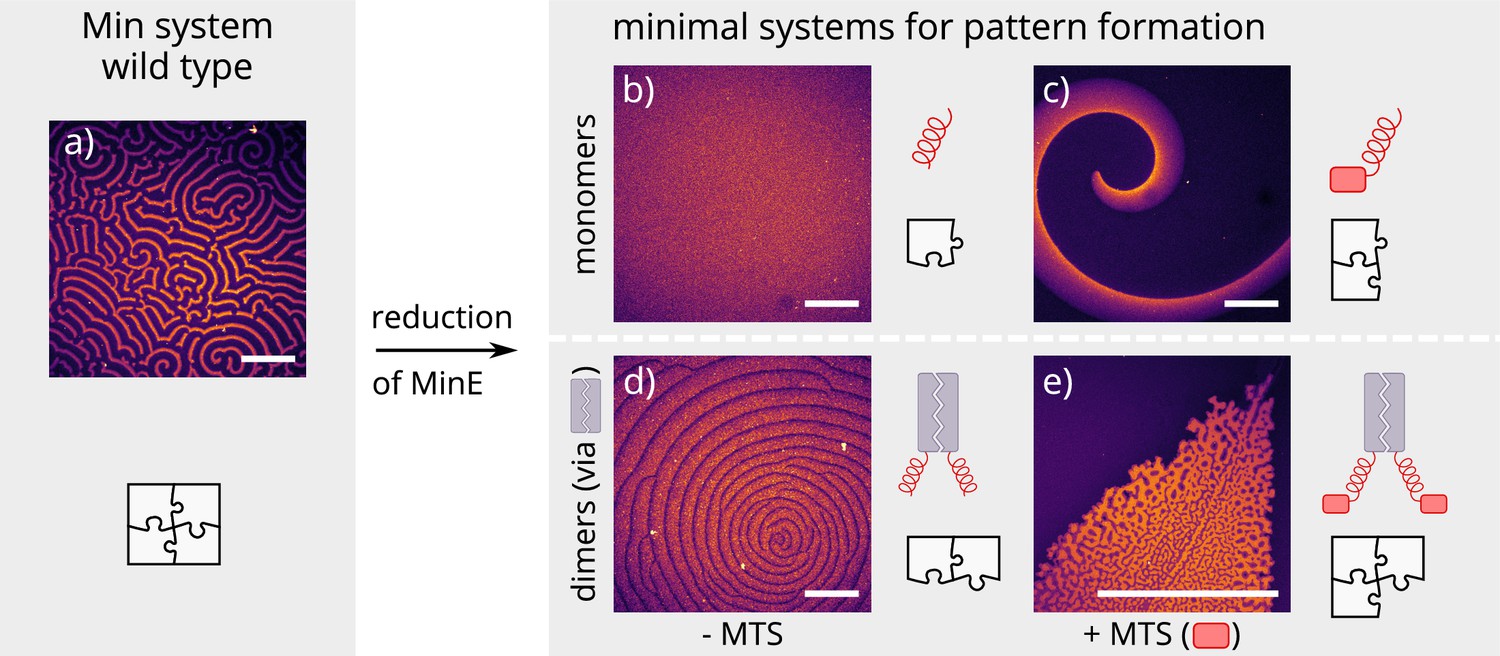
Patterns formed by the wild-type Min system and our minimal biochemical interaction networks.
(a) MinD and MinE self-organize to form evenly spaced travelling waves when reconstituted on flat lipid bilayers. (b) The minimal MinE peptide capable of ATPase stimulation is MinE(13-31); it does not facilitate pattern formation. (c) The fragments MinE(1-31) and MinE(2-31)-sfGFP contain the membrane-targeting sequence (MTS) in addition to the ATPase stimulation domain. Substituting MinE with these constructs leads to pattern formation; see Figure 2—video 1–3. (d) Fusing the ATPase stimulation domain MinE(13-31) with dimerization domains (we tested Fos, Jun, or GCN-4) facilitates pattern formation in the absence of the MTS. (e) Combining membrane targeting and dimerization in a single construct produces quasi-stationary patterns. (Concentrations and proteins used: (a) 1 μM MinD, 6 μM MinE-His; (b) 1.2 μM MinD, 50 nM MinE(13-31); (c) 1.2 μM MinD, 50 nM MinE(1-31); scalebars = 300 μM; (d) 1 μM MinD, 100 nM MinE(13-31)-Fos; (e) 1.2 μM MinD, 100 nM MinE(1-31)-GCN4. In all assays, MinD is 70 % doped with 30 % Alexa647-KCK-MinD).
Figure 2—figure supplement 1
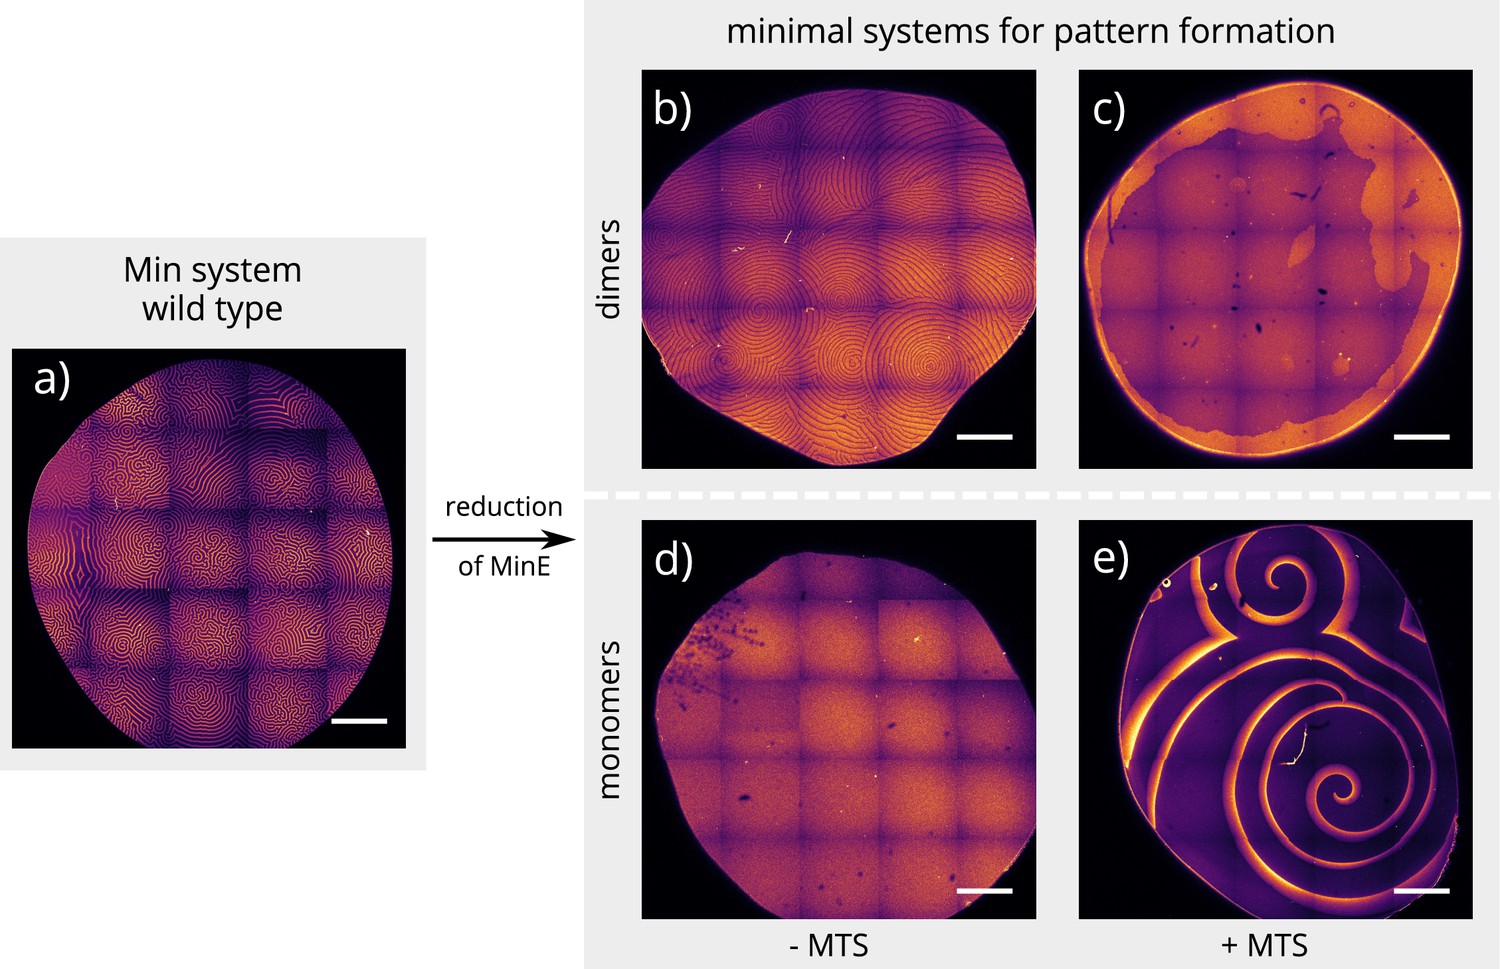
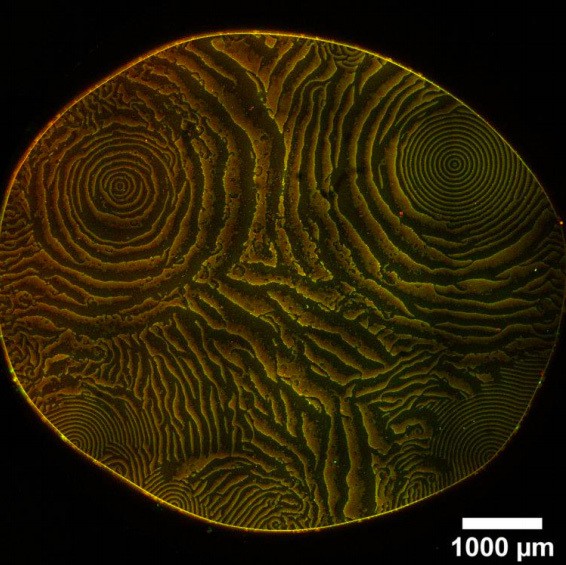
Global view of pattern formation by minimal systems.
Overview images of the same experiment chambers as in Figure 2. (Concentrations and proteins used same as in main figure; scalebars = 1000 μm).
Figure 2—figure supplement 2
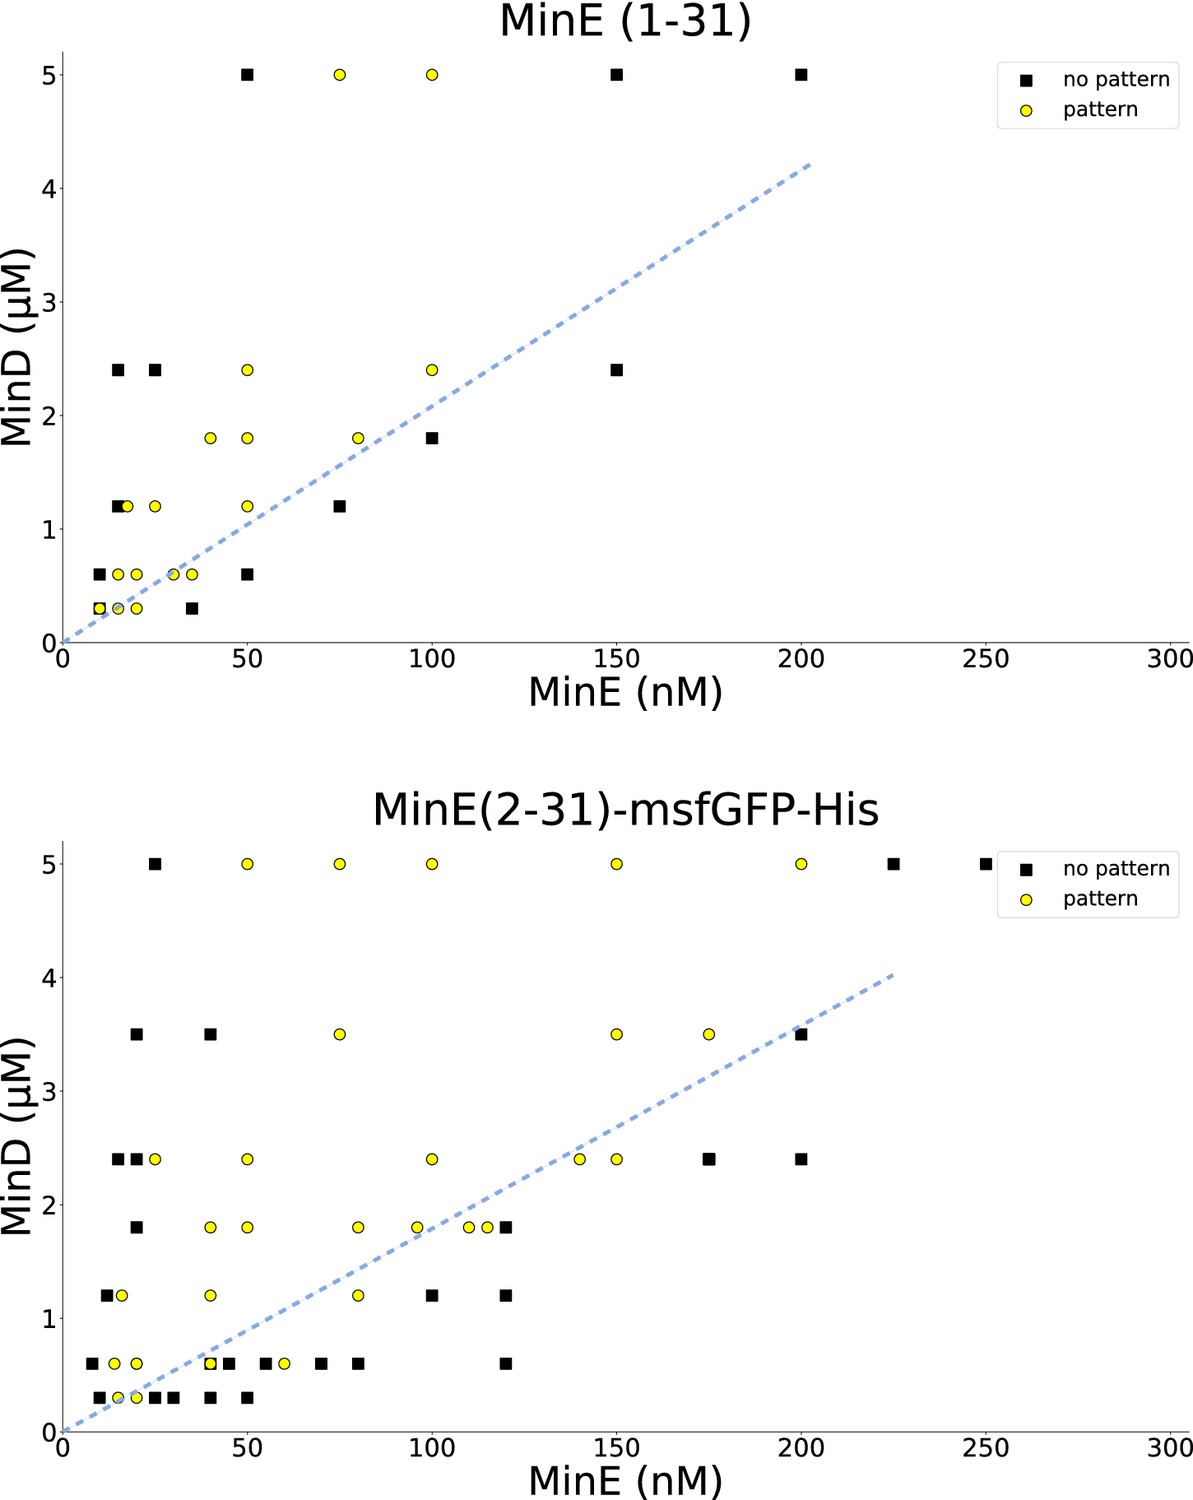
Titration results for MinE(1-31) and MinE(2-31)-sfGFP.
MinD and the peptide MinE(1-31) or MinE(2-31)-sfGFP, respectively, were titrated to find the range in which patterns are formed. All experiments were done on SLBs consisting of DOPC:DOPG (2:1). Similar titrations for full-length MinE can be found in Glock et al. (2018a). Wild-type MinE generally forms patterns with MinD in a much larger range, going beyond 10 μM. Dashed blue lines were added by hand and highlight that there is a critical MinE-to-MinD concentration-ratio above which no patterns occur, in qualitative agreement with the theoretical results shown in Figure 3—figure supplement 2. A quantitative fit of the model to the threshold ratio of approximately 1/20 is shown in Figure 3—figure supplement 3.
Figure 2—video 1
MinE(1-31) forms chaotic patterns with MinD.
Timelapse of a stitched tilescan to visualize the entire assay chamber (5 μM MinD and 100 nM MinE(1-31) form patterns on an SLB formed from DOPC:DOPG (2:1)).
Figure 2—video 2
MinE(2-31)-msfGFP forms chaotic patterns with MinD (1.8 μM MinD and 50 nM MinE(2-31)-msfGFP-His on 2:1 DOPC:DOPG).
Figure 2—video 3
Patterns with vastly different length and timescales coexist and continually transition into one another at certain concentrations of MinD and MinE(2-31)-msfGFP (0.6 μM MinD and 75 nM MinE(2-31)-msfGFP-His on 2:1 DOPC:DOPG).
Figure 3 with 9 supplements
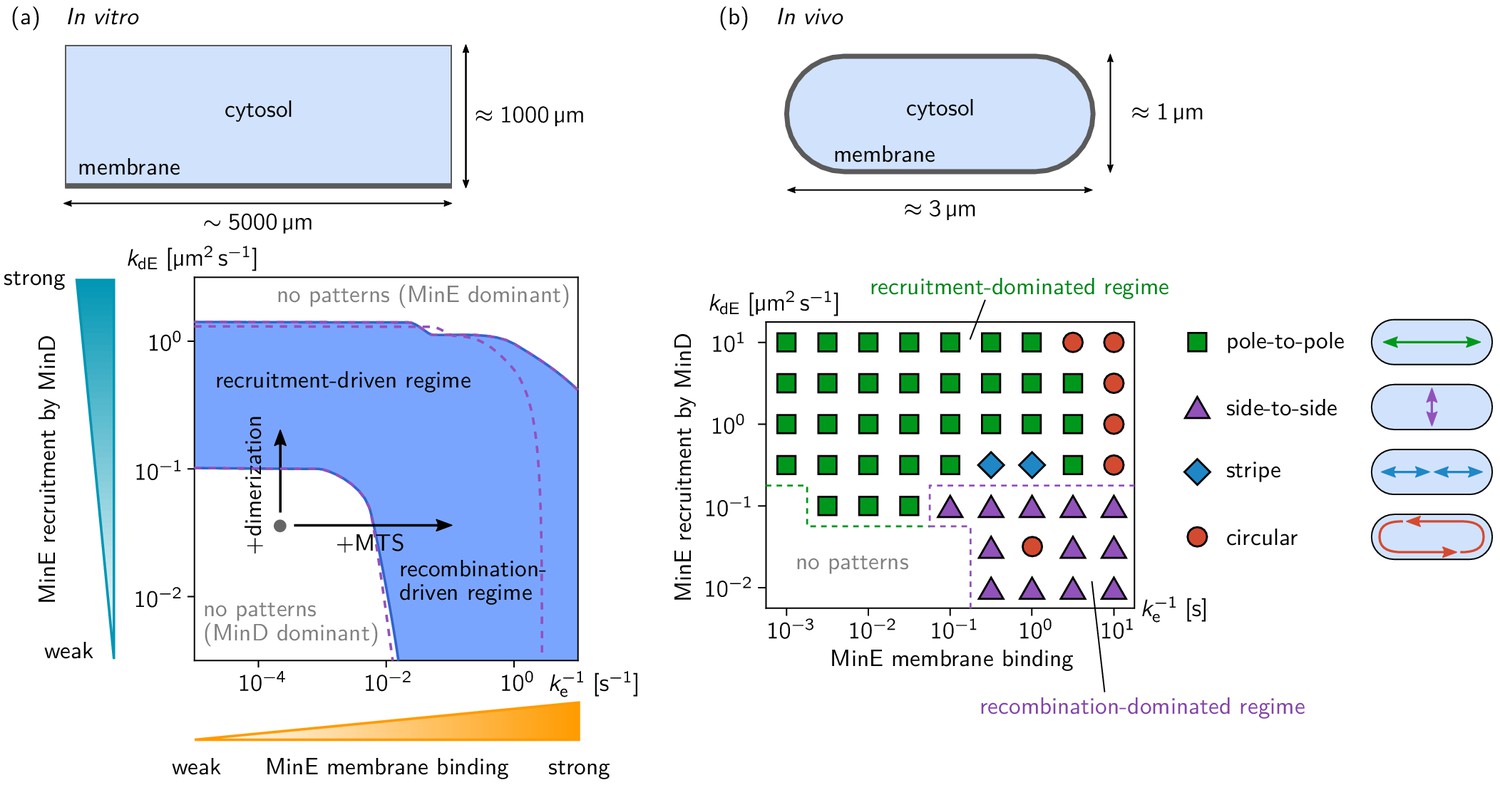
Pattern forming capability of the extended Min model in vitro and in vivo.
(a) In vitro geometry and two-parameter phase diagram obtained by linear stability analysis, showing the pattern formation capabilities of the MinDE-system in dependence of MinE membrane-binding strength () and MinE-recruitment rate . The regime of spontaneous pattern formation (lateral instability) is indicated in blue. The gray circle represents minimal MinE(13-31) construct, which does not facilitate self-organized pattern formation. The experimental domain additions are accounted for by respective changes of the kinetic rates, as indicated by the arrows. (Parameters: see Materials and methods; blue region: regime of pattern formation for zero MinE attachment, ; purple dashed lines: boundary of the pattern-formation regime for non-zero MinE attachment rate, = 5 μm s–1). (b) Two-parameter phase diagram obtained by numerical simulations in in vivo geometry. We find regimes of different oscillation pattern types: pole-to-pole oscillations (green squares); side-to-side oscillations (purple triangles); stripe oscillations (blue diamonds); and circular waves (red circles). Figure 3—videos 1–5 show examples each of these pattern types.
Figure 3—figure supplement 1
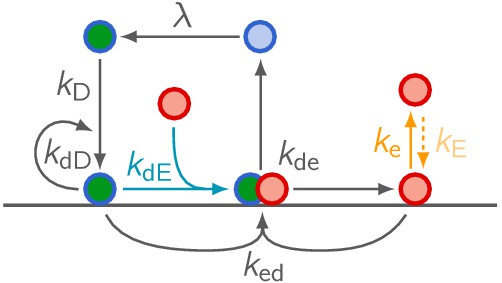
Network cartoon of the MinE ‘skeleton’ model extended by MinE membrane binding.
Figure 3—figure supplement 2
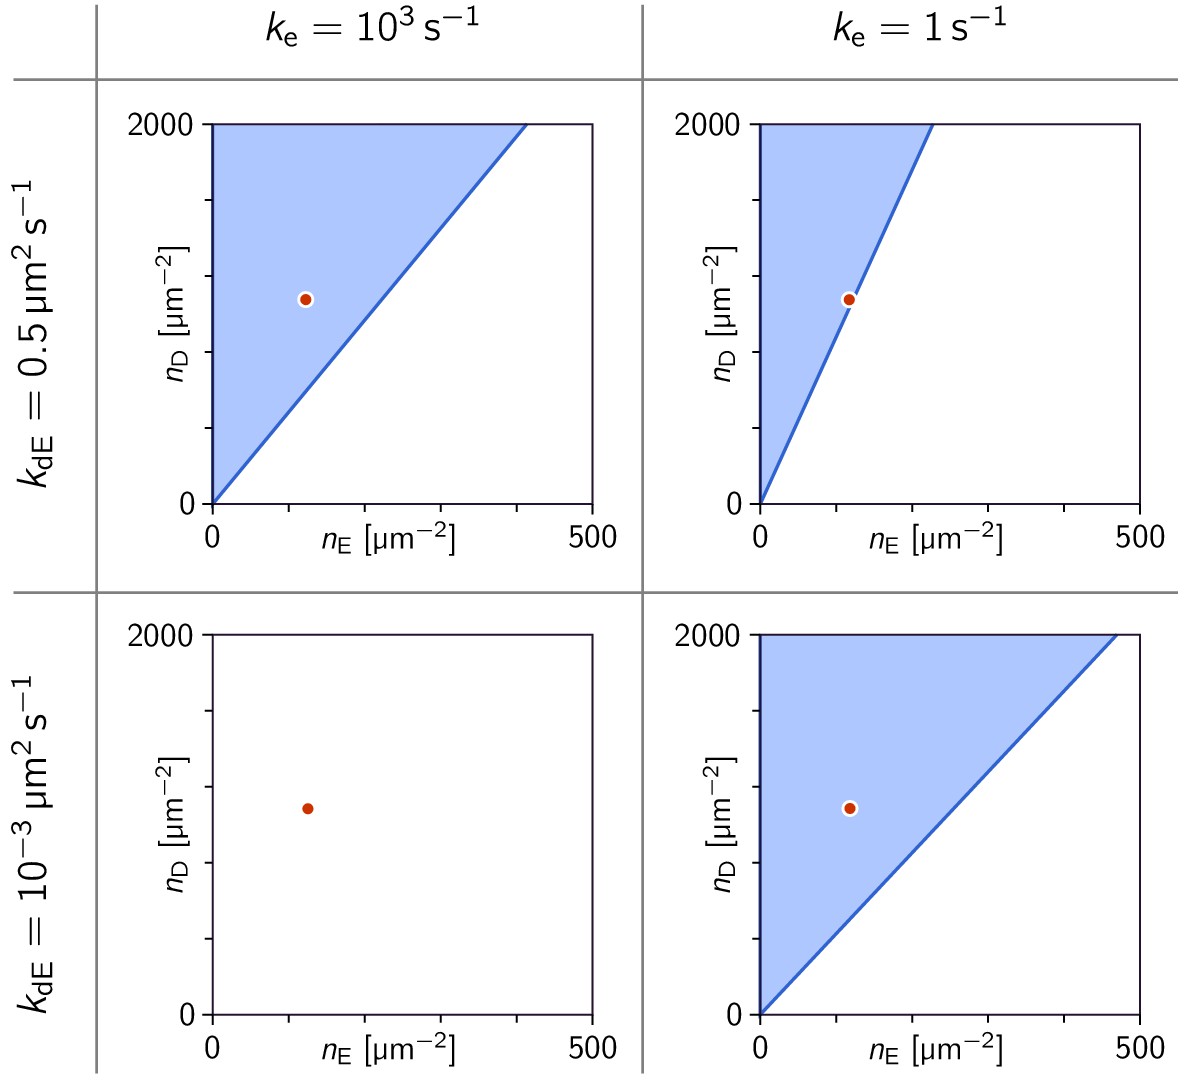
Phase diagrams in the parameter plane of total concentrations (, ).
Phase diagrams in the parameter plane of total concentrations , at four points in the parameter plane. Note that in the three cases where a linearly unstable regime exists, there is critical ratio above which there is instability. The red dot marks the concentrations µm s–2 used in Figure 3a. (In all four cases, the MinE attachment rate was set to = 5 µm s–1).
Figure 3—figure supplement 3
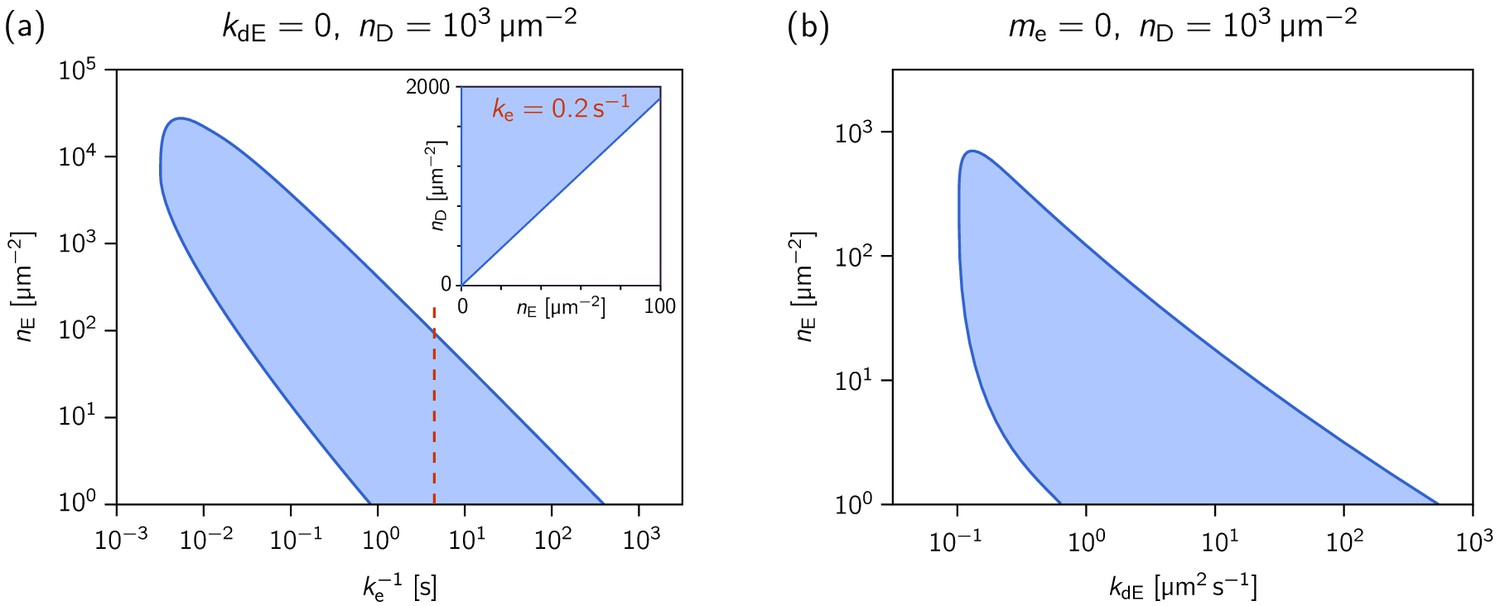
Phase diagrams showing how the range of MinE concentrations where the system is laterally unstable, depends on the MinE detachment rate and the MinE recruitment rate.
Phase diagrams showing how the range of MinE concentrations where the system is laterally unstable, depends on (a) the MinE detachment rate (at ) and (b) the MinE recruitment rate (at , i.e. ). The MinD concentration is set to = 1000 µm–2. The inset in (a) shows the phase diagram at , as an example for a parameter set that reproduces the experimentally found phase diagram for the MinE(1-31) mutant (cf. Figure 2—figure supplement 2). (The MinE attachment rate was set to = 5 µm s–1.).
Figure 3—figure supplement 4
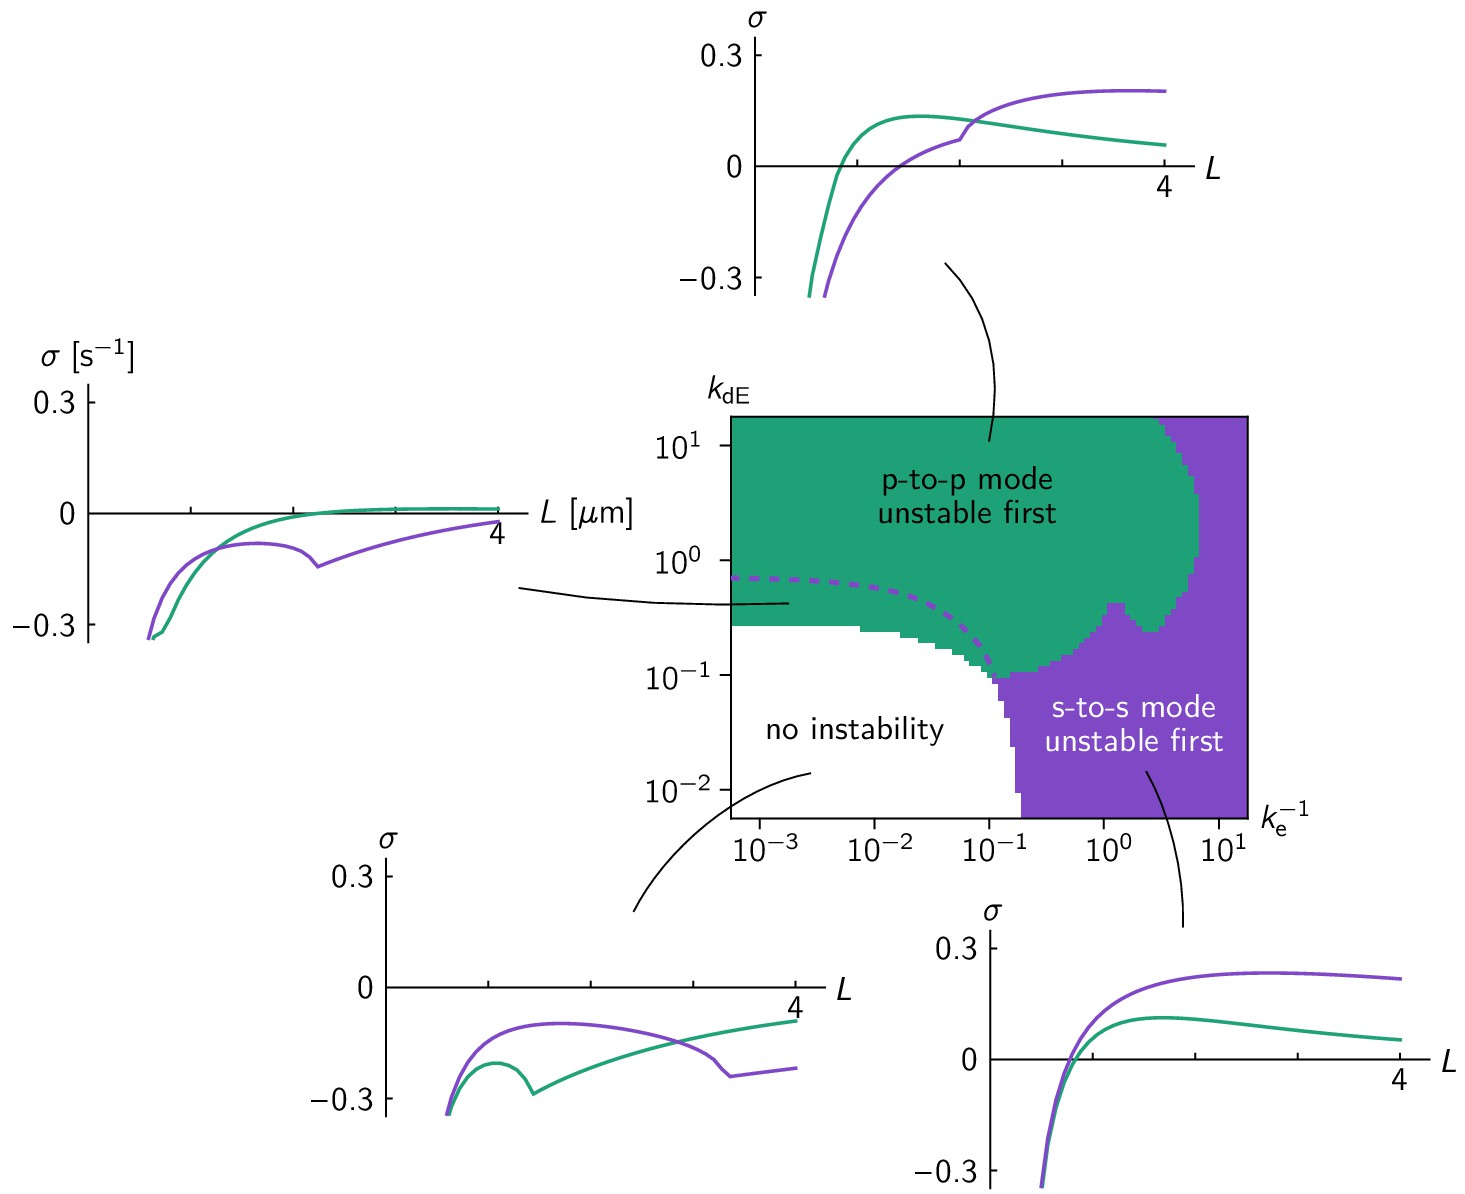
Linear stability analysis in the ellipse geometry.
Regions in the phase diagram are colored according to which eigenmode (green for pole-to-pole, purple for side-to-side mode) becomes unstable first for increasing cell size. Above the dashed purple line, the side-to-side mode grows faster at grown cell size ( = 4 µm). Typical relationships between cell size and growth rate of the pole-to-pole mode (green line) and side-to-side mode (purple line) are shown for each parameter region. Comparison to the phase diagram from numerical simulations (Figure 3b) shows that the mode becoming unstable first, not the fastest growing mode at full cell size, predicts the axis selected by the fully developed pattern. .
Figure 3—video 1
Pole-to-pole oscillation for weak MinE binding ( = 3.16 μm2s–1, = 1000 s–1).
Figure 3—video 2
Pole-to-pole oscillation for strong MinE binding ( = 3.16 μm2s–1, = 0.316 s–1).
Figure 3—video 3
Circular wave ( = 3.16 μm2s–1, = 0.1 s–1).
Figure 3—video 4
Stripe oscillation ( = 0.316 μm2s–1, = 3.16 s–1).
Figure 3—video 5
Side-to-side oscillation ( = 0.1 μm2s–1, = 0.316 s–1).
Author response image 1
Tables
Table 1
Overview over the parameters used in the mathematical model.
In vitro parameters from Halatek and Frey (2018a), in vivo parameters from Halatek and Frey (2012); Wu et al., 2016. The diffusion constants, nucleotide exchange rate , and total protein densities are known from experiments Loose et al. (2008); Meacci et al. (2006). In Halatek and Frey (2012), the kinetic rates of the Min skeleton model (, , , and ) to reproduce the in vivo phenomenology quantitatively, and to optimize the biological function of the in vivo pole-to-pole oscillation (mid-cell localization). The additional rates (, , and ) of the model extended by MinE-membrane binding are not constrained by experiment. We varied over several orders of magnitude (see Figure 3 to study the role of persistent MinE-membrane binding. Note that, changing the MinE-recombination rate over several orders of magnitude does not change our results qualitatively (topology of the phase diagrams).
| Name | Unit | In vitro | In vivo |
|---|---|---|---|
| μm2 s–1 | 0.013 | 0.013 | |
| μm2 s–1 | 60 | 16 | |
| μm2 s–1 | 60 | 10 | |
| s–1 | 6 | 6 | |
| μm–2 | 1200 (≈ 1μM) | 2000/Vcell | |
| μm–2 | 120 (≈ 1μM) | 700/Vcell | |
| μm s–1 | 0.065 | 0.1 | |
| μm2 s–1 | 0.098 | 0.108 | |
| μm2 s–1 | 0.126 | 0.65 | |
| s–1 | 0.34 | 0.4 | |
| μm s–1 | 0.1 | 0.2 | |
| s–1 | 10–1 to 105 | 10–1 to 103 | |
| μm s–1 | 0, 5 | 0, 5 |
Additional files
Download links
A two-part list of links to download the article, or parts of the article, in various formats.
Downloads (link to download the article as PDF)
Open citations (links to open the citations from this article in various online reference manager services)
Cite this article (links to download the citations from this article in formats compatible with various reference manager tools)
Design of biochemical pattern forming systems from minimal motifs
eLife 8:e48646.
https://doi.org/10.7554/eLife.48646


