Circuits that encode and guide alcohol-associated preference
- Department of Neuroscience, Brown University, United States
- Department of Molecular Pharmacology and Physiology, Brown University, United States
- Department of Pharmacology, University of Cologne, Germany
- Department of Biochemistry, Brown University, United States
Figures
Figure 1 with 8 supplements
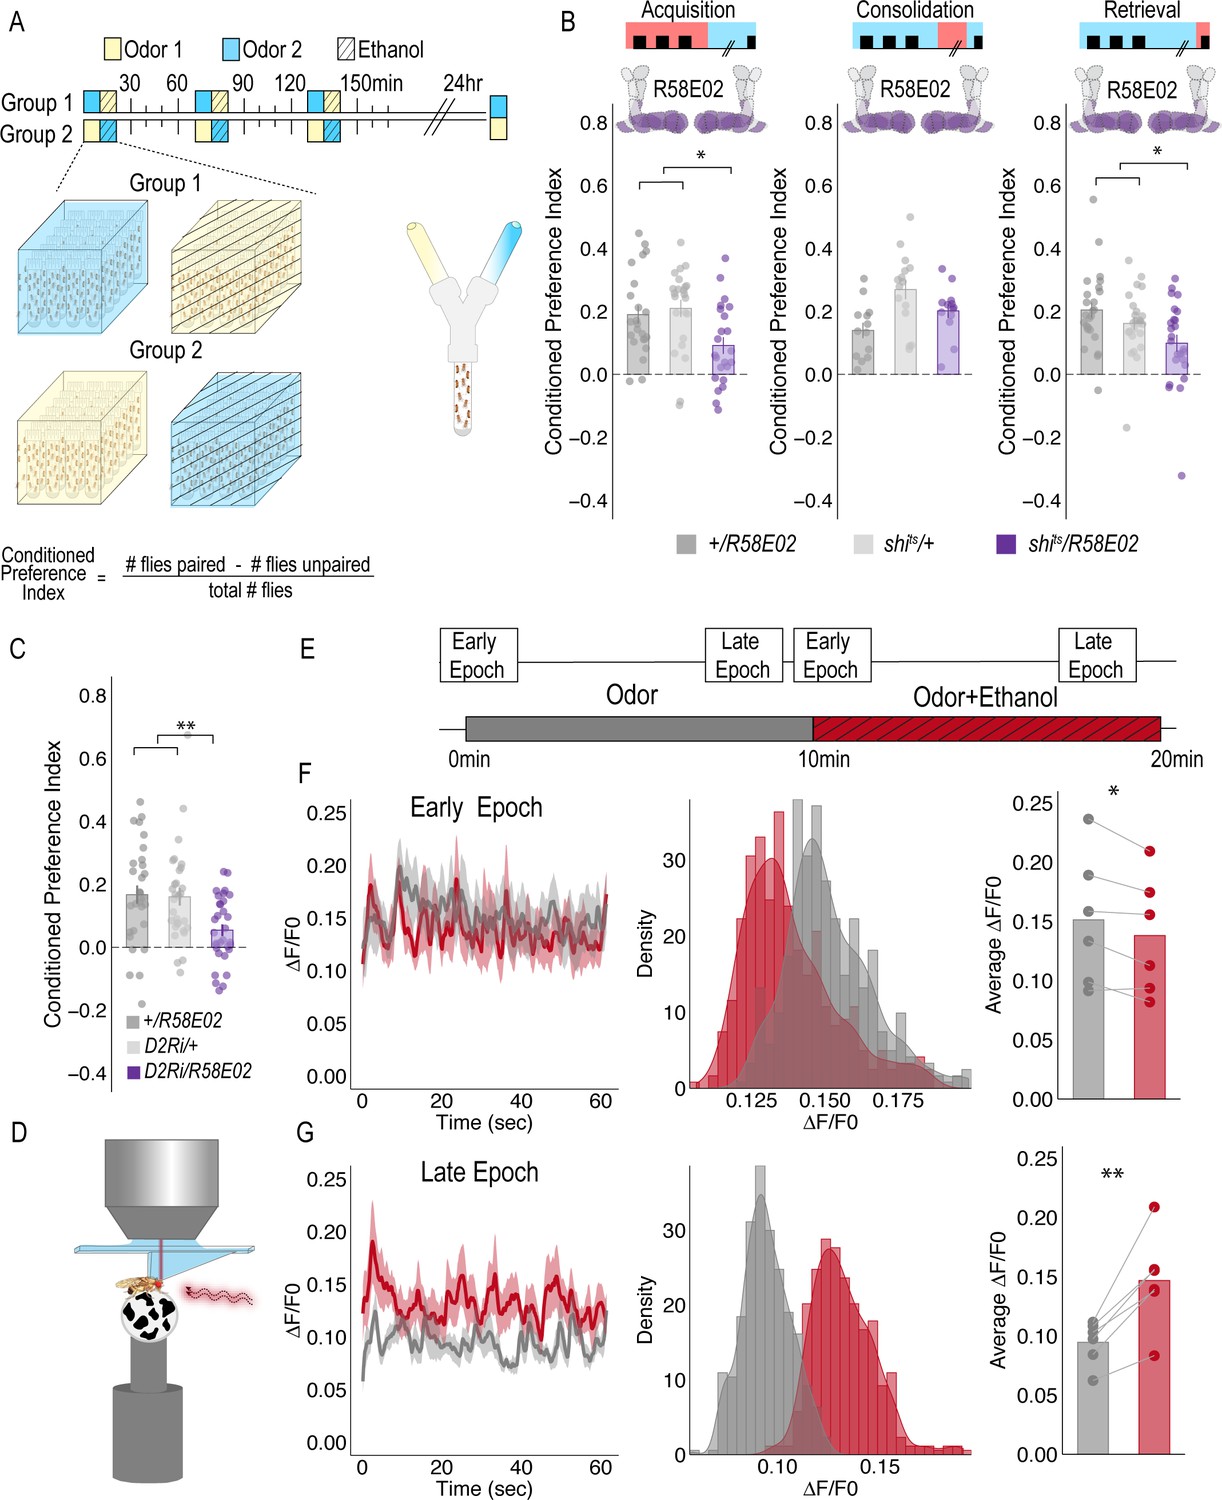
PAM DANs are necessary for encoding alcohol-associated preference.
(A) Schematic illustrating odor condition preference paradigm. Vials of 30 flies are presented with three sessions of 10 min of an unpaired odor, followed by 10 min of a paired odor plus intoxicating vaporized ethanol. To control for odor identity, reciprocal controls were used. Flies were tested 24 hr later in a standard Y maze (B) PAM dopaminergic neurons activity is necessary during acquisition (F(2, 66)=5.355, p=0.007) and retrieval (F(2,71)=5.707, p=0.005), but not consolidation. Bar graphs illustrate mean +/- standard error of the mean. Raw data are overlaid on bar graphs. Each dot is an n of 1, which equals approximately 60 flies (30 per odor pairing). One-way ANOVA with Tukey Posthoc was used to compare mean and variance. *p<0.05 (C) RNAi knockdown of D2R within the PAM population targeted using the R58E02 GAL4 driver significantly reduced alcohol-associated preference F(2,89)=6.441, p=0.002. (D) Schematic illustrating calcium imaging paradigm. (E) Flies are exposed to odor followed by odor plus intoxicating vaporized ethanol while resting or walking on a ball. We used the same odor for both conditions so we could better compare circuit dynamics in response to ethanol and control for odor identity. Fluorescence was captured for 61 s recording epochs that were equally spaced by 2 min. (F). Average traces recorded during early odor and odor plus ethanol exposures. Middle panels illustrate the binned ΔF/F0 and highlights a change in calcium dynamics as a consequence of ethanol exposure. Right panels illustrate the average ΔF/F0 for each fly in each condition. Early Epochs of odor plus ethanol had significantly lower signal (F(1,5)=8.705, p=0.03). (G) Average traces recorded during late odor and odor plus ethanol exposures. Middle panels illustrate the binned ΔF/F0 and highlights a change in calcium dynamics as a consequence of ethanol exposure. Right panels illustrate the average ΔF/F0 for each fly in each condition. Late Epochs of odor plus ethanol had significantly higher signal (F(1,5)=24.177, p=0.004). Within Subject Repeated Measures ANOVA was used to compare mean and variance across condition and time. Scale bar = 50 μm *p<0.05 **p<0.01.
Figure 1—figure supplement 1
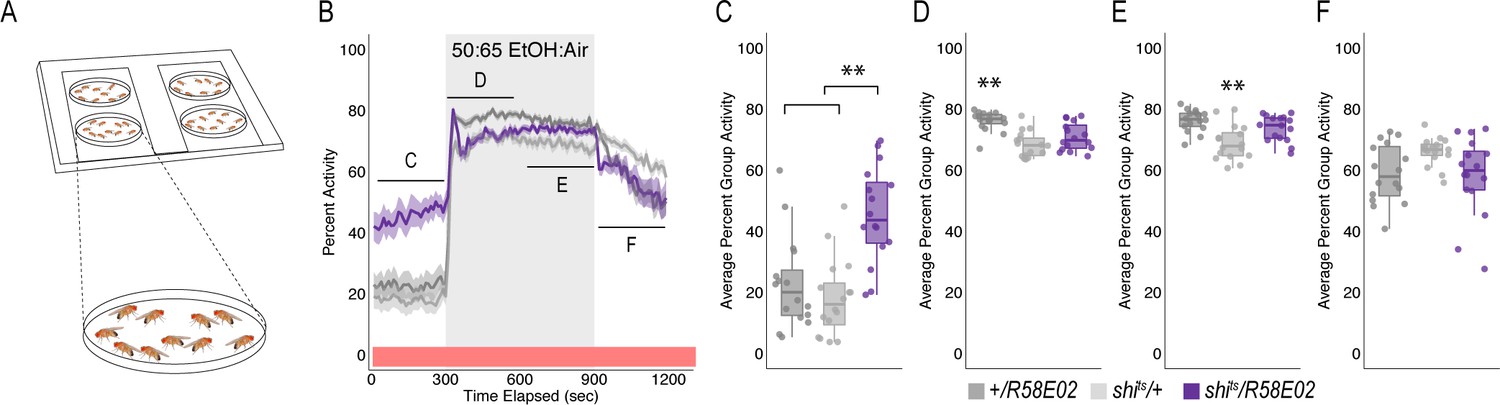
Although inactivation of PAM neurons increased group flies in an open field arena (n = 15), it did not affect alcohol induced activity suggesting that a decrease in preference is encoded independently from the amount of activity animals exhibit while intoxicated (Figure 1G).
(A) Schematic of flyGrAM. Groups of ten male flies were placed into four behavioral chambers. Flies were exposed to five minutes of air, following by ten minutes of ethanol, and lastly 5 min of air. Group activity of flies was recorded at 33 frames per second. (B) Group activity counts were binned over 10 s periods, averaged across biological replicates of 10 flies each (n = 15) and plotted against time. Ethanol was delivered over a 10 min period starting at 300 s as denoted by the gray shaded region. Lines depict mean +/- standard error. Repeated Measures ANOVA with planned contrasts at baseline, early ethanol, late ethanol, and recovery indicated a significant interaction between groups and treatment (F(3.38, 76)=16.21, p=0.00). Mauchly’s test indicated that the assumption of sphericity had been violated (X2(5)=90.51, p=0.00), therefore multivariate tests are reported (ε=0.563). All Posthoc analyses were performed with Bonferroni corrections. (C) Group activity responses of shits/R58E02 were significantly higher during baseline as compared to genetic controls (p=0.000) (D) Group activity responses of shits/R58E02 during early ethanol (first 5 min) was not significantly different from both genetic controls. (E) Group activity responses of shits/R58E02 during late ethanol (last 5 min) was not significantly different from both genetic controls (F). Group activity responses of shits/R58E02 during recovery were not significantly different for genetic controls *p<0.05, **p<0.01.
Figure 1—figure supplement 2
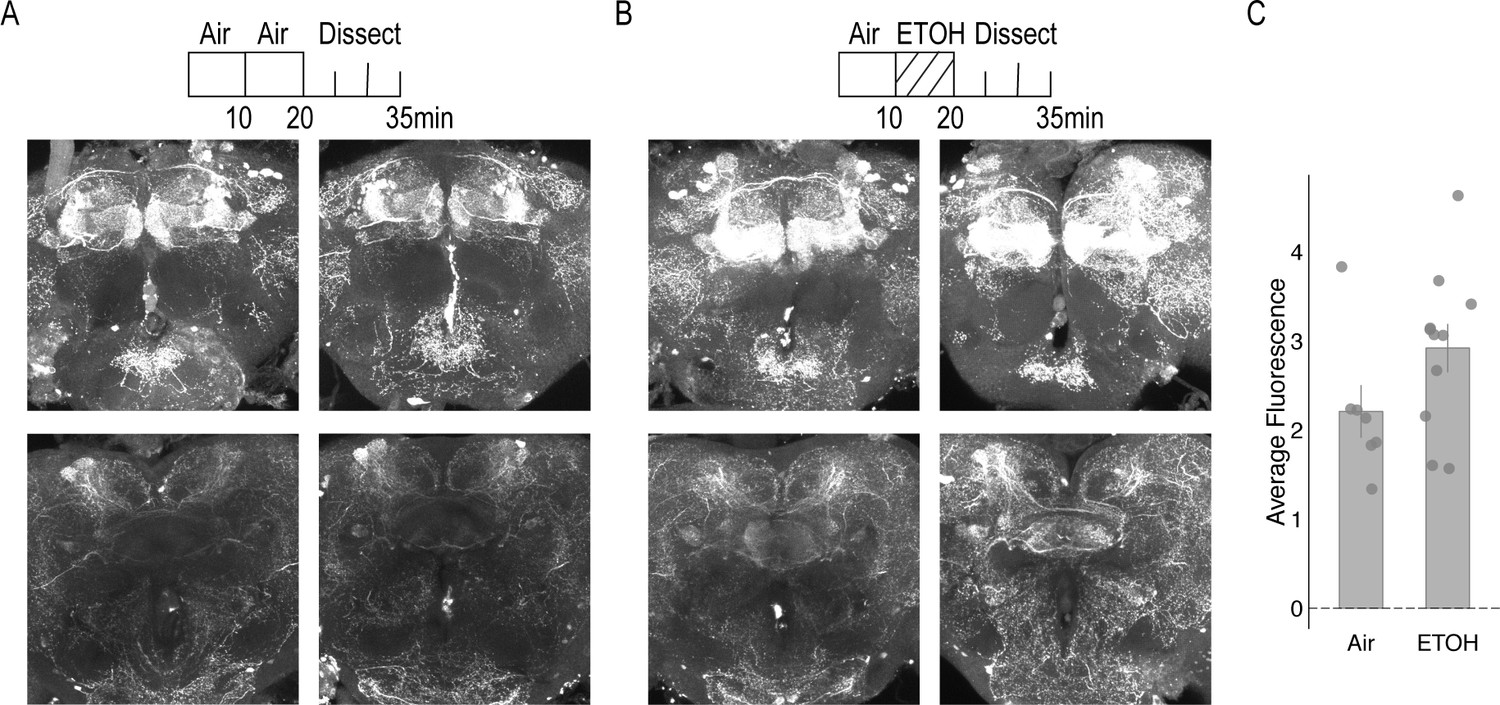
Dopamine staining within the brain following 10 min of air or 10 min of ethanol.
(A) Air condition: Flies were habituated for 10 min in the behavior box followed by an additional 10 min of air and dissected immediate after. (B) Ethanol condition: Flies were habituated for 10 min in the behavior box followed by 10 min of ethanol. In both conditions, the top panel illustrates staining with the MB. Maximum intensity z stacks were collected from the start of the gamma lobe to the end of the α/β, α`β` lobes. Each stack consists of approximately 20 µm slices. Bottom panel illustrates staining within the central complex, predominately the FSB. Maximum intensity z stacks were collected from the start of the EB to the end of the FSB. Each stack consists of approximately 20 1 um slices. (C) Air and ethanol conditions did not significantly affect average dopamine fluorescence F(1,16)=2.947, p=0.105. Bar graphs illustrate mean +/- standard error of the mean. Raw data are overlaid on bar graphs. Each dot is one fly. One-way ANOVA was used to compare mean and variance.
Figure 1—figure supplement 3
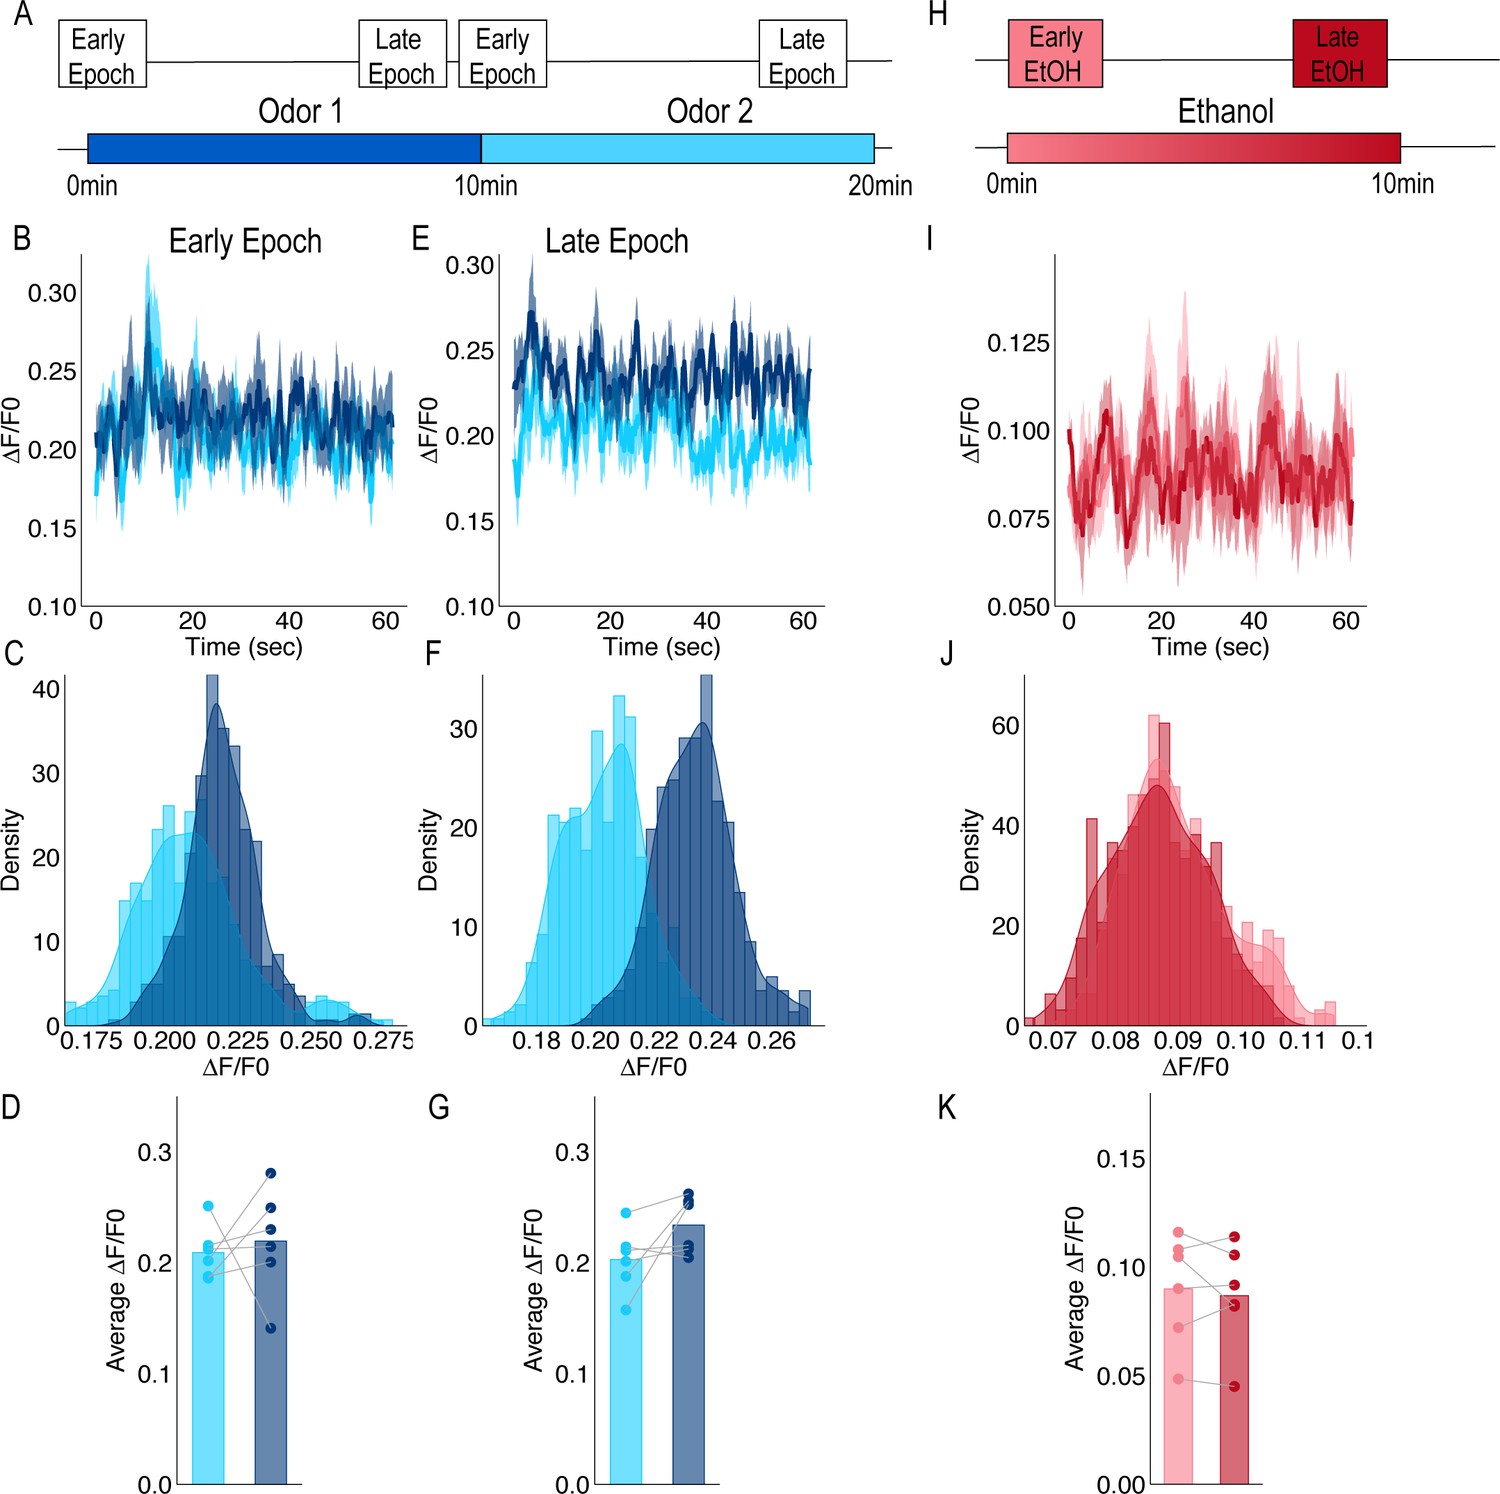
Calcium Imaging from terminals of PAM population of DANs in response to odors and ethanol.
(A) Schematic of odor presentation. Flies were presented with one odor for 10 min followed by a second odor for an additional 10 min. Isoamyl acetate and isoamyl alcohol were used as odors and order was counterbalanced across animals. Images were captured for a total of 60 s during Early and Late Epochs. (B) Traces of response to Odor one and Odor two during the Early Epochs. (C) Histograms of the frequency of delta F/F0 during the Early Epoch (D) Comparison of average response to Odor one and Odor two during Early Epochs for each animal (n = 6) were not significantly different. Repeated measure ANOVA was used to compare mean and variance F(1,5)=0.144, p=0.720. (E) Traces of response to Odor one and Odor two during the Late Epochs. (F) Histograms of the frequency of delta F/F0 during the late Epoch. (G) Comparison of average response to Odor one and Odor two during Late Epochs for each animal (n = 6). Repeated measure ANOVA was used to compare mean and variance F(1,5)=3.437, p=0.123. (H) Schematic of 50% ethanol presentation. Images were captured for the entire 10 min, however, to remain consistent with other recording paradigms, only 60 s during Early and Late time points were analyzed. (I) Traces of response to ethanol during Early and Late Epochs. (J) Histograms of the frequency of delta F/F0 during the Early and Late Epochs. (K) Comparison of average response during Early and Late Epochs of ethanol were not significantly different. Repeated measure ANOVA was use to compare mean and variance F(1,5)=0.390, p=0.560.
Figure 1—figure supplement 4
Requirement of PAM DANs and Kenyon cells in formation of alcohol-associated preference.
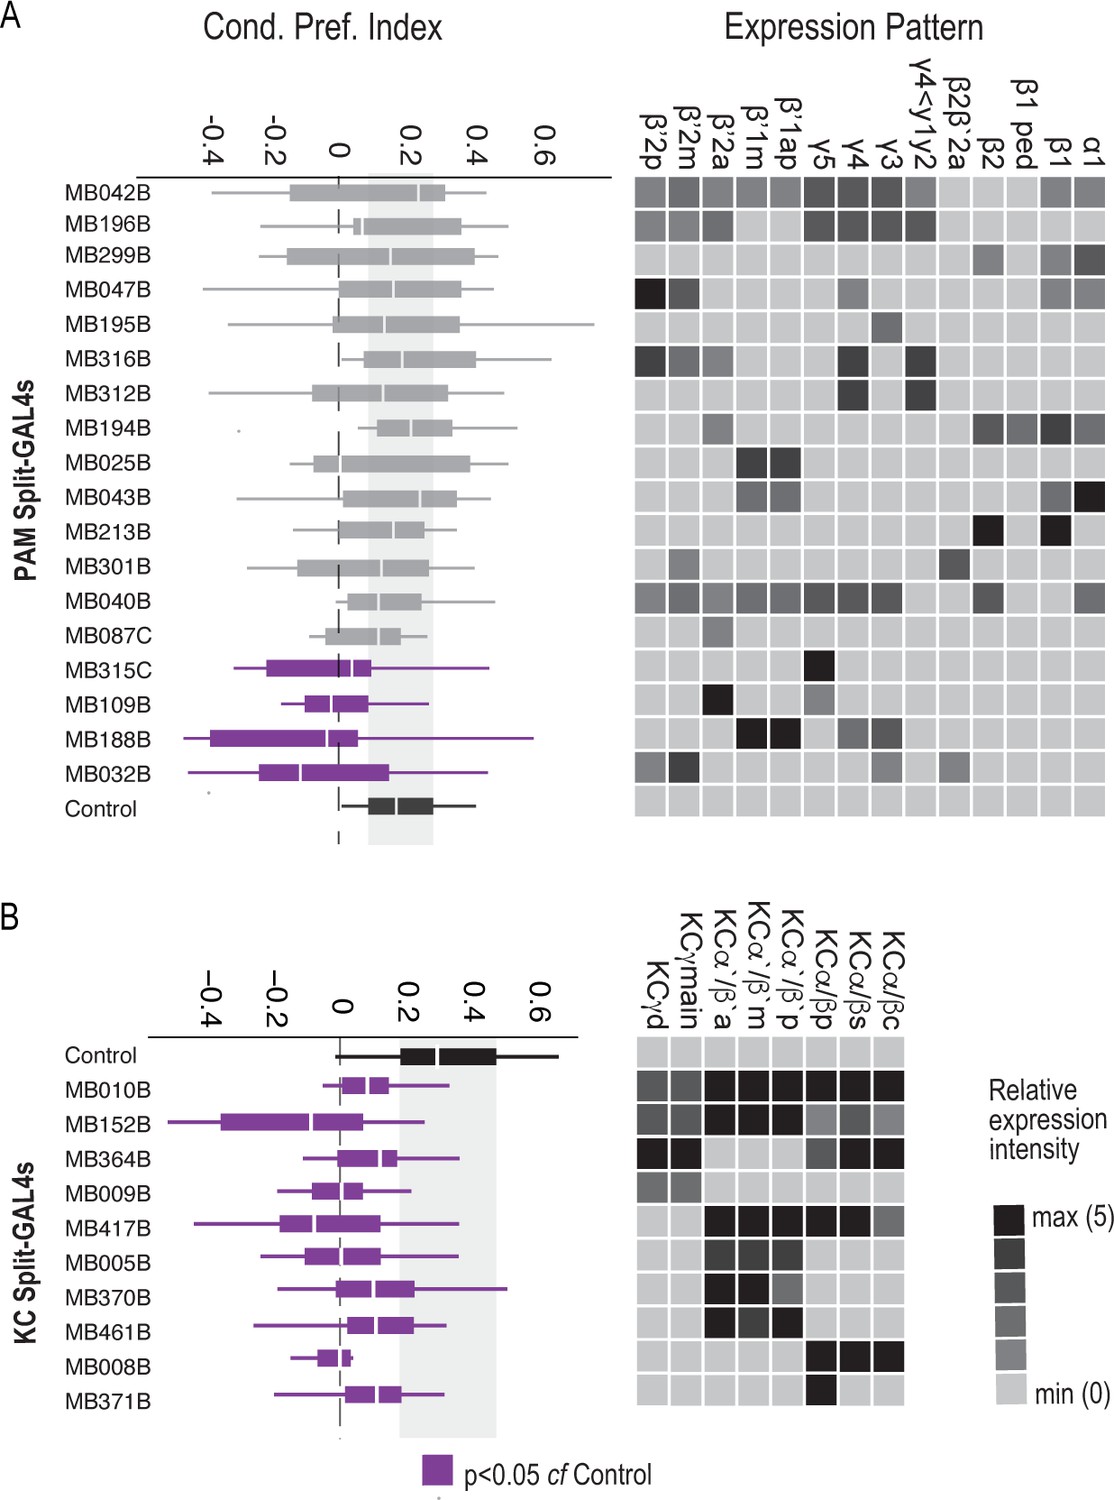
(A) Inactivation of subsets of PAM DANs during both acquisition and retrieval resulted in significant decreases in preference for alcohol associated cues χ2(18)=30.81, p=0.03. Four of the 18 specific PAM Split-GAL4 lines which predominately express in the medial aspect of the MB resulted in significant decreases as compared to control lines (MB315C, MB109B, MB188B, and MB032B). (b) Inactivation of subsets of Kenyon cells during both acquisition and retrieval using 10 specific Kenyon cell Split-GAL4 lines. All 10 lines resulted in significant decreases in preference for alcohol associated cues. χ2(10)=27.97, p=0.002. Kruskal Wallis was used to compare mean and variance with Dunnett’s Posthoc test compared to control. Purple fill indicates p<0.05.
Figure 1—figure supplement 5
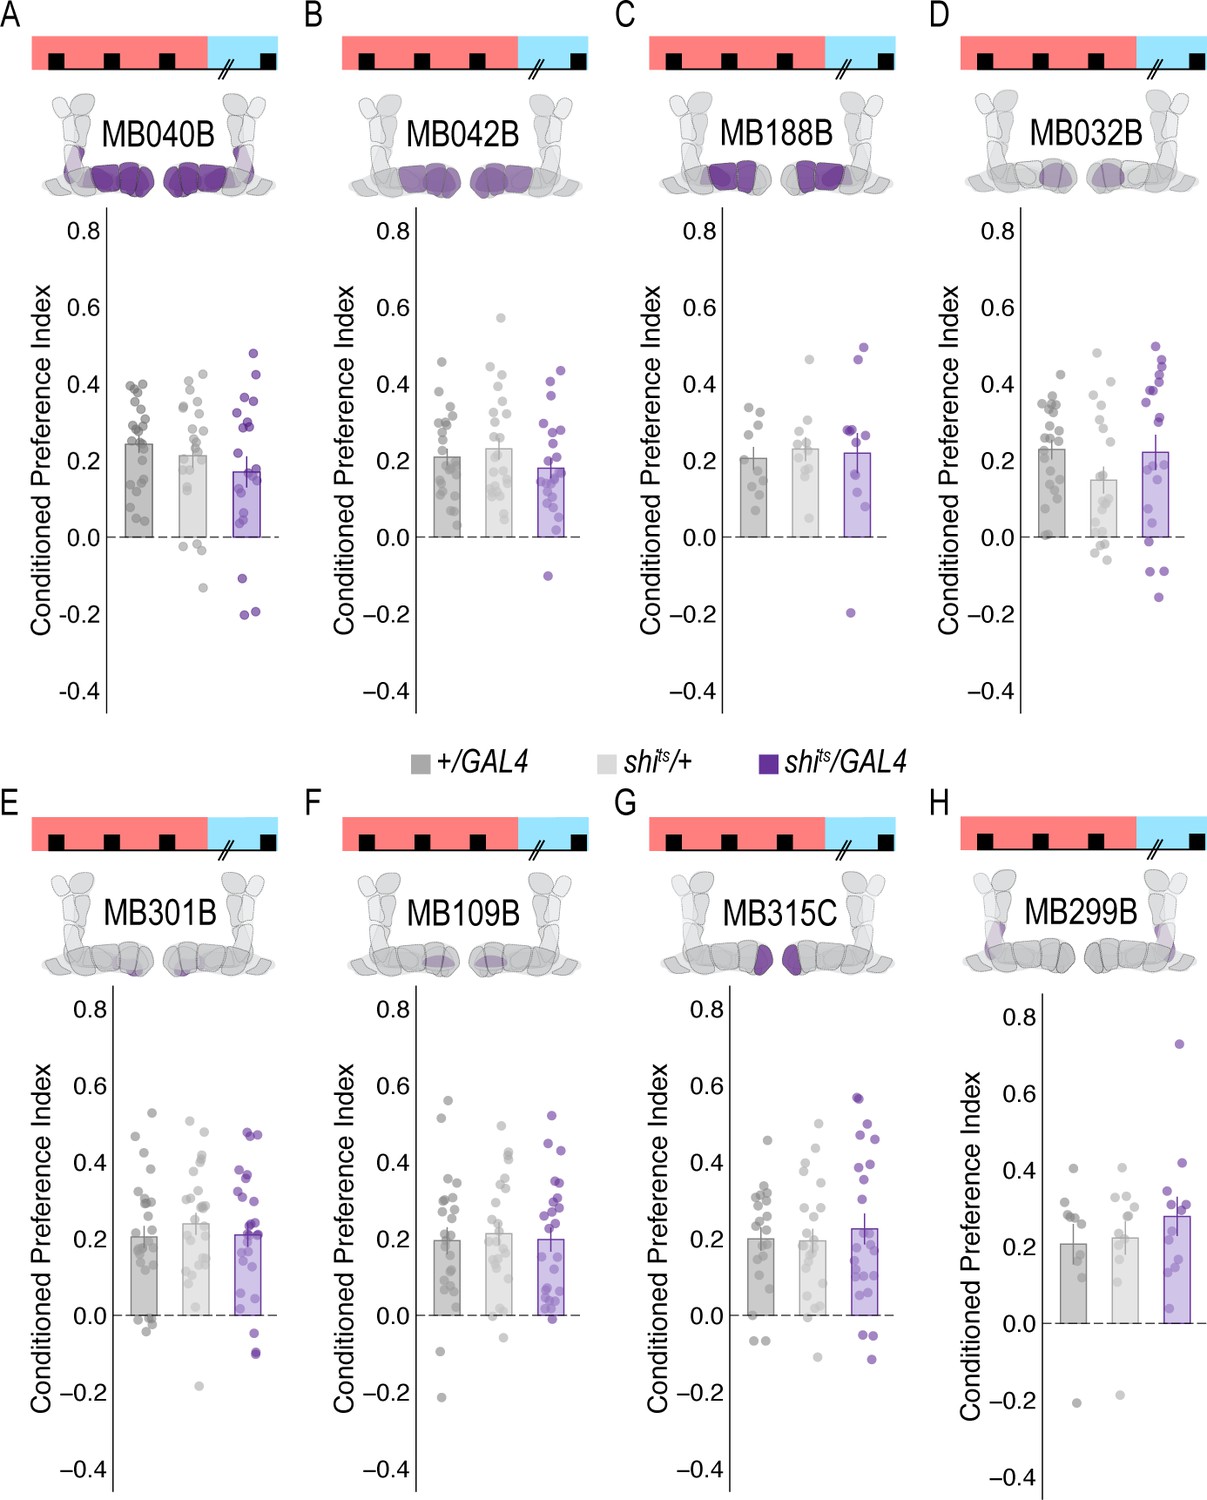
Subsets of PAM DANs are dispensable for encoding alcohol-associated preference.
(A–H) Using thermogenetics to inactivate neurotransmission during acquisition in dopaminergic neurons with varying expression patterns did not disrupt alcohol-associated preference. Split-Gal4 lines tested are ordered by MB innervation patterns. Bar graphs illustrate mean +/- standard error of the mean. Raw data are overlaid on bar graphs. Each dot is an n of 1, which equals approximately 60 flies (30 per odor pairing). One-way ANOVA was used to compare mean and variance.
Figure 1—figure supplement 6
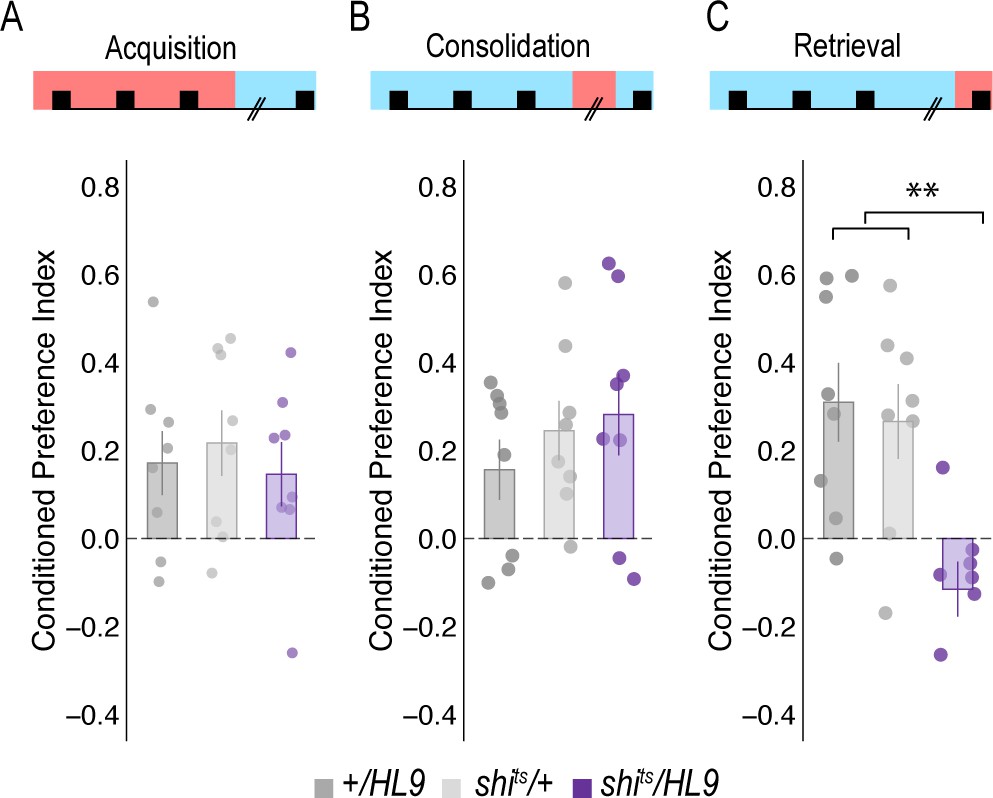
Subsets of PAM DANs are required for retrieval, but not acquisition or consolidation.
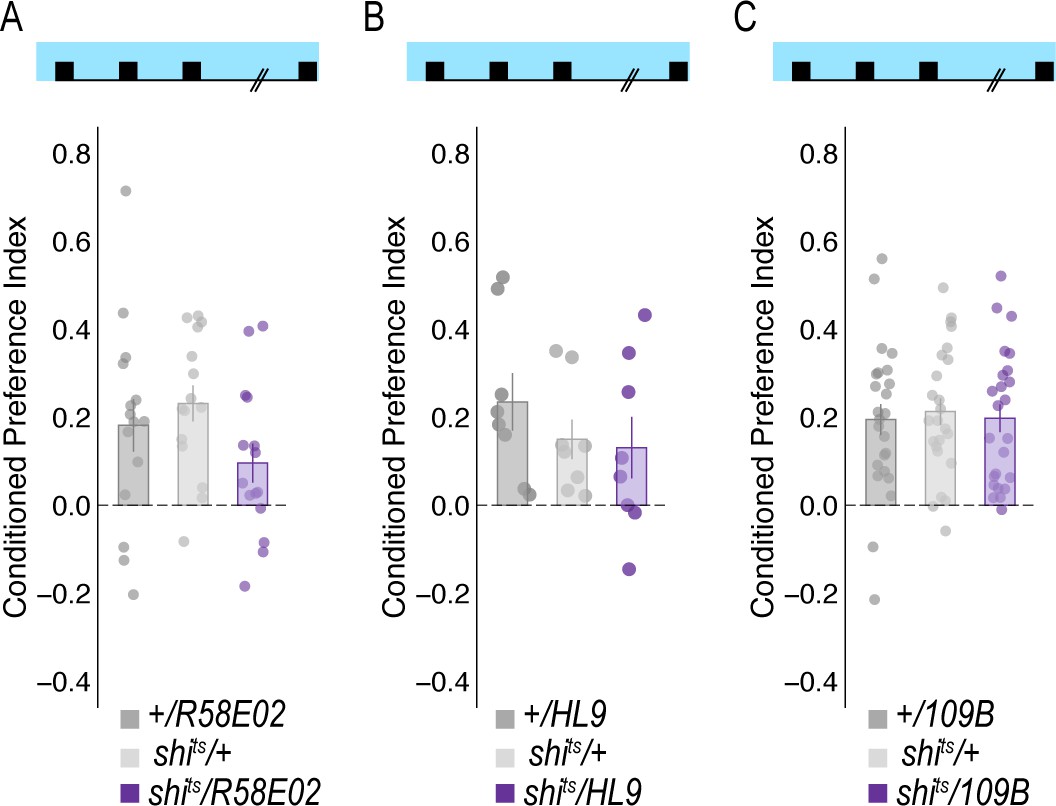
(A) Inactivating subsets of PAM neurons during acquisition using the HL9-GAL4 driver, which is not a split-GAL4 line, did not disrupt alcohol associated preference (Claridge-Chang et al., 2009) F(2,21)=0.24, p=0.788. (B) Inactivating subsets of PAM neurons during consolidation, defined as the overnight period between acquisition and retrieval did not disrupt alcohol associated preference F(2,21)=0.698, p=0.509. (C) However, inactivating the same subsets of PAM DANs during retrieval significantly disrupted alcohol associated preference F(2,21)=8.596, p=0.002. Bar graphs illustrate mean +/- standard error of the mean. Raw data are overlaid on bar graphs. Each dot is an n of 1, which equals approximately 60 flies (30 per odor pairing). One-way ANOVA was used to compare mean and variance. **p<0.01.
Figure 1—figure supplement 7
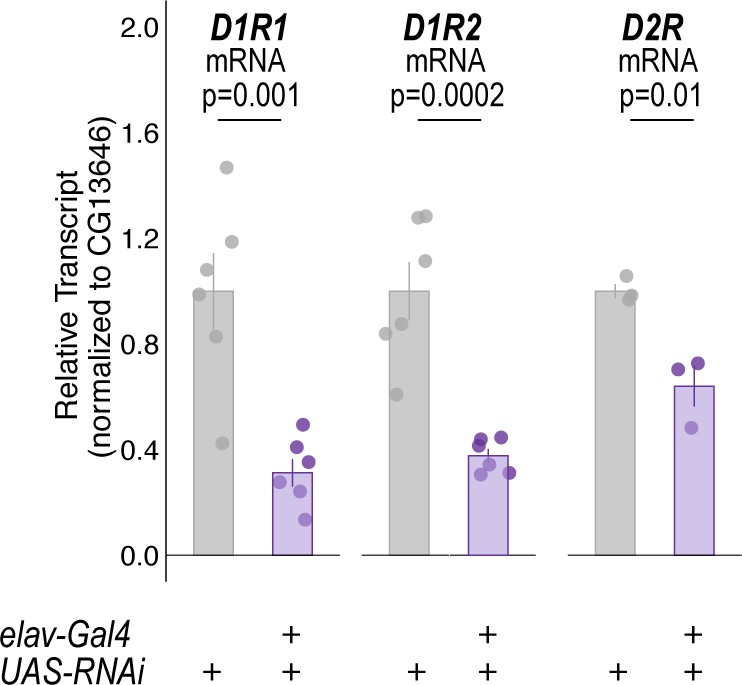
mRNA quantification of dopamine receptors (DRs) in all neurons following constitutive expression of DR-RNAi's.
Quantitative RT-PCR on whole heads of flies expressing respective dopamine receptor RNAi with pan-neuronal elav-Gal4. Bar graphs illustrate mean +/- standard error of the mean. Raw data are overlaid on bar graphs. One-way ANOVA was used to compare mean and variance with Tukey Posthoc comparing control to experimental for each RNAi experiment.
Figure 1—figure supplement 8
Temperature controls for DAN inhibition experiments that showed decreases in retrieval of alcohol associated preference at the restrictive temperature.
Flies were trained and tested at permissive temperatures (20°C) and exhibited normal alcohol associated preference for pair odor cues under these conditions.
Figure 2
Memory expression during retrieval is dependent on a sparse population of DANs.
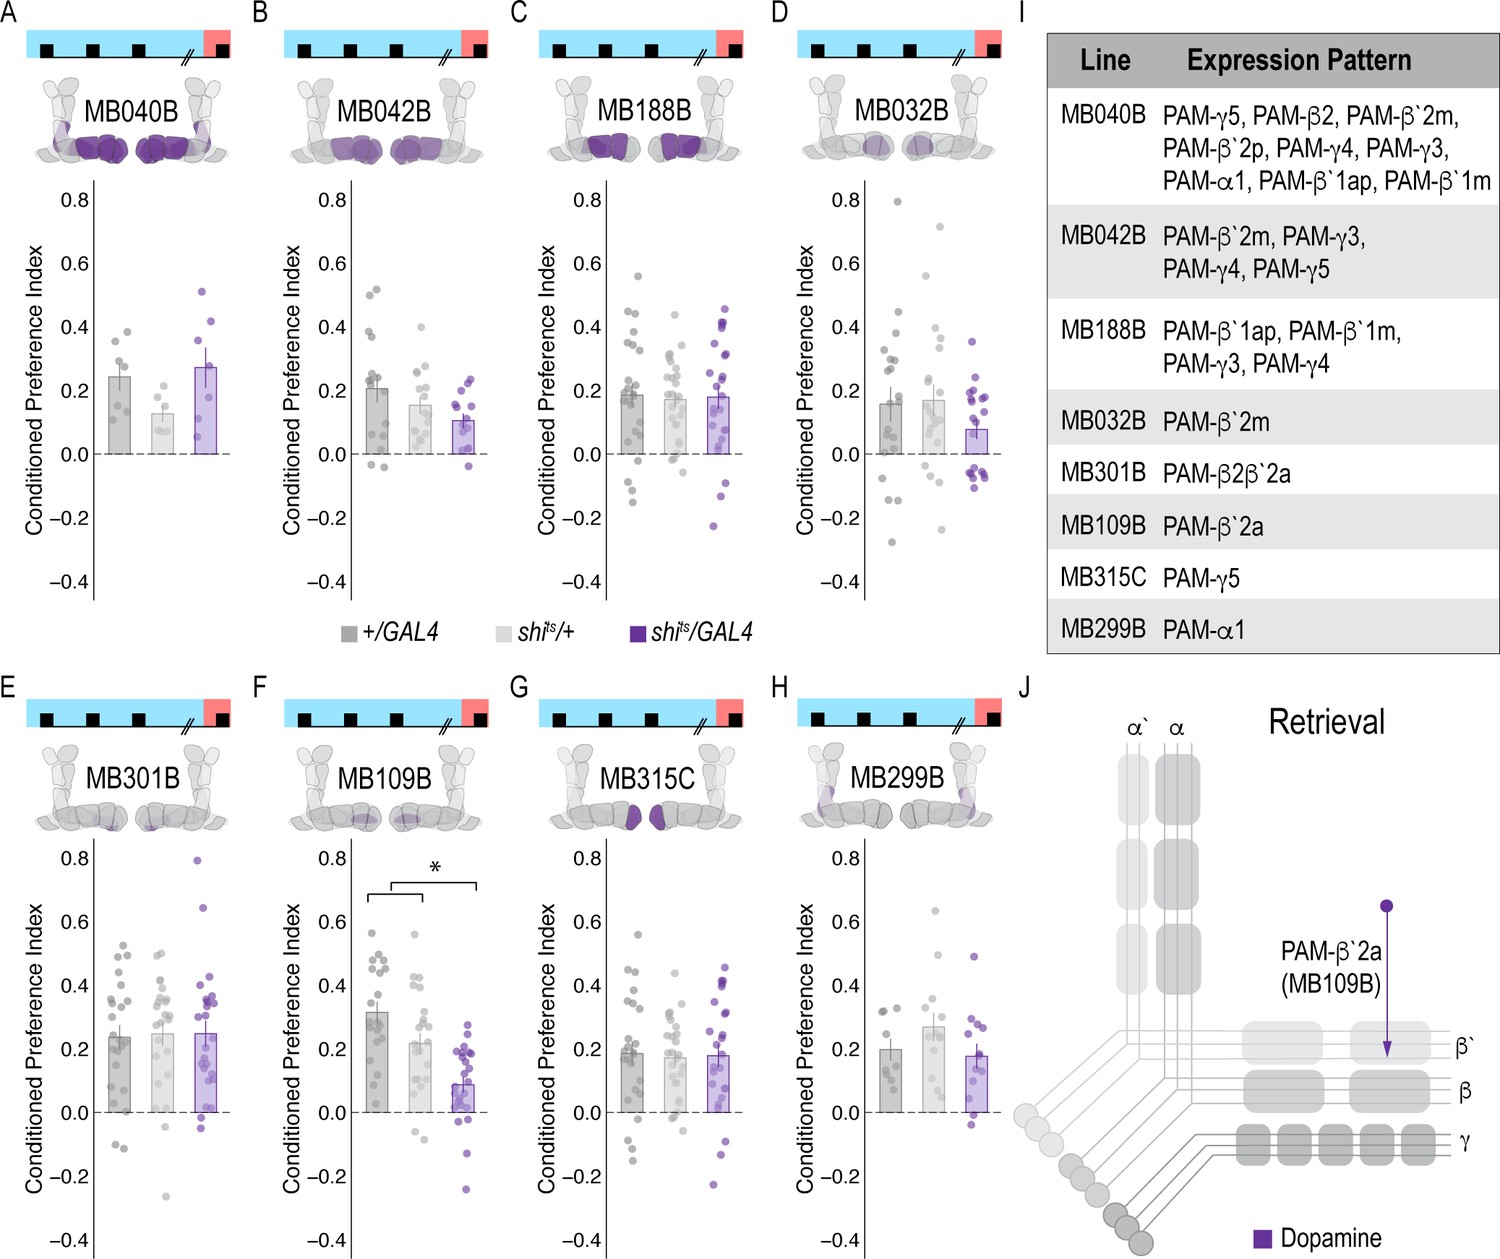
(A–H) A thermogenetic approach was used to inactivate neurotransmission during retrieval, but not acquisition, in PAM DANs with varying expression patterns. (F) Inactivating β`2a DANs during retrieval significantly reduced preference for alcohol-associated cues. One-way ANOVA with Tukey Posthoc was used to compare mean and variance. F(2,65)=14.18, p=7.78×10^−6. Bar graphs illustrate mean +/- standard error of the mean. Raw data are overlaid on bar graphs. Each dot is an n of 1, which equals approximately 60 flies (30 per odor pairing). (I) Chart illustrating the expression pattern of each split-GAL4 tested with intensity ranges of 2–5 (Aso et al., 2014a). (J) Model of circuits responsible for expression of alcohol-associated preference during retrieval, which highlights the importance of sparse subsets of dopaminergic activity during retrieval for the expression of alcohol-associated preference. *p<0.01.
Figure 3
Memory expression during retrieval, but not acquisition, is dependent on a sparse population of glutamatergic MBONs.
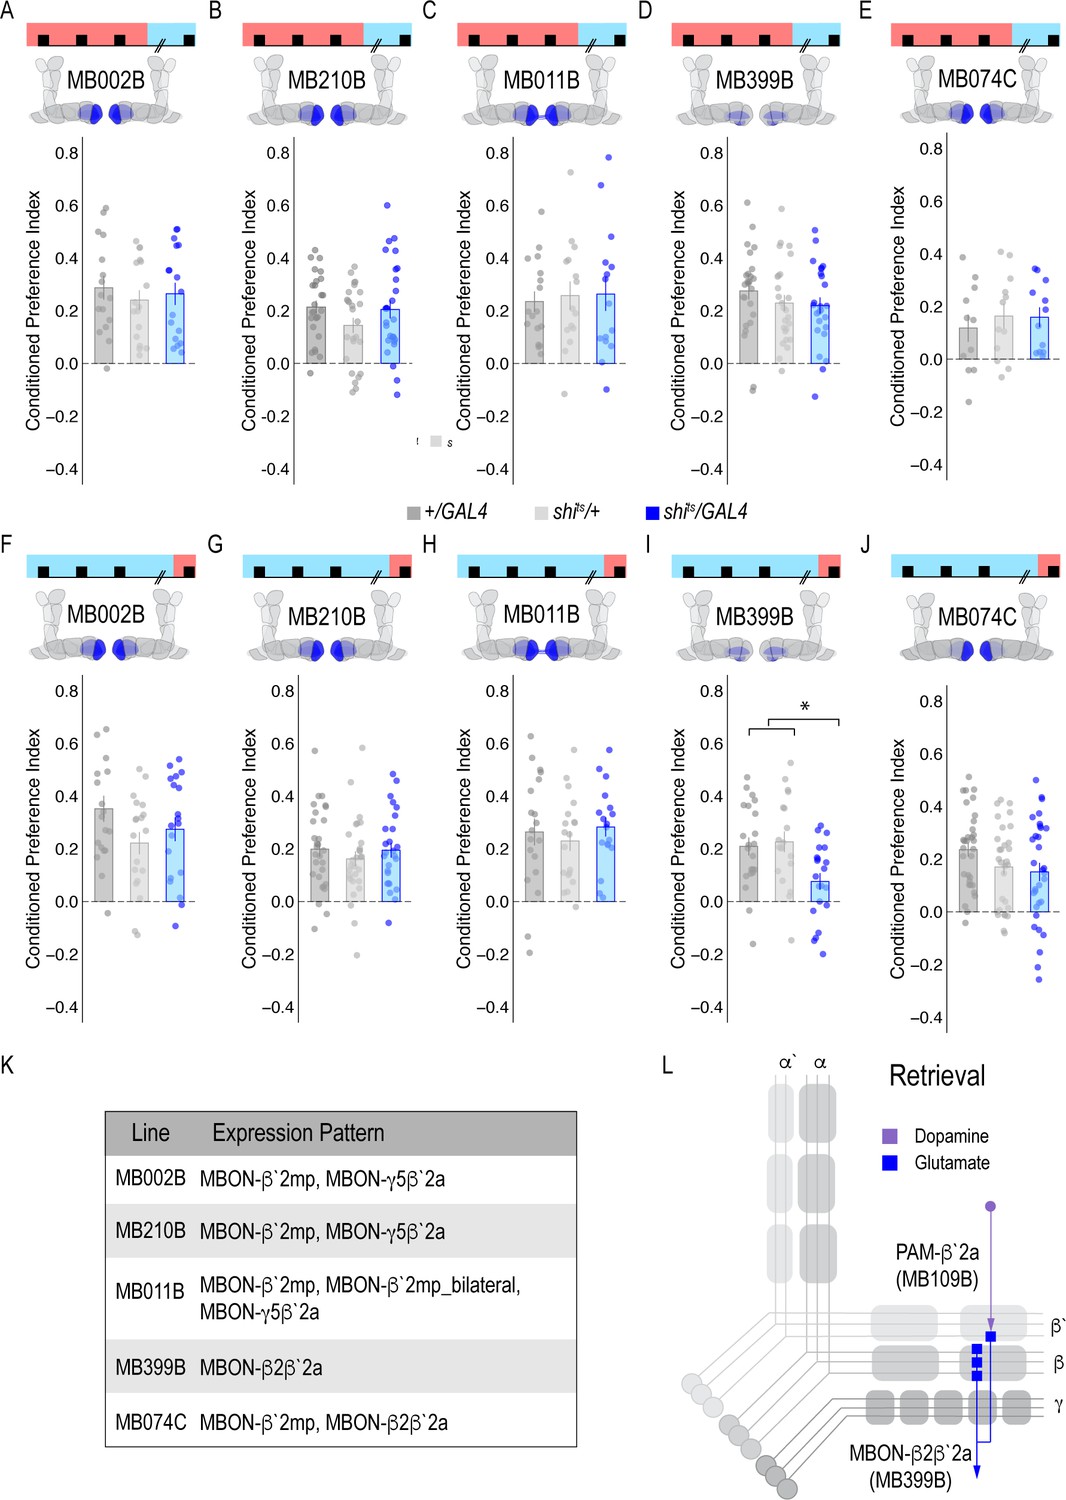
(A–E) Thermogenetic inactivation of glutamatergic MBONs innervating similar compartments to β`2a PAM DANs during acquisition did not disrupt encoding of alcohol-associated preference. (F–J) However, inactivating neurotransmission during retrieval revealed the specific importance of MBON β2β`2a glutamatergic neuron (I) for the expression of alcohol-associated preference F(2,59)=5.62, p=0.006. One-way ANOVA with Tukey Posthoc was used to compare mean and variance. *p<0.01 Bar graphs illustrate mean +/- standard error of the mean. Raw data are overlaid on bar graphs. Each dot is an n of 1, which equals approximately 60 flies (30 per odor pairing). (K) Chart illustrating the expression pattern of each split-GAL4 tested with intensity ranges of 2–5 (Aso et al., 2014a). (L) Updated model of circuits responsible for expression of alcohol-associated preference. Retrieval circuits require specific subsets of DANs and a single MBON glutamatergic neuron innervating the β2`a compartment.
Figure 4 with 2 supplements

MBON β`2mp glutamatergic neuron is postsynaptic to β`2a PAM DANs and important for memory consolidation.
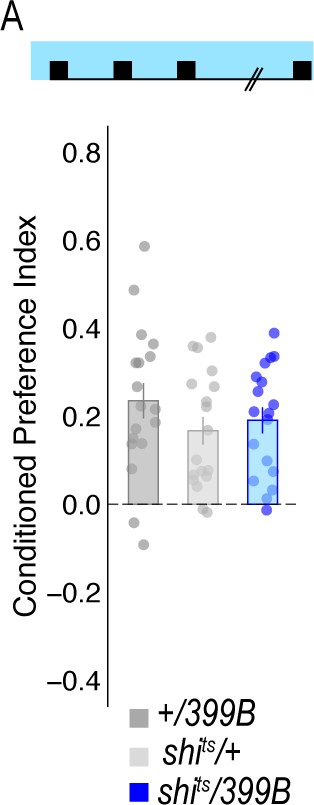
(A) Representative maximum projection confocal stacks of MB109B > transTango. (B) trans-Tango reveal the α`/β` MB lobe (i) and MBON β`2mp neurons (ii) as postsynaptic to β`2a DANs. (C) Thermogenetic inactivation of MBON β`2mp during consolidation using MB002B significantly increased alcohol reward preference F(2,54) = 9.287, p=0.0003. Thermogenetic inactivation of β`2mp during consolidation using MB074C significantly increased alcohol reward preference relative to UAS controls F(2,71) = 3.51, p=0.04. (D) Knockdown of D2R in MBON β`2mp using MB002B significantly decreased alcohol-associated preference F(2,63)=12.77, p=2.22×10^−05. Knockdown of D2R in MBON β`2mp using MB074C significantly decreased alcohol-associated preference relative to GAL4 controls F(2,71)=3.51, p=0.04. One-way ANOVA with Tukey Posthoc was used to compare mean and variance. Bar graphs illustrate mean +/- standard error of the mean. *p<0.05 **p<0.01 (f) Circuits responsible for encoding alcohol-associated preference during retrieval. Scale bar = 50 μm.
Figure 4—figure supplement 1
RNAi knockdown of dopamine receptors in β`2 MBONs in alcohol-associated preference.
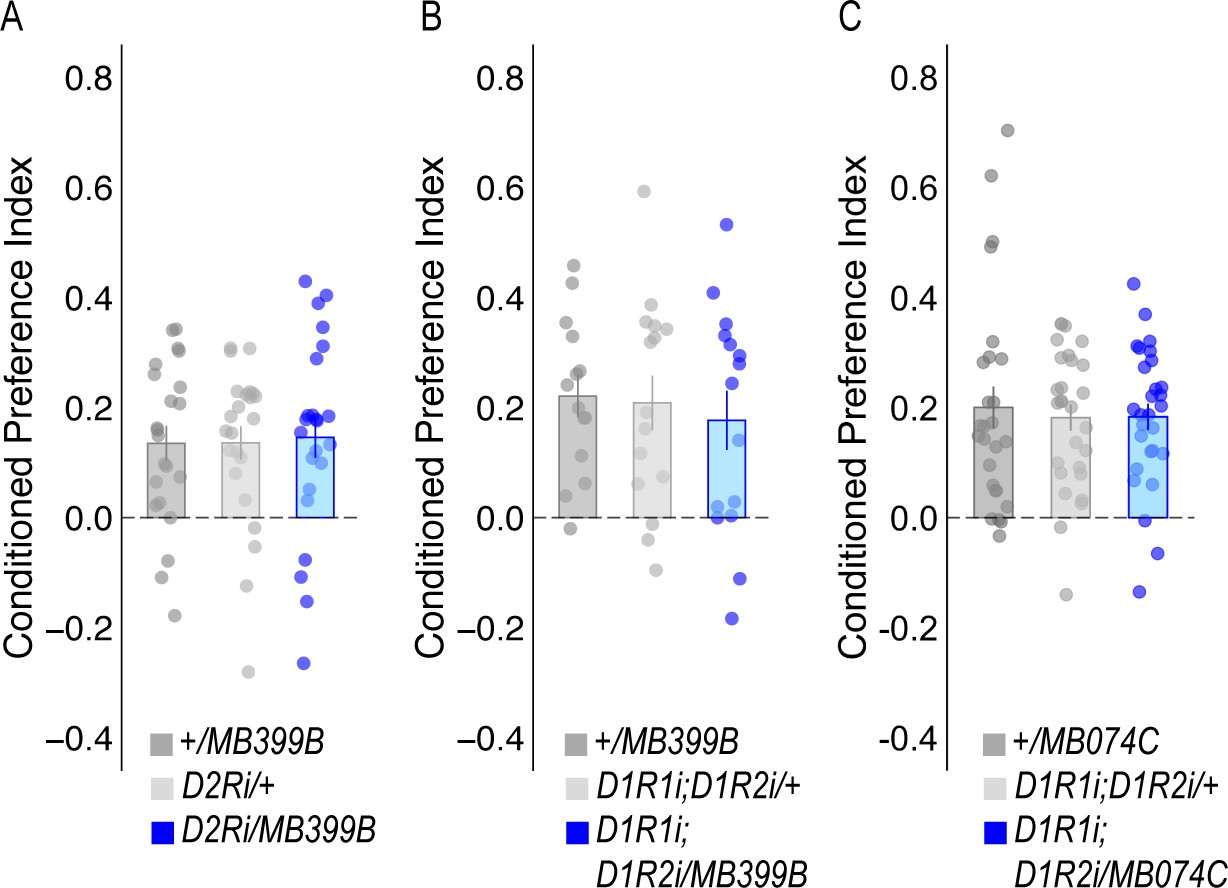
(A) or D1Rs (B) within MBON β2β`2a using MB399B split-GAL4 driver did not significantly affect alcohol-associated preference (F(2,65)=0.032, p=0.968 and F(2,41)=0.223, p=0.801, respectively). (C) RNAi knockdown of D1Rs within MBON β`2mp using the MB074C split-GAL4 driver did not significantly affect alcohol-associated preference F(2,79)=0.123, p=0.884. One-way ANOVA was used to compare mean and variance with Tukey Posthoc compared to experimental.
Figure 4—figure supplement 2
Temperature controls for lines that showed decreases in retrieval of alcohol-associated preference at a restrictive temperature.
Flies were trained and tested at permissive temperatures (20°C) and exhibited normal alcohol-associated preference for pair odor cues under these conditions.
Figure 5 with 2 supplements
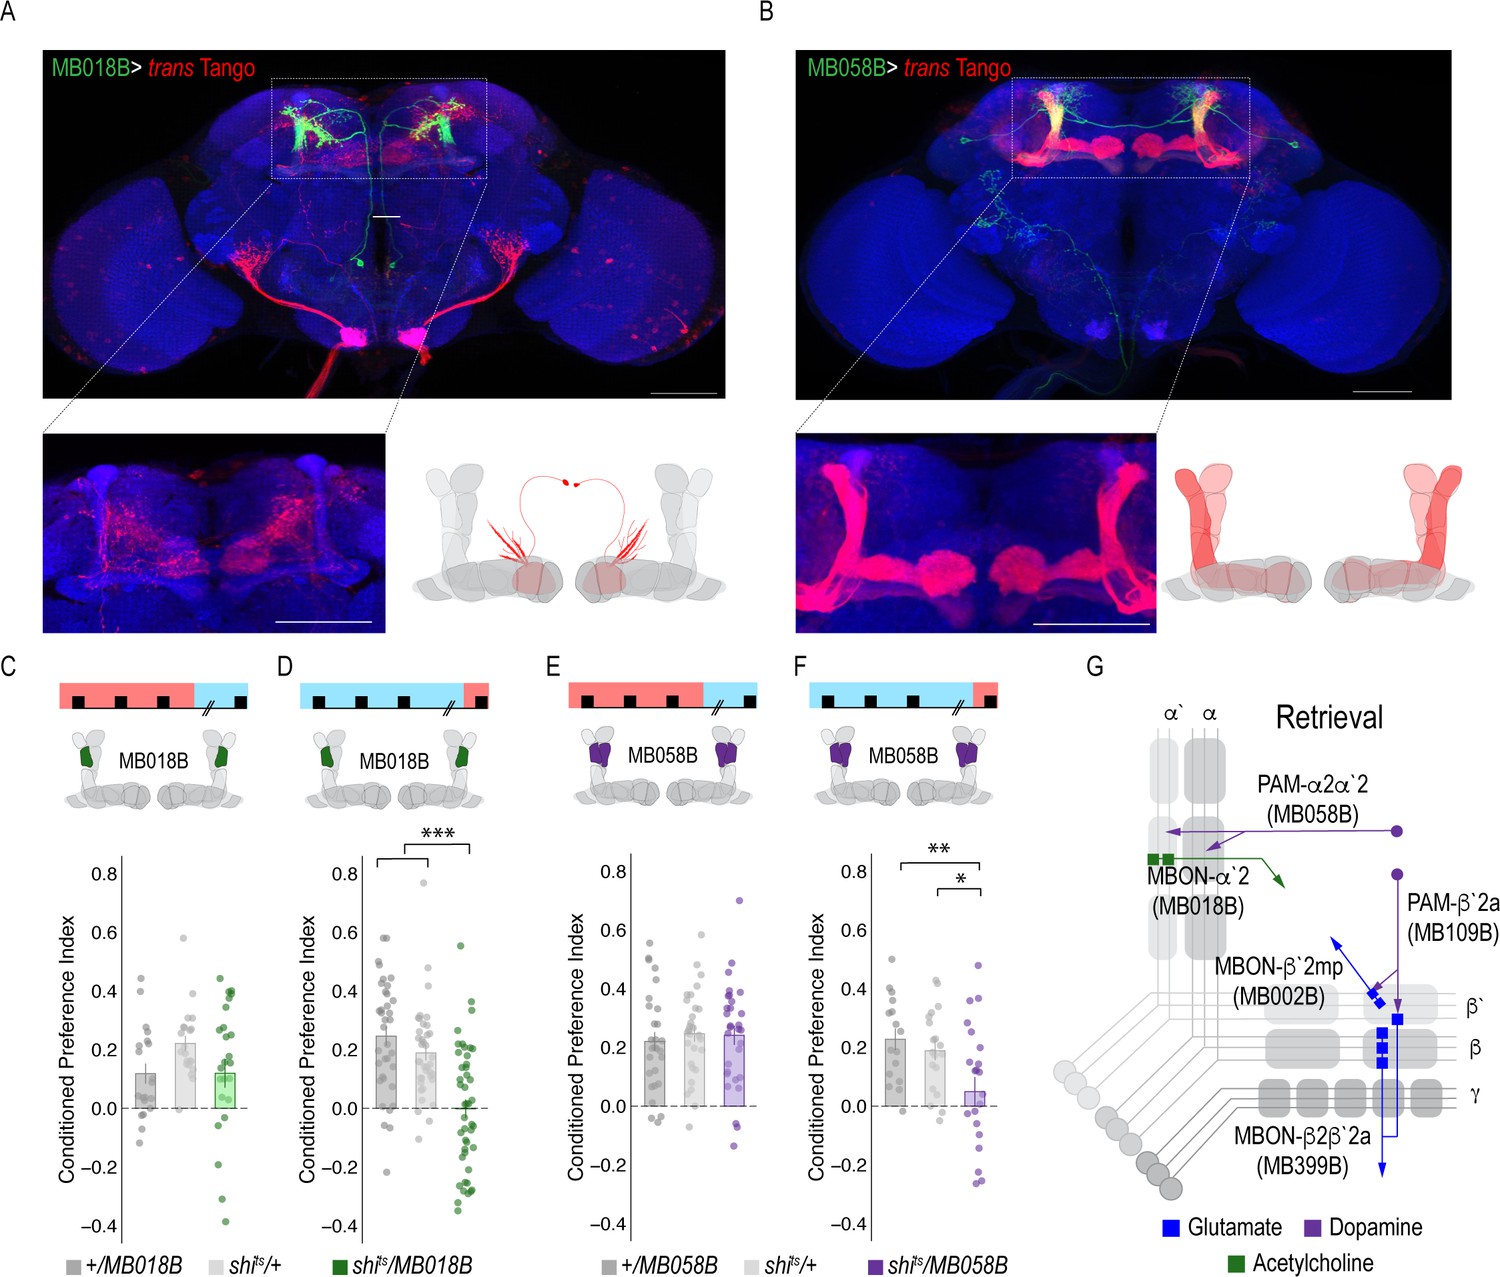
A microcircuit within the vertical lobe is important for alcohol-associated preference.
(A) Representative maximum projection confocal stacks of MB018B > trans-Tangorevealed that β`2mp glutamatergic MBON is postsynaptic to α`2 cholinergic neuron (B) Representative maximum projection confocal stacks of MB058B > trans-Tangosuggests that that α`2 cholinergic MBON is not postsynaptic α2α`2 DAN (C) Thermogenetic inactivation of α`2 cholinergic neurons during acquisition did not affect the expression of alcohol-associated preference F(2,63)=2.18, p=0.12. (D) Inactivation of α`2 cholinergic neurons during retrieval significantly reduced preference F(2,116)=19.46, p=5.17×10^−08. (E) Similarly, thermogenetic inactivation of α2α`2 DANs during acquisition did not affect the expression of alcohol-associated preference F(2,85)=0.202, p=0.817. (F) Inactivation during retrieval significantly reduced preference F(2,54)=5.103, p=0.009. (G) Updated model of circuits responsible for the expression of alcohol-associated preference during retrieval. Scale bar = 50 μm.
Figure 5—figure supplement 1
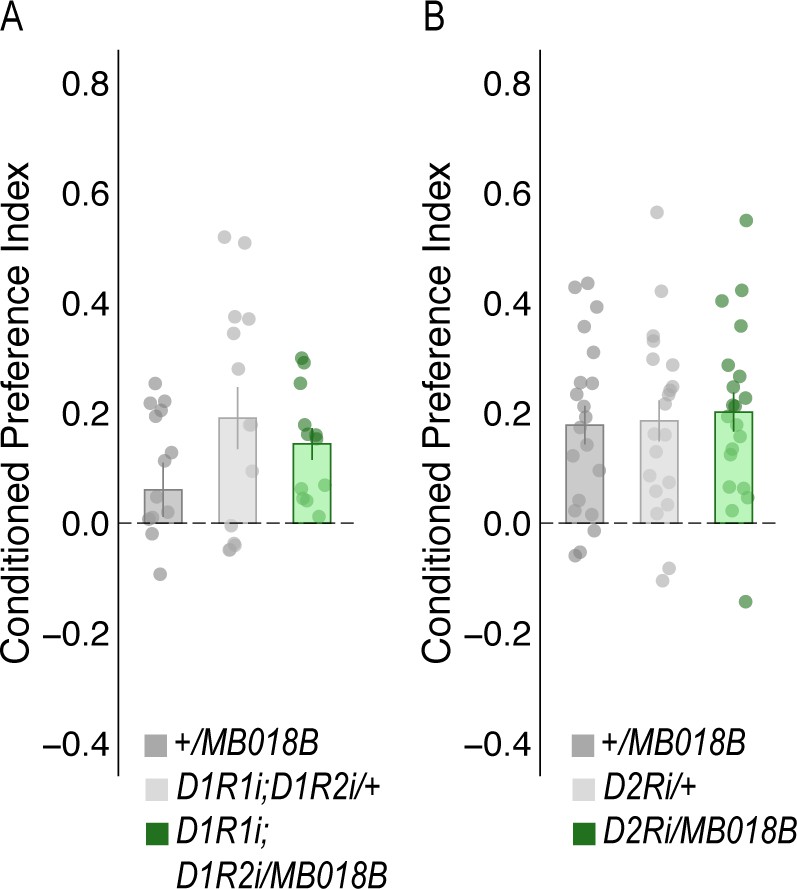
Decreasing expression of dopamine receptors in the α`2 MBON did not affect alcohol-associated preference.
RNAi knockdown of either D2Rs (A) or D1Rs (B) within MBON α`2 using the MB018B split-GAL4 driver did not significantly affect alcohol-associated preference. One-way ANOVA was used to compare mean and variance with Tukey Posthoc compared to experimental (A) (F(2,57)=0.113, p=0.894 and (B) F(2,37)=1.997, p=0.15, respectively).
Figure 5—figure supplement 2
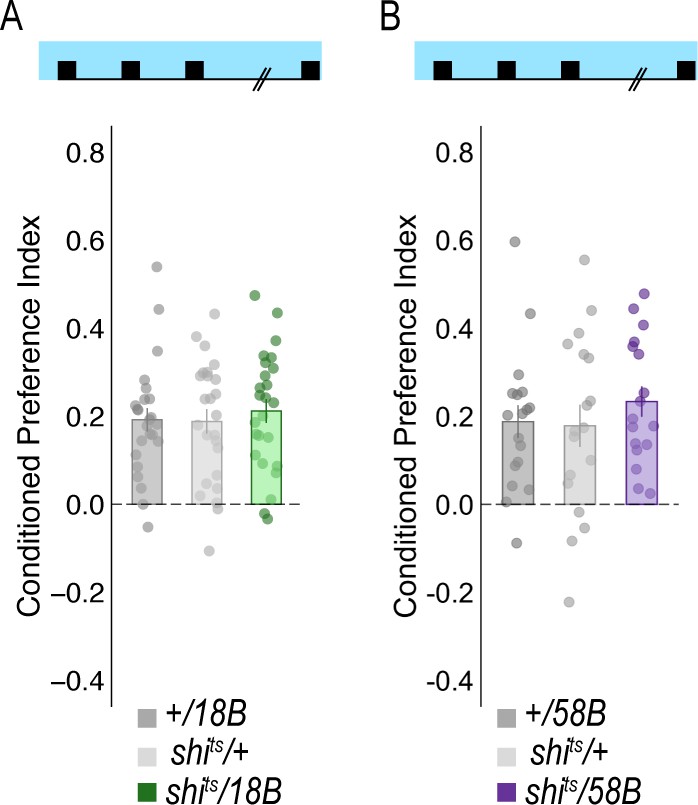
Temperature controls for lines that showed decreases in retrieval of alcohol-associated preference at a restrictive temperature.
Flies were trained and tested at permissive temperatures (20°C) and exhibited normal alcohol associated preference for pair odor cues under these conditions.
Figure 6
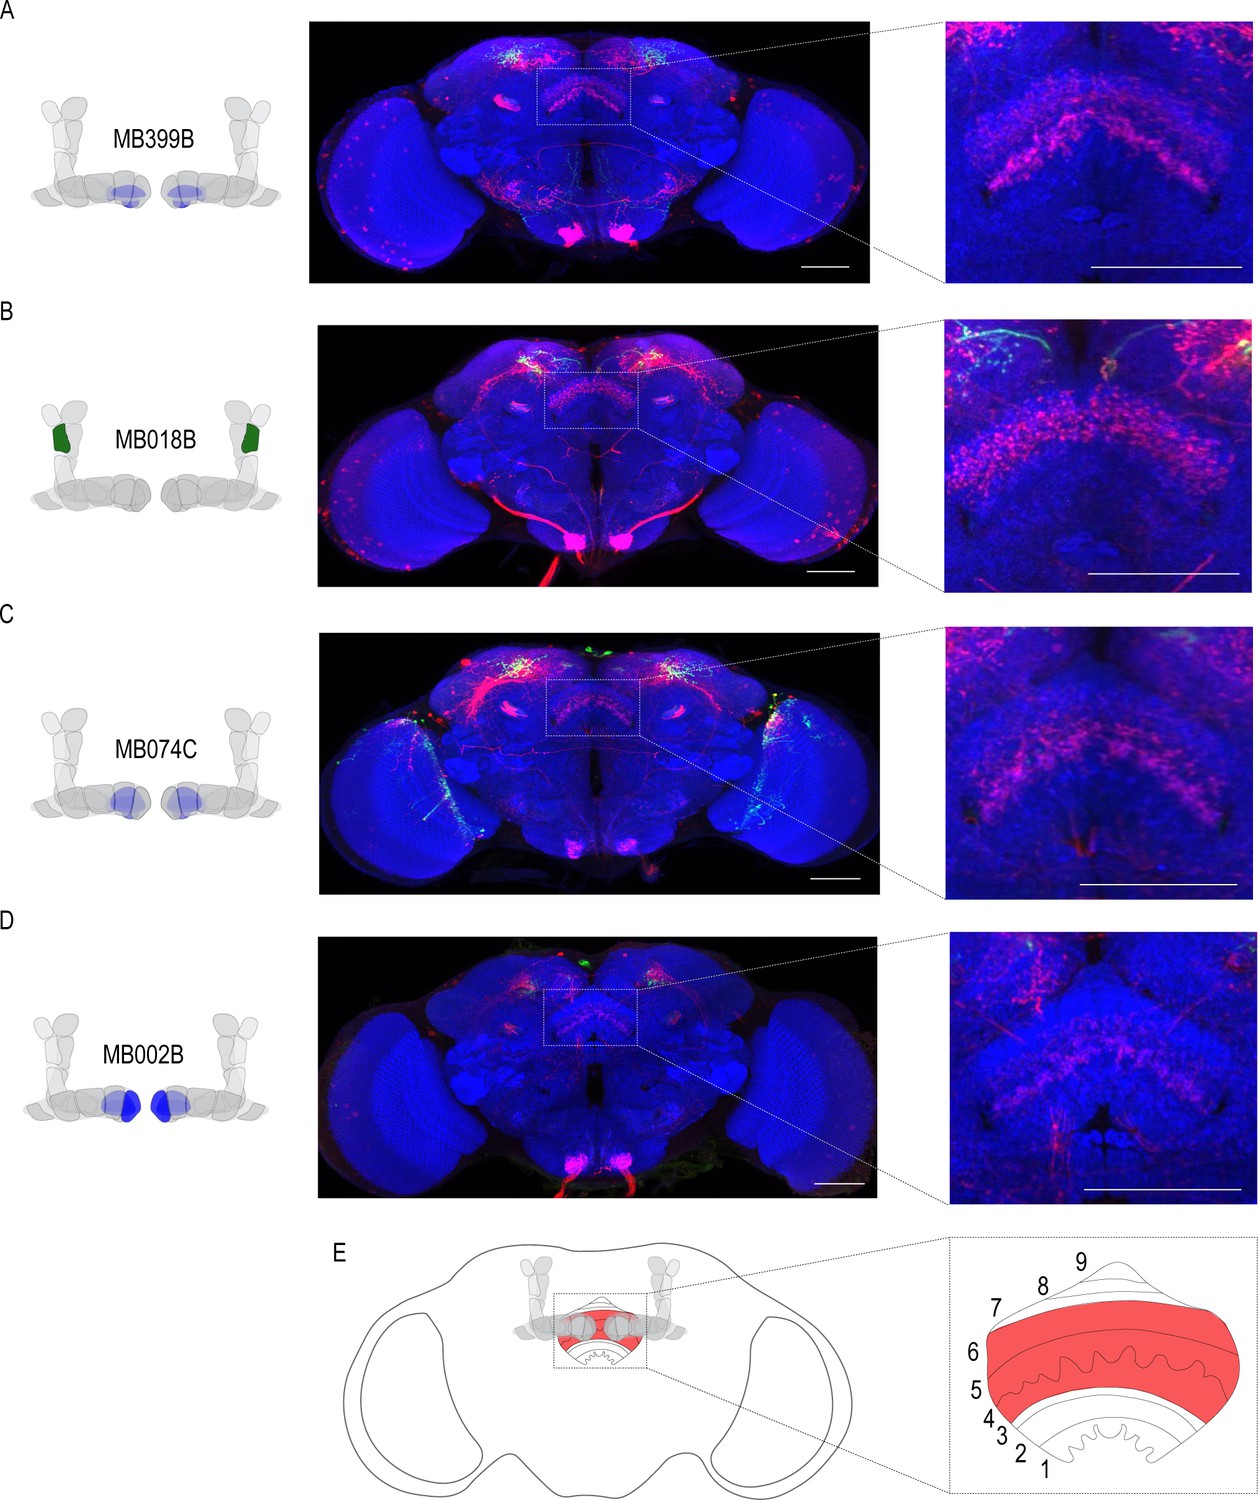
Circuits important for memory expression at retrieval converge on the dorsal FSB.
(A) Confocal stack of FSB highlighting the postsynaptic signal of β2β`2a MBON in the FSB. This MBON predominately targets layers 4, and 6. (B) Confocal stack of FSB highlighting the postsynaptic signal of α`2 MBON in the FSB. This MBON predominately targets layer 6. (C–D) Confocal stack of FSB highlighting the postsynaptic signal of β`2mp MBON in the FSB. This MBON predominately targets layer 4 and 5. (E) Schematic of the fly brain highlighting the FSB and its layers. The FSB is a 9-layer structure (Wolff et al., 2015), of which 4,5, and 6 are targets. Scale bar = 50 μm.
Figure 7
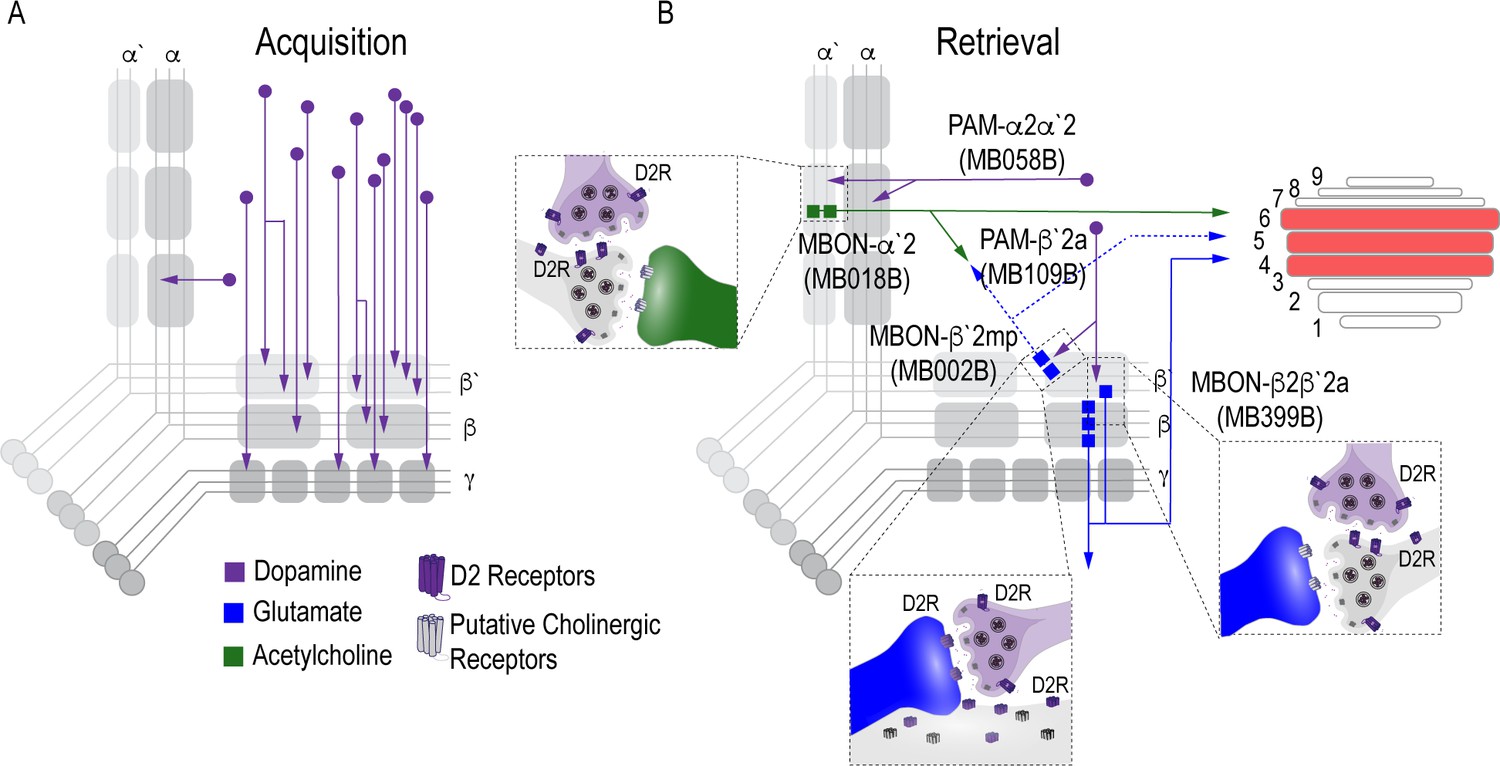
Proposed circuits important for the acquisition and expression of alcohol-associated preference.
(A) The proposed acquisition circuit comprises population activity from DANs innervating the MB (B) The proposed retrieval circuit comprises two separate microcircuits, one in the vertical lobe and one in the horizontal lobe that converge on β`2mp MBON as well as layers with the dorsal FSB. The vertical lobe microcircuit includes a PPL1 α`2α2 DAN that have indirect connections with an α`2 cholinergic MBON via the MB. The horizontal lobe microcircuit includes a subset of PAM DANs (β`2a) that have direct connections with the β`2mp glutamatergic MBON and indirect connections with the β2β`2a glutamatergic MBON. Vertical and horizontal microcircuits converge on the β`2mp glutamatergic MBON which is important for arousal (Sitaraman et al., 2015) and layers 4, 5, and 6 of the FSB.
Tables
Key resources table
| Reagent type (species) or resource | Designation | Source or reference | Identifiers | Additional information |
|---|---|---|---|---|
| Genetic reagent (D. melanogaster) | y[1]w[*] | Pfeiffer et al., 2008 | ||
| Genetic reagent (D. melanogaster) | UAS-shibirets1 | Pfeiffer et al., 2012 | FLYB: FBst0066600; RRID:BDSC_66600 | |
| Genetic reagent (D. melanogaster) | UAS-GCaMP6m | FLYB: FBst0042750; RRID:BDSC_42750 | FlyBase symbol: Dmel\PBac{20XUAS-IVS-GCaMP6m}VK00005 | |
| Genetic reagent (D. melanogaster) | UAS-Dop2R-RNAi | Dietzl et al., 2007 | FLYB: FBsf0000079969; VDRC ID: 11471 | FlyBase symbol: Dmel\dsRNA-GD11471 (currently unavailable) |
| Genetic reagent (D. melanogaster) | UAS-Dop1R1-RNAi | Keleman et al., 2009) | FLYB: FBsf0000090794; dsRNA-KK107258 VDRC ID: 100249 | FlyBase symbol: Dmel\dsRNA-KK107258 |
| Genetic reagent (D. melanogaster) | UAS-Dop1R2-RNAi | Dietzl et al., 2007 | FLYB: FBsf0000073893 dsRNA-GD3391 VDRC ID: 3391 | FlyBase symbol: Dmel\dsRNA-GD3391 (currently unavailable) |
| Genetic reagent (D. melanogaster) | trans-Tango: UAS-myrGFP, QUAS-mtdTomato (3xHA); brp-SNAP | Kohl et al., 2014, Talay et al., 2017 | ||
| Genetic reagent (D. melanogaster) | R58E02-Gal4 | Liu et al., 2012 | FLYB: FBtp0061564; RRID:BDSC_41347 | Flybase Symbol: P{GMR58E02-GAL4} |
| Genetic reagent (D. melanogaster) | R58E02; mcD8::GFP | this paper | FLYB: FBtp0061564; RRID:BDSC_41347 FLYB: FBti0200979;RRID:BDSC_79626, | Flybase Symbol: P{GMR58E02-GAL4} Flybase Symbol: Dmel\P{10XUAS-mCD8GFP-APEX2}attP40 |
| Genetic reagent (D. melanogaster) | HL9-Gal4 | Claridge-Chang et al., 2009 | FLYB: FBtp0073020 RRID:BDSC_69208 | Flybase Symbol: P{HL9-GAL4.DBD}attP2 |
| Genetic reagent (D. melanogaster) | MB058B-split-Gal4 | Aso et al., 2014a | FlyLight Robot ID: 2135107 | |
| Genetic reagent (D. melanogaster) | MB109B-split-Gal4 | Aso et al., 2014a | FlyLight Robot ID: 2135157 | |
| Genetic reagent (D. melanogaster) | MB040B-split-Gal4 | Aso et al., 2014a | N/A | |
| Genetic reagent (D. melanogaster) | MB042B-split-Gal4 | Aso et al., 2014a | FlyLight Robot ID: 2135092 | |
| Genetic reagent (D. melanogaster) | MB188B-split-Gal4 | Aso et al., 2014a | FlyLight Robot ID: 2135236 | |
| Genetic reagent (D. melanogaster) | MB032B-split-Gal4 | Aso et al., 2014a | FlyLight Robot ID: 2135083 | |
| Genetic reagent (D. melanogaster) | MB087C-split-Gal4 | Aso et al., 2014a | FlyLight Robot ID: 2135135 | |
| Genetic reagent (D. melanogaster) | MB301B-split-Gal4 | Aso et al., 2014a | FlyLight Robot ID: 2135349 | |
| Genetic reagent (D. melanogaster) | MB002B-split-Gal4 | Aso et al., 2014a | FlyLight Robot ID:2135053 | |
| Genetic reagent (D. melanogaster) | MB011B- split-Gal4 | Aso et al., 2014a | FlyLight Robot ID:2135062 | |
| Genetic reagent (D. melanogaster) | MB-210B-split-Gal4 | Aso et al., 2014a | FlyLight Robot ID: 2135258 | |
| Genetic reagent (D. melanogaster) | MB018B-split-Gal4 | Aso et al., 2014a | FlyLight Robot ID: 2135069 | |
| Genetic reagent (D. melanogaster) | MB399B-split-Gal4 | Aso et al., 2014a | FlyLight Robot ID: 2501738 | |
| Genetic reagent (D. melanogaster) | MB074C-split-Gal4 | Aso et al., 2014a | FlyLight Robot ID: 2135112 | |
| Antibody | α-GFP (Rabbit polyclonal) | Life Tech | Cat#A11122 | (1:1000) |
| Antibody | α-HA (Rat monoclonal) | Roche | Cat#11867423001 | (1:100) |
| Antibody | Goat α-Rabbit AF488 | Life Tech | Cat#A11034 | (1:400) |
| Antibody | Goat α-Rat AF568 | Life Tech | Cat#A11077 | (1:400) |
| Antibody | α-dopamine (Mouse monoclonal) | Millipore | Cat#MAB5300 | (1:40) |
| Antibody | Goat α-mouse AF488 | Thermo | Cat#A11029 | (1:200) |
| Sequence-based reagent | CG13646F | Petruccelli et al., 2018 | PCR primers | AGTTTGACATCCACCCCGTC |
| Sequence-based reagent | CG13646R | Petruccelli et al., 2018 | PCR primers | CTCACTGGCGATTCCGATGA |
| Sequence-based reagent | Dop2RF | Petruccelli et al., 2018 | PCR primers | CTGAACTGCACCAACGAGACGC |
| Sequence-based reagent | Dop2RR | Petruccelli et al., 2018 | PCR primers | CAGGATGTTGCCGAAGAGGGTC |
| Sequence-based reagent | Dop1R1F | this paper | PCR primers | CCGTCGTGTCCAGCTGTATCAG |
| Sequence-based reagent | Dop1R1R | this paper | PCR primers | CTTCTCGGCCACCTCACCTG |
| Sequence-based reagent | Dop1R2F | this paper | PCR primers | CCTGGCTCGGCTGGATCAAC |
| Sequence-based reagent | Dop1R2R | this paper | PCR primers | ATCGTGGGCTGGTACTTGCG |
Additional files
-
Supplementary file 1
Supplemental Tables that accompany data from Figures 1, 2, 3, 4 and 5.
Table 1 includes a cell count of PAM neuron driver lines. Table 2 includes odor sensitivity controls for all memory experiments performed. Table 3 includes a description of target and off-target expression of split-Gal4 lines used. Table 4 includes a comprehensive table of detailed statistics that describe all data. Table 5 includes a review of papers published that include use of the RNAi lines used here.
- https://cdn.elifesciences.org/articles/48730/elife-48730-supp1-v1.docx
-
Transparent reporting form
- https://cdn.elifesciences.org/articles/48730/elife-48730-transrepform-v1.pdf
Download links
A two-part list of links to download the article, or parts of the article, in various formats.
Downloads (link to download the article as PDF)
Open citations (links to open the citations from this article in various online reference manager services)
Cite this article (links to download the citations from this article in formats compatible with various reference manager tools)
Circuits that encode and guide alcohol-associated preference
eLife 9:e48730.
https://doi.org/10.7554/eLife.48730


