Perinatal hormones favor CC17 group B Streptococcus intestinal translocation through M cells and hypervirulence in neonates
- Institut Cochin, Team Bacteria and Perinatality, INSERM U1016, France
- CNRS UMR 8104, France
- Paris Descartes University, France
- University Hospitals Paris Centre-Cochin, Assistance Publique – Hôpitaux de Paris, France
- National Reference Center for Streptococci, France
Figures
Figure 1 with 2 supplements
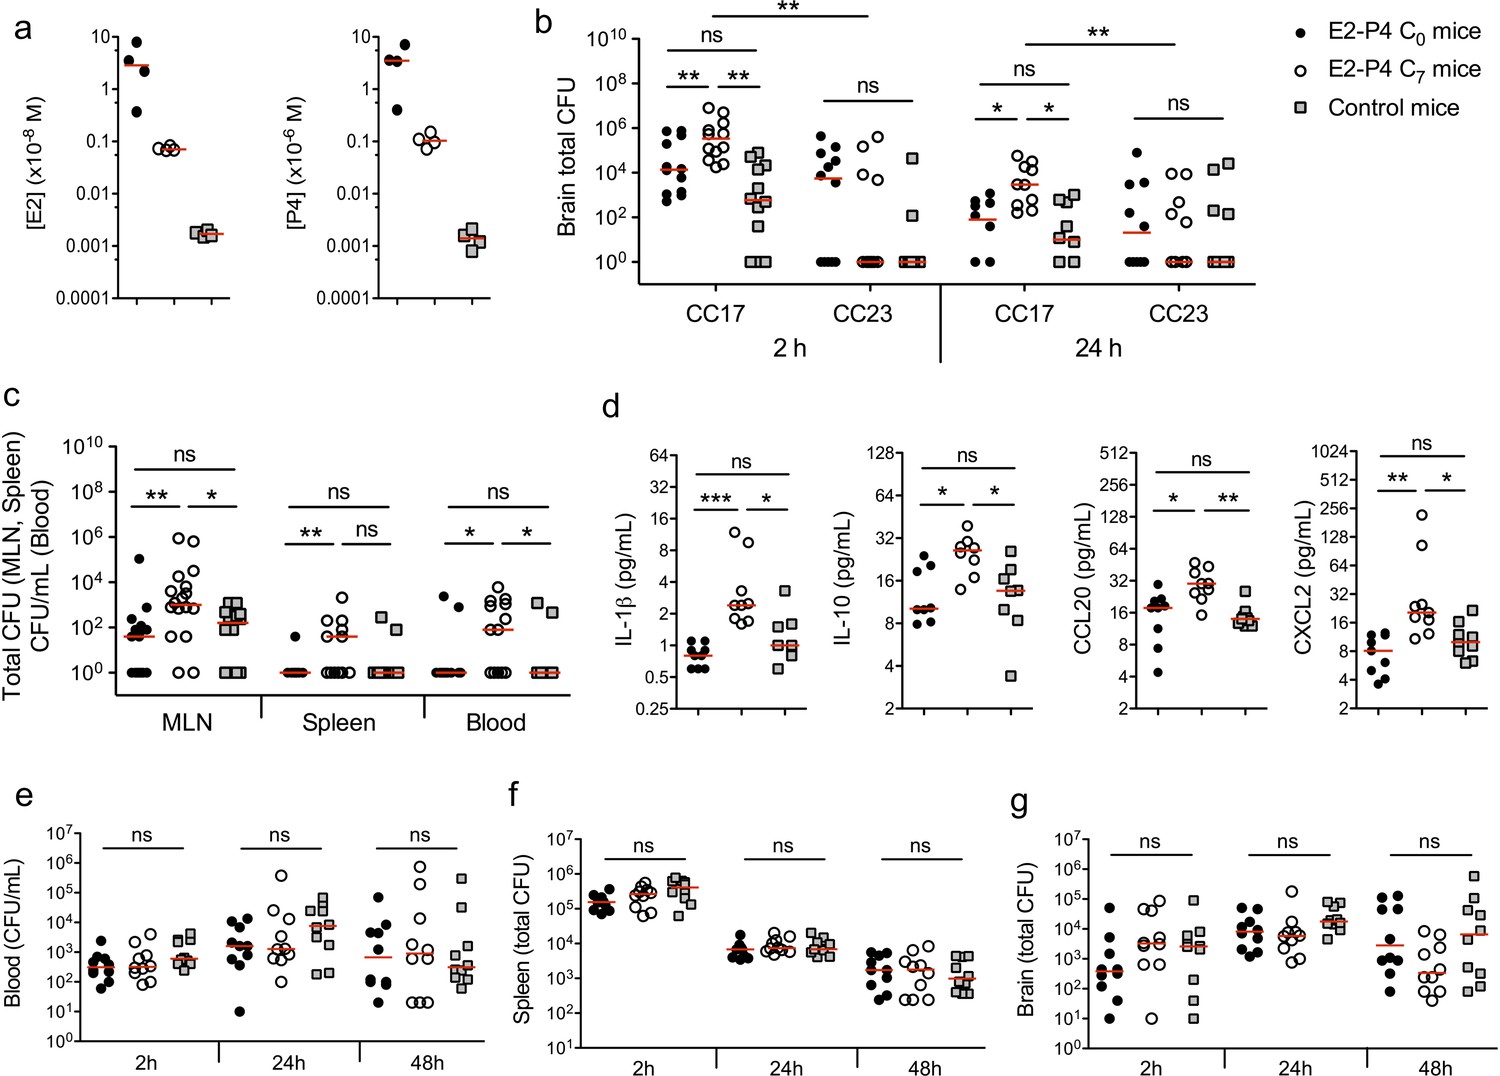
E2-P4 hormone levels modulate CC17 GBS dissemination and the severity of meningitis following oral infection in mice.
SPF 3-week-old mice were administered E2-P4 cocktails subcutaneously for four consecutive days leading to E2-P4 circulating levels equivalent to those found in neonates at birth (E2-P4 C0 mice) or 7 days later (E2-P4 C7 mice). Control mice were administered vehicle alone. (a) Serum levels of E2 and P4 in the 3 groups of mice measured 4 hr after the last hormonal administration (n = 4 mice per group). (b to d) Mice were gavaged with representative CC17 (strain BM110) or CC23 (strain NEM316) GBS isolates (2.1010 CFU). (b) Total CFU counts in the brain 2 hr (n = 12 mice per group) and 24 hr (n = 10 mice per group) after infection by CC17 and CC23 GBS. (c) Total CFU counts in the mesenteric lymph nodes (MLN, n = 16 mice per group), spleen (n = 12 mice per group), and blood circulating bacteria in CFU/mL (n = 12 mice per group) 2 hr after infection by CC17 GBS. (b, c) 100 represents the detection threshold. (d) Serum levels of the cytokines IL-1β, IL-10, CCL20 and CXCL2 2 hr after infection by CC17 GBS (n = 9 mice per group). (e to g) Mice were infected intravenously with CC17 GBS (2.107 CFU, n = 10 mice per group). Bacteremia (e) and total CFU counts in the spleen (f) and brain (g), 2 hr, 24 hr and 48 hr after infection. Red lines are represented at median value. Multiple-group comparisons were performed by non-parametric two-way ANOVA (b) and Kruskal-Wallis test (c to g). *p<0.05; **p<0.01; ***p<0.001; ns: not significant.
Figure 1—figure supplement 1
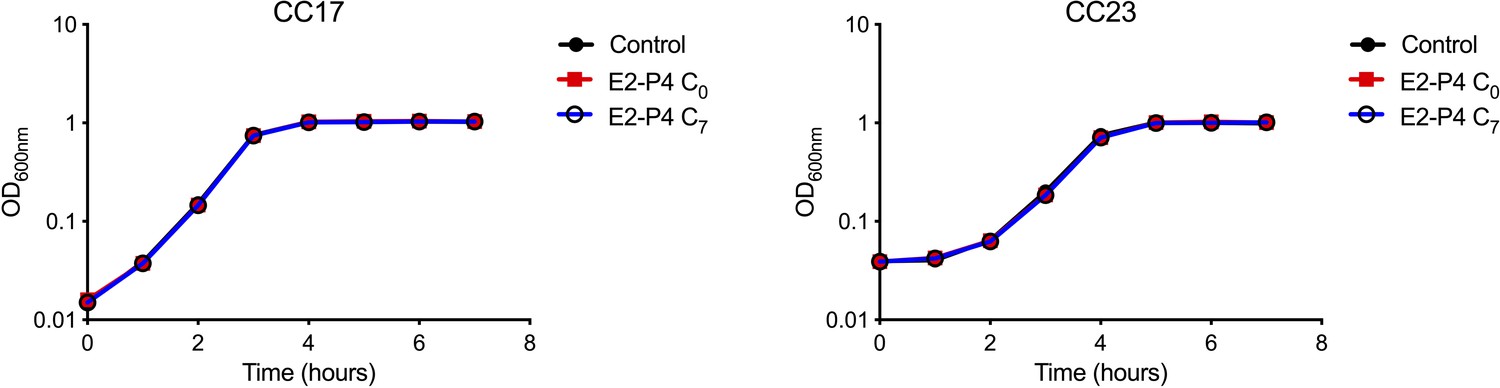
Growth curves of CC17 and CC23 GBS in presence of hormones.
Bacterial growth in Todd Hewitt broth alone or supplemented with E2-P4 concentrations equivalent to those found at birth (E2: 10−8M, P4: 10−6M; E2-P4 C0 condition) and 7 days later (E2: 10−9M, P4: 10−7M; E2-P4 C7 condition). Results shown are representative of 2 experiments in triplicate.
Figure 1—figure supplement 2
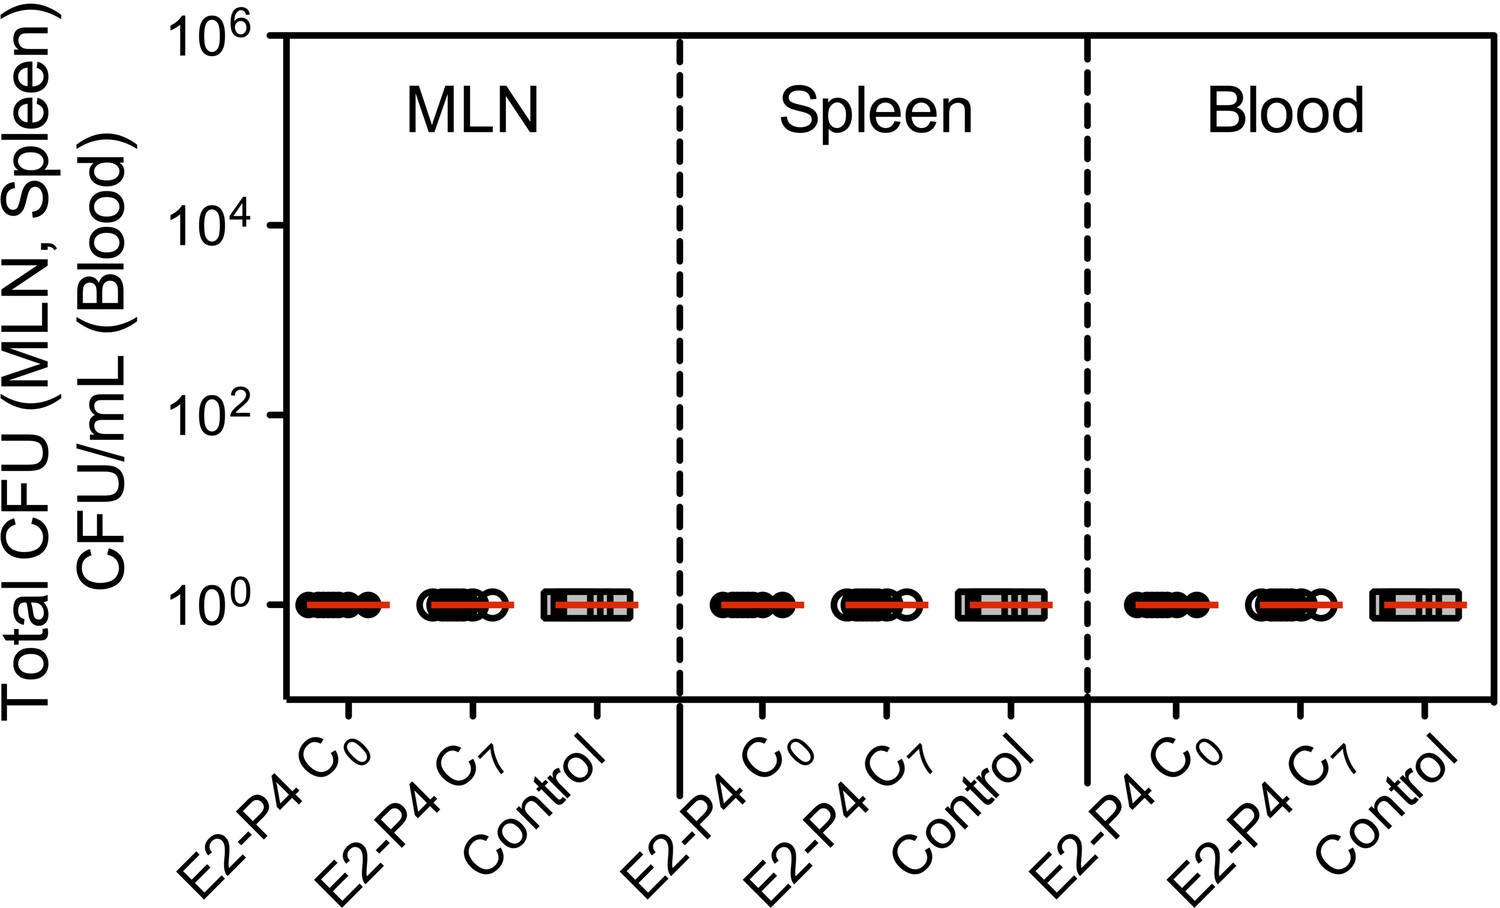
Bacterial counts of CC17 GBS 24 hr following mice oral infection (n = 8 mice per group).
SPF 3-week-old mice were administered E2-P4 cocktails subcutaneously for four consecutive days leading to E2-P4 circulating levels equivalent to those found in neonates at birth (E2-P4 C0 mice) or 7 days later (E2-P4 C7 mice). Control mice were administered vehicle alone. Mice were gavaged with CC17 GBS (2.1010 CFU) and CFU counts were measured in the mesenteric lymph nodes (MLN), spleen, and blood. 100 represents the detection threshold. Red lines are represented at median value.
Figure 2
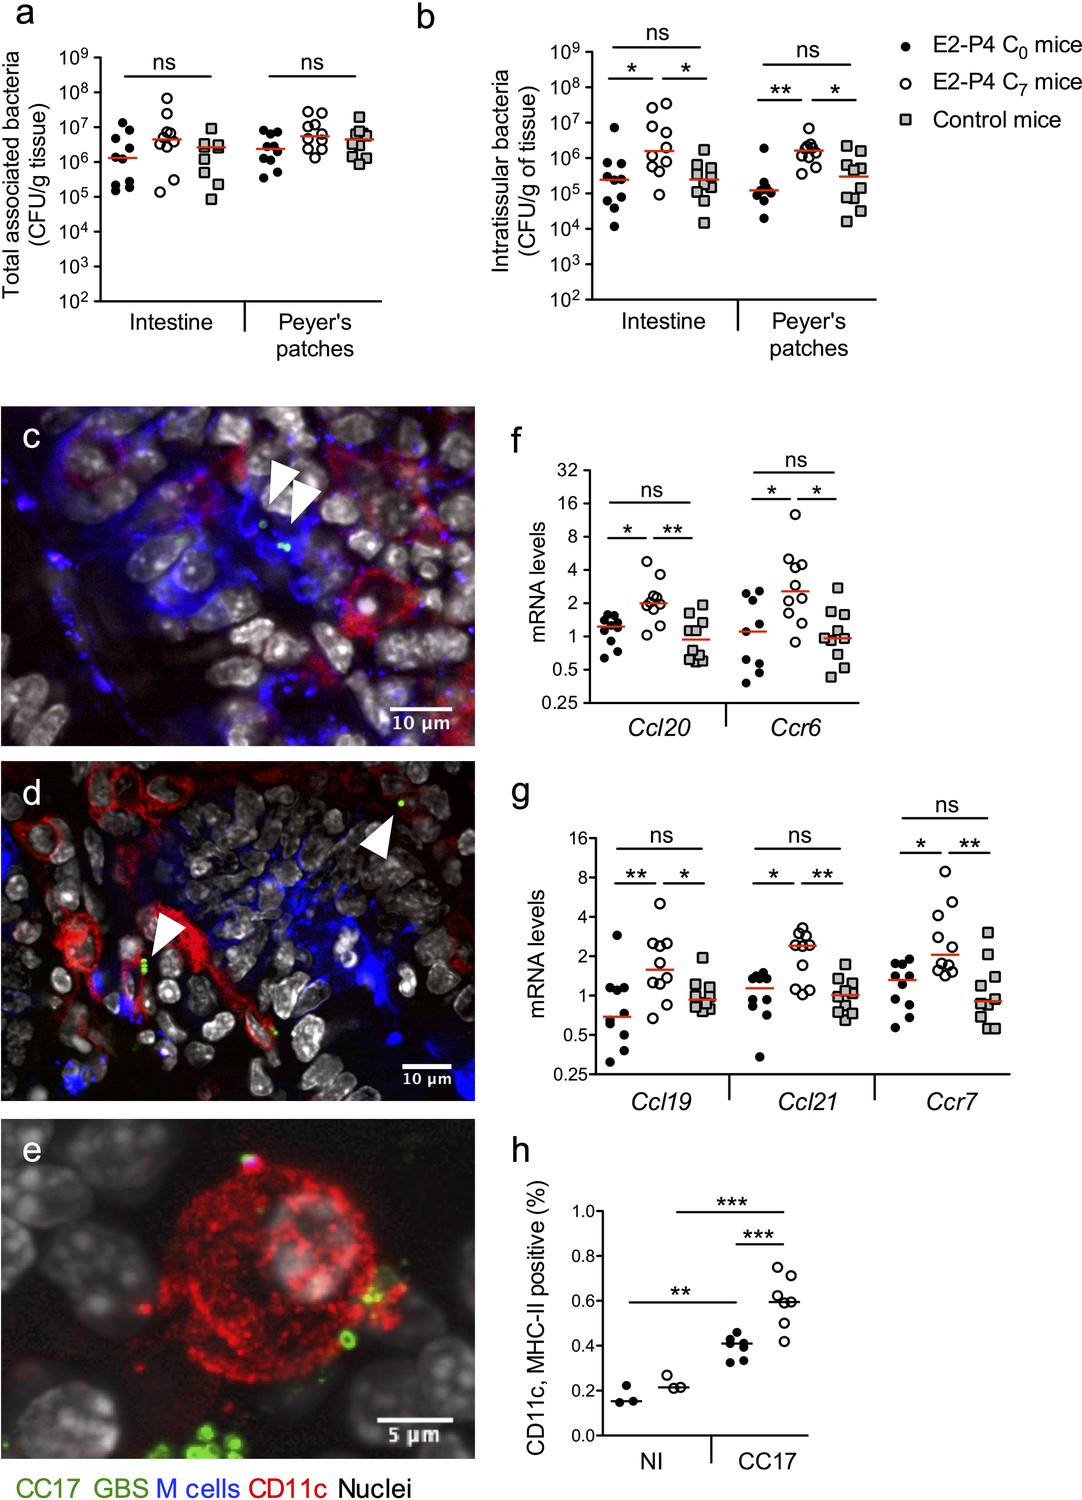
E2-P4 C7 concentrations favor CC17 GBS crossing of the intestinal barrier through Peyer’s patches.
SPF 3-week-old mice were administered E2-P4 cocktails for hormonal impregnation as described in Figure 1. (a, b, and f to h) Mice were gavaged by 2.1010 CFU of CC17 GBS. (a, b) Bacteria were enumerated 2 hr after infection in the intestine and Peyer’s patches either as tissue-associated bacteria (a) or as intratissular bacteria following tissue treatment with gentamicin (b). Bacterial counts are expressed in CFU per gram of tissue and were obtained following tissue homogenization and plating on Granada medium (n = 10 mice per group). (c to e) Representative confocal images (out of 12) of E2-P4 C7 mice small intestine ligated loops infected by 2.1010 CFU of CC17 GBS for 1 hr and showing intratissular bacteria (n = 3 mice). Small intestine sections showing bacteria associated with M cells (c) and CD11c positive cells (d). (e) View of a tridimensional representation of CC17 GBS associated with a CD11c positive cell. M cells were labeled with anti-UEA-I antibody, dendritic cells (DC) and macrophages with anti-CD11c antibody and nuclei with DAPI. White triangles indicate GBS cocci. (f, g) Intestinal mRNA levels of genes involved in leukocytes recruitment (f) and DC activation and migration (g) 2 hr after mouse oral gavage. Results are normalized to Actin and expressed as mean fold change relative to control condition ± SEM (n = 10 mice per group). (h) Flow cytometry analysis of CD11c and MHC-II positive cells in MLN of non-infected (NI, n = 3 mice per group) and CC17-infected mice (n = 7 mice per group) 2 hr after oral gavage of E2-P4 C0 and E2-P4 C7 mice. (a, b, and f to h) Lines are represented at median value. Multiple-group comparisons were performed by non-parametric two-way ANOVA (a, b) and Kruskal-Wallis test (f to h). *p<0.05; **p<0.01, ***p<0.001; ns: not significant.
Figure 3 with 1 supplement

E2-P4 C7 concentrations favor CC17 GBS transcytosis through M cells.
Human Caco-2 enterocytes were polarized on standard plates (a) or Transwell inserts (b to h) for 14–21 days. (b to h) Human Raji B lymphocytes were added in the lower compartment of the culture chamber in order to obtain a cellular layer composed of enterocytes and M cells and the cell culture medium was supplemented with E2-P4 concentrations equivalent to those found at birth (E2: 10−8M, P4: 10−6M; E2-P4 C0 condition) and 7 days later (E2: 10−9M, P4: 10−7M; E2-P4 C7 condition) for 6 days before infection. Control cells were maintained in regular cell culture medium without E2 and P4 supplementation. Epithelial cells were infected by their apical side with bacteria at a multiplicity of infection 10 (a) and 100 (c to h) for 2 hr. (a) Bacterial adherence and invasion of a cellular monolayer composed of enterocytes. (b) Representative confocal microscopy image of the epithelial layer obtained following Caco-2 and Raji co-culture showing enterocytes and M cells. (c) Transcytosis of CC17 GBS across a monolayer strictly composed of enterocytes and a monolayer composed of both enterocytes and M cells. (d) Representative confocal microscopy images showing CC17 and CC23 GBS adherence to the enterocytes + M cells epithelial layer. (e) Bacterial adherence of CC17 and CC23 GBS to the enterocytes + M cells epithelial layer. (f) Quantitative imaging analysis of bacterial association with M cells expressed as the proportion of bacteria associated with GP2 positive cells relative to total adherent bacteria. (g) Representative confocal microscopy image showing the presence of several CC17 GBS cocci at the surface and inside an M cell. (g1 to g3) Orthogonal views of (g). (d to g) Experiments were carried out in E2-P4 C7 condition. (h) Quantitative imaging analysis of CC17 GBS association with M cells in E2-P4 C0, E2-P4 C7, and control condition. (a, c, e, f, h) Results are expressed as mean ± SEM.≥3 experiments in duplicate. (b, d, g) Tight junctions are labeled with anti-ZO1 antibody, M cells with anti-GP2 antibody, GBS with anti-GBS antibody, and actin with phalloidin. Multiple-group comparisons were performed by Kruskal-Wallis test (c and h) and single-group comparisons by Mann-Whitney test (e and f). *p<0.05; **p<0.01, ***p<0.001.
Figure 3—figure supplement 1
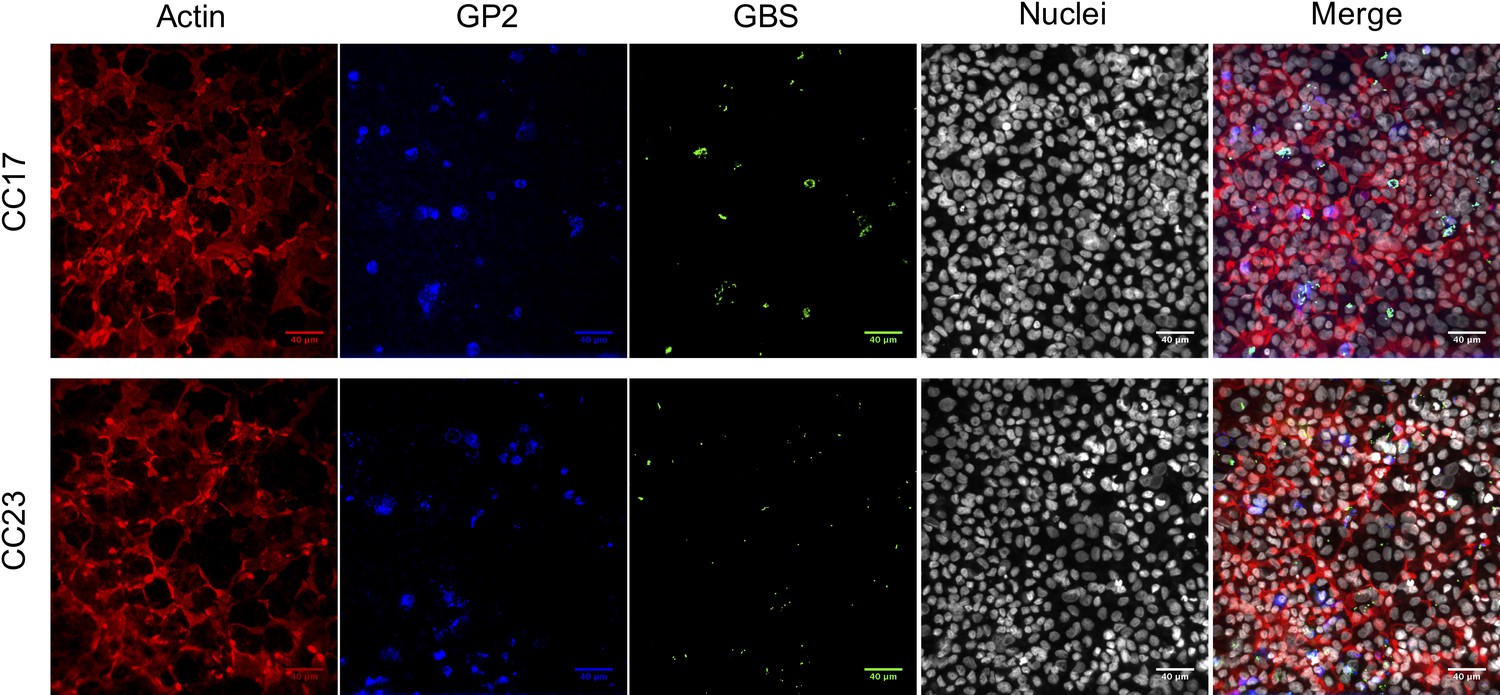
Confocal microscopy imaging of GBS interactions with enterocytes and M cells in vitro.
Human Caco-2 enterocytes were polarized on Transwell inserts for 14–21 days. Human Raji B lymphocytes were added in the lower compartment of the culture chamber for the six following days in order to obtain a cellular layer composed of enterocytes and M cells. The cell culture medium was supplemented with E2-P4 concentrations equivalent to those found at birth (E2: 10−8M, P4: 10−6M; E2-P4 C0 condition) and 7 days later (E2: 10−9M, P4: 10−7M; E2-P4 C7 condition) for 6 days before infection. Epithelial cells were infected by their apical side with bacteria at a multiplicity of infection 100 for 2 hr. Representative confocal microscopy images (out of 10 per experiment) of CC17 and CC23 GBS association with the enterocytes + M cells epithelial layer in E2-P4 C7 condition. GBS were labeled with anti-GBS antibody, M cells with anti-GP2 antibody, actin with phalloidin, and nuclei with DAPI.
Figure 4

E2-P4 C7 concentrations promote intestinal M cells maturation.
(a–d) The epithelial layer composed of enterocytes and M cells was prepared as described in Figure 3. Following 6 days of Caco-2 and Raji co-culture, lymphocytes and epithelial cells were recovered and lysed for gene and protein expression analysis. (a) Raji B lymphocytes mRNA levels of RANKL. (b) Caco-2 mRNA levels of Spi-B-dependent M cells differentiation genes. (a–b) Results are normalized to ACTIN and expressed as mean fold change relative to control condition ± SEM. (c–d) Western blot analysis of GP2. (c) Representative sample blot and (d) quantification of GP2 protein levels. Values are presented as the ratio between GP2 and Actin and expressed as mean fold change relative to control condition ± SEM.≥3 experiments in duplicate. (e) SPF 3-week-old mice were administered E2-P4 cocktails as described in Figure 1. At the end of the hormonal treatment, Peyer’s patches were recovered for mRNA quantification of M cells differentiation markers. Results are normalized to Actin and expressed as mean fold change relative to control condition ± SEM (n = 10 mice per group). *p<0.05, **p<0.01, ***p<0.001, ns: not significant (Kruskal-Wallis test).
Figure 5
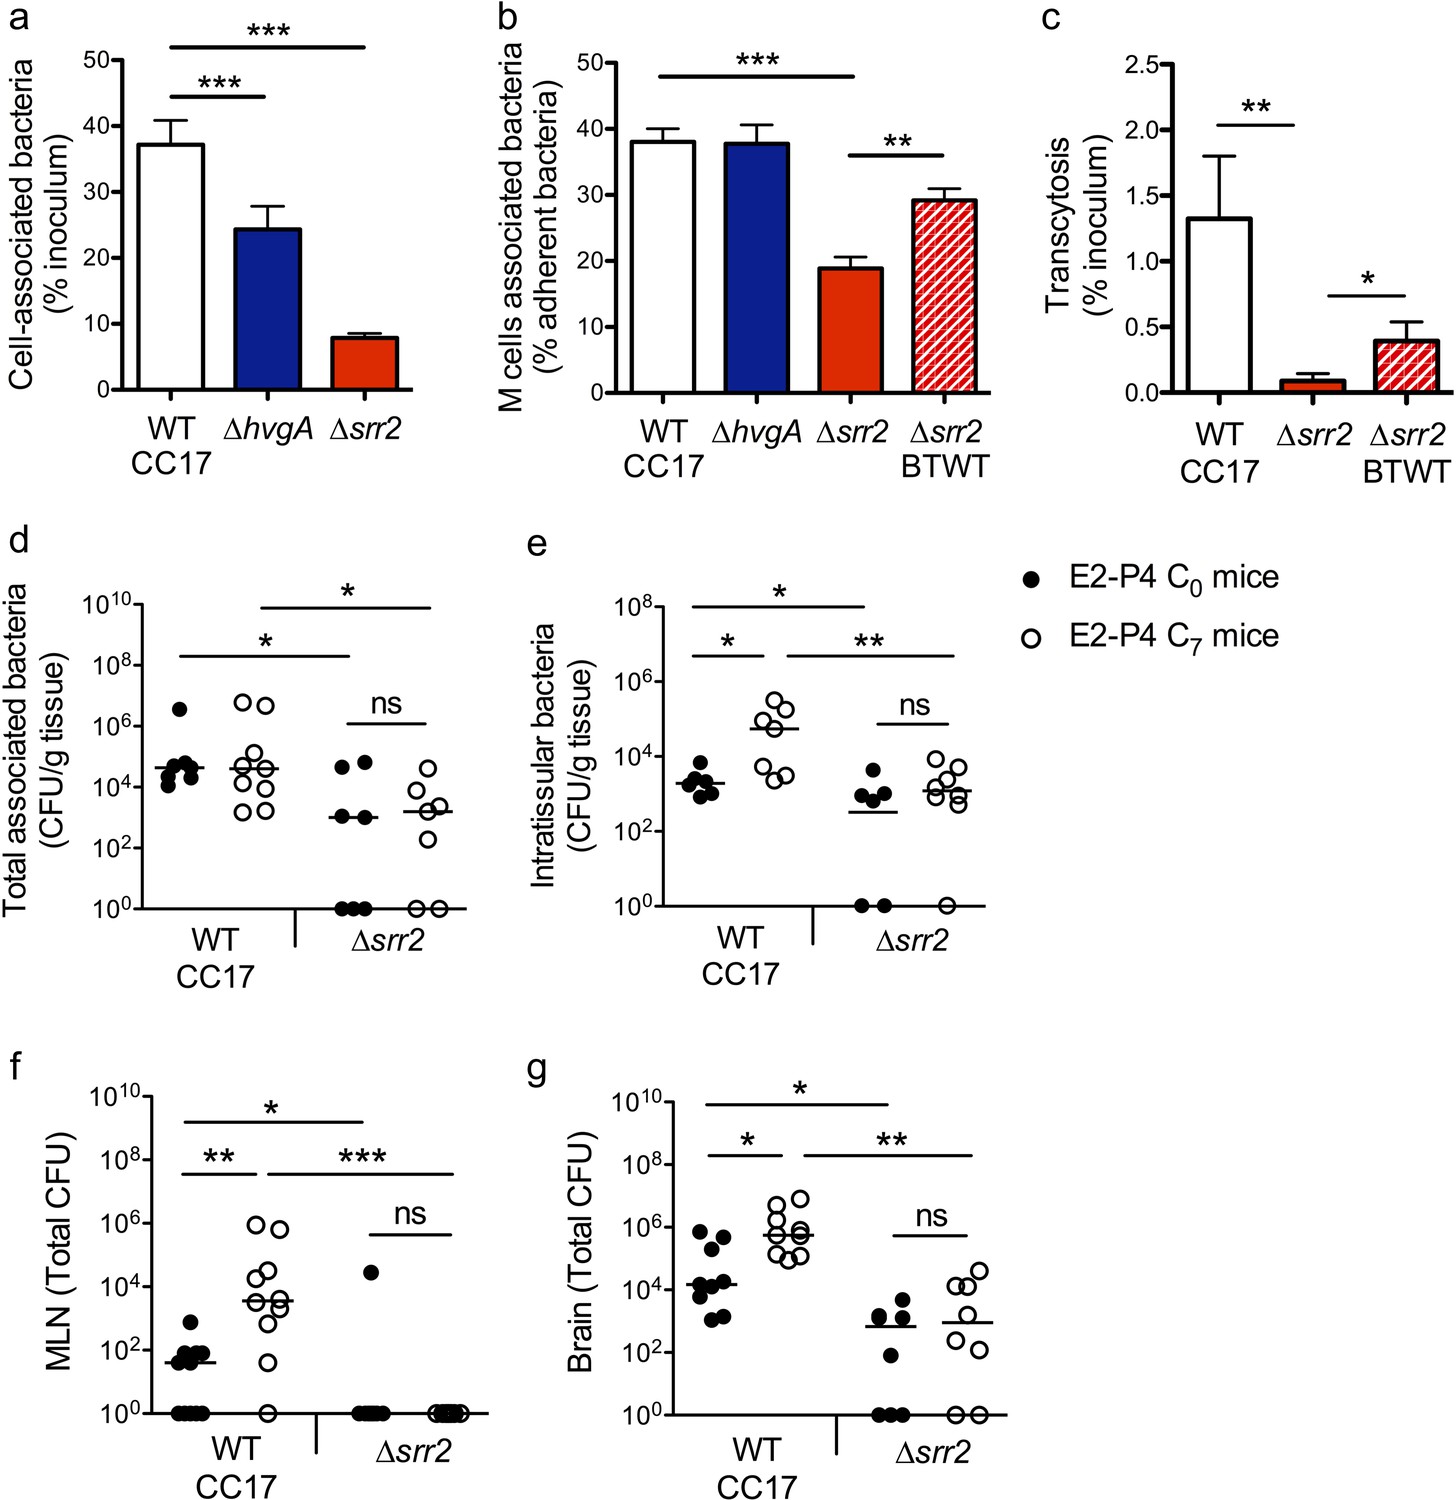
The CC17 surface protein Srr2 promotes GBS interaction with M cells and contributes to CC17 GBS hypervirulence in E2-P4 C7 condition.
(a to c) The epithelial monolayer composed of enterocytes and M cells was prepared as described in Figure 3 and cultured in E2-P4 C7 condition. Lymphocytes were removed before infection of the upper compartment with bacteria (multiplicity of infection 100). Cell-associated bacteria were enumerated 2 hr after infection and cells were fixed for staining. (a) Adherence of the wild-type (WT) CC17 GBS and its ∆hvgA and ∆srr2 mutants. (b) Quantitative imaging analysis of bacterial association with M cells of the WT CC17 GBS, the ∆hvgA and ∆srr2 mutants, and the ∆srr2 back to WT (BTWT) reverted mutant. (c) Transcytosis of the WT CC17 GBS, the ∆srr2 mutant, and the BTWT across the enterocytes + M cells monolayer. Results are expressed as mean ± SEM.≥3 experiments in triplicate. (d to g) SPF 3-week-old mice were administered E2-P4 cocktails as described in Figure 1 before being gavaged with the WT CC17 GBS or its ∆srr2 mutant (2.1010 CFU). Bacteria were enumerated 2 hr after infection in the Peyer’s patches either as tissue-associated bacteria (d) or as intratissular bacteria following tissue treatment with gentamicin (e), in the MLN (f), and in the brain (g). (d to f) n = 10 mice per group. (g) n = 7–9 mice per group. (d and e) Results are expressed as total CFU per gram of tissue. (f and g) Results are expressed as total CFU per organ. Lines are represented at median values. *p<0.05; **p<0.01; ***p<0.001; ns: not significant (Kruskal-Wallis test).
Tables
Key resources table
| Reagent type (species) or resource | Designation | Source or reference | Identifiers | Additional information |
|---|---|---|---|---|
| Strain, strain background (Streptococcus agalactiae) | BM110 | Musser et al., 1989 | N/A | Isolated from patient |
| Strain, strain background (Streptococcus agalactiae) | BM110∆hvgA | Tazi et al., 2010 | CCH395 | |
| Strain, strain background (Streptococcus agalactiae) | BM110∆srr2 | This study | CCH2040 | Constructed by in-frame deletion (see Materials and methods, section Bacterial strains) |
| Strain, strain background (Streptococcus agalactiae) | BM110 BTWT∆srr2 | This study | CCH2041 | (see Materials and methods, section Bacterial strains) |
| Strain, strain background (Streptococcus agalactiae) | NEM316 | Glaser et al., 2002 | N/A | Isolated from patient |
| Cell line (Homo sapiens) | Caco-2/TC7 Colonic epithelial cell | Chantret et al., 1994 | RRID:CVCL_0233 | |
| Cell line (Homo sapiens) | Raji B lymphocytes | ATCC | CCL-86; RRID:CVCL_0511 | |
| Antibody | anti-group B Streptococcus (Rabbit polyclonal) | ThermoFisher | PA1-7250; RRID:AB_561572 | IF (1:100) |
| Antibody | anti-group B Streptococcus (Mouse serum) | This study | N/A | Homemade (see Materials and methods, section Reagents) IF (1:100) |
| Antibody | anti-human glycoprotein 2 (Rabbit polyclonal) | Abcam | ab129414; RRID:AB_11155051 | IF (1:100) |
| Antibody | anti-human glycoprotein 2 (Rabbit polyclonal) | Abcam | ab105503, RRID:AB_10859272 | WB (1:300) |
| Antibody | anti-mouse CD11c- Alexa Fluor 488 (Armenian hamster monoclonal) | Biolegend | 117311; RRID:AB_389306 | IF (1:100) |
| Antibody | anti-mouse CD11c- Alexa Fluor 647 (Armenian hamster monoclonal) | Biolegend | 117312; RRID:AB_389328 | IF (1:100) |
| Antibody | anti-mouse CD11c- Brilliant Violet 785 (Armenian hamster monoclonal) | Biolegend | 117335, RRID:AB_11219204 | FACS (5 µL per test) |
| Antibody | anti-mouse F4/80- PE/Cy5 (Rat monoclonal) | Biolegend | 123111, RRID:AB_893494 | FACS (5 µL per test) |
| Antibody | anti-mouse CD19- Brilliant Violet 711 (Rat monoclonal) | Biolegend | 115555, RRID:AB_2565970 | FACS (5 µL per test) |
| Antibody | anti-mouse CD45-APC (Rat monoclonal) | Biolegend | 103111, RRID:AB_312976 | FACS (5 µL per test) |
| Antibody | anti-mouse I-A/I-E (anti-MHC-II)-FITC (Rat monoclonal) | Biolegend | 107605, RRID:AB_313320 | FACS (5 µL per test) |
| Chemical compound, drug | UEA-I-Rhodamine | Vector Laboratories | RL-1062, RRID:AB_2336769 | IF (1:200) |
| Chemical compound, drug | Estradiol | Sigma-Aldrich | E2758; CAS 50-28-2 | |
| Chemical compound, drug | Progesterone | Sigma-Aldrich | P8783; CAS 57-83-0 | |
| Software, algorithm | Kaluza | Beckman Coulter | RRID:SCR_016182 | |
| Software, algorithm | Image J | http://imagej/net | RRID:SCR_003070 |
Additional files
-
Supplementary file 1
Primers used for RT-qPCR.
- https://doi.org/10.7554/eLife.48772.010
-
Transparent reporting form
- https://doi.org/10.7554/eLife.48772.011
Download links
A two-part list of links to download the article, or parts of the article, in various formats.
Downloads (link to download the article as PDF)
Open citations (links to open the citations from this article in various online reference manager services)
Cite this article (links to download the citations from this article in formats compatible with various reference manager tools)
Perinatal hormones favor CC17 group B Streptococcus intestinal translocation through M cells and hypervirulence in neonates
eLife 8:e48772.
https://doi.org/10.7554/eLife.48772


