Flower-like patterns in multi-species bacterial colonies
- University of California, San Diego, United States
- The San Diego Center for Systems Biology, United States
Figures
Figure 1 with 2 supplements

Flower-like patterns in mixtures of E. coli and A. baylyi.
(a) The pattern after 3 days of growth on a 0.5% LB agar surface. (b) Time-lapse bright-field images of the developing pattern. (c) Pure E. coli and pure A. baylyi colonies show no patterns. (d) Radius of the colony vs time for pure E. coli (green), pure A. baylyi (red), and the mixture of E. coli and A. baylyi (blue). The radius is defined as where is the area of the colony which is calculated after image segmentation.
Figure 1—figure supplement 1
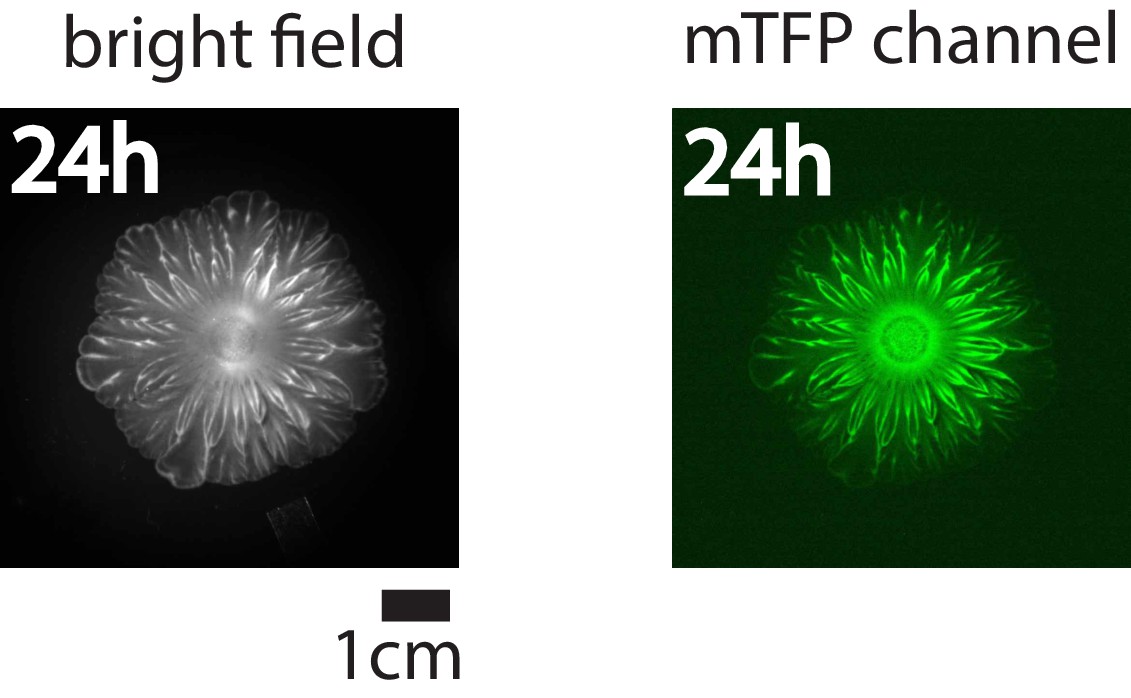
Bright-field image (left) and mTFP channel image (right) for the flower-like pattern after 24 hr of growth under milliscope.
Figure 1—figure supplement 2
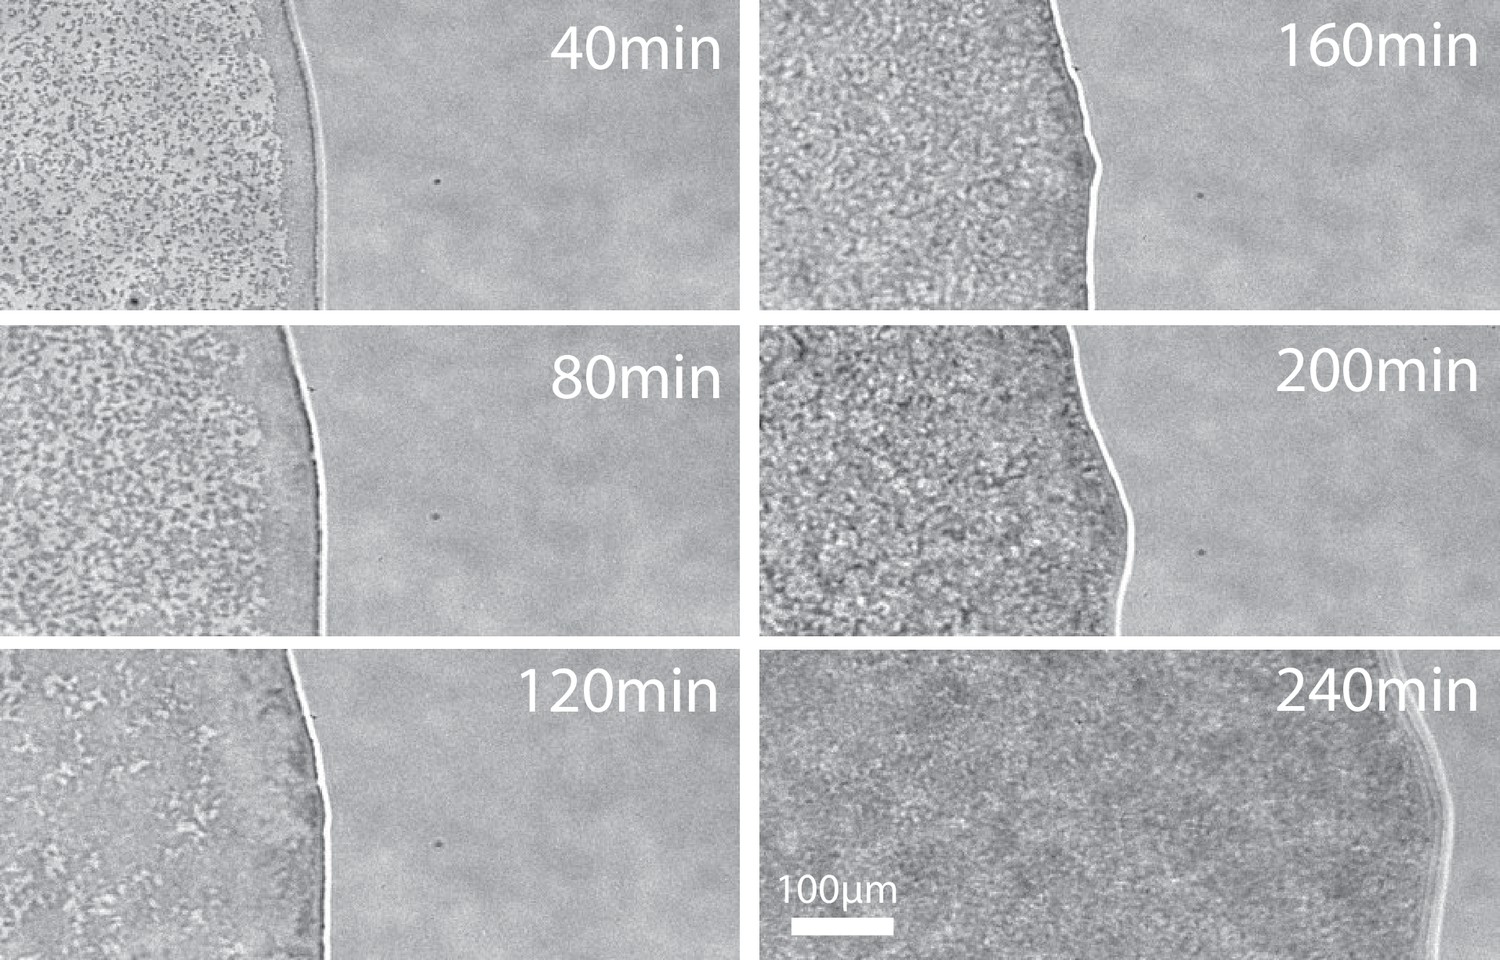
Time-lapse microscopic phase-contrast images after a mixture of E. coli and A. baylyi was inoculated on LB agar.
As bacterial cells grow and divide, interior part of the colony changes from low cell censity (40 min) to high cell density (120 min), and once the cells become dense, the colony begins to expand (200 min to 240 min).
Figure 2 with 3 supplements
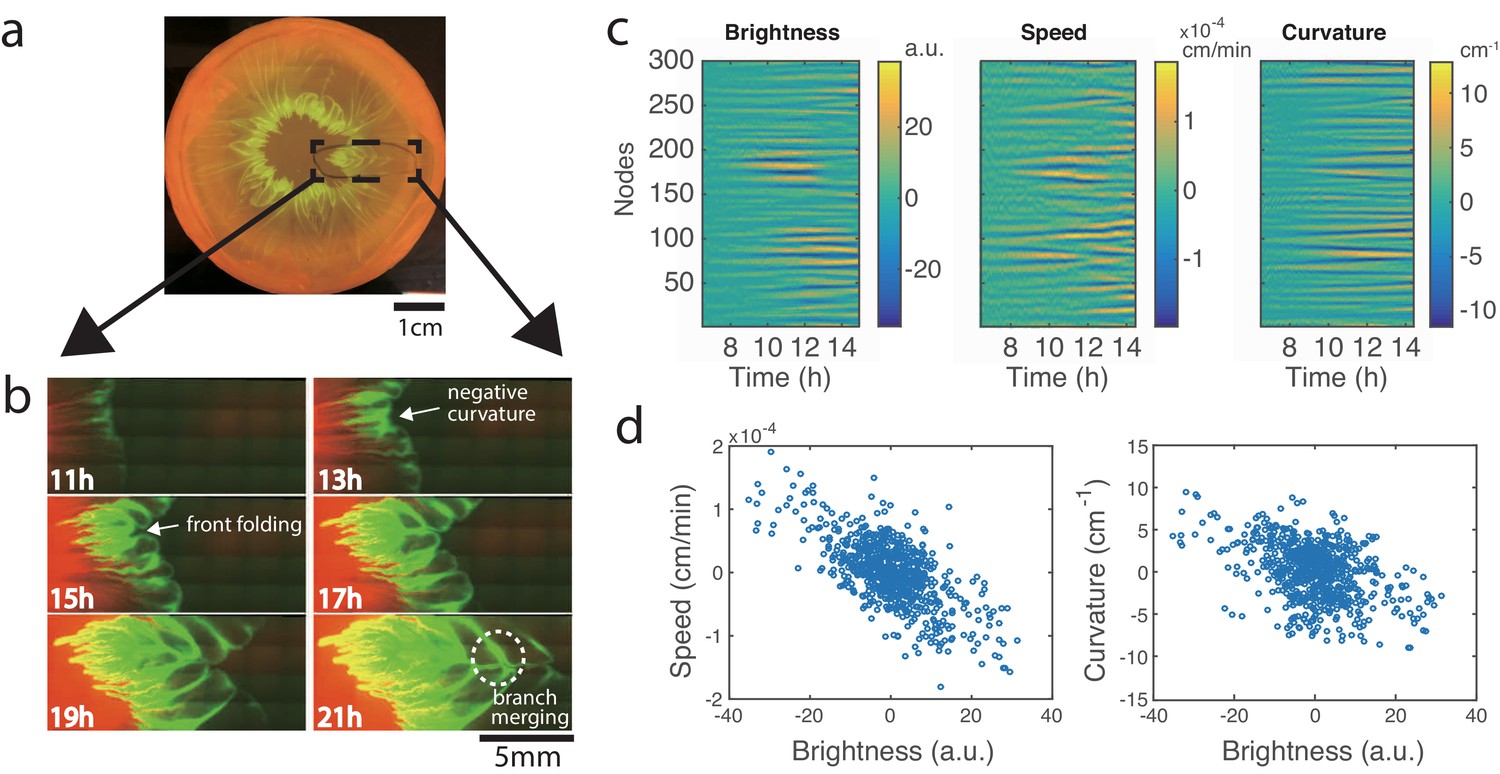
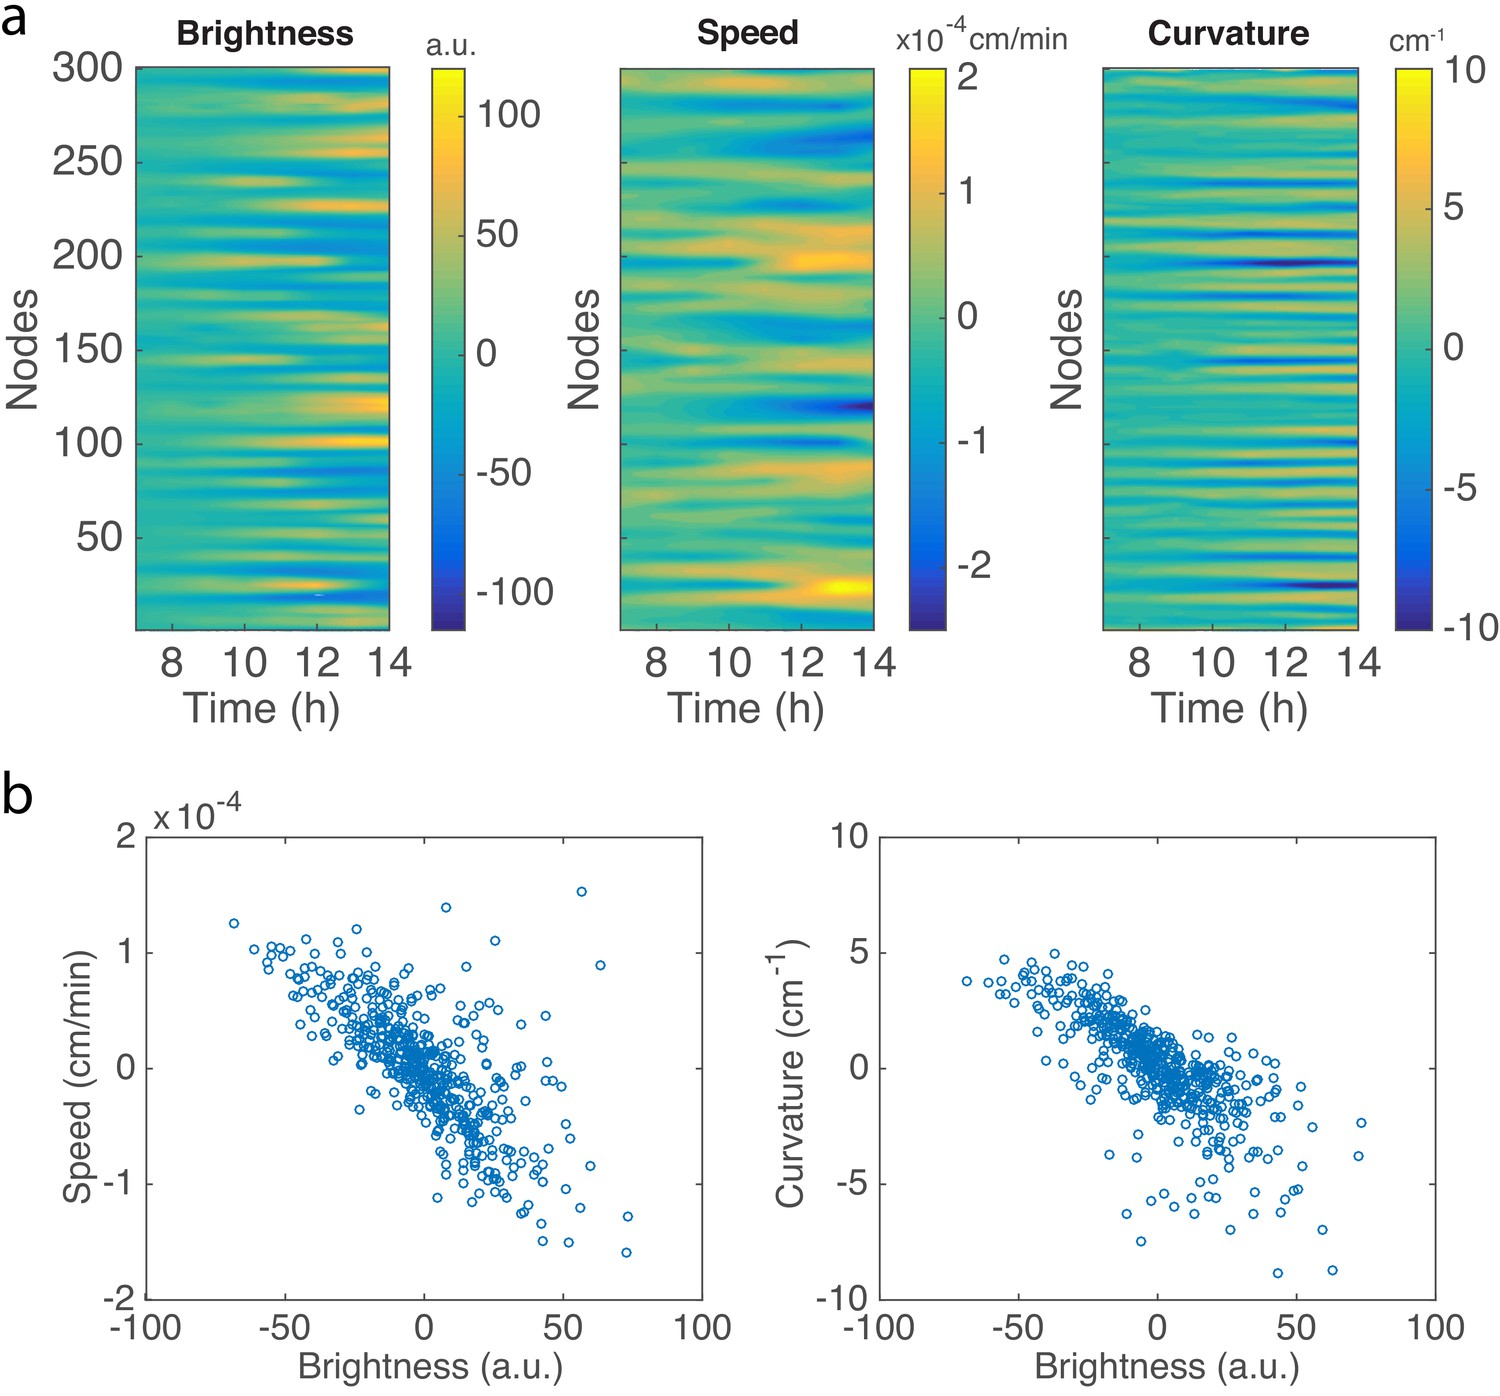
Development of branches in a growing pattern.
(a) The whole colony in a Petri dish after one day. (b) Time-lapse microscopic images of the front propagation leading to branch formation and merging. (c) Kymographs of detrended brightness, front speed and front curvature along the colony boundary. (d) Scatter plots for detrended brightness vs speed (left) and detrended brightness vs curvature (right). Each circle corresponds to one virtual tracking node at one time point.
Figure 2—figure supplement 1
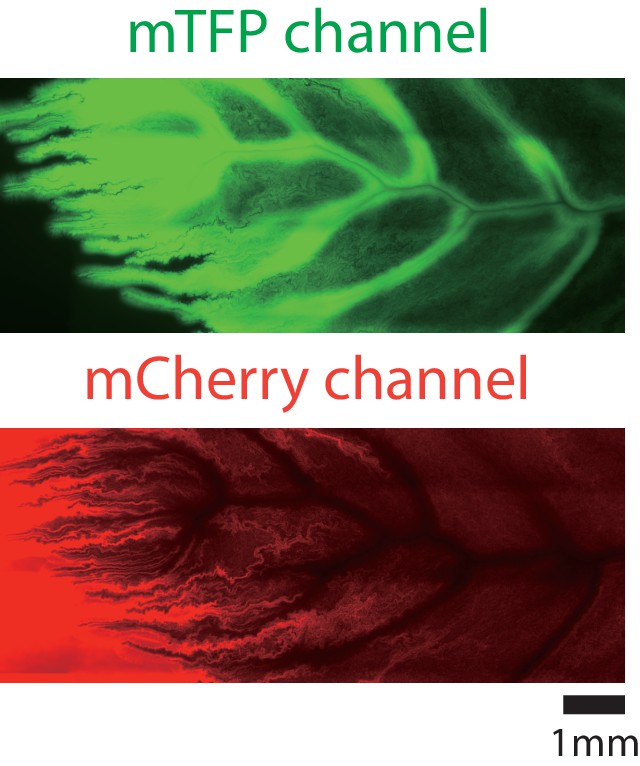
Pattern structure under mTFP and mCherry channels.
Figure 2—figure supplement 2
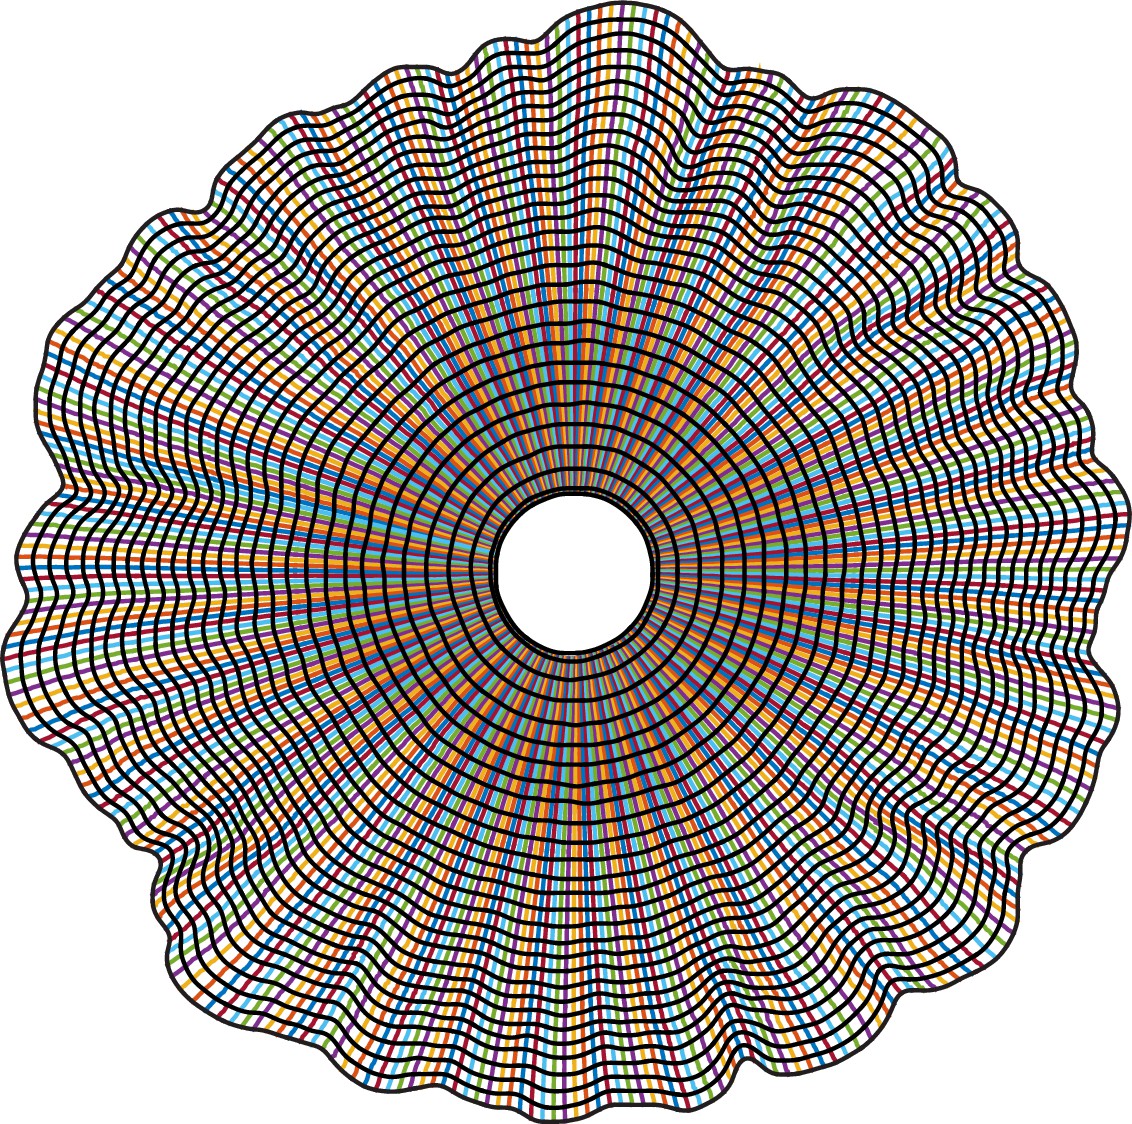
Examples of the tracked colony boundary and traces of 300 virtual nodes on the colony boundary.
Black curves show the splines interpolated from the positions of 300 nodes at each time point. Different curves with colors show the traces of each node.
Figure 2—figure supplement 3
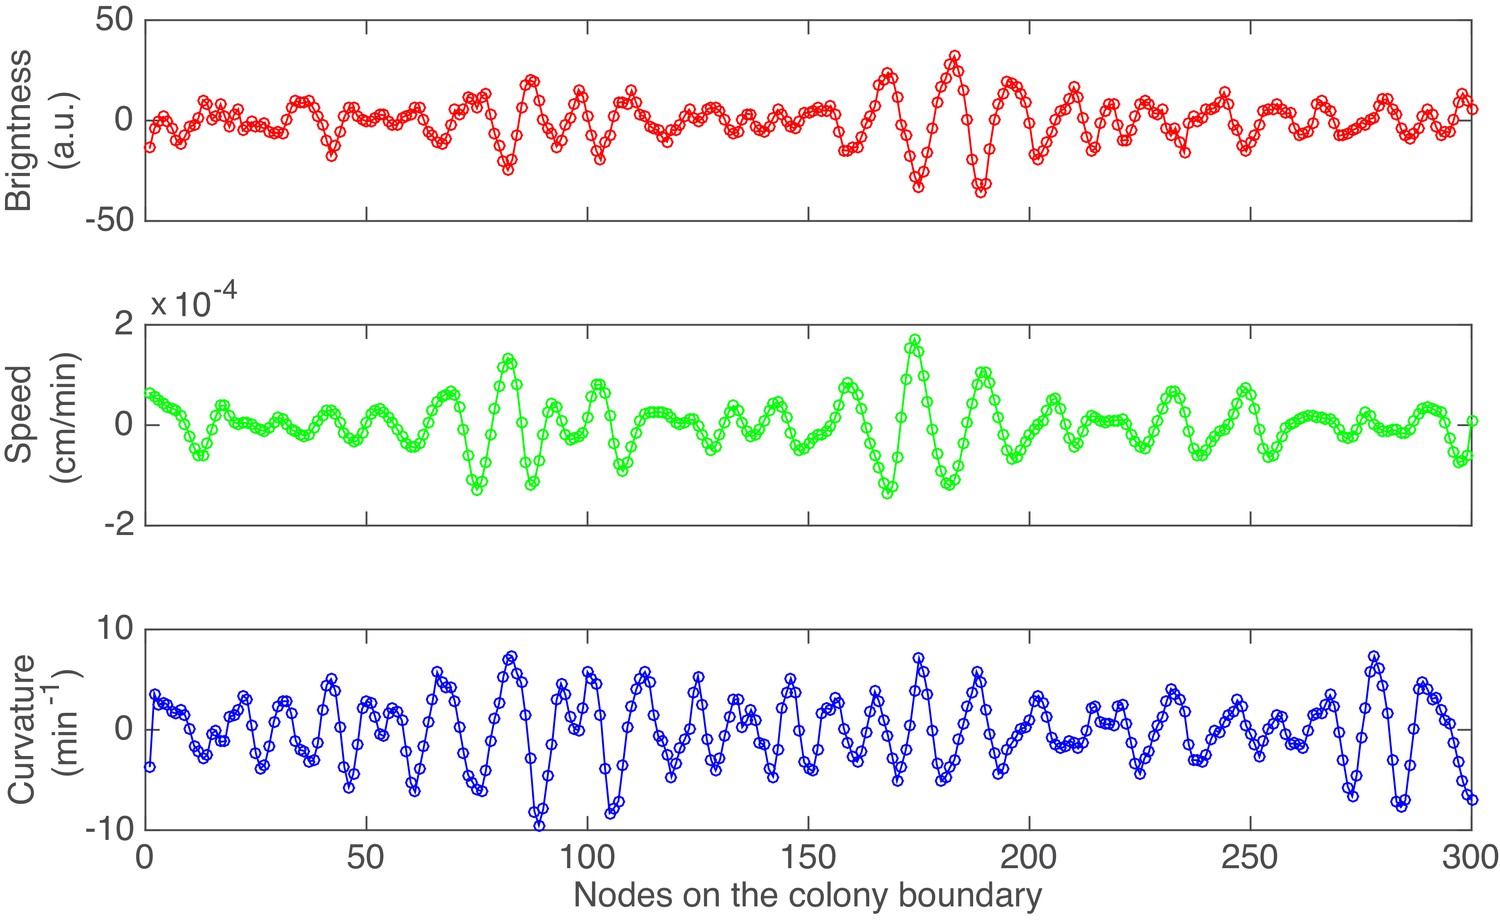
An example of the detrended brightness, speed and local cuvature for all 300 nodes after 10 hr of colony growth in experiment.
Figure 3 with 4 supplements
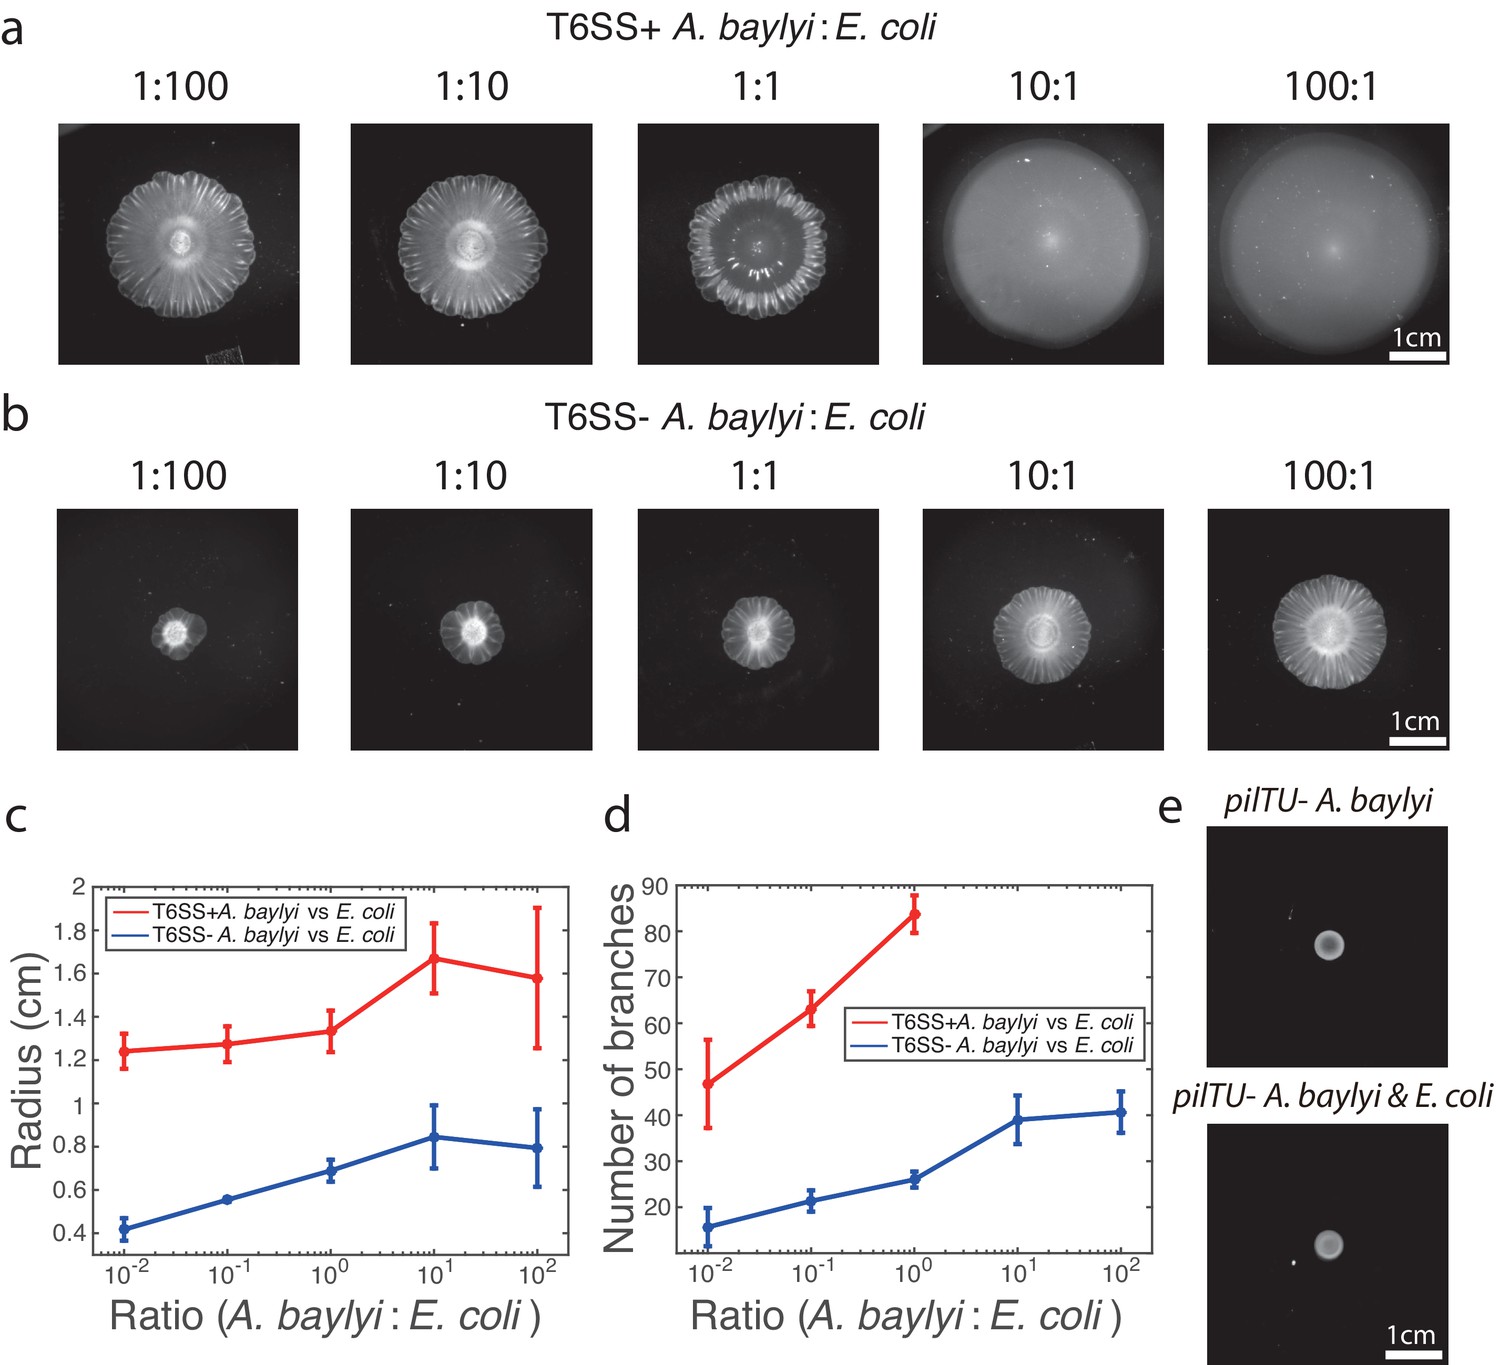
Pattern formation requires A. baylyi motility, but not killing.
(a-b) Bright-field snapshots of colonies of T6SS+ a, and T6SS− b, A. baylyi with E. coli 16 hr after inoculations at different initial density ratios. (c) The average colony radius vs density ratios 16 hr after inoculations. (d) Number of branches at the onset of front instability vs density ratios. (e) Colonies of pure pilTU− T6SS+ A. baylyi and the mixture of pilTU− T6SS+ A. baylyi and E. coli 16 hr after inoculation.
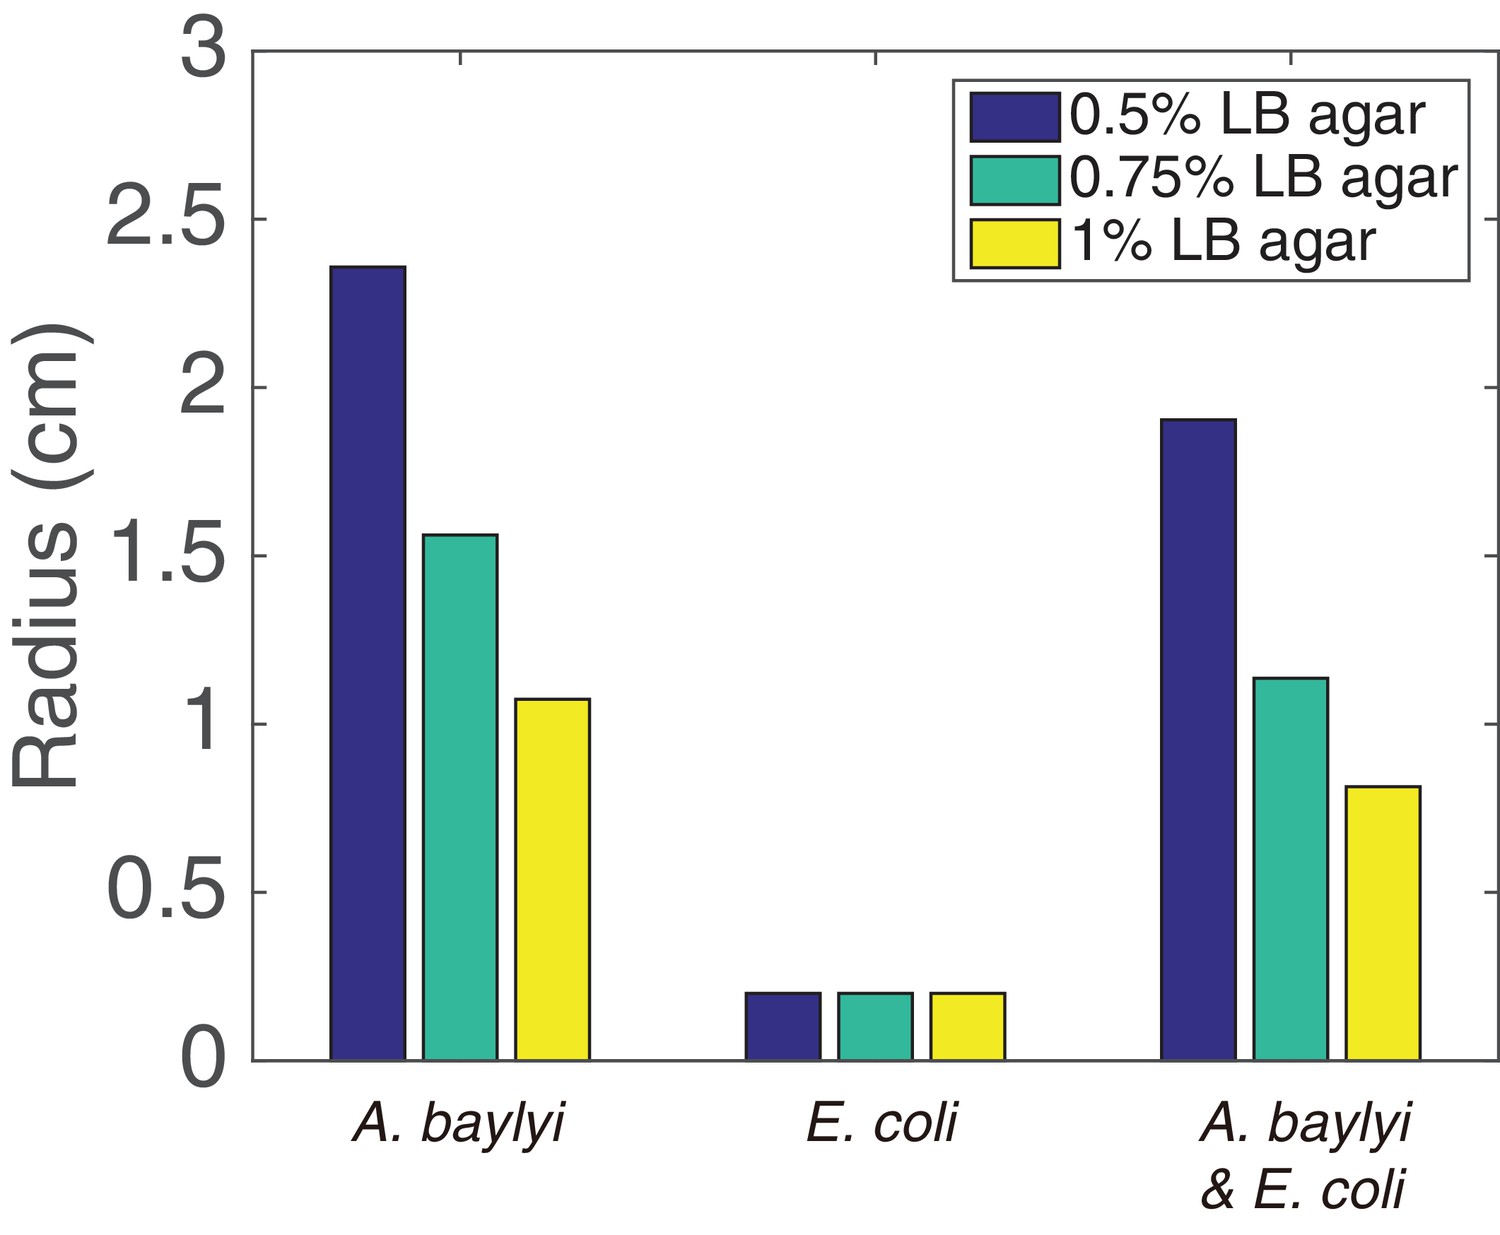
Figure 3—figure supplement 1
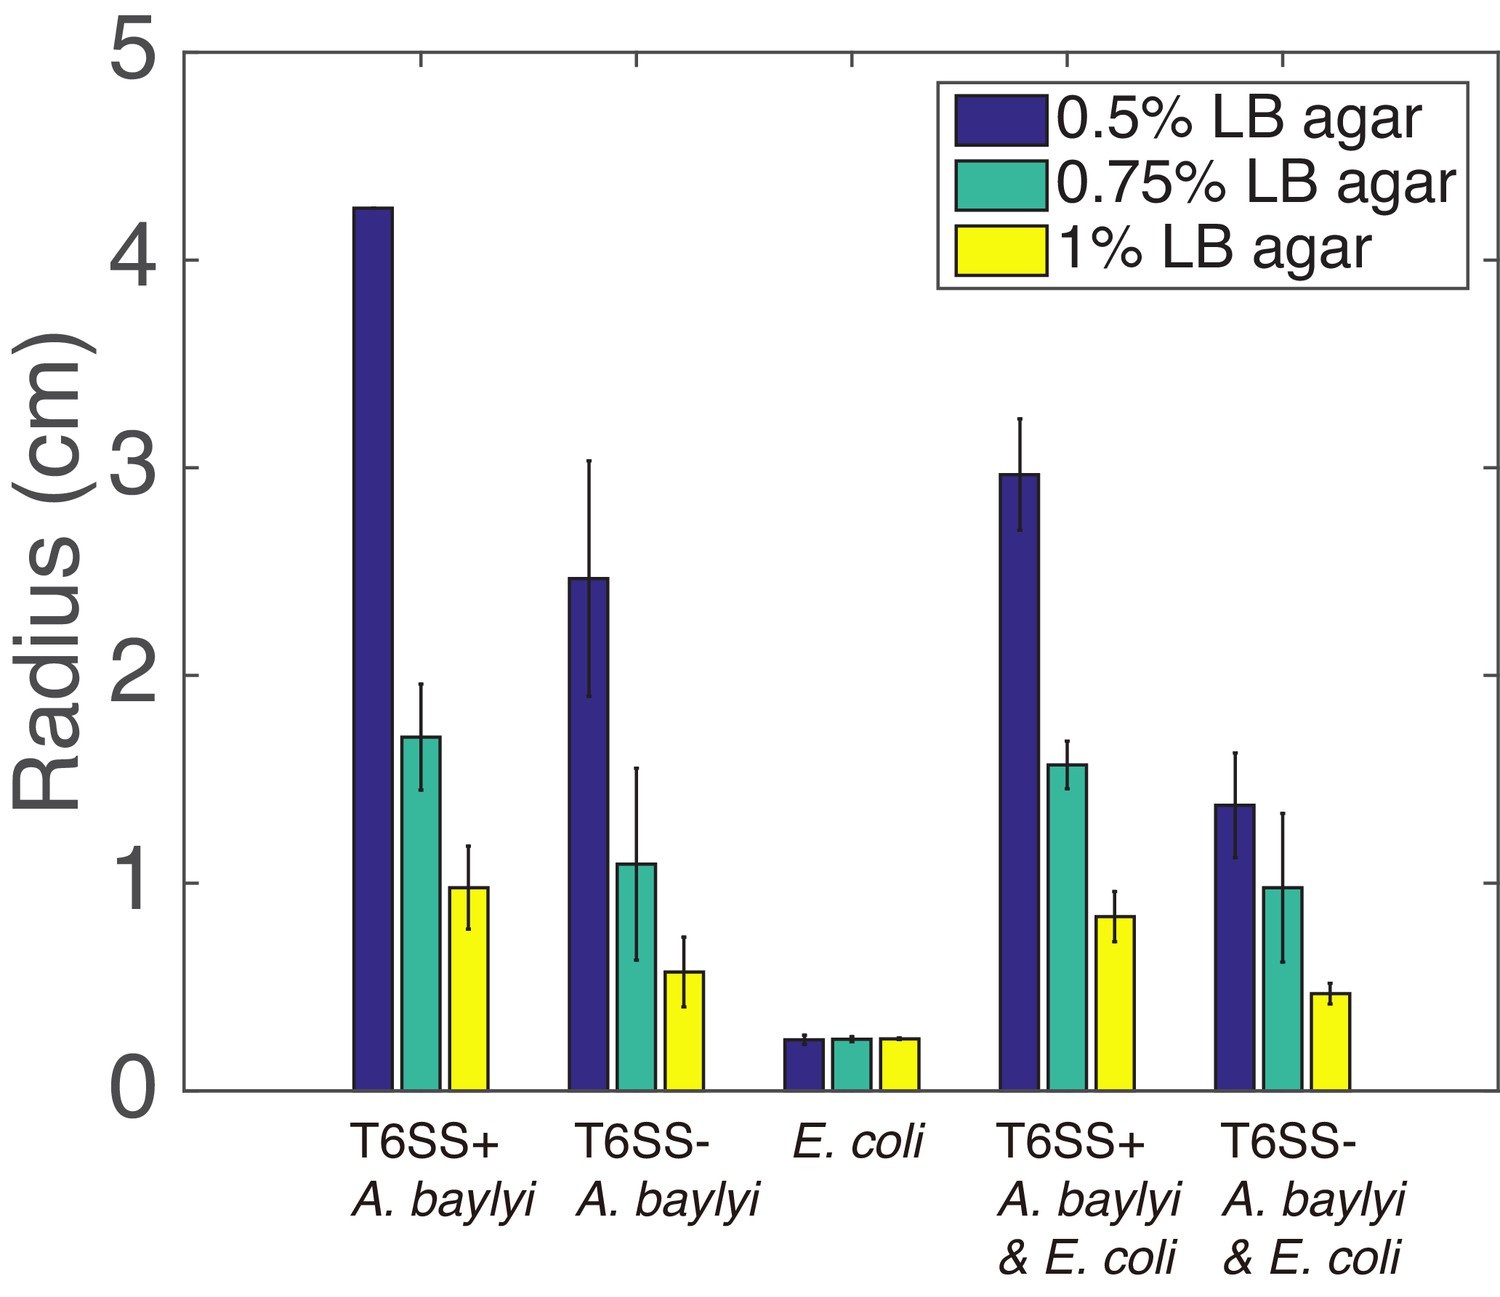
Colony radii after 16 hr of growth in 37 °C for pure T6SS+ A. baylyi, pure T6SS− A. baylyi, pure E. coli, mixture of T6SS+ A. baylyi and E. coli with 1:1 initial density ratio, mixture of T6SS− A. baylyi and E. coli with 1:1 initial density ratio with different agar concentrations (10 mL LB agar).
For pure T6SS+A. baylyi on LB agar (0.5% agar) plate, after 16 hr, the colony already reached the edge of the plate, so the radius of the plate is shown here. For each combination, experiments were run in triplicate.
Figure 3—figure supplement 2
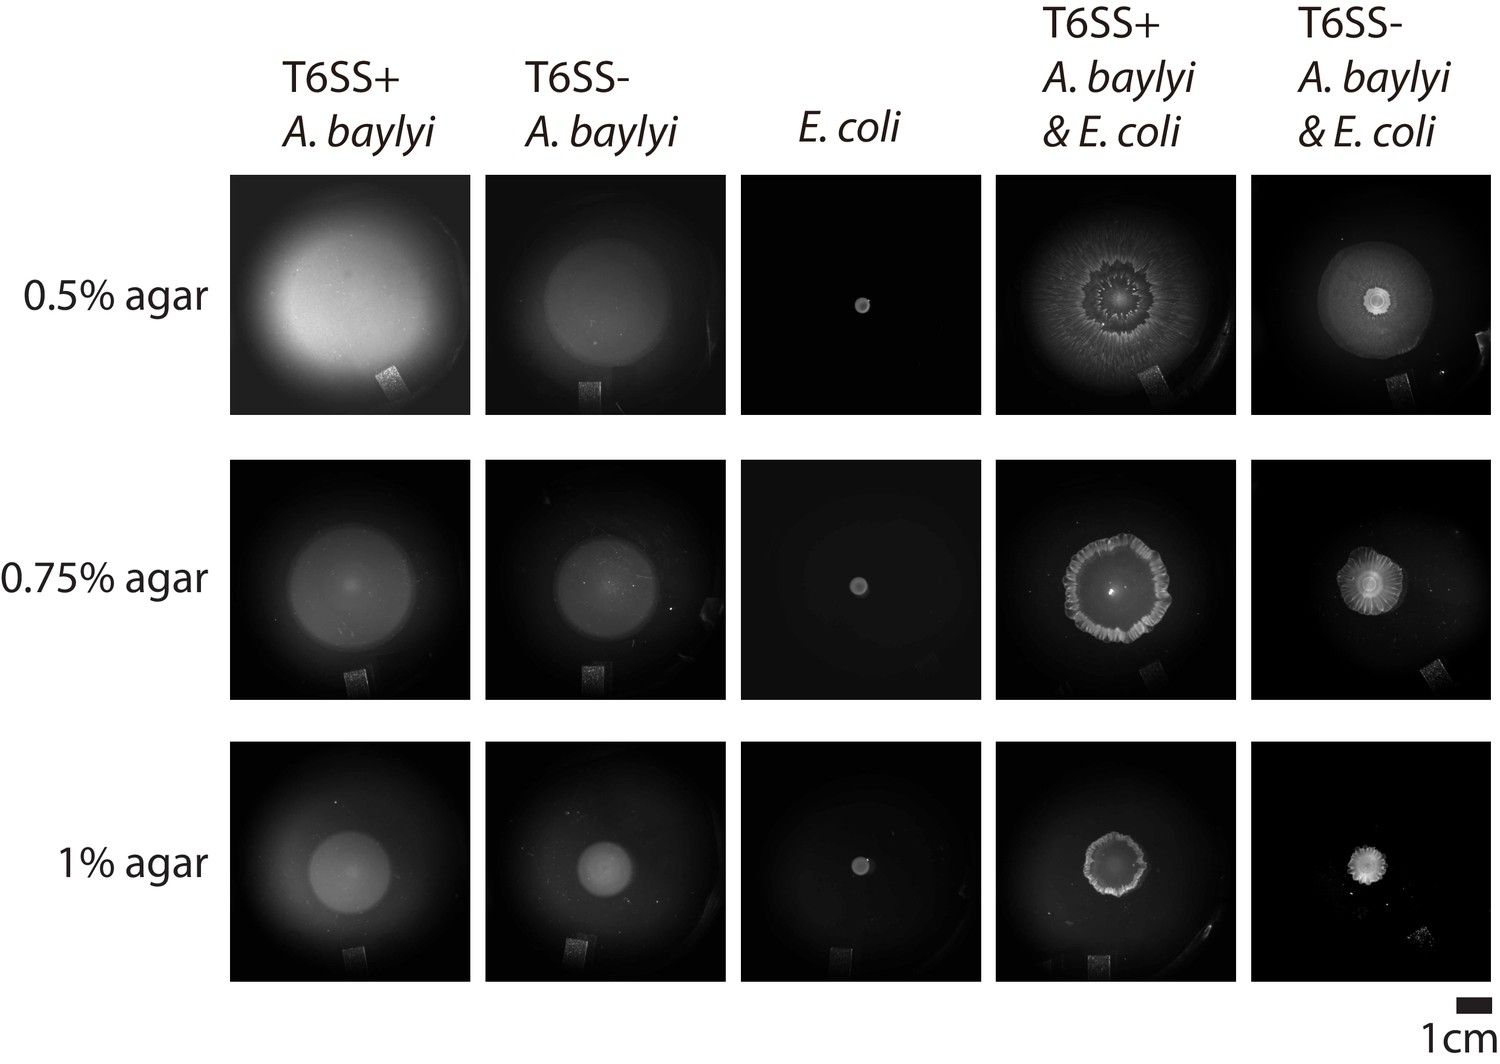
Examples of the colonies for different combinations of E. coli and A. baylyi with different agar concentrations after 16 hr of growth on 10 mL LB agar.
When A. baylyi and E. coli were mixed, the initial seeding density ratio was 1:1.
Figure 3—figure supplement 3
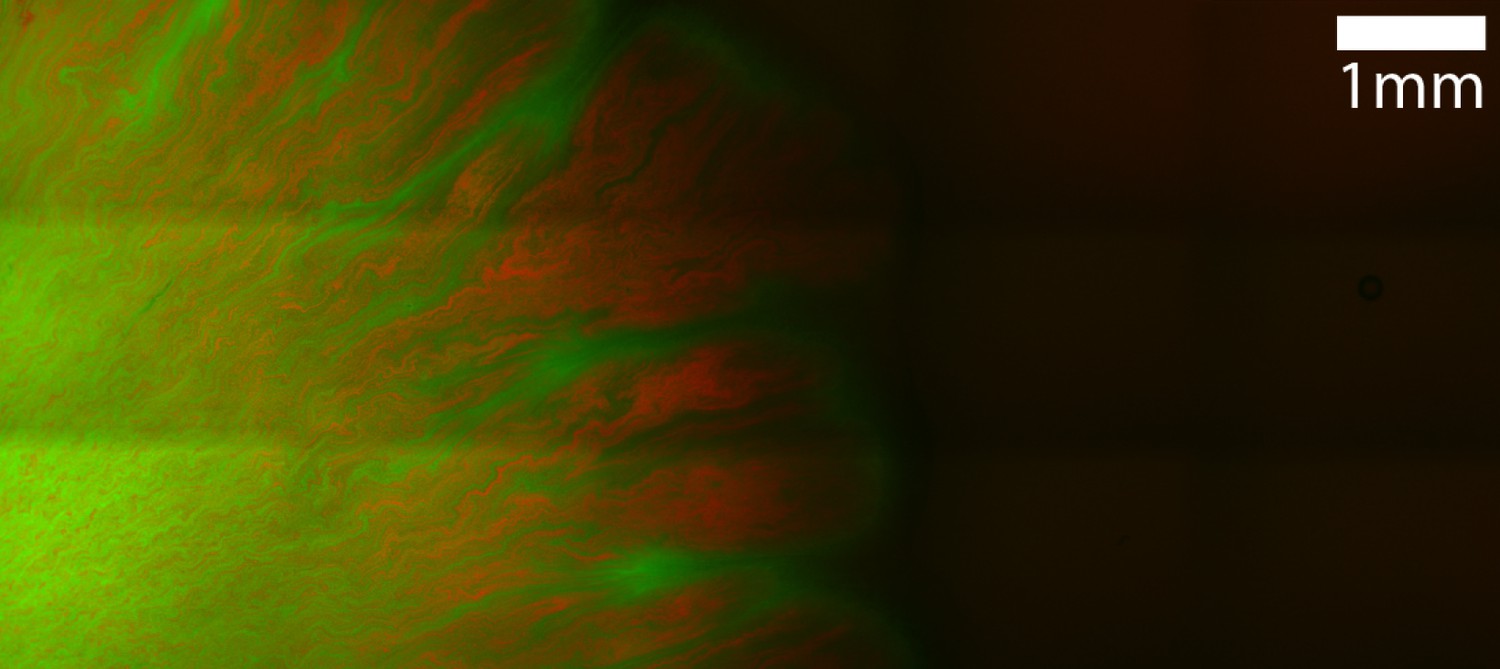
Microscope image of mixture of E. coli and T6SS− A. baylyi on agar surface.
Red color shows A. baylyi (mCherry channel) while green color shows E. coli (mTFP channel).
Figure 3—figure supplement 4
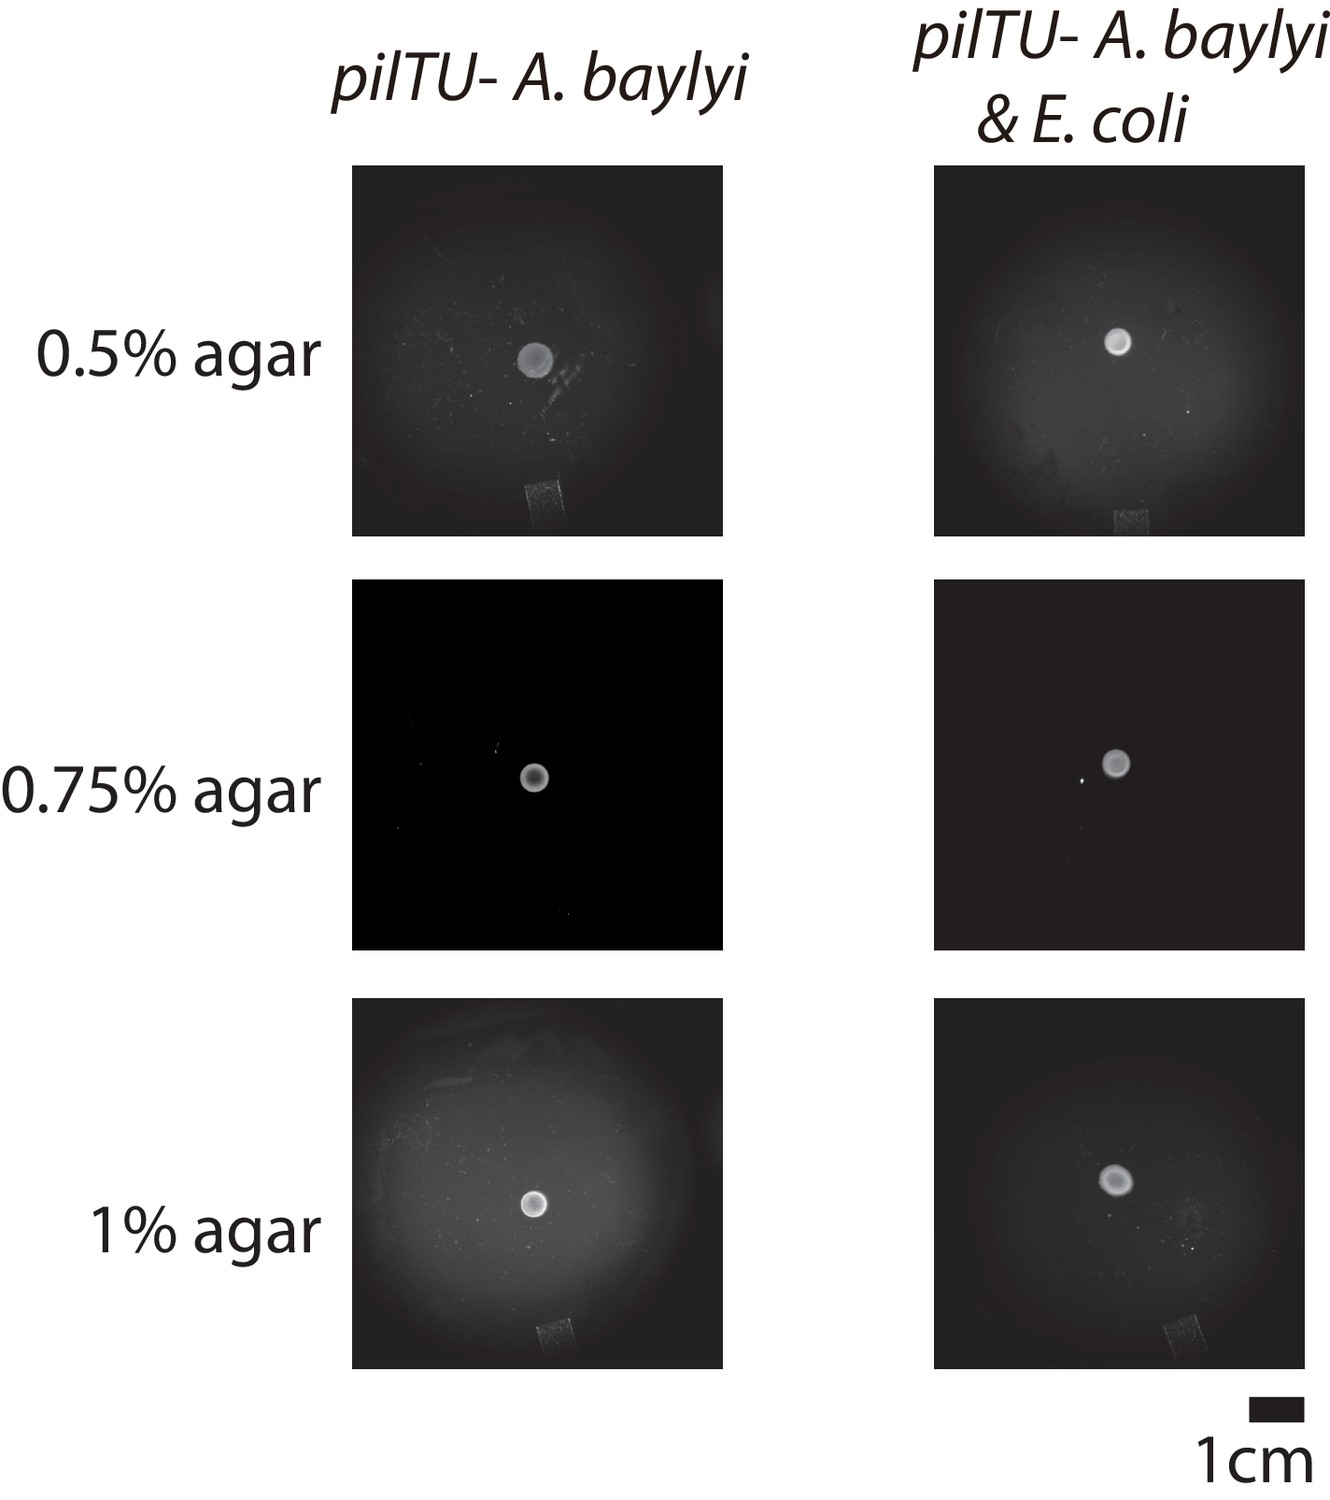
Examples of the colonies for pure pilTU− T6SS+ A. baylyi, mixture of pilTU− T6SS+ A. baylyi and E. coli with initial seeding density ratio 1:1 with different agar concentrations after 16 hr of growth on 10 mL LB agar.
Figure 4
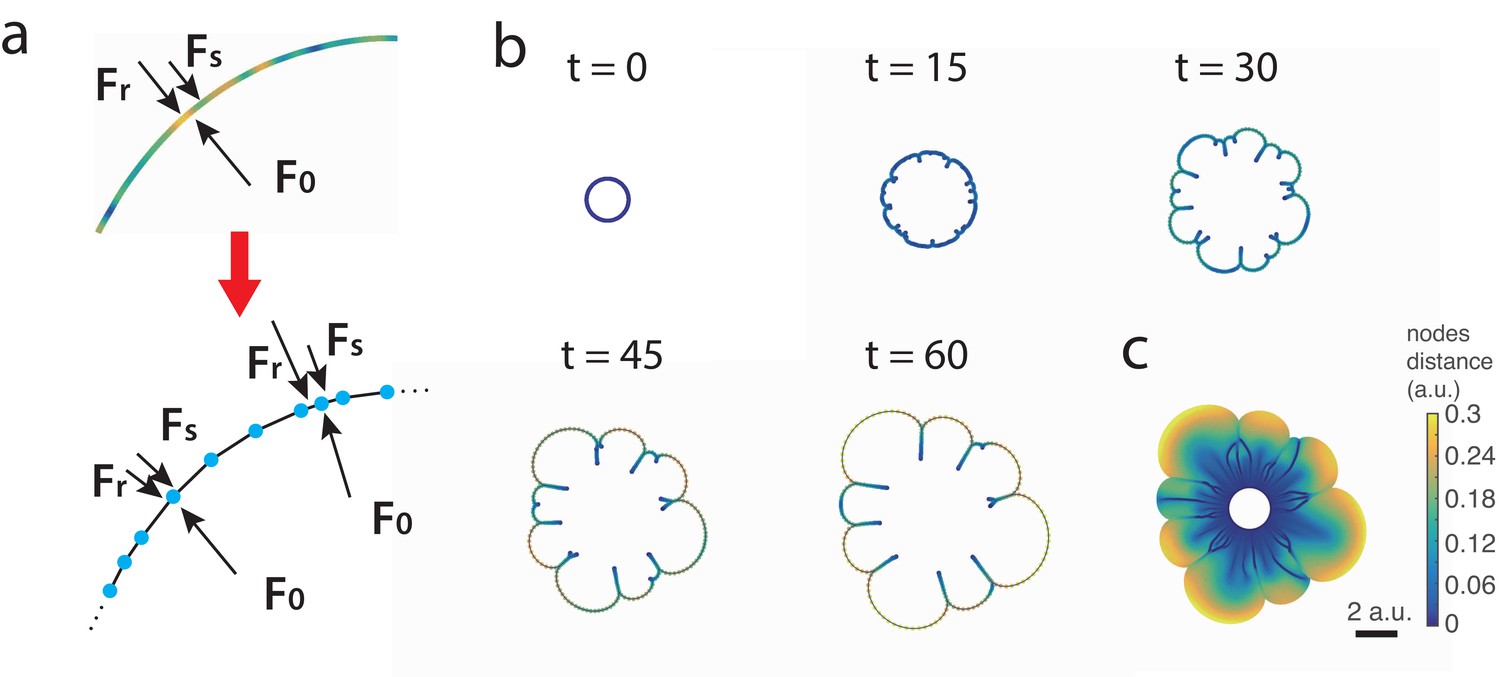
Discrete interface model.
(a) Sketches of the continuum and discrete interface models. (b) Snapshots of the interface in discrete interface model for a sample simulation with parameters listed in Appendix 1. The colors of the nodes correspond to the distance between node and its neighbors. (c) ‘Fossil record’ of E. coli densitiy on the moving interface.
Figure 5 with 2 supplements
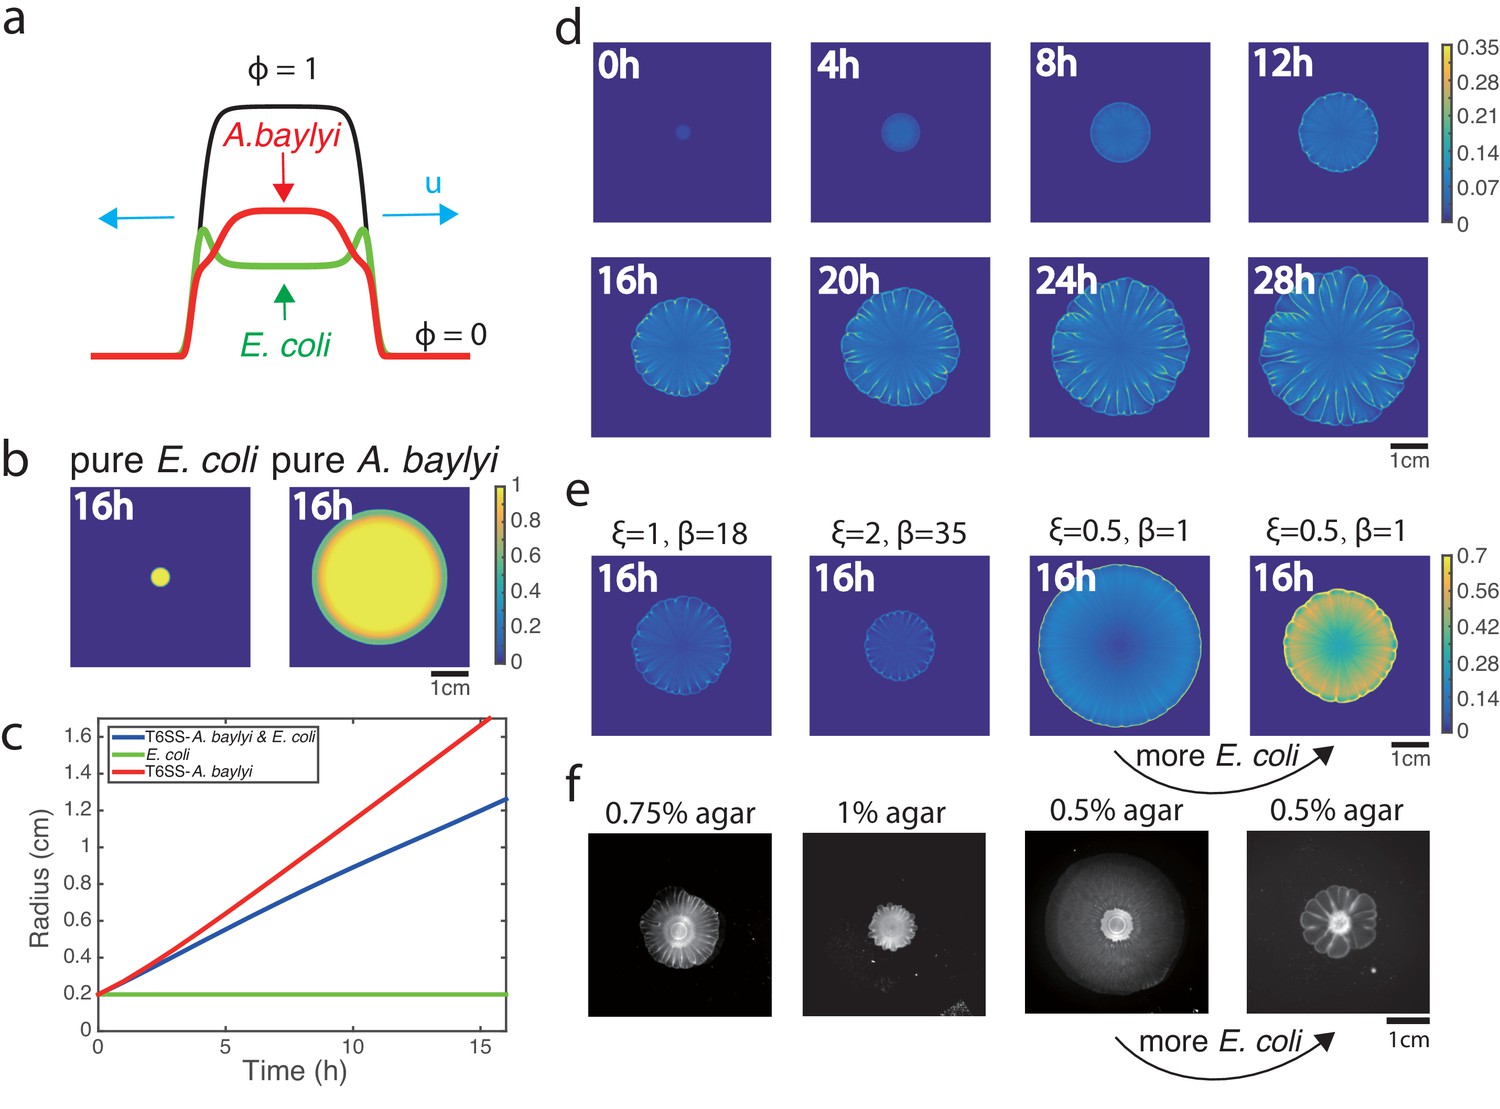
Phase-field model simulations of two-species colony growth.
(a) Illustration of the model. (b) Snapshots of the colonies of pure E. coli and pure A. baylyi at t = 16. A colony of E. coli expanded only slightly, while a pure colony of A. baylyi expanded quickly, but remained circular. (c) Colony radius vs time for the mixed and single-species colonies. Radius is defined as . (d) Several snapshots of E. coli density during the growth of a mixed colony in simulations. (e) Colony snapshots at time t = 16 in simulations using different friction parameters. For larger friction, the colony grew slower, but still featured flower-like patterns. For smaller friction, the colony expanded more quickly, but patterns eventually disappeared. However, increasing the initial concentration of E. coli at low friction coefficients restored patterning. (f) Experimental snapshots with different agar concentrations 16 hr after inoculation: similar phenomenology observed.
Figure 5—figure supplement 1
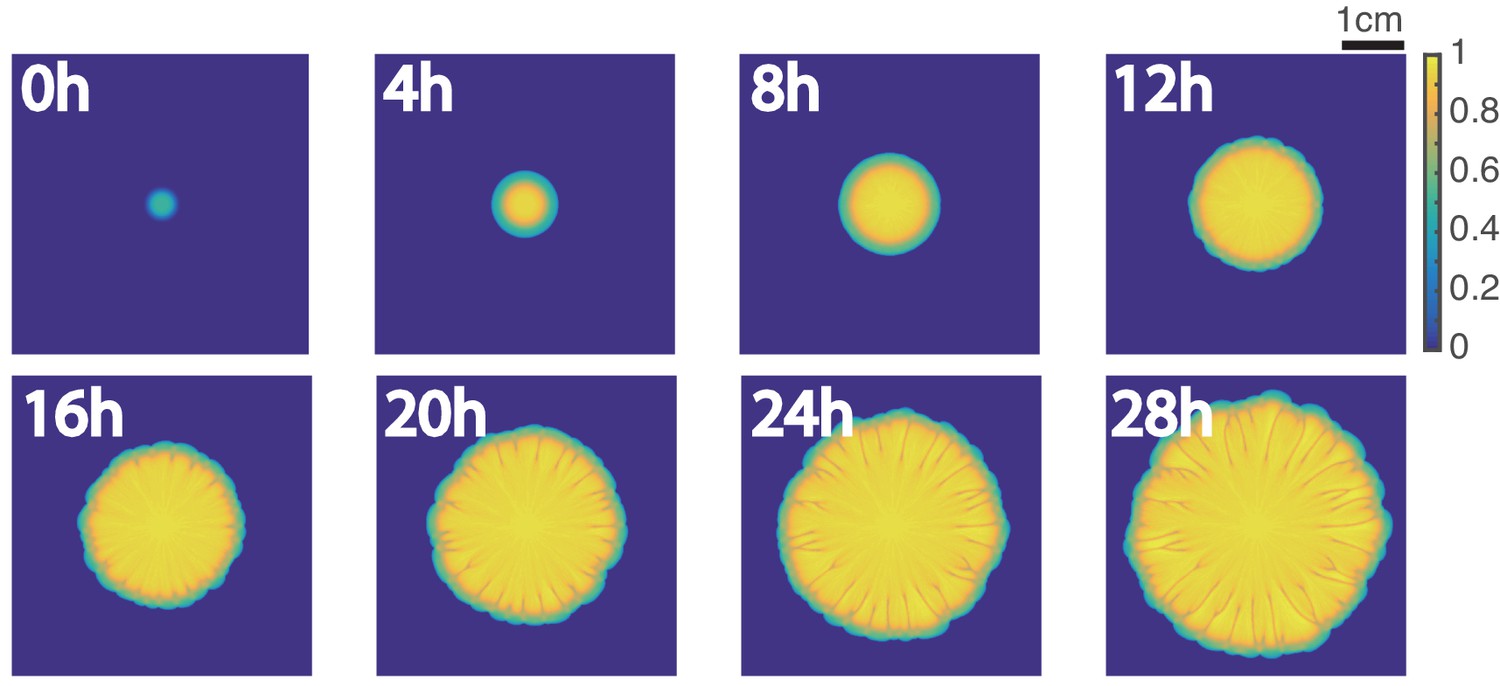
Several snapshots of A. baylyi density during the growth of a mixed colony in a phase-field model simulation.
Figure 5—figure supplement 2
Analysis of the colony boundary dynamics in phase-field model simulation.
(a) Kymographs of detrended brightness, speed and curvature along the colony boundary from the simulation in Figure 5D and Video 5. (b) Scatter plots for detrended brightness vs. speed (left) and detrended brightness vs. curvature (right). Each circle corresponds to one virtual tracking node at one time point. Pearson coefficient for detrended brightness and speed is ρ=−0.71, and for detrended brightness and curvature is ρ=−0.75. Data points with 1 hr interval from 8 hr to 12 hr are used in the scatter plot. For each time point, 100 nodes are used.
Appendix 2—figure 1

The influence of different parameters on the pattern formation in phase-field model.
The parameters in Appendix 2—table 1 are used for the baseline simulation. For each snapshot, only one parameter (the parameter on top of each snapshot) is changed relative to the baseline simulation while other parameters stay the same.
Appendix 2—figure 2
Colony radii after 14 hr of growth in simulations.
The parameters in Appendix 2—table 1 are used for the 0.75% LB agar simulation. For 0.5% LB agar, and for 1% LB agar, .
Appendix 3—figure 1
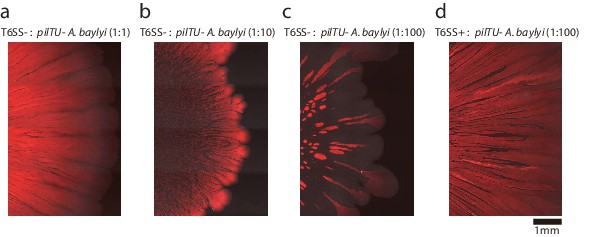
Colonies of mixtures of motile (T6SS+ or T6SS−) and non-motile (pilTU−) A. baylyi after 18 hr of growth on 0.75% LB agar for different initial compositions, as indicated by the titles above the panels.
Red color indicates fluorescent motile A. baylyi and dark regions within the colony indicate non-motile A. baylyi lacking fluorescent marker.
Appendix 3—figure 2

Non-motile strain density at time t = 20 in simulations of mixtures of motile and non-motile strains using different non-motile strain growth rate and non-motile strain-dependent friction coefficient .
Author response image 1

Videos
Video 1
Formation of flower-like patterns in the mixture of T6SS+ A. baylyi and E. coli under milliscope.
Initial A:E density ratio was 1:10 and the cells grew on 10 mL LB agar (0.5% agar).
Video 2
Development of branches in a growing flower-like pattern under microscope (4x magnification).
Initial A:E density ratio was 1:1 and the cells grew on 10 mL LB agar (1% agar).
Video 3
A sample simulation of the discrete colony interface model.
Video 4
A pattern forming as a ‘fossil record’ of node colors (corresponding to E. coli density on the interface) in the discrete interface model simulation of Video 3.
Video 5
A sample simulation of the phase-field model of two-species colony growth.
Video 6
When T6SS+ A. baylyi and E. coli were inoculated separately on 10 mL LB agar (0.75% agar), the flower pattern formed only in a segment.
Video 7
Segmentation and tracking of the boundary of the growing colony from Video 1.
Appendix 3—video 1
Pattern formation in a mixture of motile T6SS− and non-motile pilTU− A. baylyi with intitial density ratio 1:10 on 0.75% LB agar.
Tables
Appendix 1—table 1
Parameters of the interface model.
| 1 | 0.5 | 0.1 | 0.01 | 1 | 512 | 0.001 |
Appendix 2—table 1
Parameters of the phase-field model.
| 0.008 cm/h | 0.16 cm | 0.0024 cm2/h | 1.2 hr-1 | 4×10⁻⁵ cm2/h | 1.3 hr-1 | ||
| 0.0036 cm2 | 0.03 cm2/h | 1 | 18 | 0.3 | 0.01 cm | 0.01 cm | 1×10⁻⁴ hr |
Additional files
-
Source code 1
Colony boundary tracking software.
- https://cdn.elifesciences.org/articles/48885/elife-48885-code1-v2.mlappinstall.zip
-
Transparent reporting form
- https://cdn.elifesciences.org/articles/48885/elife-48885-transrepform-v2.docx
Download links
A two-part list of links to download the article, or parts of the article, in various formats.
Downloads (link to download the article as PDF)
Open citations (links to open the citations from this article in various online reference manager services)
Cite this article (links to download the citations from this article in formats compatible with various reference manager tools)
Flower-like patterns in multi-species bacterial colonies
eLife 9:e48885.
https://doi.org/10.7554/eLife.48885


