Inducing conformational preference of the membrane protein transporter EmrE through conservative mutations
- New York University, United States
Figures
Figure 1 with 2 supplements
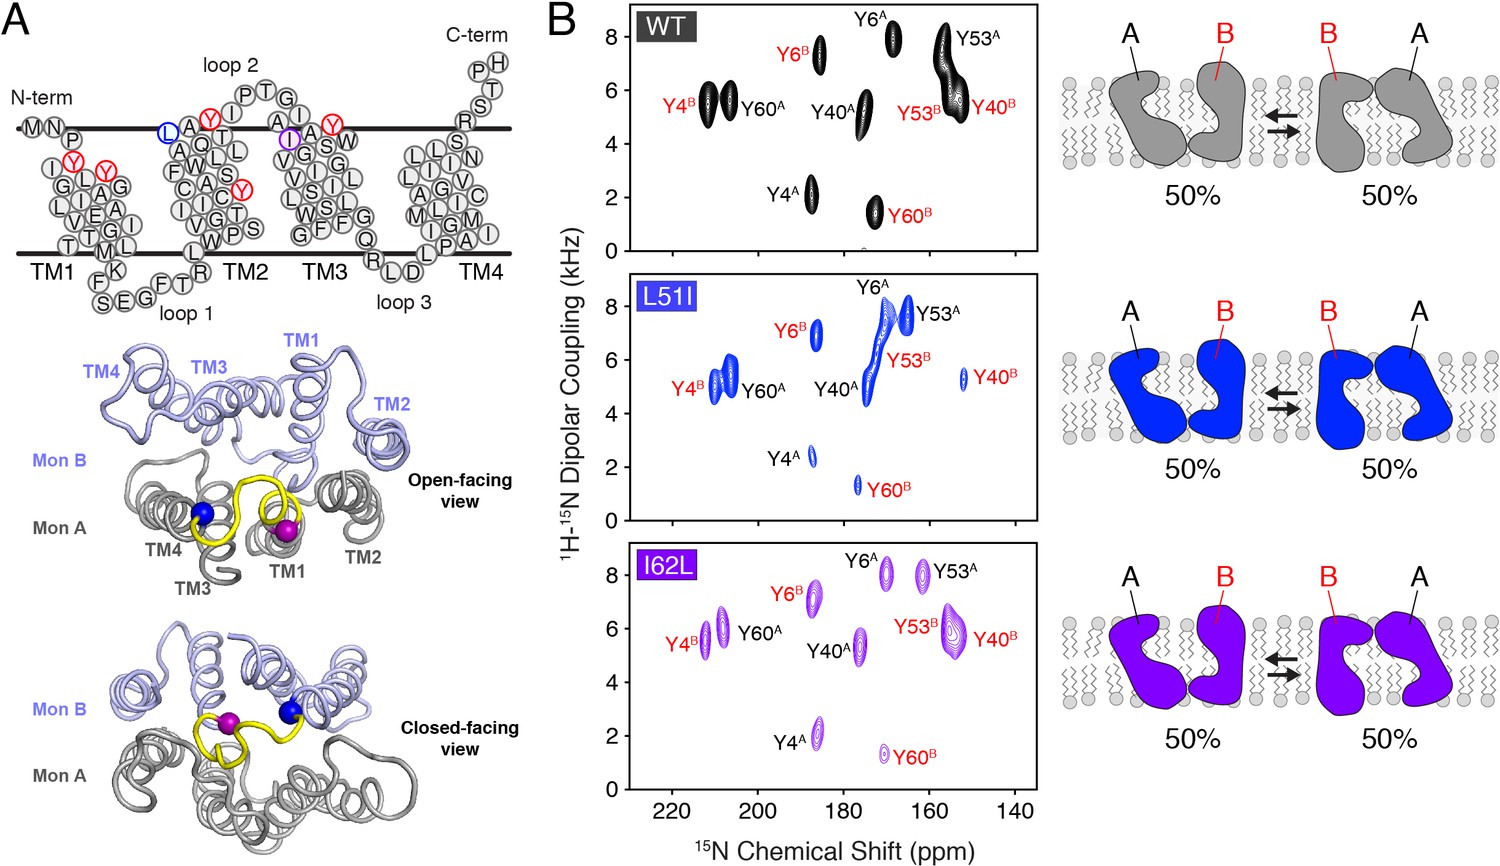
Conservative mutations within EmrE.
(A) The top panel shows the primary sequence of EmrE and indicates the TM helices and loops. Residues colored in blue, purple, and red correspond to Leu51, Ile62, and tyrosine residues, respectively. The middle and bottom panels display a cartoon representation of the X-ray structure of EmrE (3B5D) (Chen et al., 2007) with the two monomers differentially colored: monomer A is in gray; monomer B is in light blue. Residues corresponding to residues 51–62 are highlighted in yellow and the blue and purple spheres correspond to Leu51 and Ile62, respectively. The middle panel shows a view of the open side of EmrE with residues 51–62 colored for monomer A. The bottom panel shows a view from the closed side of EmrE with the same residues colored for monomer B. (B) PISEMA spectra of wild-type EmrE, L51I, and I62L. All spectra are displayed at 5-times the standard deviation of the noise. Tyr53 located within loop 2 showed a notable spectral perturbation in L51I and I62L PISEMA spectra relative to the wild-type spectrum; a spectral expansion is displayed in Figure 1—figure supplement 1. Due to these perturbations, the assignment was confirmed using a single-site tyrosine mutation with a subsequent PISEMA dataset collected (see Figure 1—figure supplement 2).
Figure 1—figure supplement 1
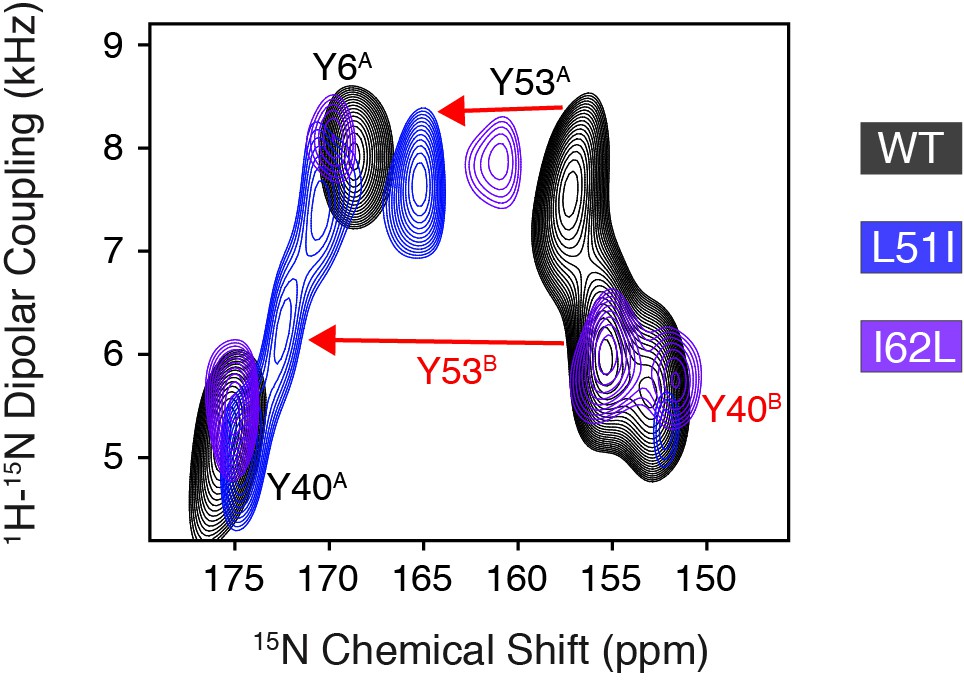
Overlay of PISEMA spectra focusing on changes to Tyr53 upon mutation of loop 2 residues.
PISEMA spectra corresponding to wild-type EmrE (black), L51I (blue), and I62L (purple) highlight Tyr53 as the only perturbed residue in mutant spectra relative to the wild-type protein. These spectra are displayed at the same contour level as that shown in Figure 1B.
Figure 1—figure supplement 2
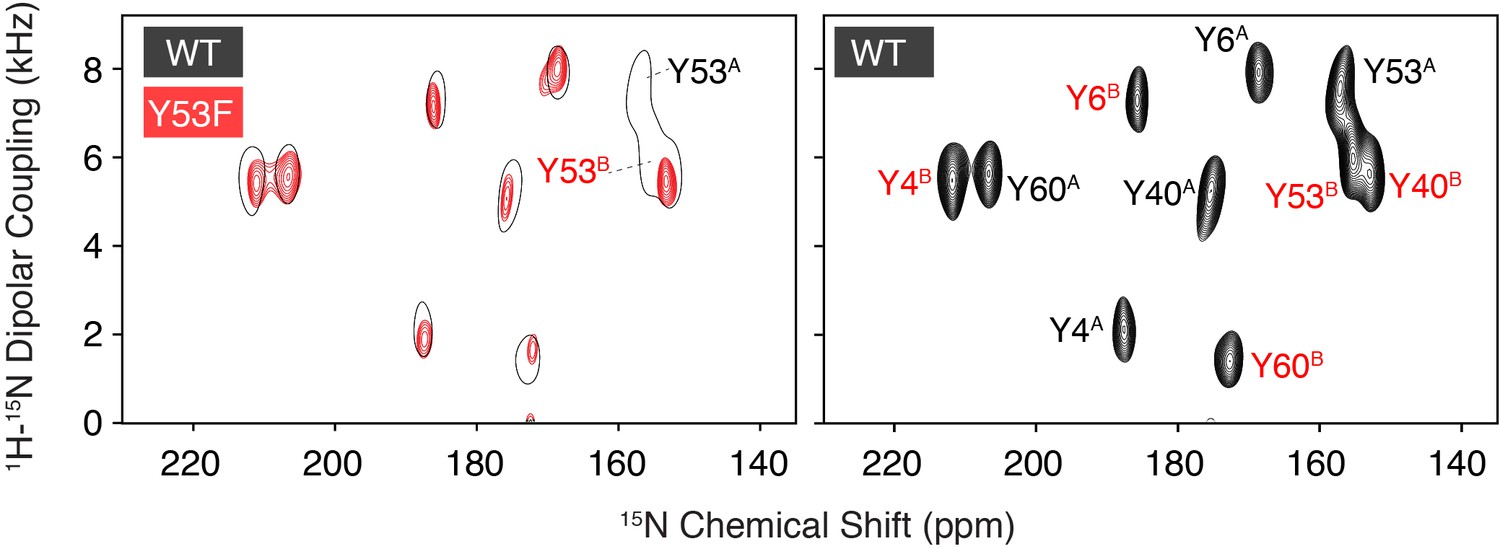
Assignment of Tyr53 using single-site mutagenesis.
A PISEMA spectrum of 15N tyrosine labeled Y53F (red) is compared with a spectrum of wild-type EmrE at pH 5.8 (left panel). The assigned wild-type spectrum is shown for reference (right panel). From the comparison, it is straightforward to assign the two missing signals to Tyr53. Additional assignments of EmrE indicated within the panel on the right were obtained using proton-driven spin exchange spectra and helical wheel predictions based on previously published assignments (Cho et al., 2014; Gayen et al., 2013; Banigan et al., 2018).
Figure 2 with 2 supplements
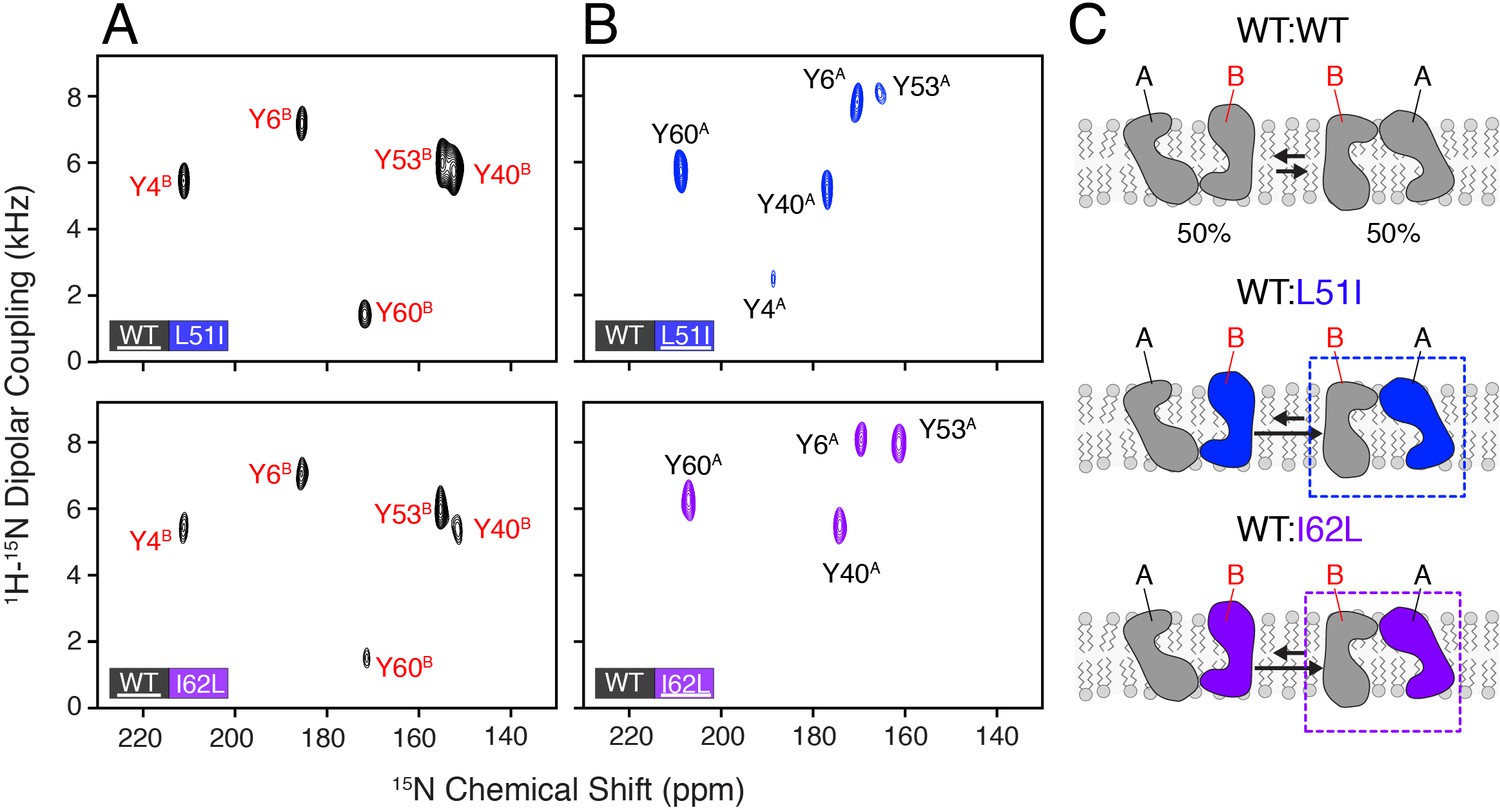
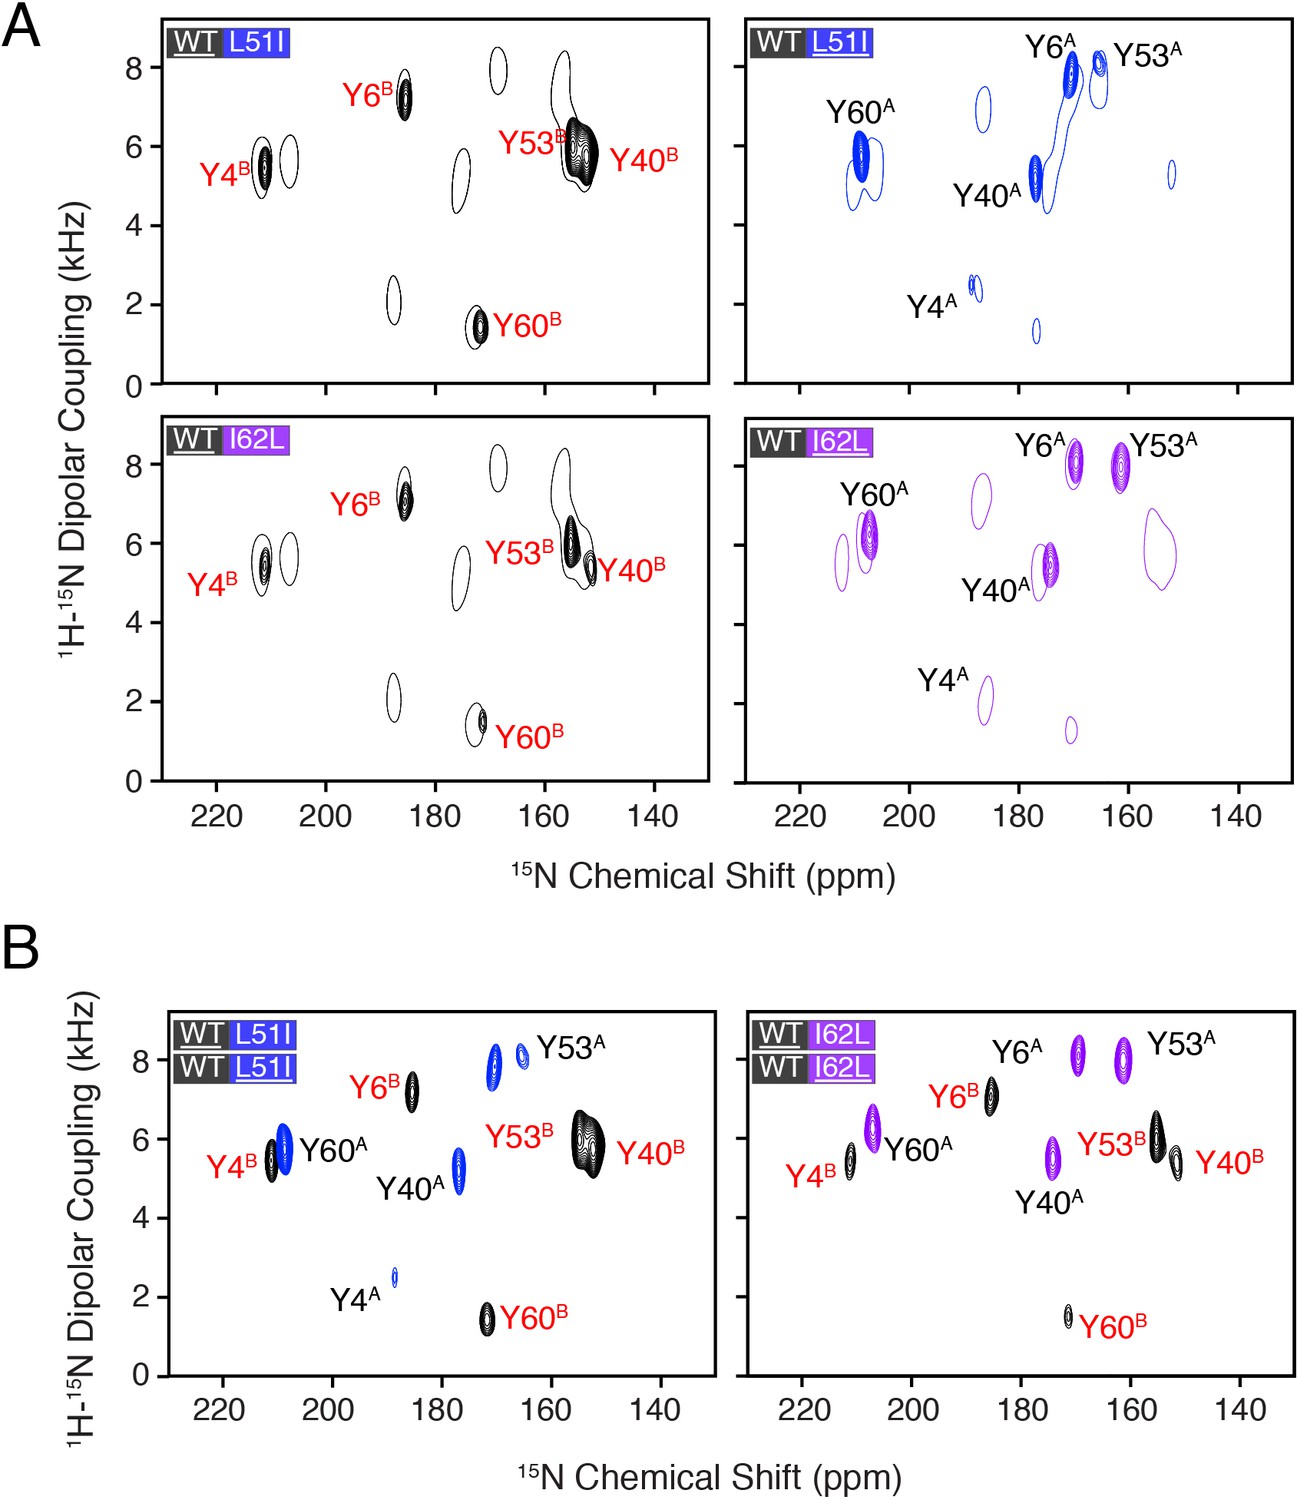
Heterodimer experiments showing conformational bias using oriented sample solid-state NMR.
(A) PISEMA spectra of isotopically enriched wild-type EmrE mixed with L51I (top) or I62L (bottom) at natural abundance. (B) PISEMA spectra of isotopically enriched L51I (top) or I62L (bottom) mixed with wild-type EmrE at natural abundance. The underlined protein in each panel was isotopically enriched with 15N tyrosine, while the partner protein was unlabeled and NMR silent. Each PISEMA spectrum is shown at 5-fold above the standard deviation of the noise within the dataset. (C) Cartoon representation depicting how heterodimers lead to a change in the conformational equilibrium, where the mutant adopts monomer A conformation in the heterodimer and the wild-type monomer B population.
Figure 2—figure supplement 1
Overlay of PISEMA spectra of homodimers and heterodimers.
(A) Spectral overlays of heterodimer spectrum shown with several contour levels and the corresponding homodimer spectrum shown in a single contour level. The underlined protein in each panel was isotopically enriched with 15N tyrosine, while the partner protein was unlabeled and NMR silent. The homodimer spectrum in each panel correspond to the underlined protein. (B) Overlay of spectra for each isotopically enriched monomer in the heterodimer samples at the same contour level and colors as that shown in Figure 2. Similar to panel (A), the underlined protein in each panel was isotopically enriched with 15N tyrosine, while the partner protein was unlabeled and NMR silent. Mixed samples with L51I or I62L isotopically enriched are shown in blue or purple, respectively, while mixed samples with wild-type isotopically enriched are shown in black.
Figure 2—figure supplement 2
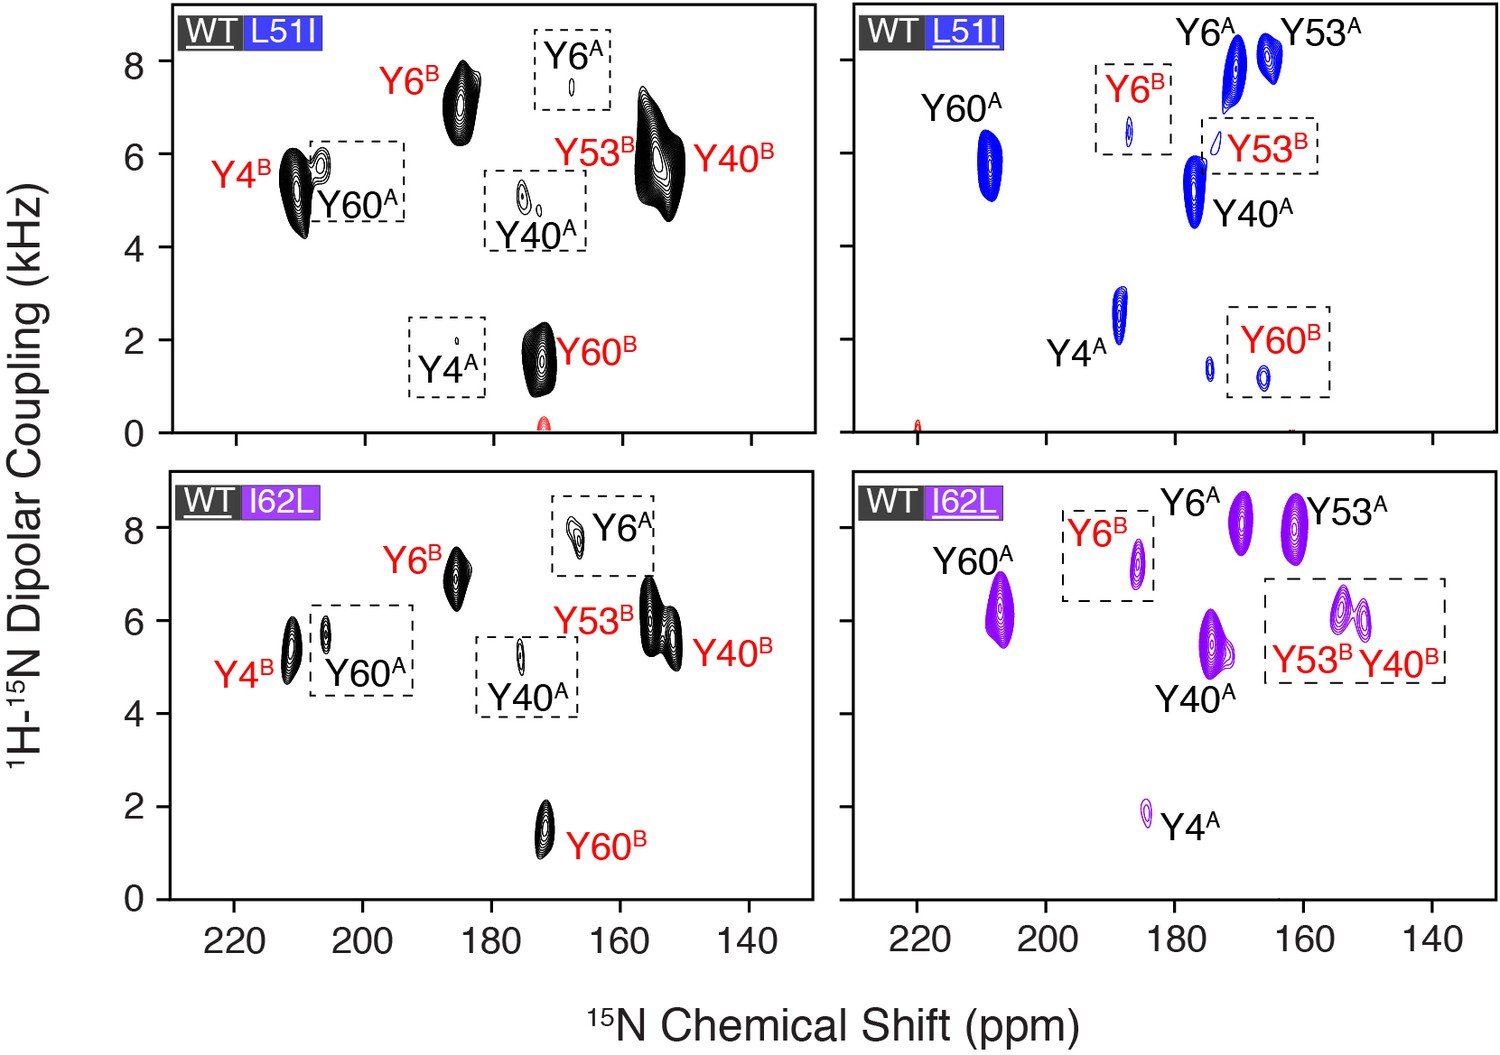
Evidence of homodimer peaks in PISEMA spectra of mixed dimer samples at a lower contour level.
Due to the nature of the mixed dimer experiments, homodimers can form due to the statistical nature of mixing. Spectra shown below are identical to those displayed in Figure 2A with the exception that they are shown at a lower contour level. From these data, it is possible to observe a less intense set of peaks (see dotted boxes). For isotopically labeled wild-type in the mixed samples, these weaker peaks correspond to monomer A signals, while in the mixed samples where L51I or I62L are isotopically enriched, these weaker peaks correspond to monomer B signals.
Figure 3 with 1 supplement
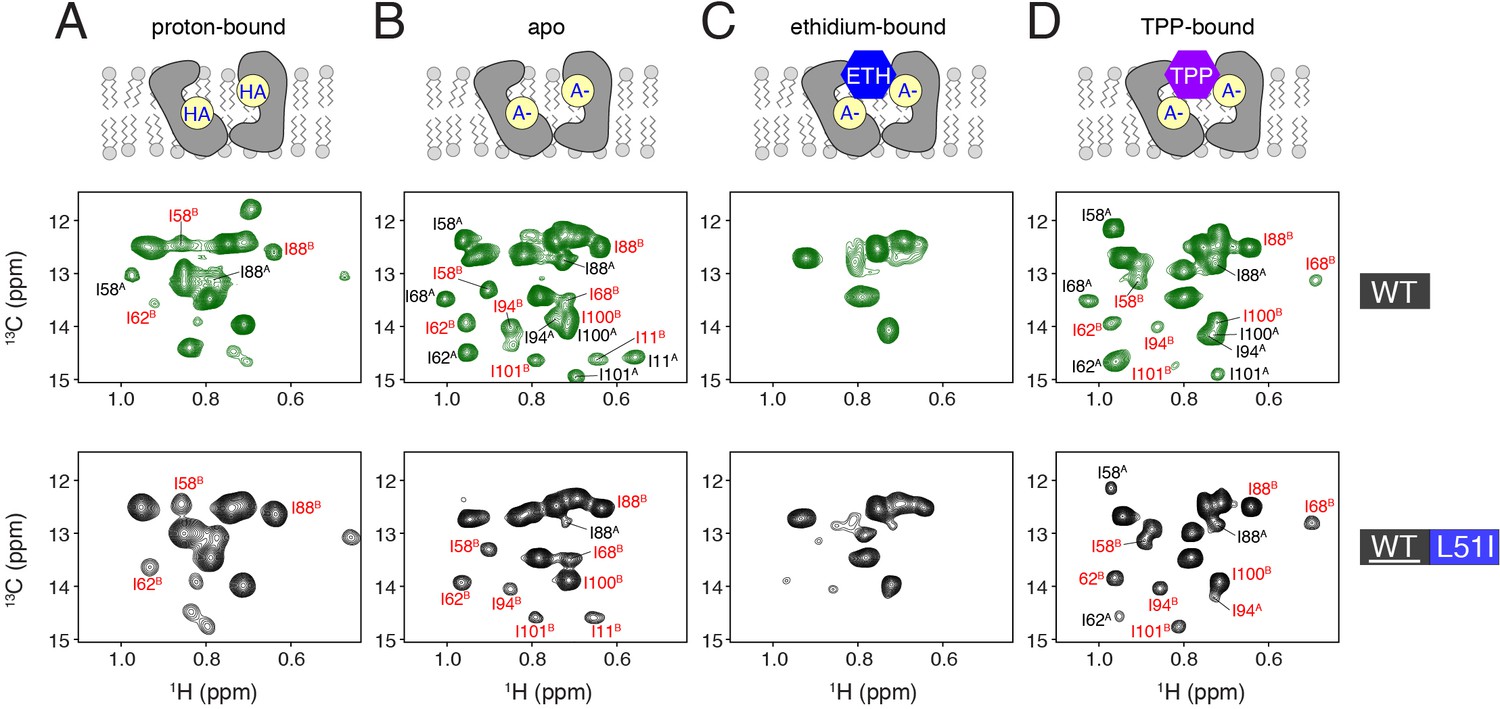
Determination of conformational equilibria among different states within the transport cycle probed with solution NMR.
HMQC spectra of wild-type (middle row, green spectra) or isotopically enriched wild-type mixed with 3-fold excess L51I at natural abundance (bottom row, black spectra). The sample conditions were: (A) proton-bound (pH = 5.6), (B) deprotonated, apo (pH = 9.1), (C) ethidium-bound (pH = 9.1), and (D) tetraphenylphosphonium-bound (pH = 9.1). In each case, the isotopically enriched protein was 13C labeled at the Cδ position of isoleucine. Wild-type spectra serve as a reference since the population between monomers A and B is 50/50. Peaks labeled with red correspond to monomer B peaks, while those in black correspond to monomer A peaks.
Figure 3—figure supplement 1
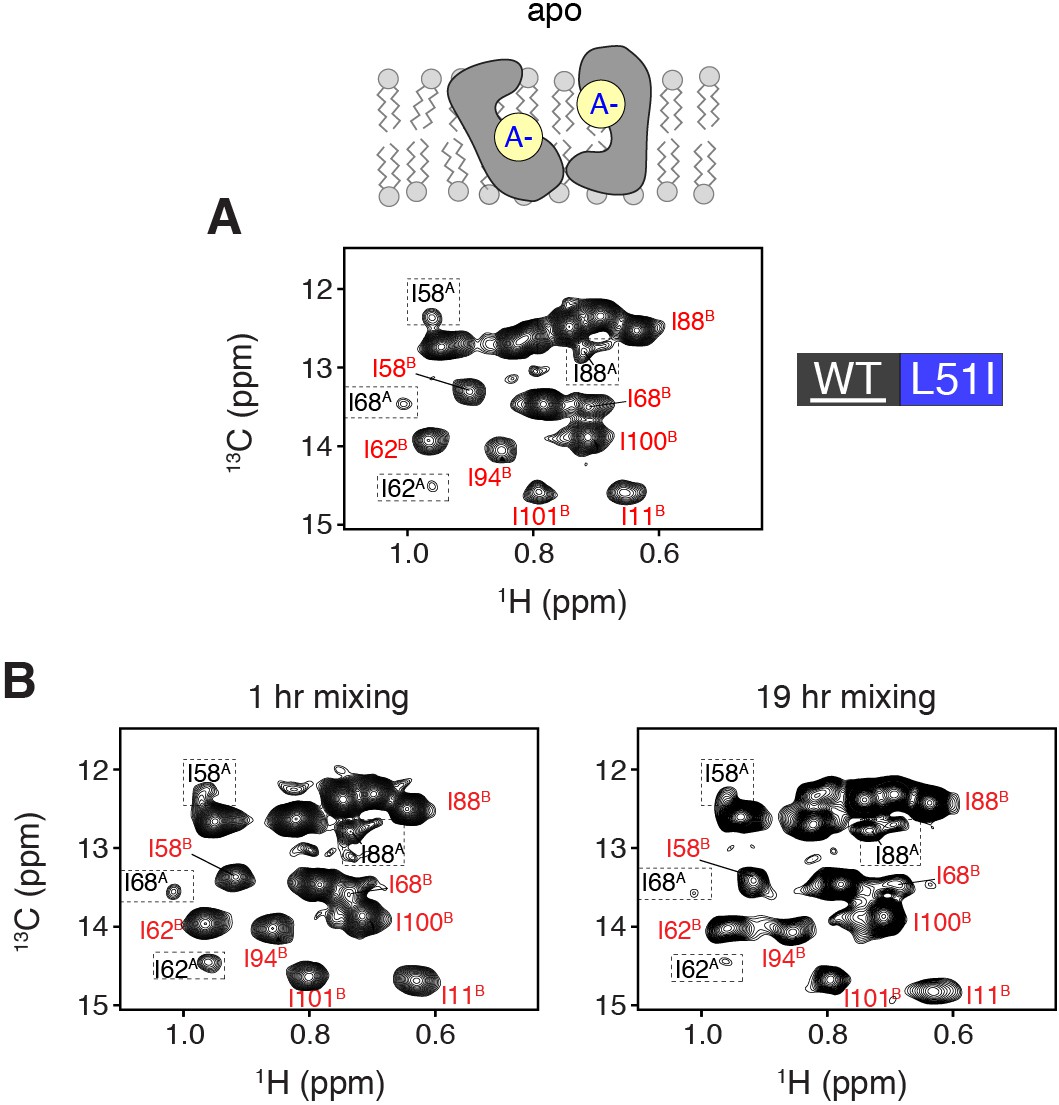
Evidence of homodimer peaks in solution NMR mixed dimer samples at a lower contour level.
(A) HMQC spectra of isotopically enriched wild-type mixed with 3-fold excess L51I at natural abundance. The spectrum is shown for the apo form of EmrE (pH = 9.1) at a lower contour level than that displayed in Figure 3B. At this contour level, it is possible to observe monomer A peaks (see dotted boxes). (B) HMQC spectra of isotopically enriched wild-type EmrE mixed with 3-fold excess L51I at natural abundance in the apo state (pH = 9.1) in isotopic bicelles. The samples were prepared with different incubation times of 1 hr (left) and 19 hr (right) in DDM at 37°C. In each spectrum, the relative peak intensity ratios are similar, which supports that complete mixing of the heterodimer is achieved with the 1 hr incubation time. The equilibrium population of wild-type EmrE to assume monomer B in the heterodimer was calculated at 95% for the 19 hr mixing experiment, which is very similar to the 1 hr incubation time reported in the main text (96%). Note that we observed reduced overall spectral quality in terms of signal intensity and homogeneous peak intensity for the sample incubated for 19 hr in DDM detergent micelles.
Figure 4 with 1 supplement
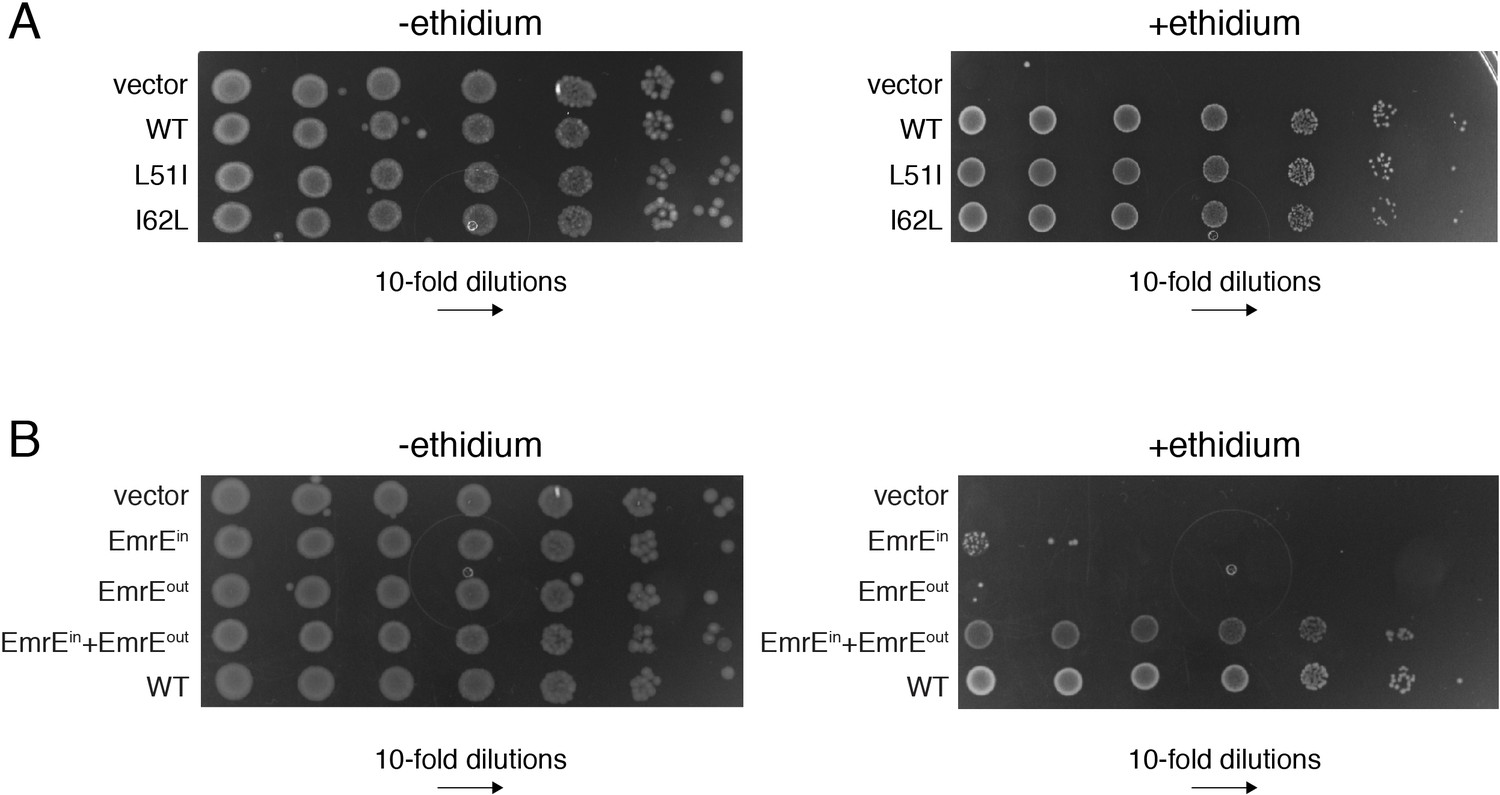
E. coli growth inhibition assays containing plasmids of wild-type EmrE, conservative mutants, and single topology variants of EmrE.
(A) LB agar plates in the absence or presence of ethidium bromide spotted with E. coli containing plasmids corresponding to vector (control), wild-type EmrE, L51I, and I62L. Serial 10-fold dilutions are displayed in each panel from left to right. (B) LB agar plates in the absence or presence of ethidium bromide spotted with E. coli containing plasmids corresponding to vector (control), EmrEin, EmrEout, EmrEin and EmrEout co-expressed, and wild-type EmrE. Serial 10-fold dilutions are displayed in each panel from left to right. A schematic of the constructs and sequences of EmrEin and EmrEout are given in Figure 4—figure supplement 1.
Figure 4—figure supplement 1
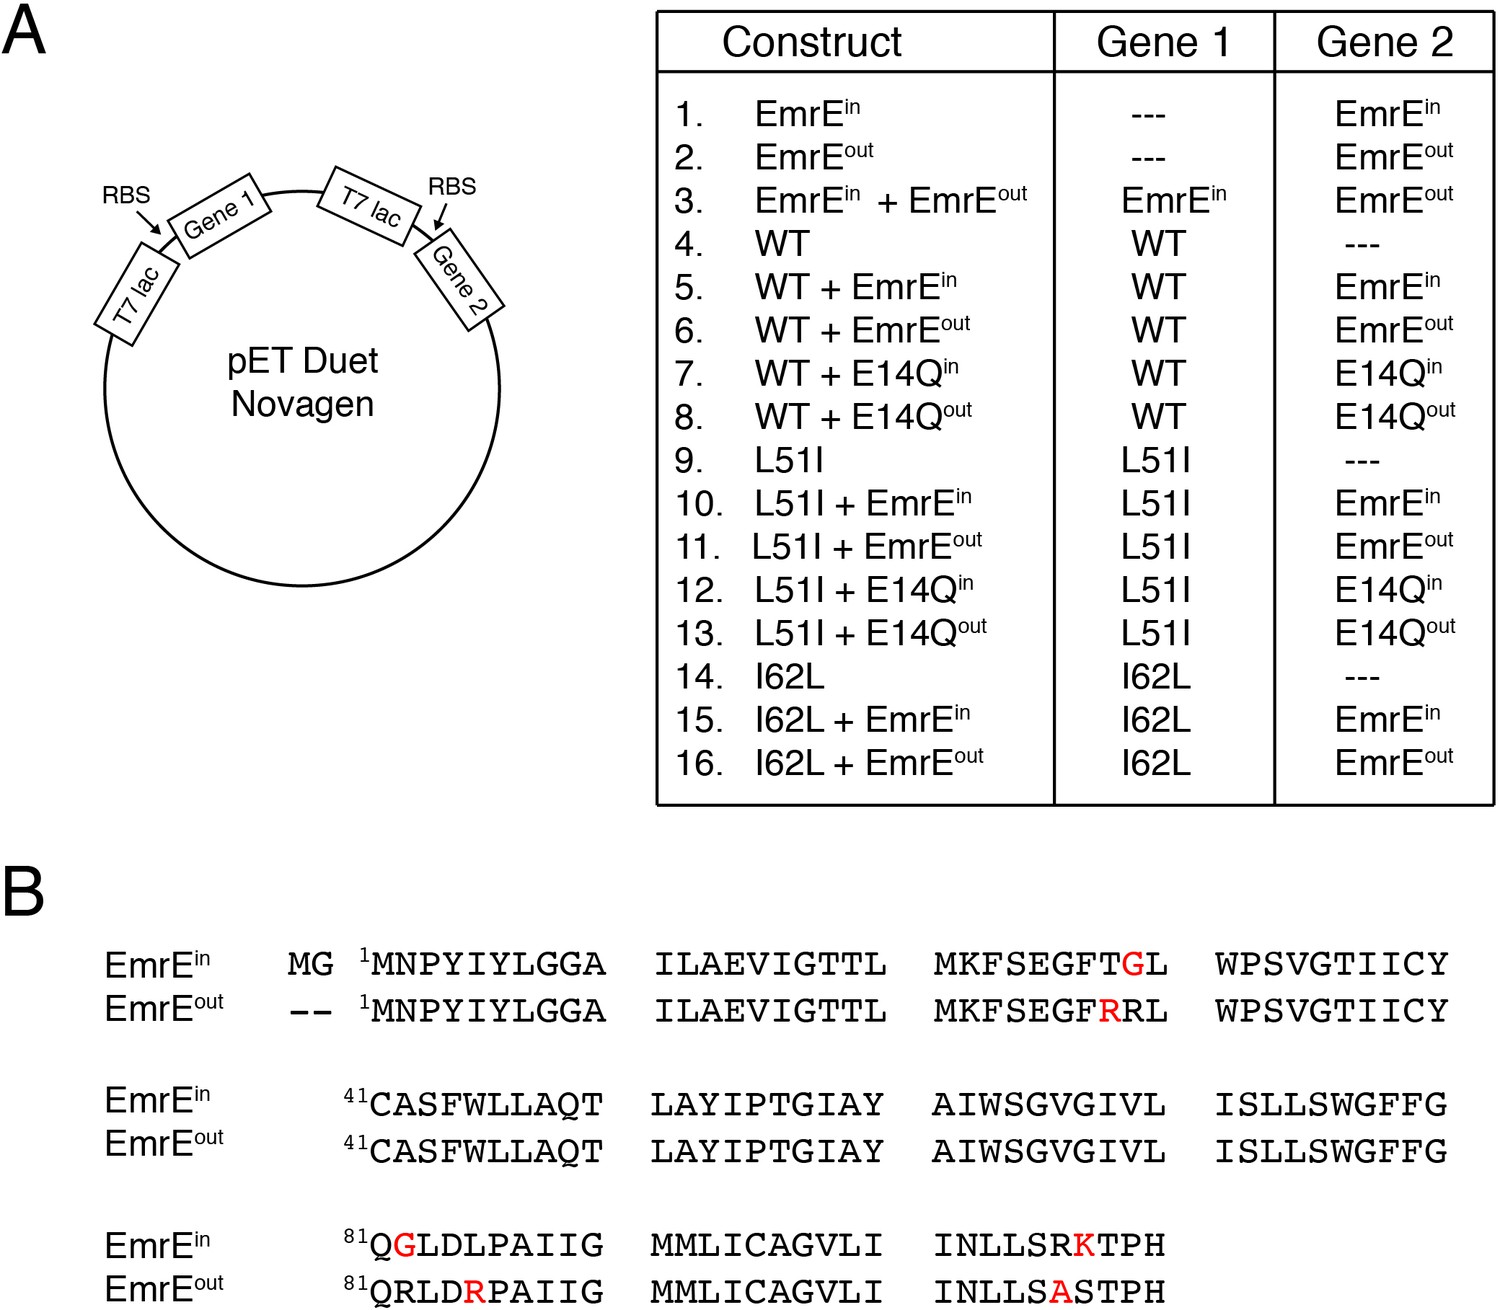
Constructs used for resistance assays.
(A) Schematic depiction of the pET Duet vector (Novagen) used for expression of two genes and a table displaying the different combinations and locations of genes. Note that wild-type, L51I, or I62L genes do not have a topological bias and are able to insert in two different orientations (i.e. dual topology). EmrEin or EmrEout have a single topology where the N- and C-termini face the cytoplasm or periplasm, respectively. E14Qin and E14Qoutcorrespond to an additional E14Q mutation into the EmrEin or EmrEout construct, respectively. (B) Primary sequence of EmrEin and EmrEout showing mutations in red required to create single topology variants of EmrE. The mutations were similar to previously published work (Rapp et al., 2007).
Figure 5 with 2 supplements
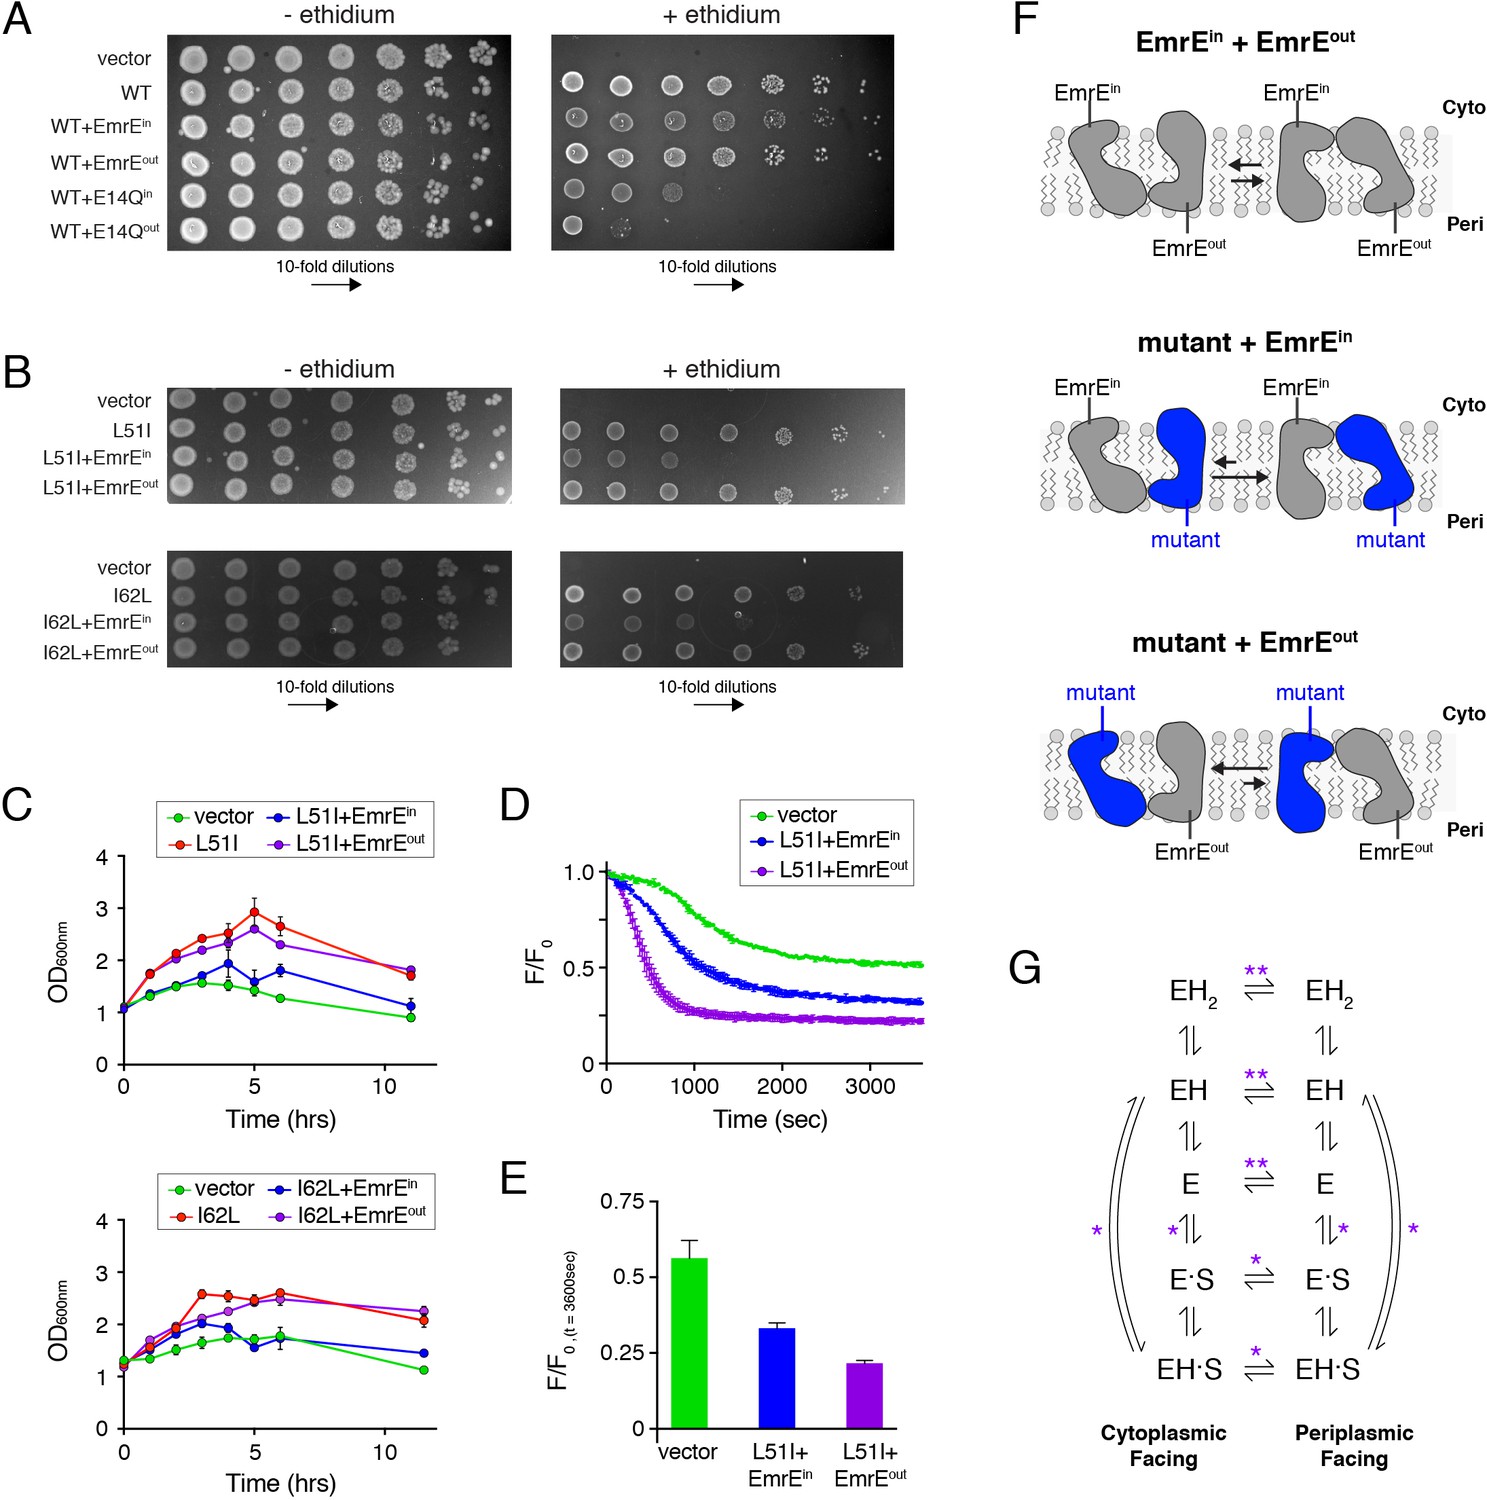
Assays to determine the biological significance of conformational bias observed in NMR experiments.
(A) LB agar plates in the absence or presence of ethidium bromide spotted with E. coli containing plasmids corresponding to vector (control), wild-type EmrE, and combinations of wild-type EmrE co-expressed with EmrEin, EmrEout, E14Qin, or E14Qin. Serial 10-fold dilutions are displayed in each panel from left to right. (B) LB agar plates in the absence or presence of ethidium bromide spotted with E. coli containing plasmids corresponding to vector (control), L51I, I62L, and combinations of L51I or I62L co-expressed with EmrEin or EmrEout. Serial 10-fold dilutions are displayed in each panel from left to right. (C) Resistance assays in liquid media in the presence of ethidium bromide (240 μg/mL). E. coli cultures containing the indicated plasmid were grown to an OD600 of ~1.0 and treated with ethidium bromide. The point of ethidium addition represents time = 0. The error bars reflect the standard deviation from three trials. Error bars not observed are smaller than the points. (D) Ethidium efflux assays with E. coli transformed with plasmids corresponding to vector (control) and L51I co-expressed with EmrEin or EmrEout. The normalized ethidium fluorescence is plotted as a function of time following the addition of glucose at time zero. (E) The normalized fluorescence value from panel D at 3600 s. (F) Schematic depiction skewed conformational equilibria for the different heterodimers as indicated within the panel. (G) EmrE transport model proposed by Robinson et al. (2017). ‘E’ refers to the EmrE dimer, ‘H’ is proton, and ‘S’ is the drug substrate. The states on the left are cytoplasmic-facing, while those on the right are periplasmic-facing. The double asterisks indicate equilibria most influenced by the heterodimers displaying conformational bias (drug-free states), while a single asterisk indicates equilibria influenced to a minor extent.
Figure 5—figure supplement 1
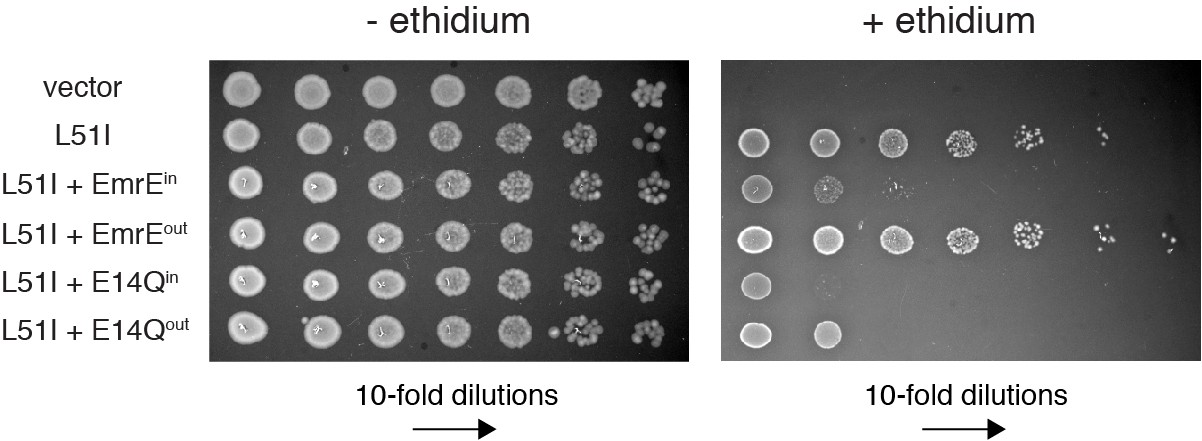
Resistance assays to test the association of EmrEin and EmrEout with L51I.
LB agar plates in the absence or presence of ethidium bromide spotted with E. coli containing plasmids corresponding to vector (control), L51I, and combinations of L51I co-expressed with EmrEin, EmrEout, E14Qin, or E14Qin. Serial 10-fold dilutions are displayed in each panel from left to right. The experiments with L51I co-expressed with EmrEin or EmrEout show the same results as those in Figure 5B, where a reduced phenotype of L51I with EmrEin is observed relative to L51I with EmrEout. Controls where L51I is co-expressed with E14Qin or E14Qout show a significantly reduced phenotype, which further confirms the presence of heterodimer formation in the cell membrane.
Figure 5—figure supplement 2
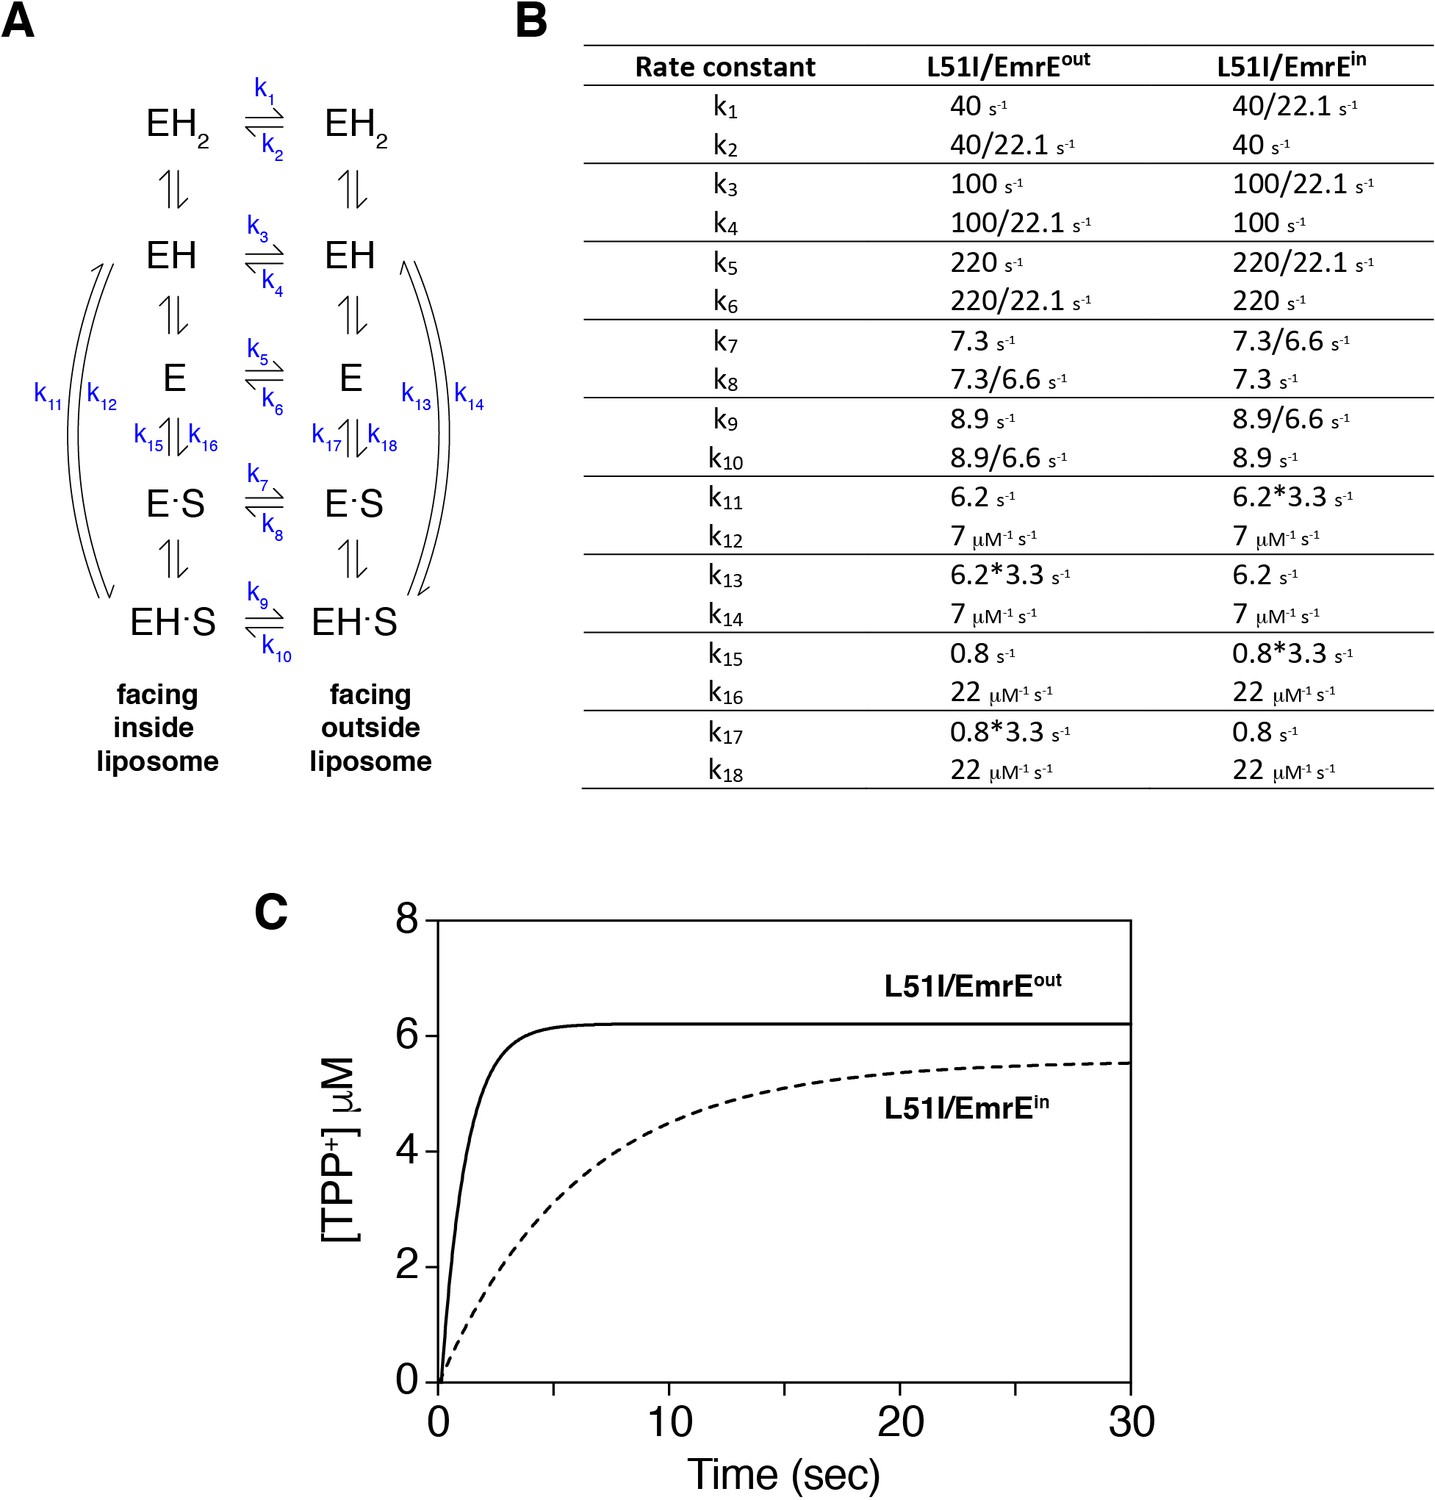
Numerical simulation of drug uptake into vesicles by heterodimers of EmrE and L51I.
The simulation was performed in an identical manner as that described by Robinson et al. (2017) using the script provided in their supporting information and the software program Berkeley Madonna (version 9.1.18). The simulations calculated the concentration of drug (tetraphenylphosphonium, TPP+) accumulated into liposomes as a function of time by solving a series of differential equations. The liposomes were set up to have an internal pH of 6.0 and an external pH of 8.0 (ΔpH = 2). The starting concentrations of tetraphenylphosphonium outside and inside the vesicles were 50 nM and 0 nM, respectively. (A) Kinetic model proposed by Robinson et al., where E refers to EmrE, S is drug substrate, and H is proton. The states on the left side are open to the inside of the liposome, while the states on the right side are open to the outside of the liposome. (B) Kinetic parameters that are changed from those used by Robinson et al. These pertain to the rate constants of the inward-open to outward-open and inward-open to outward-open transitions for drug-free and drug-bound states and the drug off rates on the inside or outside of the liposome. The values of 22.1 and 6.6 correspond to population differences in the heterodimer, as described in the main text. The choice to divide rate constants k1, k2, k3, k4, k5, k6, k7, k8, k9, or k10 was based on NMR experiments showing that L51I had a slower exchange rate than wild-type EmrE (data not shown). Multiplication of k11, k13, k15, or k17 (drug substrate off-rates) or division of k12, k14, k16, or k18 (drug substrate on-rates) did not have a dramatic impact on the simulation results. Only the multiplied values are displayed. Note that this modification was needed since the heterodimer populations were different between the drug-bound and drug-free states. (C) Simulation results that mimic mutant/EmrEout (solid line) and mutant/EmrEin heterodimers (dotted line) using the rate constants displayed in panel B.
Additional files
-
Transparent reporting form
- https://doi.org/10.7554/eLife.48909.016
Download links
A two-part list of links to download the article, or parts of the article, in various formats.
Downloads (link to download the article as PDF)
Open citations (links to open the citations from this article in various online reference manager services)
Cite this article (links to download the citations from this article in formats compatible with various reference manager tools)
Inducing conformational preference of the membrane protein transporter EmrE through conservative mutations
eLife 8:e48909.
https://doi.org/10.7554/eLife.48909


