Siglec1-expressing subcapsular sinus macrophages provide soil for melanoma lymph node metastasis
- National Cancer Center, Republic of Korea
Figures
Figure 1 with 5 supplements
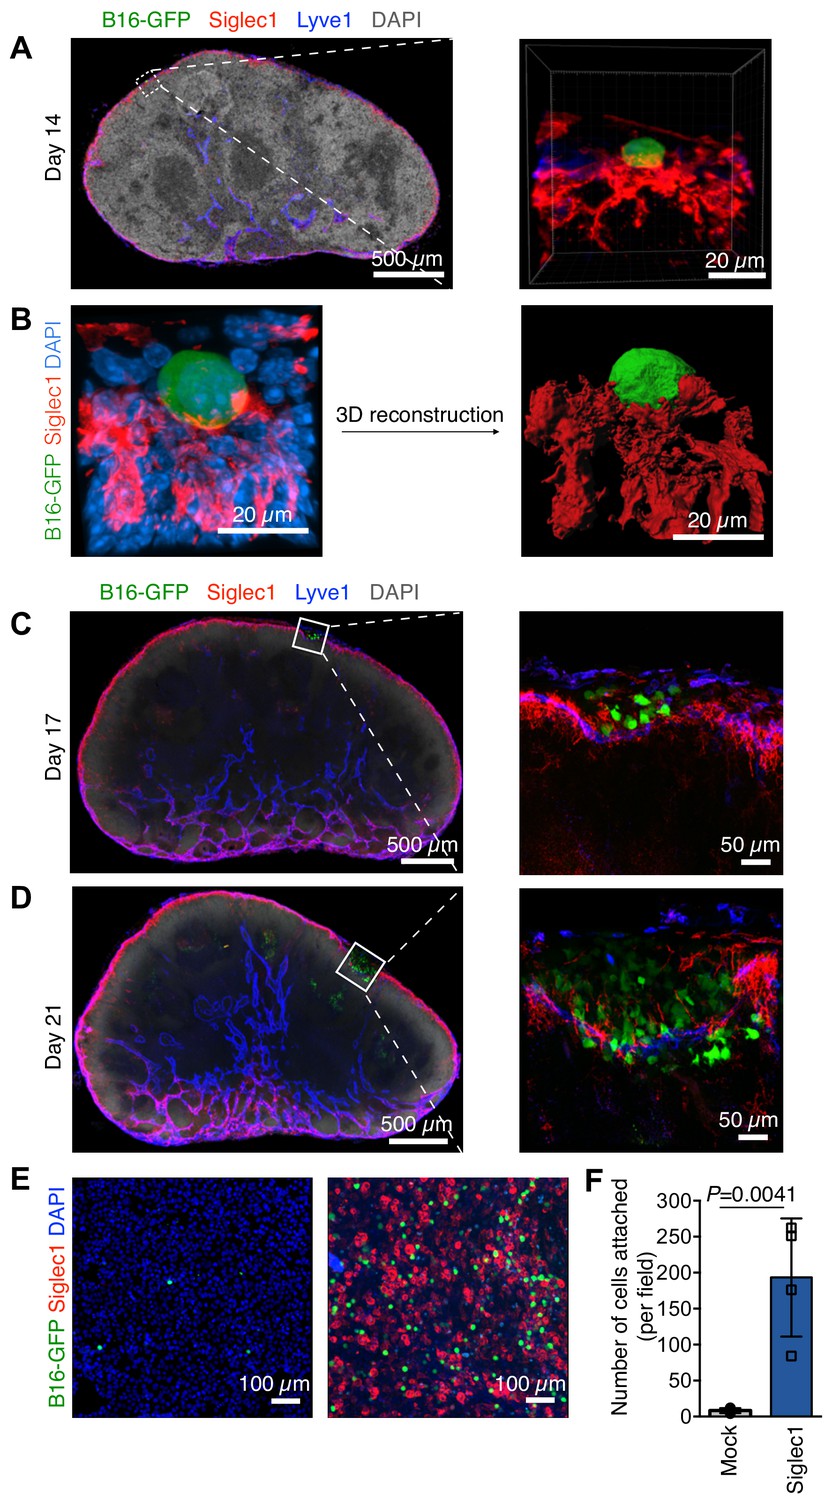
Steps of lymph node (LN) metastatic colonization.
B6 mice were implanted with B16-GFP cancer cells in footpads. Representative laser scanning microscopy images of cryosectioned sentinel popliteal LNs (pLNs) on indicated days are shown. (A) Image taken at 14 days post-inoculation; pioneer metastatic cells (green) were evident in the subcapsular sinus (SCS) of pLN. Here, metastatic cell could be seen in close contact with Siglec1+ SCS macrophages (red) in the LN SCS lined by lymphatic endothelial cells (blue). (B) A laser scanning microscope image of early metastatic B16F10 cell (green) in close contact with LN SCS macrophages (Siglec1, red; nucleus, blue) and its 3D reconstructed image. (C) Metastatic cells resumed proliferation and formed microscopic metastatic foci within the LN SCS. (D) Metastatic foci grew and disrupted the SCS macrophage–lymphatic endothelial cell lining and entered the LN cortex. Data representative of four biologically independent experiments. (E, F) Adhesion assays of B16-GFP cells on monolayers of HEK293T or Siglec-1 expressing HEK293T cells. (E) Representative photomicrographs of adherent B16-GFP cells on the monolayer of indicated HEK293T cells. (F) Quantification of the number of adherent B16-GFP cells on monolayers. Data are ±s.d.; n = 4 biologically independent experiments. P-value was calculated by two-tailed, unpaired t-test.
-
Figure 1—source data 1
This spreadsheet contains the source data for Figure 1F.
- https://cdn.elifesciences.org/articles/48916/elife-48916-fig1-data1-v1.xlsx
Figure 1—figure supplement 1
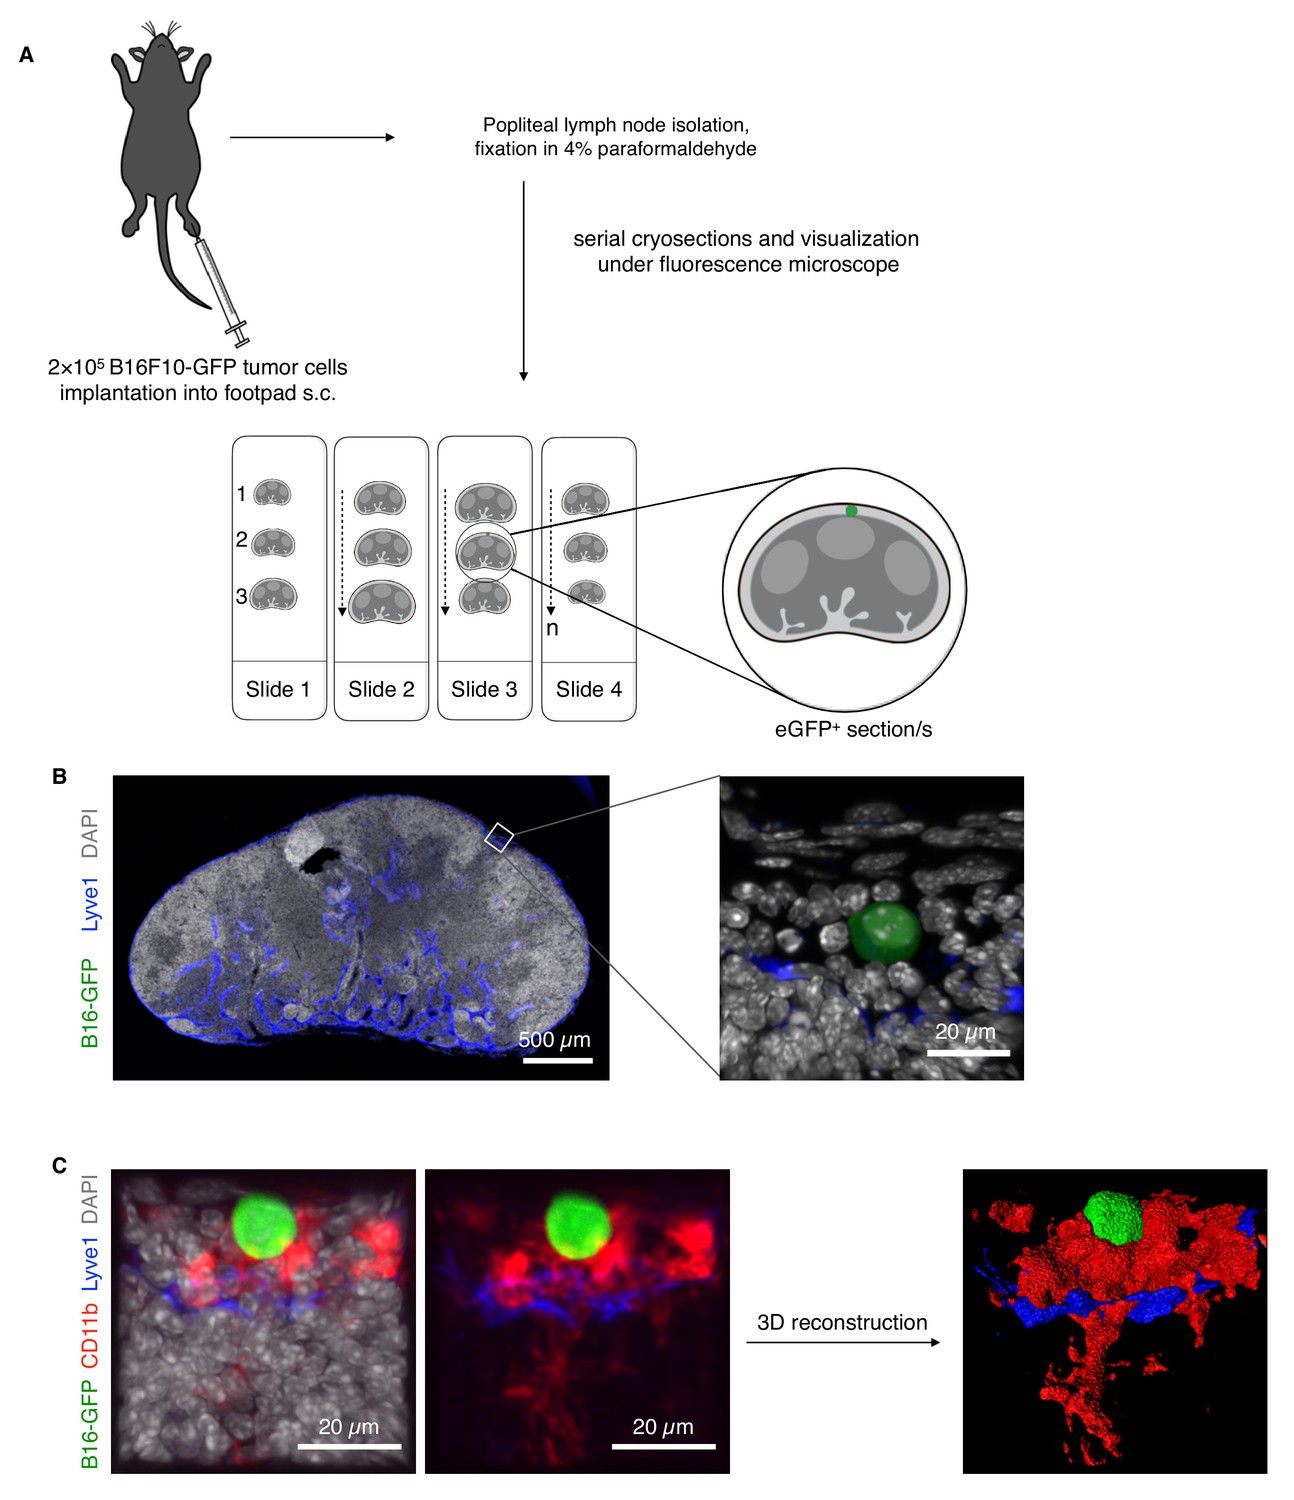
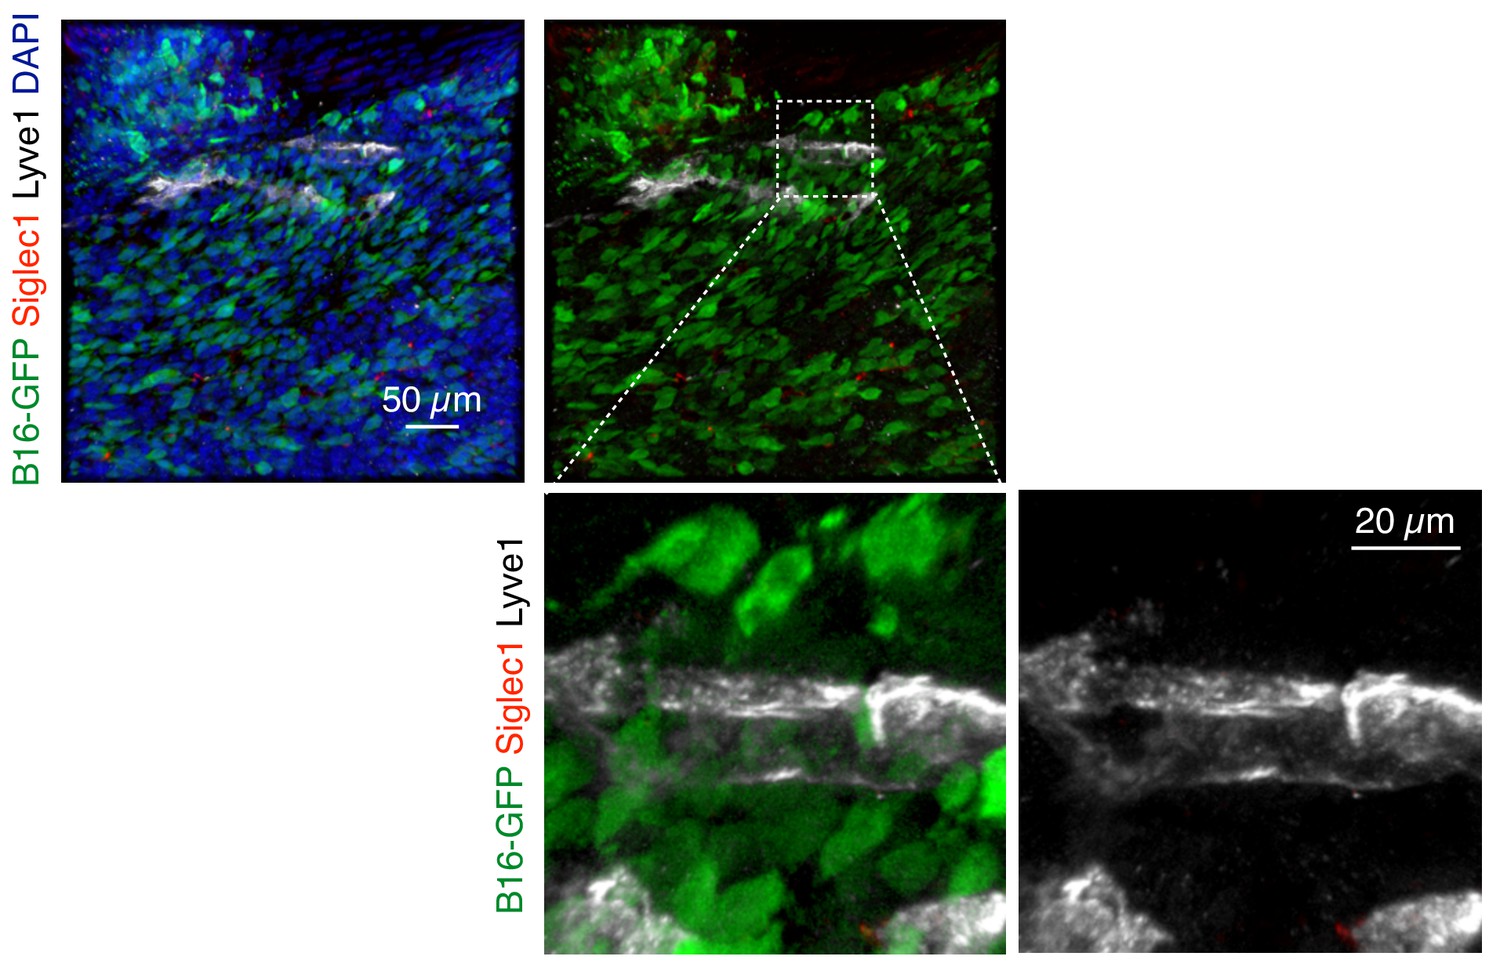
Approach for visualization of pioneer metastatic cells and early metastatic events in LNs.
(A) Schema to study early metastatic B16-GFP cells in LNs. A total of 2 × 10⁵ B16-GFP cells were implanted into the footpads of mice and sentinel pLNs were excised on different days. Then 4% formaldehyde-fixed pLNs were serially sectioned with a cryostat and observed by fluorescence microscopy to locate GFP+ cells. (B) Pioneer metastatic cells can be seen in the LN SCS at day 14. A low magnification tile scan of a whole metastatic LN showing GFP+ B16F10 melanoma cells (green) in SCS lined by Lyve1+ lymphatic endothelial cells (blue). High magnification image of the same pioneer metastasis cell in Lyve1+ sinus. A DAPI+ nucleus (white) can be seen in GFP+ metastatic melanoma cells. (C) Representative image of pioneer metastatic cells (green) in SCS stained for CD11b (SCS macrophages, red), Lyve1 (SCS lymphatic endothelial cells, blue), and DAPI (nuclei, white) to define SCS macrophage–tumor cell interactions and its 3D reconstructed image (n = 6).
Figure 1—figure supplement 2
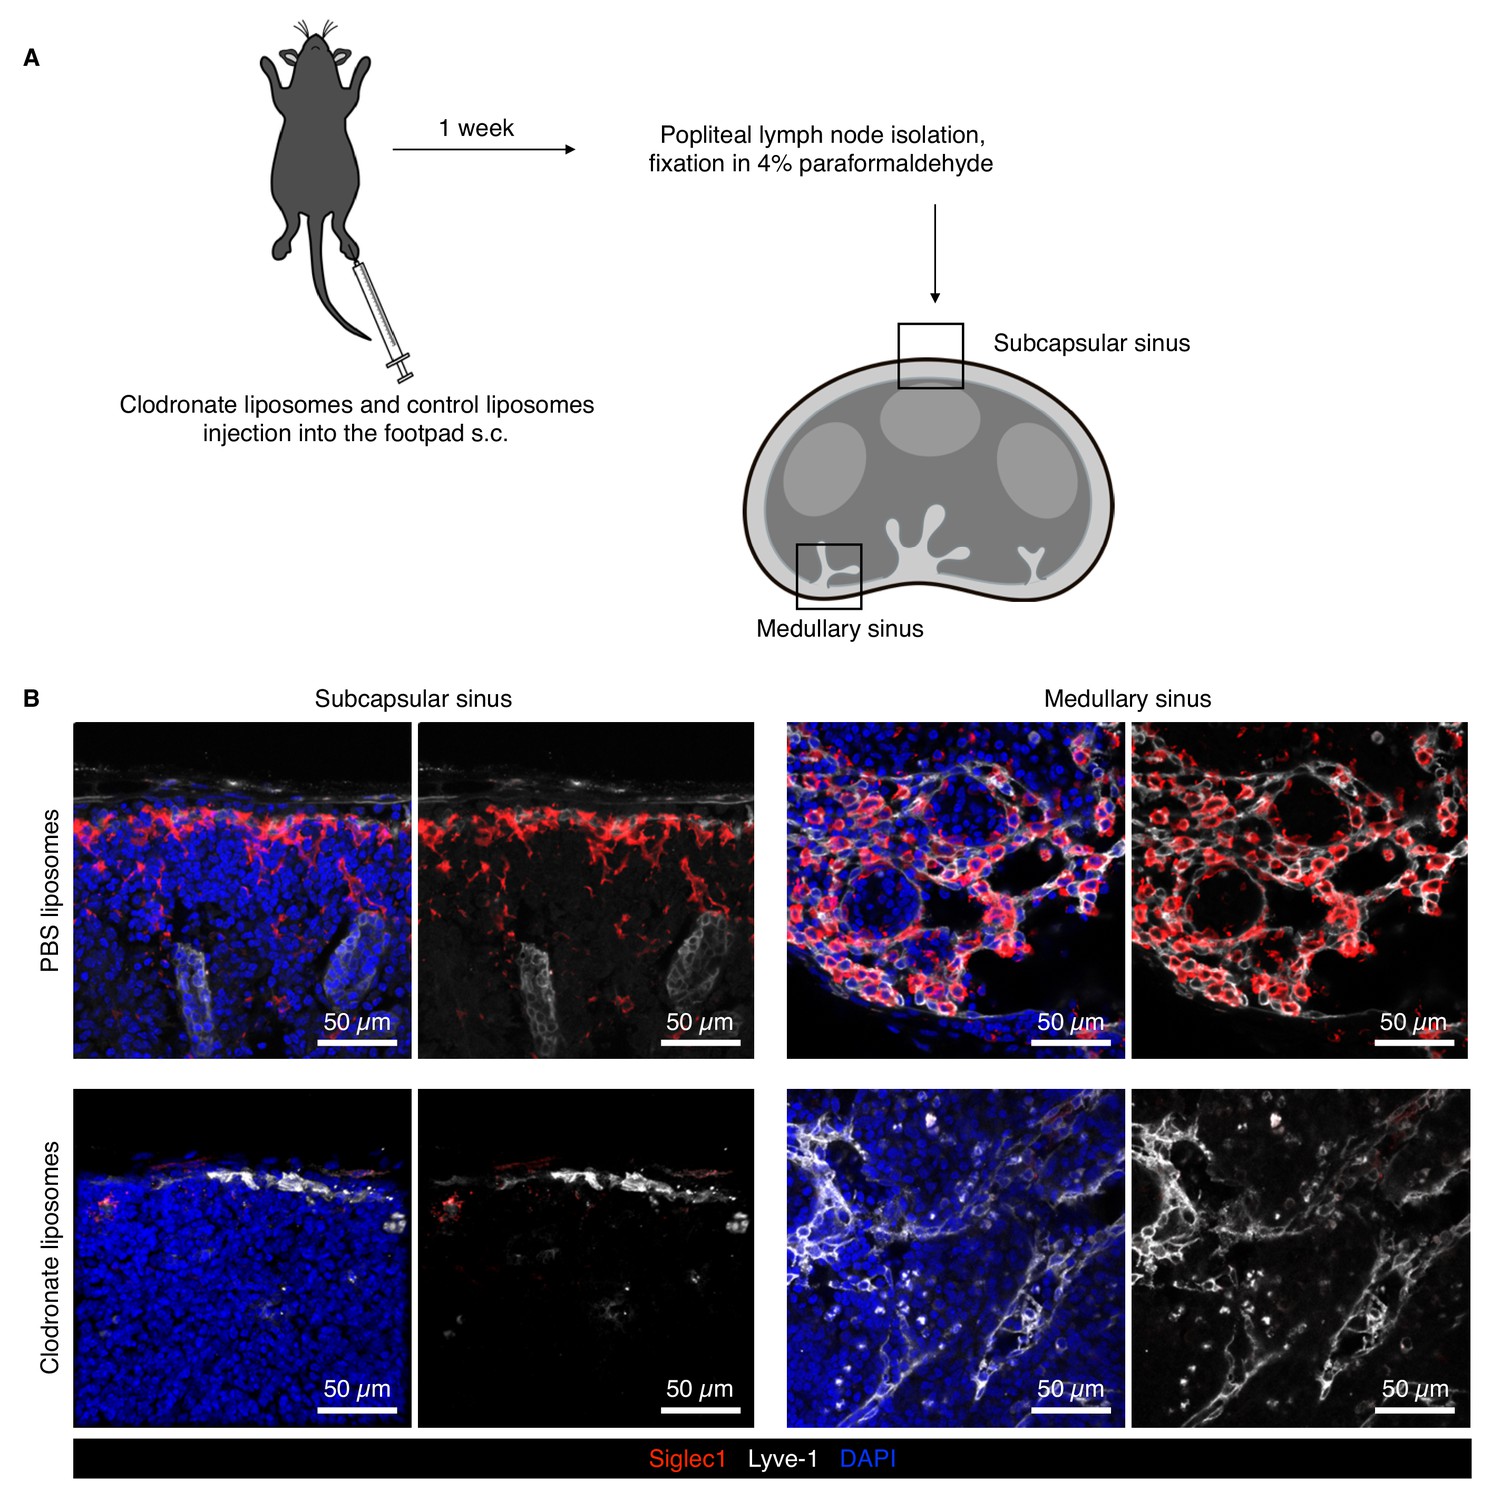
Siglec1 is expressed on the macrophages on the floor of the LN SCS and medullary region.
(A) Schematic of the LN macrophage depletion experiment to confirm that Siglec1 was expressed on LN macrophages. (B) Confocal micrograph of popliteal LNs of PBS liposomes and animals that had received clodronate liposome footpad injection 7 days earlier. Clodronate treatment depleted the Siglec1-expressing macrophages, thus no Siglec1-positive macrophages could be seen in the SCS and medullary sinus. Note the complete absence of Siglec1 on Lyve1+ SCS and medullary lymphatic endothelial cells. Representative data from two independent experiments.
Figure 1—figure supplement 3
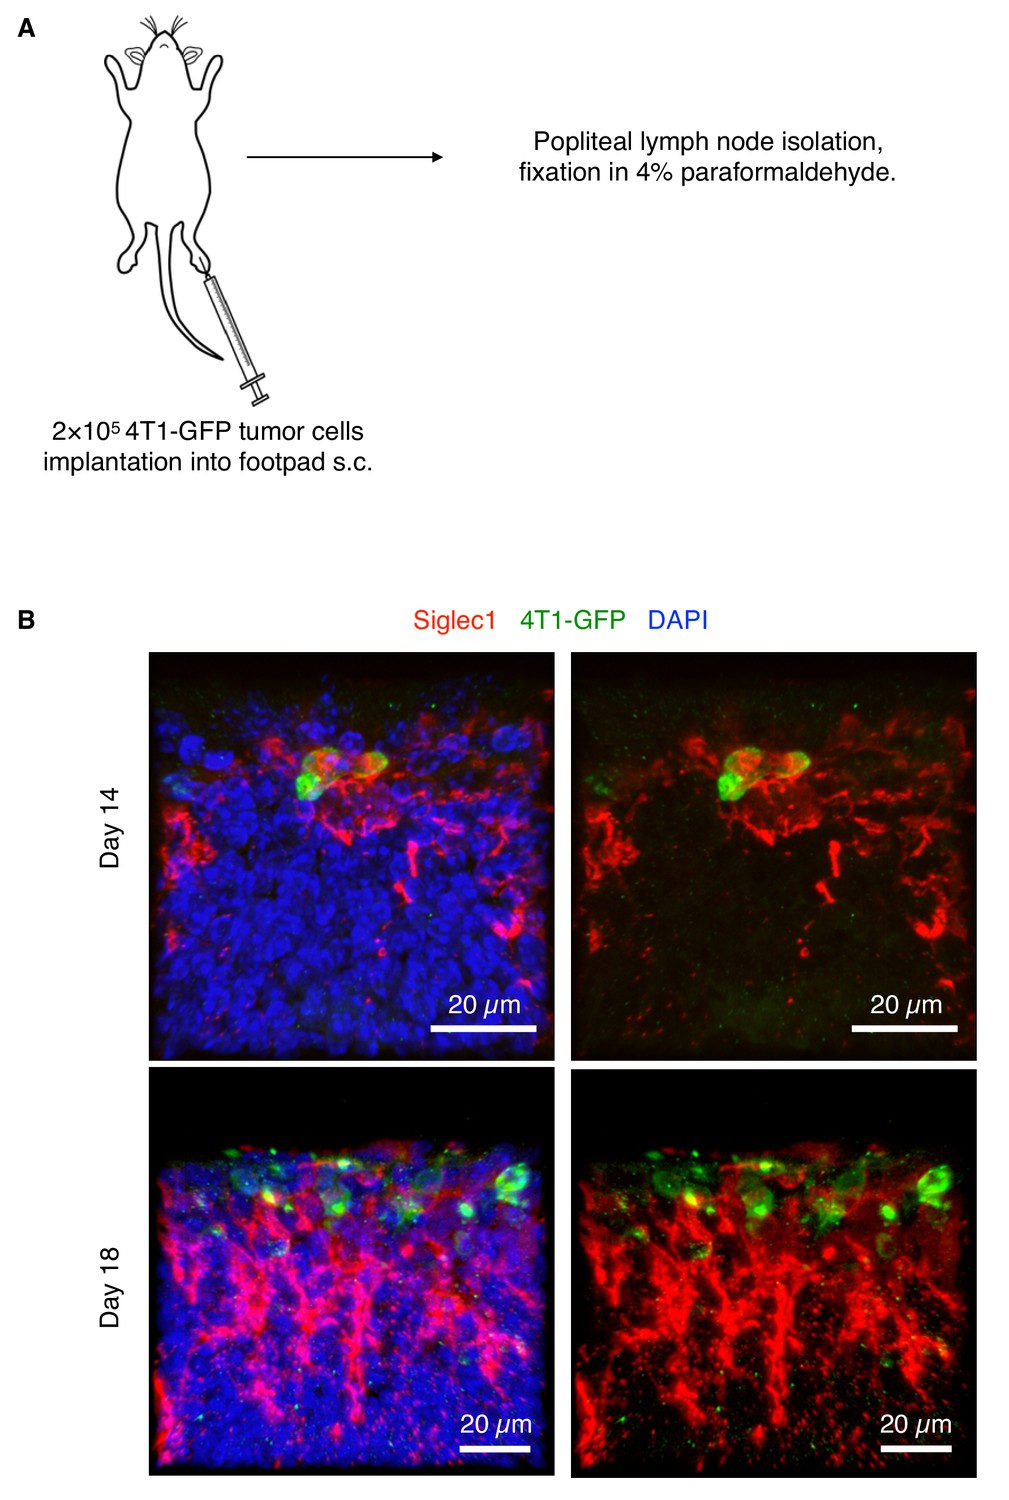
4T1 mouse breast cancer cells use LN SCS macrophages to find footholds during LN metastasis.
(A) Schematic of experiment. EGFP-expressing 4T1 cells were implanted into BALB/c mouse footpads and popliteal LNs were isolated from day 14 for confocal imaging. The procedure was the same as described in Figure 1—figure supplement 1A. (B) GFP+ 4T1 cells (green) can be seen in close contact with LN SCS macrophages (red) at day 14. A growing LN metastatic colony of 4T1-GFP cells can be seen at day 18 growing in close contact with SCS macrophages. GFP signals in 4T1-GFP cells were amplified using anti-GFP antibody. Representative images from two independent experiments.
Figure 1—figure supplement 4
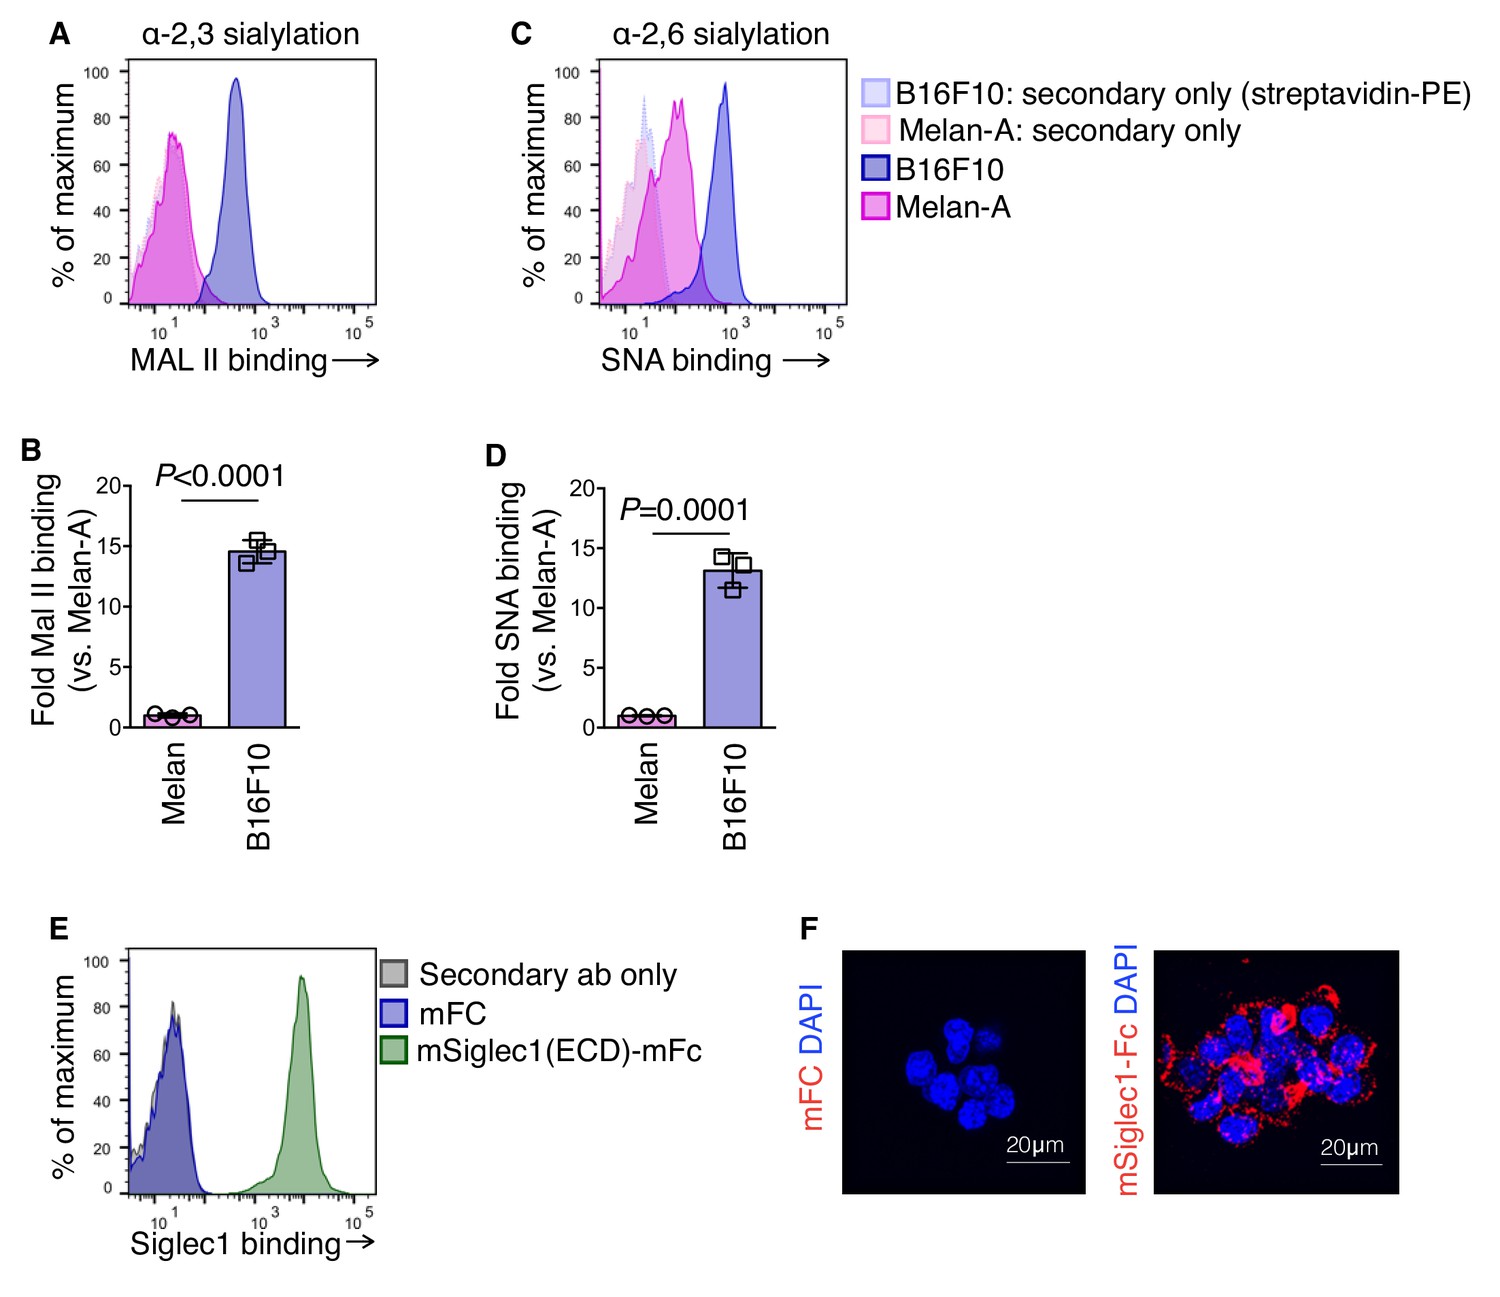
Siglec1 binds to hypersialylated cell surface proteins of mouse melanoma cells.
(A–D) Lectin FACS staining showing hypersialylation of cell surface proteins in B16F10. Non-tumorigenic mouse melanocytes melan-A cells (pink) and mouse melanoma B16F10 cells (blue) were stained with α−2,3 sialylation-specific biotinylated Maackia amurensis lectin II (MAL II; A, B) and α−2,6 sialylation-specific biotinylated Sambucus nigra lectin (SNA; C, D), followed by detection with streptavidin-PE. Data are mean ±s.d.; n = 3 biologically independent experiments. P-value was calculated by two-tailed, unpaired t-test. (E, F) Purified recombinant mouse Siglec1(ECD)-mFC binding to B16F10 cells confirmed by FACS (E) and laser scanning confocal microscopy (F).
-
Figure 1—figure supplement 4—source data 1
This spreadsheet contains the source data for figure supplement 4.
- https://cdn.elifesciences.org/articles/48916/elife-48916-fig1-figsupp4-data1-v1.xlsx
Figure 1—figure supplement 5
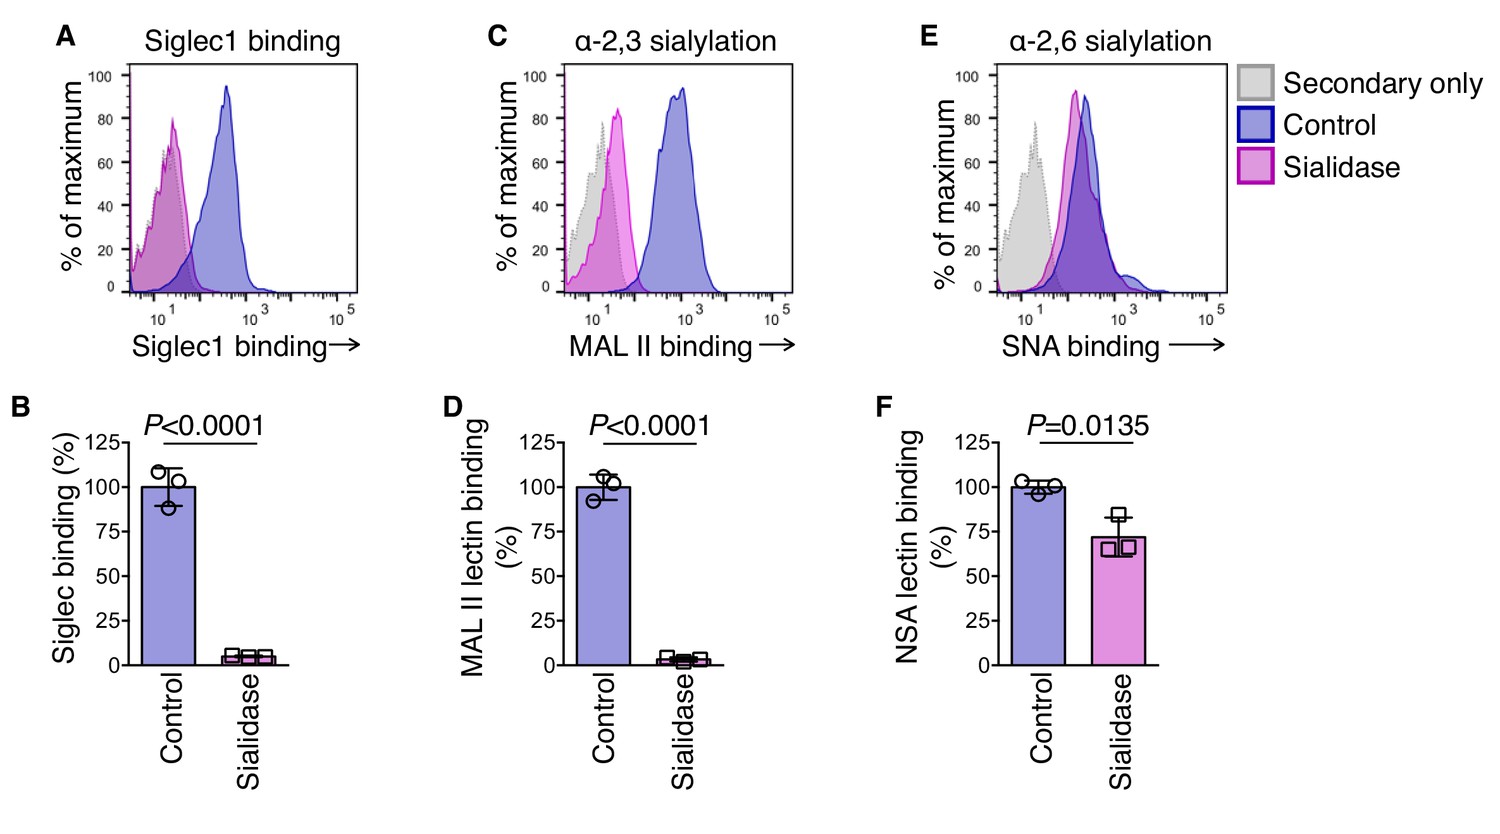
Siglec1 binds to mouse melanoma cells in an α−2,3 sialylation-specific manner.
(A-F) Effect of sialidase treatment on cell surface binding of Siglec1 and sialylation in B16F10. Cells were treated with 0.5 U/ml sialidase in RPMI 1640 medium for 1 hr and cells were stained for mSiglec1 (A, B), MAL II (C, D), and SNA lectins (E, F). Data are mean ±s.d.; n = 3 biologically independent experiments. P-value was calculated by two-tailed, unpaired t-test.
-
Figure 1—figure supplement 5—source data 1
This spreadsheet contains the source data for figure supplement 5.
- https://cdn.elifesciences.org/articles/48916/elife-48916-fig1-figsupp5-data1-v1.xlsx
Figure 2 with 2 supplements

Siglec1 on SCS macrophages provides growth support to metastatic cells.
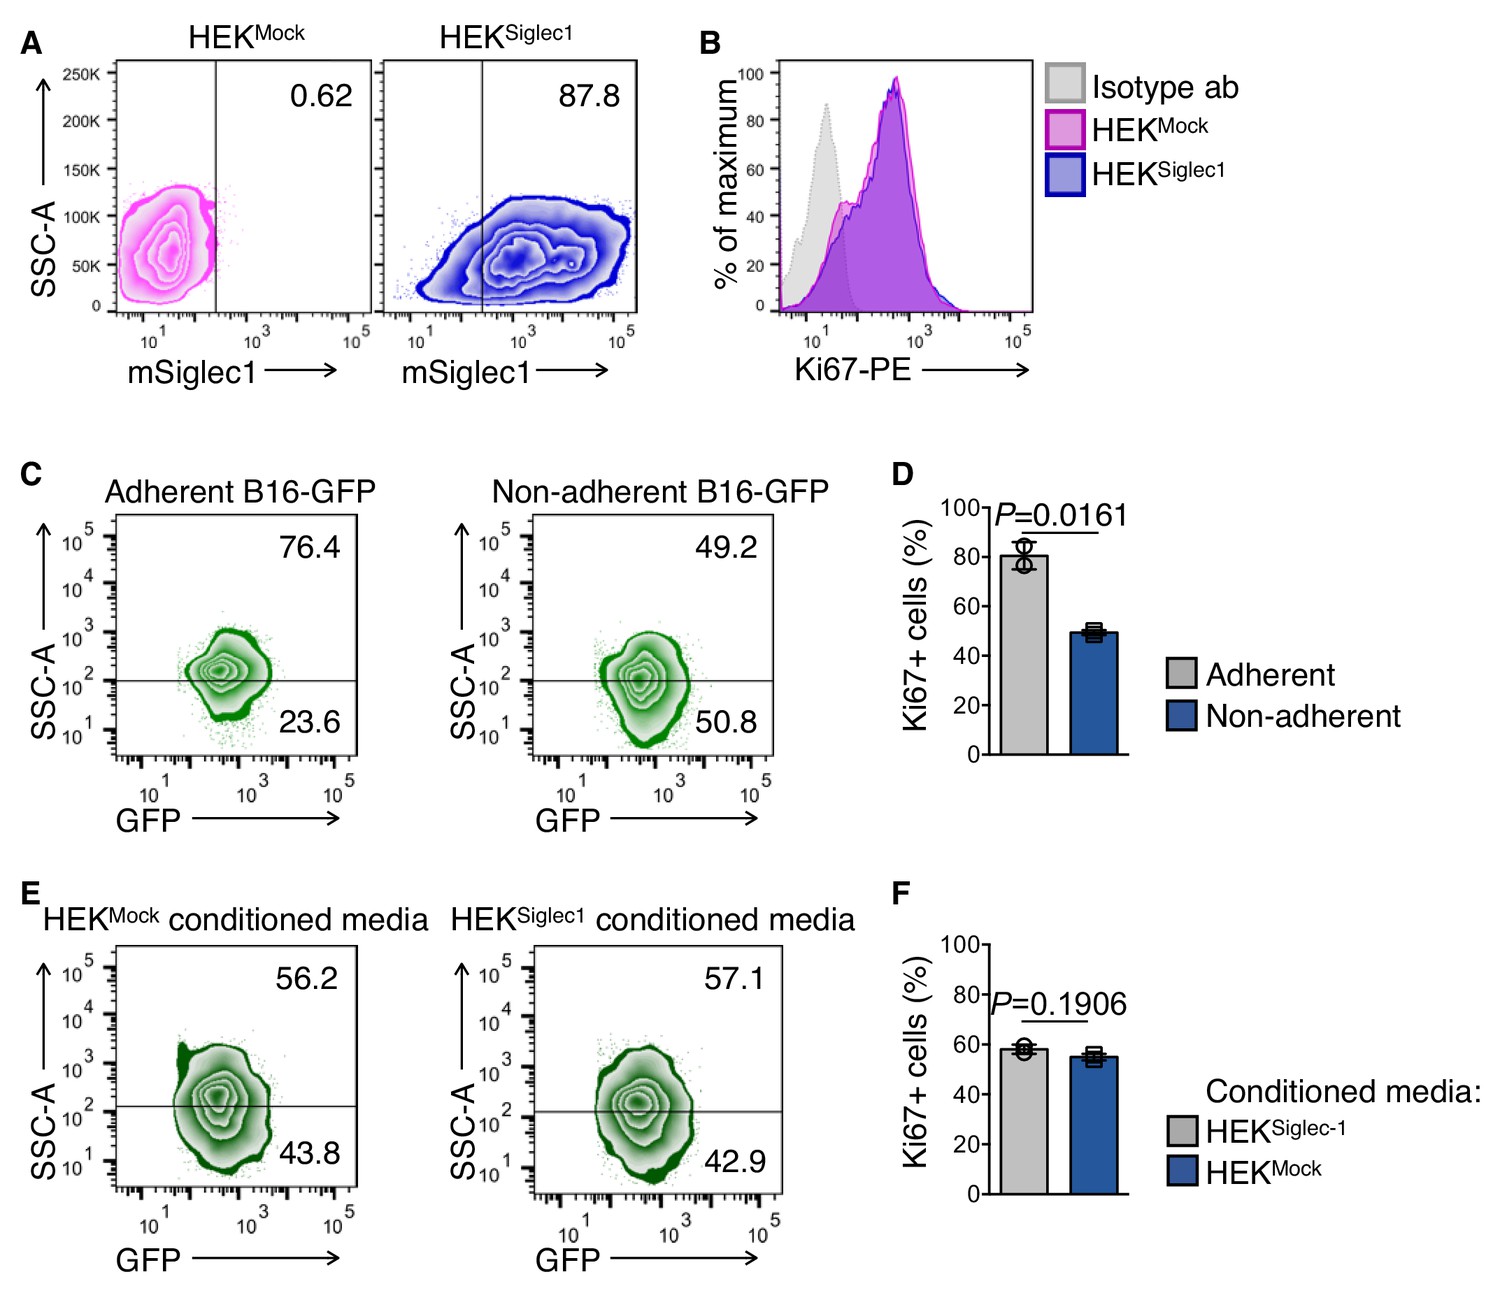
(A–D) Apoptosis (cleaved caspase-3, white; A, B) and proliferation (Ki67, white; C, D) in newly deposited metastatic cells in the LN SCS. Pioneer metastatic cells were in a non-apoptotic non-proliferative state when they landed in the SCS and resumed growth after arrest by SCS macrophages. Data representative of four biologically independent experiments. (E) Schematic of co-culture experimental procedure. HEK293T cells were transfected with empty mammalian expression plasmid or mSiglec1-expressing plasmid. Cells were cultured for 3 days before use in co-culture experiments with B16-GFP cells. (F, G) Proliferation of B16-GFP cells measured by Ki67 expression after 18 hr co-culture with HEKMock or HEKSiglec1 cells (n = 4 independent experiments, P-value by two-tailed, unpaired t-test). (H, I) Apoptosis in B16-GFP cells after 18 hr co-culture with HEKMock or HEKSiglec1 cells measured by Annexin V staining (n = 4 independent experiments, P-value by two-tailed, unpaired t-test). (J–M) Intracellular Phosflow staining to access phosphorylated AKT (pAKT; J, K) and phosphorylated ERK1/2 (pERK; L, M) levels in B16-GFP cells after 18 hr co-culture with HEKMock or HEKSiglec1 cells. Bar graphs represent fold change in phosphorylation over B16-GFP co-cultured with HEKMock (n = 3 independent experiments; P-value was calculated by two-tailed, unpaired t-test). CC3, cleaved caspase-3; meta, metastasis.
-
Figure 2—source data 1
This spreadsheet contains the source data for Figure 2.
- https://cdn.elifesciences.org/articles/48916/elife-48916-fig2-data1-v1.xlsx
Figure 2—figure supplement 1
HEKMock and HEKSiglec1 cells.
(A) HEK293T cells at 70–80% confluency were transfected with pd18 mammalian cell expression plasmid expressing full-length mouse Siglec1 cDNA; empty plasmid was used as a mock control. Cell culture medium was replaced with CDM293 (supplemented with l-glutamine) 6 hr after transfection and cells were further cultured for 3 days before assessing Siglec1 expression. (B) Ki67 levels in HEKMock and HEKSiglec1. After 3 days of culture, as described in (A), cells were fixed in Cytofix fixation buffer for 10 min at 37°C. After washing twice with PBS, cells were permeabilized in 0.1% Triton X-100 in PBS for 5 min. Cells were washed and stained with PE-conjugated anti-Ki67 and PE-conjugated isotype antibodies. (C, D) Ki67 expression in B16-GFP cells after culturing in adherent and non-adherent conditions for 18 hr. Data are mean ±s.d.; n = 2 biologically independent experiments. P-value was calculated by two-tailed, unpaired t-test. (E, F) Ki67 levels in B16-GFP cells after 18 hr incubation with conditioned media from indicated HEK cells. Media samples were collected after culturing HEKMock and HEKSiglec1 cells for 24 hr in 5% FBS-containing DMEM. After culturing B16-GFP cells in a non-adherent state with conditioned media for 18 hr, cells were fixed and stained for Ki67. Isotype antibody-stained samples were used to set cut off levels. Data are mean ±s.d.; n = 2 biologically independent experiments. P-value was calculated by two-tailed, unpaired t-test.
-
Figure 2—figure supplement 1—source data 1
This spreadsheet contains the source data for figure supplement 1.
- https://cdn.elifesciences.org/articles/48916/elife-48916-fig2-figsupp1-data1-v1.xlsx
Figure 2—figure supplement 2
Knockdown of Siglec1 in J774A.1 mouse macrophages and subculture with B16-GFP cells.
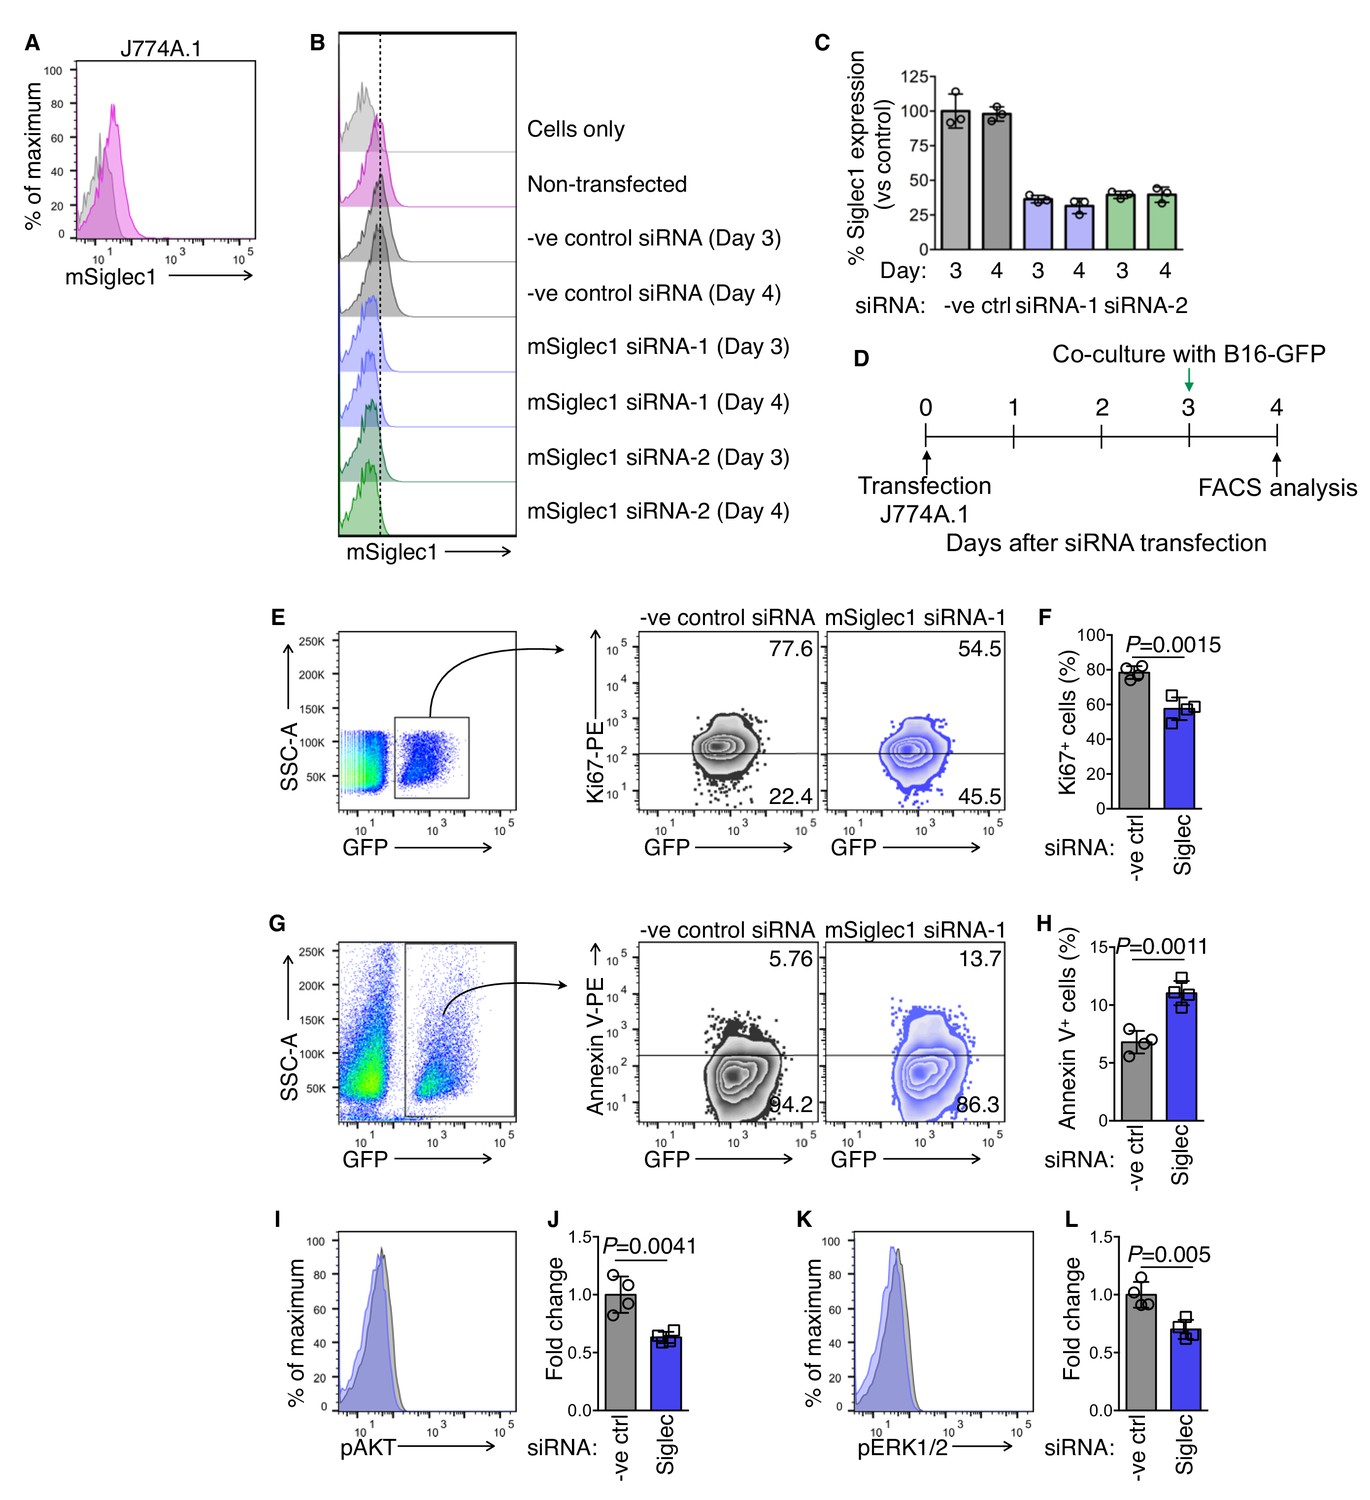
(A) Siglec1 expression on J774A.1 cells. (B), (C) siRNA knockdown of Siglec1. J774A.1 cells were transfected with the indicated negative control or mouse Siglec1 siRNA, and cell surface Siglec1 expression was assessed on days 3 and 4 post-transfection. Data shown in (C) are technical replicates from one experiment out of two independent experiments. (D) Schematic of siRNA transfection and co-culture experiments. (E), (F) Ki67 expression in B16-GFP cells after co-culture with control or Siglec1-knocked down J774A.1 cells (n = 4 independent experiments, P-value by two-tailed, unpaired t-test). (G, H) Apoptosis of B16-GFP cells after 18 hr co-culture with control or Siglec1-knocked down J774A.1 cells measured by Annexin V staining (n = 4 independent experiments, P-value by two-tailed, unpaired t-test). I–L Intracellular Phosflow staining to assess phosphorylated AKT (pAKT; I, J) and phosphorylated ERK1/2 (pERK; K, L) levels in B16-GFP cells after 18 hr co-culture with control or Siglec1-knocked down J774A.1 cells. (n = 4 independent experiments, P-value by two-tailed, unpaired t-test).
-
Figure 2—figure supplement 2—source data 1
This spreadsheet contains the source data for figure supplement 2.
- https://cdn.elifesciences.org/articles/48916/elife-48916-fig2-figsupp2-data1-v1.xlsx
Figure 3
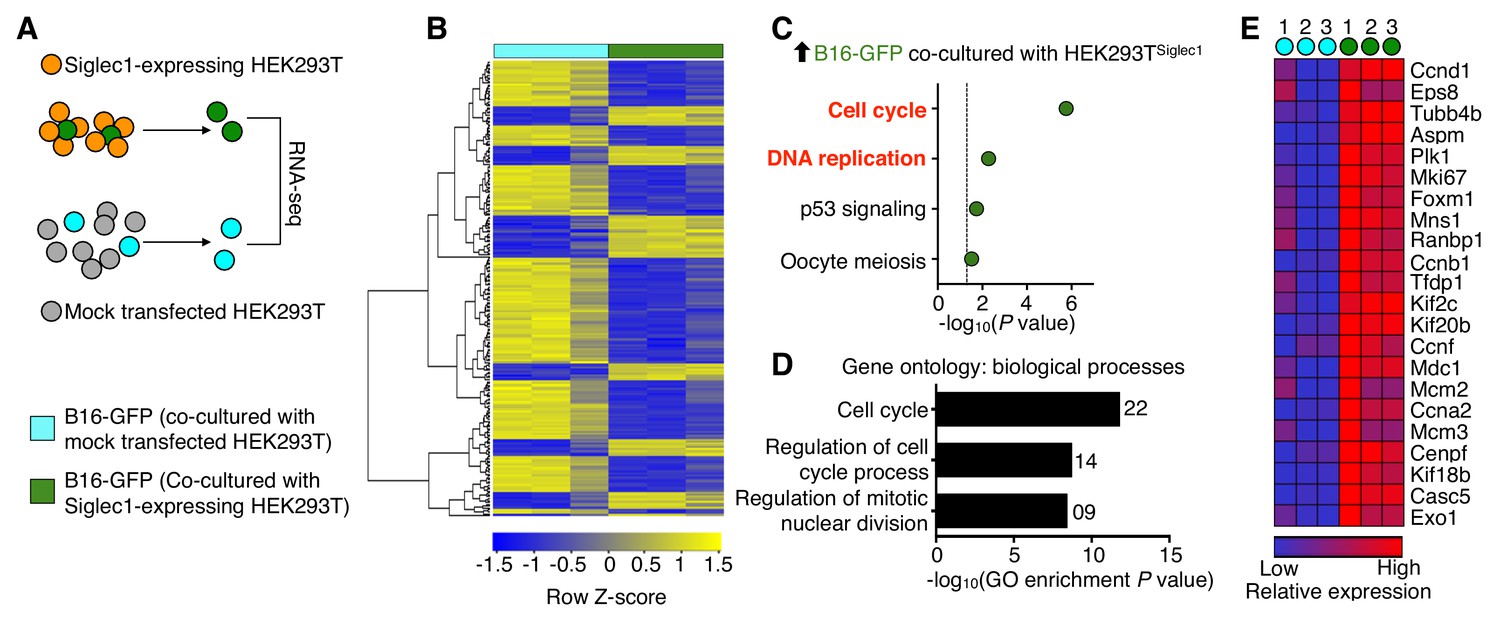
Siglec1 cancer cell interaction drives cell cycle progression.
(A) Schematic of the experimental design. B16-GFP cells co-cultured with Siglec1-expressing and mock transfected HEK293T cells were FACS sorted and processed for RNA sequencing. (B) Heat map of two-way hierarchical clustering of differentially expressed genes satisfying FC>1.5 and raw P<0.05 using Z-score for normalized log2 values. (C) KEGG pathways over-represented (P<0.05) among upregulated genes in cancer cells in B16-GFP and HEK Siglec1 co-cultured cells. (D, E) Siglec1-interacting cancer cells showing transcriptional induction of cell cycle. Shown are the top three bioprocess gene ontology terms in upregulated genes (D) and heat map of upregulated cell cycle genes (E). Differentially expressed genes are listed in Figure 3—source data 1 (data is from three independent experiments).
-
Figure 3—source data 1
This spreadsheet contains the list of differentially expressed genes.
- https://cdn.elifesciences.org/articles/48916/elife-48916-fig3-data1-v1.xlsx
Figure 4
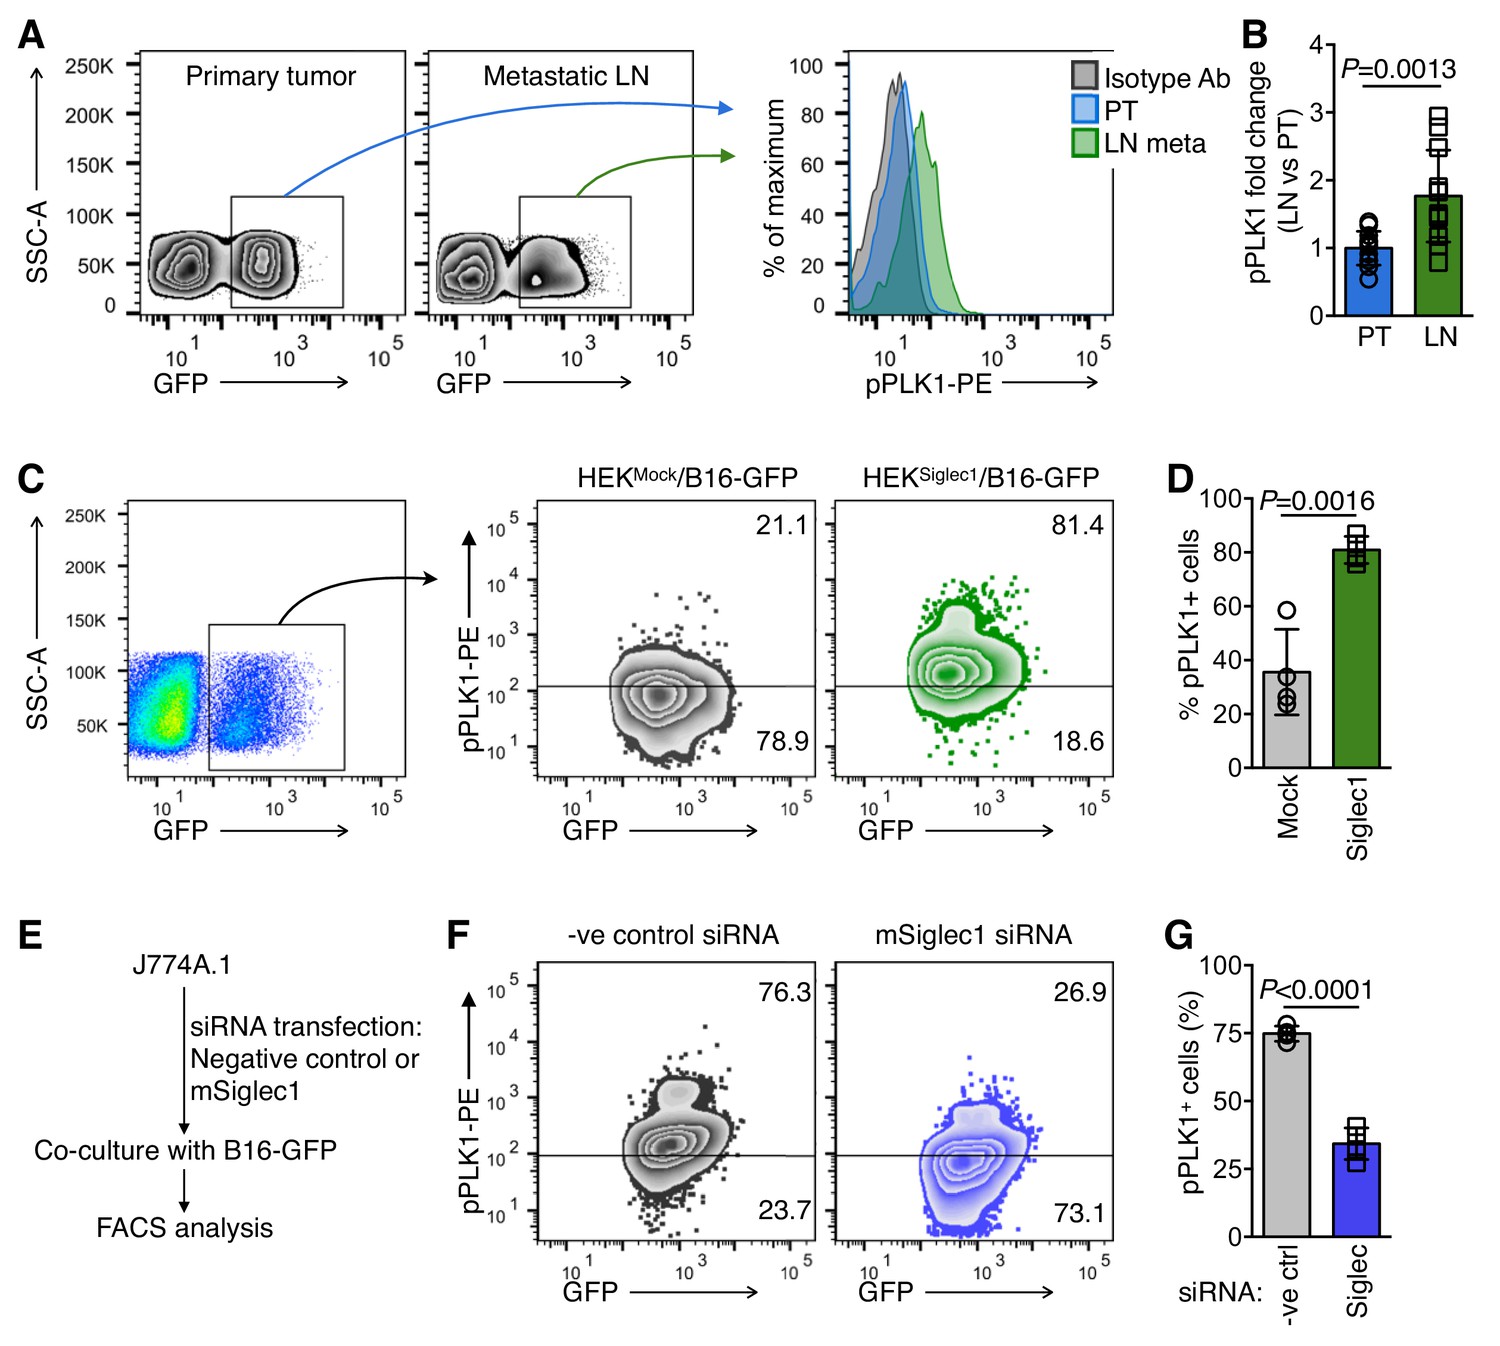
Siglec1-interacting cancer cells show high mitotic commitment.
(A) FACS plots showing phosphorylated PLK1 (pPLK1) in primary tumor (PT) and LN metastatic cells (LN meta). (B) Fold change in pPLK1 in LN meta vs. PT cells calculated from A (n = 12 from three independent experiments with four animals per experiment; bar represents ±s.d., P-value was calculated by two-tailed, unpaired t-test). (C, D) PLK1 phosphorylation in B16-GFP cells after 18 hr co-culture with indicated cancer cells/HEK293T co-culture. Representative FACS plot (C) and quantification (D) are shown (n = 4 independent experiments). (E) Schema of siRNA transfection in J774A.1 mouse macrophage cells and co-culture with B16-GFP cells. (F, G) PLK1 phosphorylation in B16-GFP cells after 18 hr co-culture with Siglec1-knocked down and control J774A.1 cells.( G) Quantification of (F) (n = 4 independent experiments, P-value was calculated by two-tailed, unpaired t-test).
-
Figure 4—source data 1
This spreadsheet contains the source data for Figure 4.
- https://cdn.elifesciences.org/articles/48916/elife-48916-fig4-data1-v1.xlsx
Figure 5 with 3 supplements
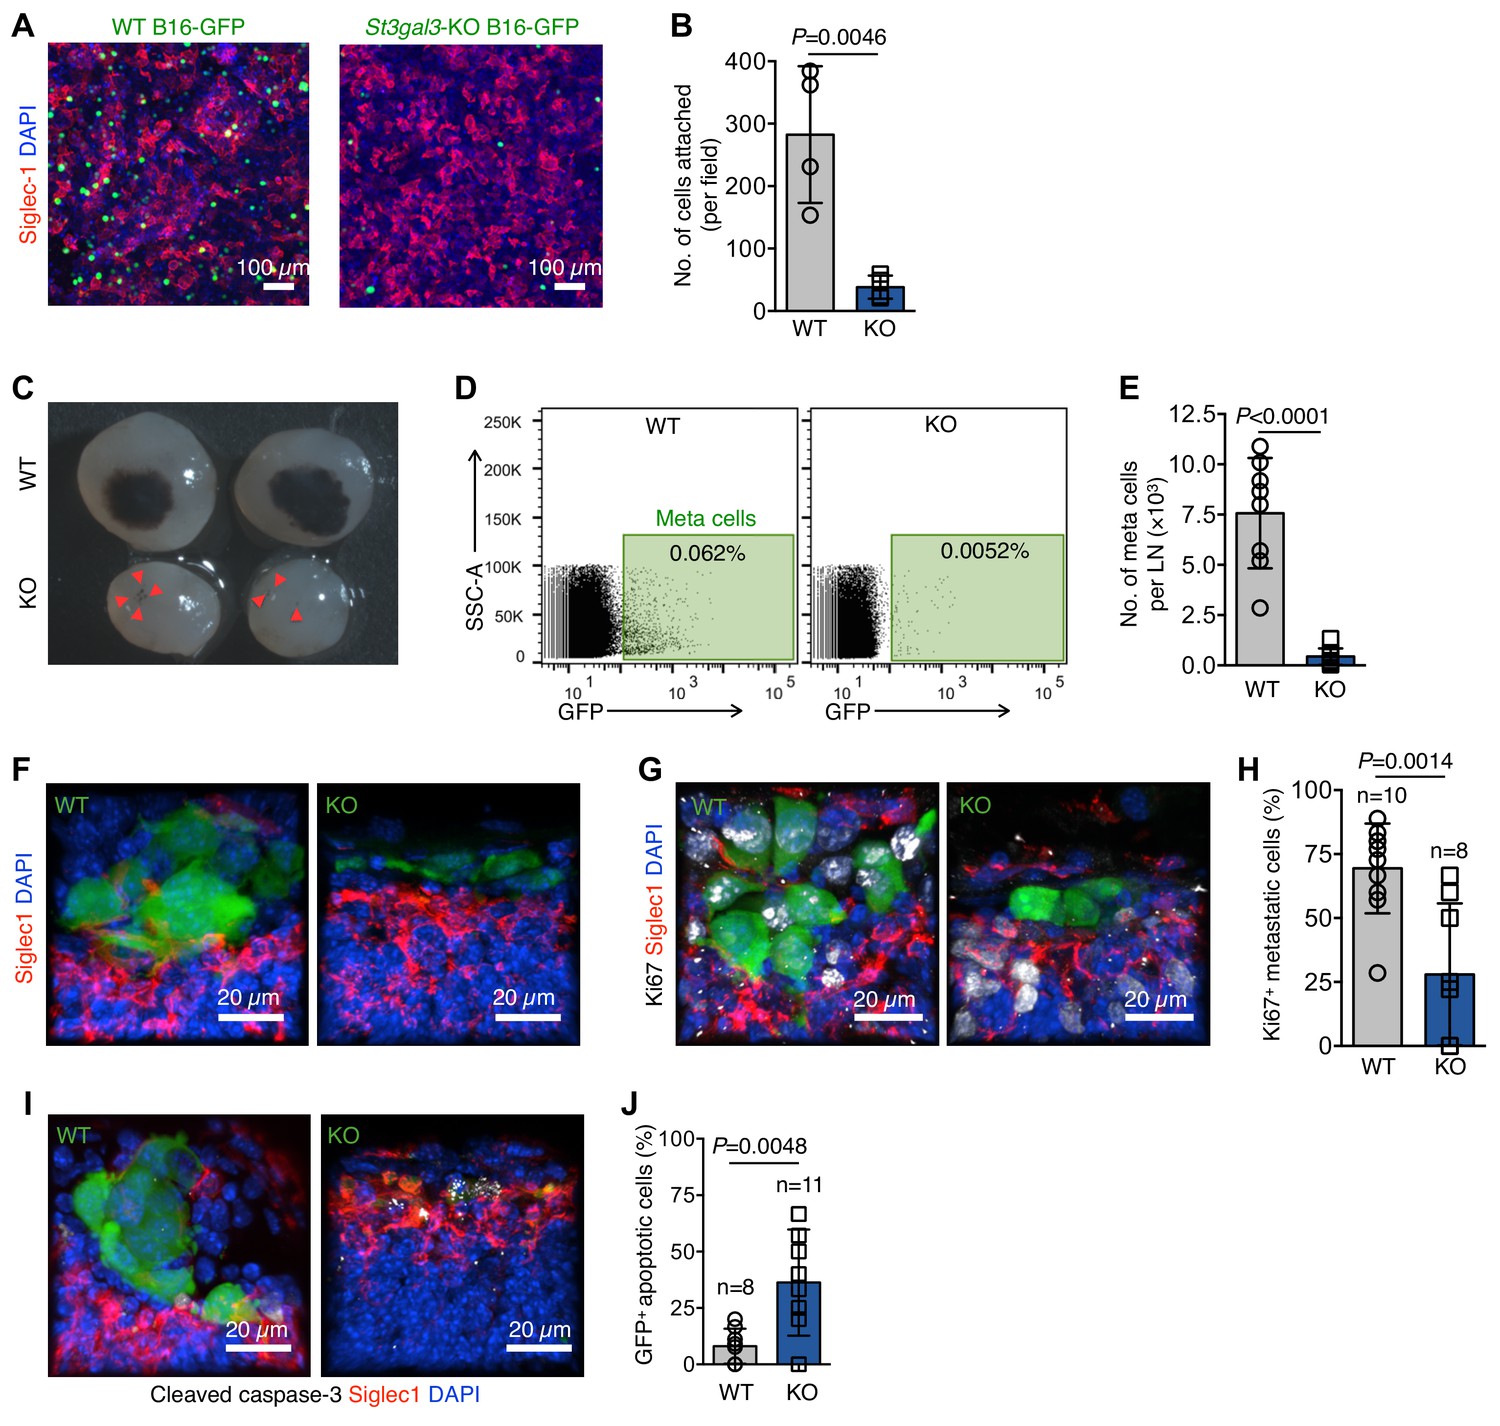
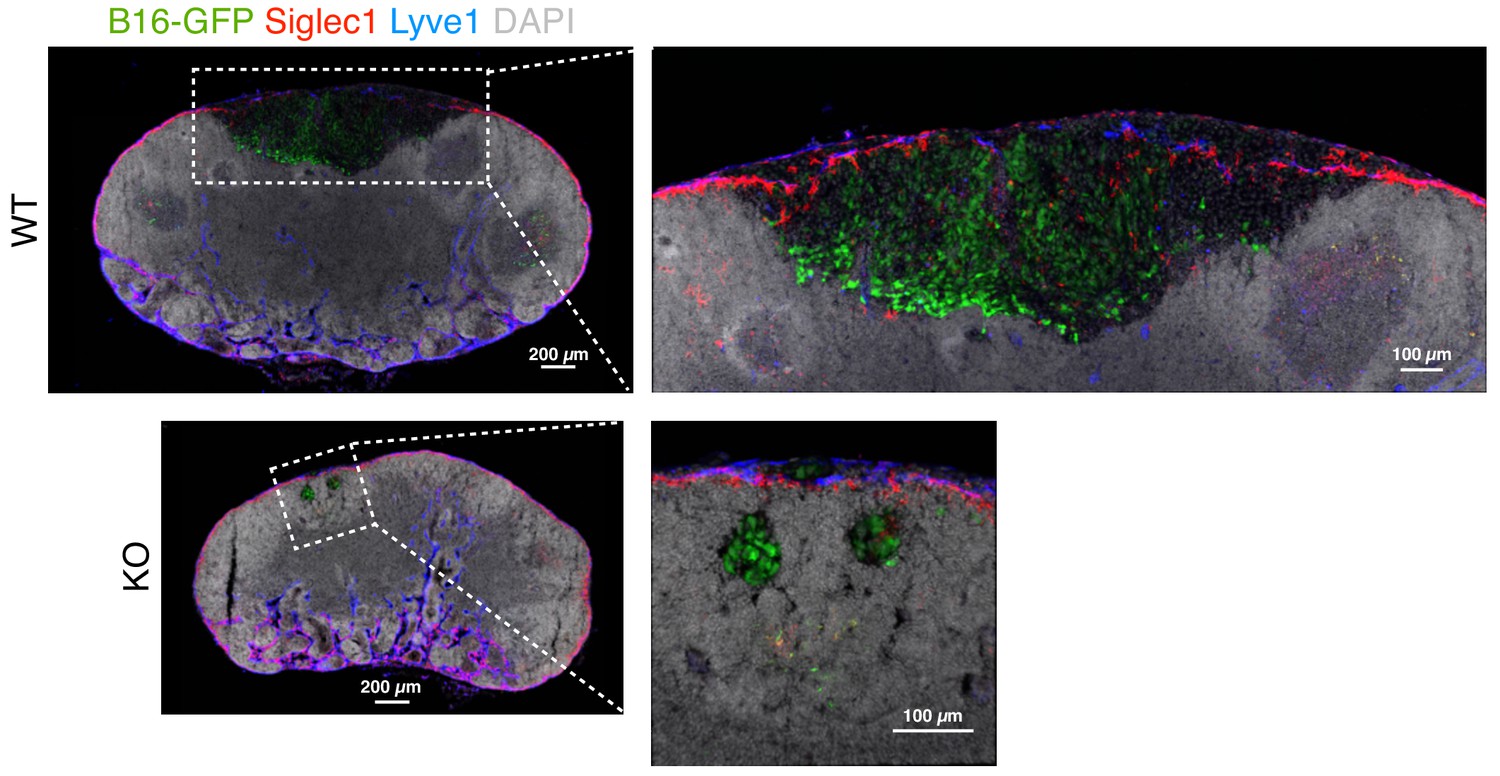
α−2,3-linked sialylation and melanoma LN metastasis.
(A) In vitro adhesion assay of wildtype (WT) and St3gal3-knockout (KO) B16-GFP cell lines to a Siglec1-expressing HEK293T monolayer. (B) The numbers of cells attached to the monolayer are plotted. Data are ±s.d.; n = 4 biologically independent experiments. P-value by two-tailed, unpaired t-test. (C) Representative images of metastasis bearing LNs from WT or KO B16-GFP tumor cells implanted in mice 3 weeks after injection. Red arrowheads indicate metastatic foci. (D) Representative plots of GFP+ metastasized cells in LNs of mice bearing 3 week primary WT or St3gal3 KO B16-GFP melanoma tumors. (E) Graph showing total metastasis burden per LN in mice implanted with WT or St3gal3 KO B16-GFP (quantification of C; n = 8 samples per group; P-value was calculated by two-tailed, unpaired t-test). (F) Morphological features of early metastatic foci (day 17) in the LN SCS of mice injected with WT or St3gal3 KO B16-GFP (green, B16-GFP; red, SCS macrophages). (G) Representative confocal images of Ki67+ (white) nuclei in metastatic foci formed by WT or St3gal3 KO B16-GFP cells in the LN SCS. (H) Quantification of Ki67+ nuclei in metastatic foci in (G). (I) Representative confocal image of apoptosis in WT and St3gal3 KO B16-GFP cells during the early stages of LN metastatic colonization measured by cleaved caspase-3+ (white) staining. (J) Quantification of cleaved caspase-3+ cells in (I). Data are from a total of six mice in each group from two independent experiments; P-value by two-tailed, unpaired t-test.
-
Figure 5—source data 1
This spreadsheet contains the source data for Figure 5.
- https://cdn.elifesciences.org/articles/48916/elife-48916-fig5-data1-v1.xlsx
Figure 5—figure supplement 1
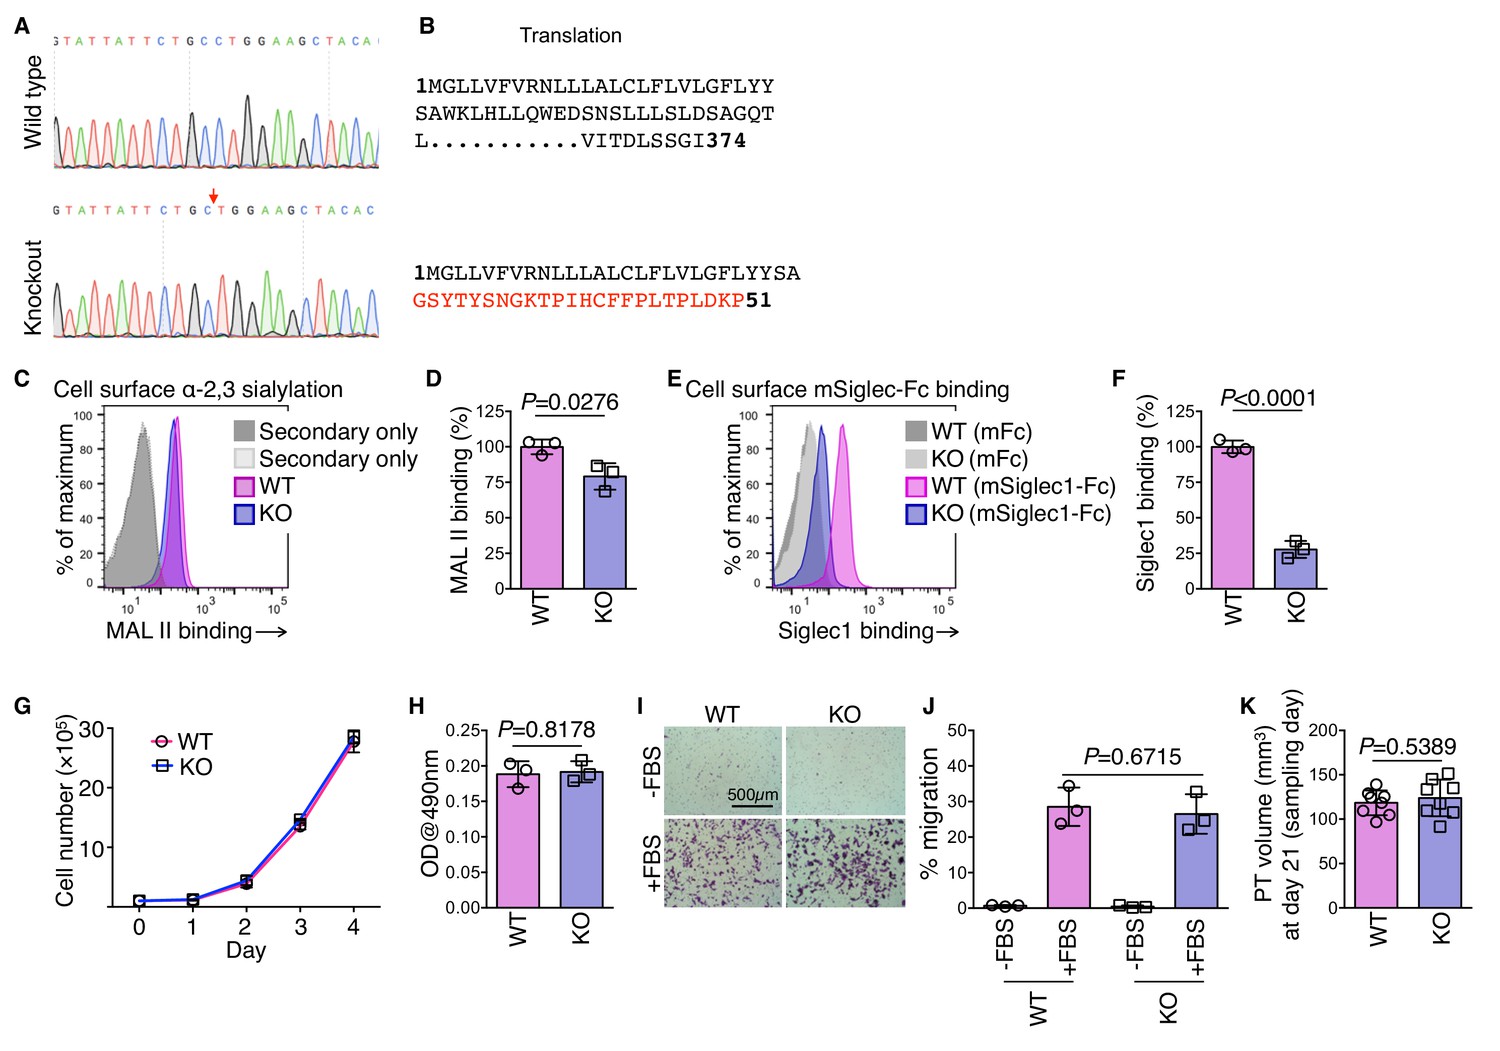
ST3 beta-galactoside alpha-2,3-sialyltransferase 3 (St3gal3) knockout cell line.
(A) DNA sequencing chromatograms around the St3gal3 CRISPR targeting site amplified using genomic DNA as template. Red arrow indicates base deletion site in the knockout (KO) B16-GFP cells. (B) St3gal3 open reading frame (ORF) in wild type (WT) and KO cells. Red color amino acid codons show altered and prematurely truncated ORF in St3gal3 KO cells. (C) Representative FACS plot showing MAL II lectin binding in WT and St3gal3 KO B16-GFP cells. (D) Quantification of percentage binding of MAL II lectin in KO cells in comparison with WT cells. Mean fluorescent intensity of binding to WT cells was normalized as 100%. (E) Representative FACS plot showing mSiglec1(ECD)-mFc binding in WT and St3gal3 KO B16-GFP cells. (F) Quantification of percentage binding of mSiglec1(ECD)-mFc in KO cells in comparison with WT cells. Mean fluorescent intensity of binding to WT cells was normalized as 100%. (G–K) Characterization of WT and St3gal3 KO cell lines. Proliferation of WT and St3gal3 KO cells in vitro (G); n = 2), in vitro adhesion to fibronectin-coated surface (H); n = 3), transwell migration (I, J); n = 3), and in vivo growth as a footpad tumor (K); n = 8). P-value was calculated by two-tailed, unpaired t-test.
-
Figure 5—figure supplement 1—source data 1
This spreadsheet contains the source data for figure supplement 1.
- https://cdn.elifesciences.org/articles/48916/elife-48916-fig5-figsupp1-data1-v1.xlsx
Figure 5—figure supplement 2
Primary tumor lymphatic vessels do not express Siglec1.
B16-GFP tumor cells bearing primary tumors were analyzed for Siglec1 expression on lymphatic vessels on day 21 after tumor cell implantation (green, B16-GFP; red, Siglec1; white, Lyve1; blue, DAPI). Representative image from two independent experiments.
Figure 5—figure supplement 3
Representative image of metastasis in popliteal LNs of wild type (WT) and St3gal3 knockout (KO) B16-GFP primary tumor-bearing mice.
Related to samples in Figure 5c.
Videos
Video 1
A close interaction of SCS macrophages (red) and metastatic cell (green) visualized in 3D space within lymph node SCS lined by lymphatic endothelial cells (blue).
We can see the SCS macrophage protrusion which spreads over wide surface of cancer cells, this contact provides anchorage to newly arrived pioneer metastatic cell in SCS (nuclei, white).
Tables
Key resources table
| Reagent type (species) or resource | Designation | Source or reference | Identifiers | Additional information |
|---|---|---|---|---|
| Cell line (mouse) | B16F10 | ATCC | Cat# CRL-6475, RRID:CVCL_0159 | |
| Cell line (mouse) | 4T1 | ATCC | Cat# CRL-2539 RRID:CVCL_0125 | |
| Cell line (human) | HEK293T | ATCC | Cat# CRL-3216, RRID:CVCL_0063 | |
| Cell line (mouse) | J774A.1 | ATCC | Cat# TIB-67, RRID:CVCL_0358 | |
| Antibody | anti-mouse CD169 (Siglec1) (clone #3D6.112) | Bio-Rad | Cat# MCA884, RRID:AB_322416 | (1:200) |
| Antibody | Rabbit anti-mouse LYVE-1 antibody | Angiobio | Cat# 11–034, RRID:AB_2813732 | (1:200) |
| Antibody | Rabbit anti-Ki67 antibody | Abcam | Cat# ab15580, RRID:AB_443209 | (1:200) |
| Antibody | Rabbit anti-cleaved Caspase-3 (Asp175) antibody | Cell Signaling Technology | Cat# 9579, RRID:AB_10897512 | (1:200) |
| Antibody | Rabbit Anti-GFP antibody | Abcam | Cat# ab6556, RRID:AB_305564 | (1:200) |
| Antibody | Cy3 AffiniPure Goat Anti-Rat IgG (H+L) | Jackson ImmunoResearch | Cat# 112-165-167, RRID:AB_2338251 | (1:500) |
| Antibody | Cy5 AffiniPure Goat Anti-Rabbit IgG (H+L) | Jackson ImmunoResearch | Cat# 111-175-144, RRID:AB_2338013 | (1:500) |
| Antibody | PE mouse anti-Ki67 antibody (Clone # B65) | BD Biosciences | Cat# 556027, RRID:AB_2266296 | As recommended by manufacturer |
| Antibody | Alexa Fluor647-anti-mouse CD169 (Siglec1) antibody (clone #3D6.112) | BioLegend | Cat# 142408, RRID:AB_2563621 | As recommended by manufacturer |
| Antibody | PE mouse IgG1 Isotope control antibody (Clone# MOPC-21) | BD Biosciences | Cat# 556027, RRID:AB_2266296 | As recommended by manufacturer |
| Antibody | BD Phosflow PE mouse anti-Akt (pS473) antibody | BD Biosciences | Cat# 560378, RRID:AB_1645328 | As recommended by manufacturer |
| Antibody | BD Phosflow PerCP-Cy5.5 Mouse anti-ERK1/2 (pT202/pY204) antibody | BD Biosciences | Cat# 560115, RRID:AB_1645298 | As recommended by manufacturer |
| Antibody | BD Phosflow PE Mouse anti-PLK1 (pT210) antibody | BD Biosciences | Cat# 558445, RRID:AB_647227 | As recommended by manufacturer |
| Antibody | PE Goat Anti-Mouse Ig (Multiple Adsorption) | BD Biosciences | Cat# 550589, RRID:AB_393768 | (1:500) |
| Other | Biotinylated Sambucus Nigra Lectin (SNA) | Vector Laboratories | Cat# B-1305, RRID:AB_2336718 | |
| Other | Biotinylated Maackia Amurensis Lectin II (MAL II) | Vector Laboratories | Cat# B-1265, RRID:AB_2336569 | |
| Other | Streptavidin-FITC | eBioscience | Cat# 11-4317-87 | (1:500) |
| Other | PE Streptavidin | BD Biosciences | Cat# 554061, RRID:AB_10053328 | (1:500) |
| Commercial assay or kit | PE Annexin V | BD Pharmingen | Cat# 556422 | As recommended by manufacturer |
| Software | Imaris version 8.1 | Bitplane | RRID:SCR_007370 | |
| Recombinant DNA reagent | Mouse Siglec1 full length cDNA | Transomic technologies | Cat# BC141335 | Construction of expression plasmid |
| Transfected construct (mouse) | siRNA-1 to mouse Siglec1 | Bioneer | Cat# 20612–1 | RNA-GUC UUC CUU UCG AGA CUC A = tt(1-AS) |
| RNA-UGA GUC UCG AAA GGA AGA C = tt(1-AA) | ||||
| Transfected construct (mouse) | siRNA-2 to mouse Siglec1 | Bioneer | Cat# 20612–2 | RNA-CUC CAA CCA ACU UCA CGA U = tt(2-AS) |
| RNA-AUC GUG AAG UUG GUU GGA G = tt(2-AA) | ||||
| Transfected construct (mouse) | Negative control siRNA | Bioneer | Cat# SN-1003 | |
| Transfected construct (mouse) | pRGEN-CjCas9-CMV | Toolgen | TGEN_CjS1 | |
| Transfected construct (mouse) | pRGEN-U6-mSt3gal3-CjRG1 | Toolgen | TGEN_CjS1 | RGEN sequence: CAGTAAGTGTAGCTTCCAGGCAGAATAATA C |
| Sequence based reagent | mSt3gal3 For | This paper | PCR primers | TCACTATGCGGAGGAAGACTGCTTAATATC |
| Sequence based reagent | mSt3gal3 Rev | This paper | PCR primers | ATGCAGATTTCAAGGGTTGGGGGAAG |
Additional files
Download links
A two-part list of links to download the article, or parts of the article, in various formats.
Downloads (link to download the article as PDF)
Open citations (links to open the citations from this article in various online reference manager services)
Cite this article (links to download the citations from this article in formats compatible with various reference manager tools)
Siglec1-expressing subcapsular sinus macrophages provide soil for melanoma lymph node metastasis
eLife 8:e48916.
https://doi.org/10.7554/eLife.48916


