NEIL1 and NEIL2 DNA glycosylases protect neural crest development against mitochondrial oxidative stress
- Institute of Molecular Biology (IMB), Germany
- DKFZ-ZMBH Alliance, Germany
Figures
Figure 1
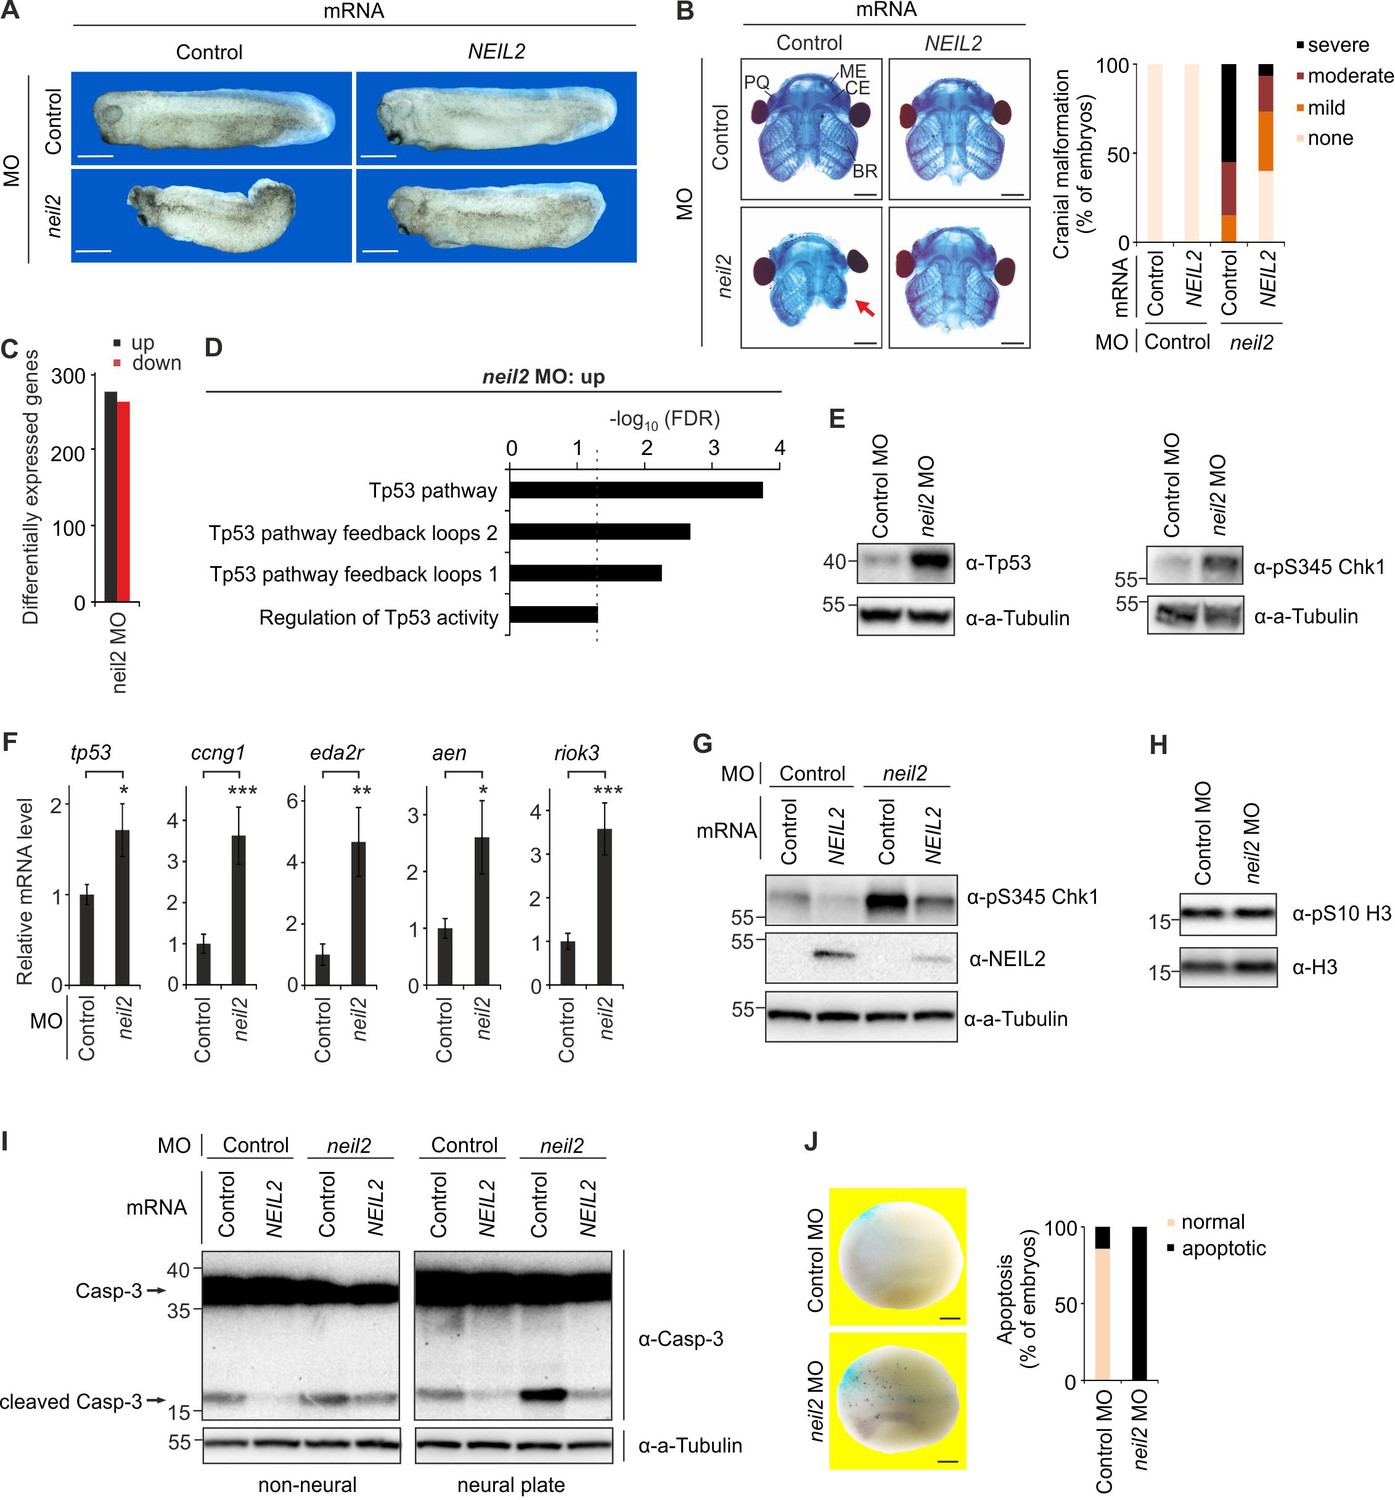
Neil2 protects against a Tp53 DNA damage response-induced apoptosis in Xenopus neuroectoderm.
(A) Phenotypes at stage 32 of Xenopus leavis embryos injected at one-cell stage with control- or neil2 MO (left). Human NEIL2 or bovine Preprolactin (control) mRNA was co-injected for rescue experiments (right). Scale bars, 500 µm. (B) Left, representative stainings of cranial cartilage of stage 45 embryos unilaterally injected with control or neil2 MO, and control or human NEIL2 mRNA for rescue purpose as indicated. PQ, palatoquadrate cartilage; ME, Meckel’s cartilage; CE, ceratohyal cartilage; BR, branchial cartilage. Arrow indicates cartilage defects in Neil2 morphants. Scale bars, 500 µM. Right, quantification of embryo malformations (n = 15, 21, 20 and 15 embryos per group, from left to right). (C) Quantification of differentially expressed genes at stage 23 of neil2 MO-injected embryos. (D) Pathway enrichment analysis of neil2 MO upregulated genes. Dashed line indicates the significance threshold FDR = 0.05. (E) Western blot for total Tp53 and phosphoserine (pS345) Chk1 in dissected stage 14 neural plates of control and neil2 MO-injected embryos. Alpha (a-) Tubulin served as loading control. Molecular weight of marker proteins [x10−3] is indicated on the left. Note that X. laevis Tp53 migrates at ~43 kDa. (F) qPCR expression analysis of tp53 and Tp53 target genes in control- and neil2 MO-injected embryos at stage 14. Expression of examined genes was normalized to h4 and is presented relative to mRNA levels in control MO-injected embryos (mean ±s.d., n = 3 embryo batches consisting of 6 embryos each). (G) Western blot for pS345 Chk1 and NEIL2 in neural plates from control and neil2 MO-injected stage 14 embryos co-injected with control or human NEIL2 mRNA. Alpha (a-) Tubulin served as loading control. (H) Western blot for phosphoserine (pS10) histone H3 in neural plates from control and neil2 MO-injected embryos at stage 15. Total histone H3 served as loading control. (I) Western blot analysis for Caspase-3 in dissected non-neural tissue and neural plates from control and neil2 MO-injected stage 14 embryos co-injected with control and human NEIL2 mRNA. Alpha (a-) Tubulin served as loading control. Uncleaved and cleaved (active) Caspase-3 are indicated (arrows). (J) TUNEL (apoptosis) assay of stage 16 embryos injected unilaterally with neil2 MO and lacZ lineage tracer (TUNEL, dark blue speckles; lacZ, light blue speckles). Scale bars, 200 µM. Right, quantification of TUNEL signal (n = 7 and 10 embryos per group, from left to right).
Figure 2
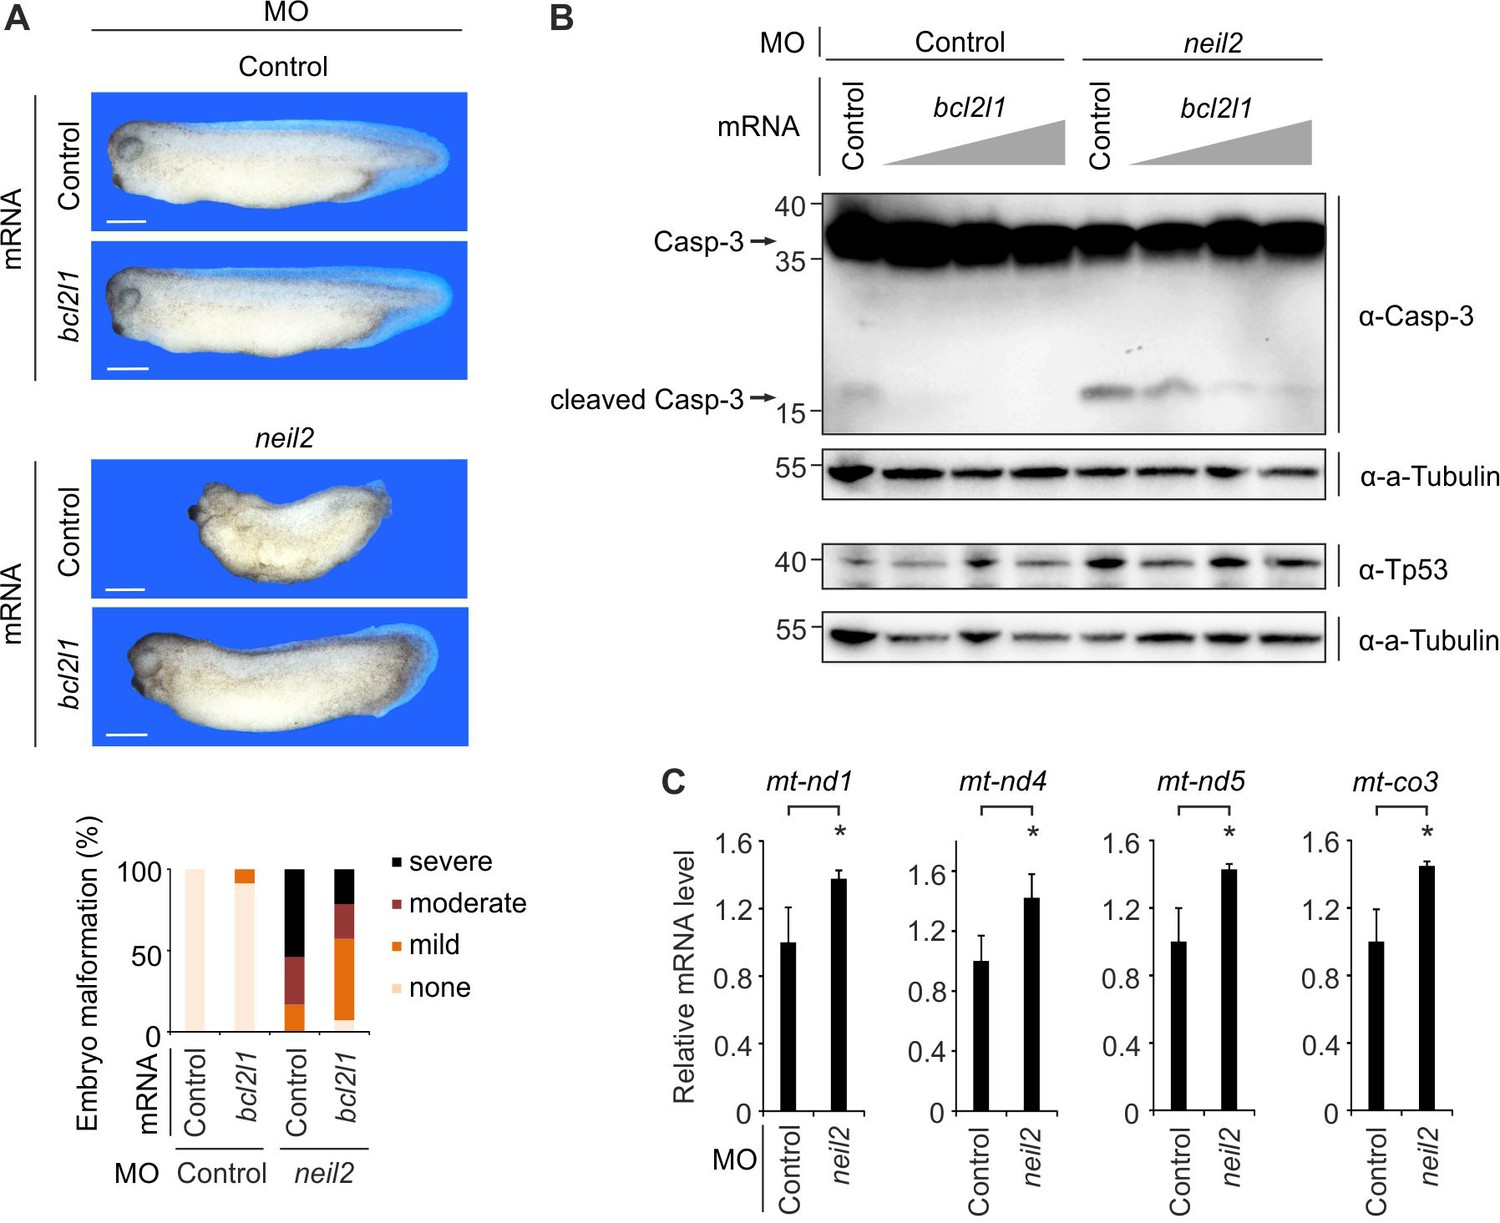
Malformations in Neil2-deficient Xenopus embryos are mediated by intrinsic apoptosis.
(A) Top, representative phenotypes at stage 32 of Xenopus laevis embryos injected at one-cell stage with control- or neil2 MO (bottom). Xenopus bcl2l1 or bovine Preprolactin (control) mRNA was co-injected for rescue purpose. Scale bars, 500 µm. Bottom, quantification of embryo malformations (n = 17, 23, 24 and 14 embryos per group, from left to right). (B) Western blot for Caspase-3 (top) and Tp53 (bottom) in neural plates from control and neil2 MO-injected stage 14 embryos co-injected with control or increasing amounts of bcl2l1 mRNA (0.5, 1 and 2 ng). Alpha (a-) Tubulin served as loading control. Uncleaved and cleaved (active) Caspase-3 are indicated (arrows). Molecular weight of marker proteins [x10−3] is indicated on the left. (C) qPCR expression analysis of mitochondrial (mt) genes in control- and neil2 MO-injected embryos at stage 14. Expression of mt-genes was normalized to h4 and is presented relative to mRNA levels in control MO-injected embryos (mean ±s.d., n = 3 embryo batches consisting of 6 embryos each).
Figure 3
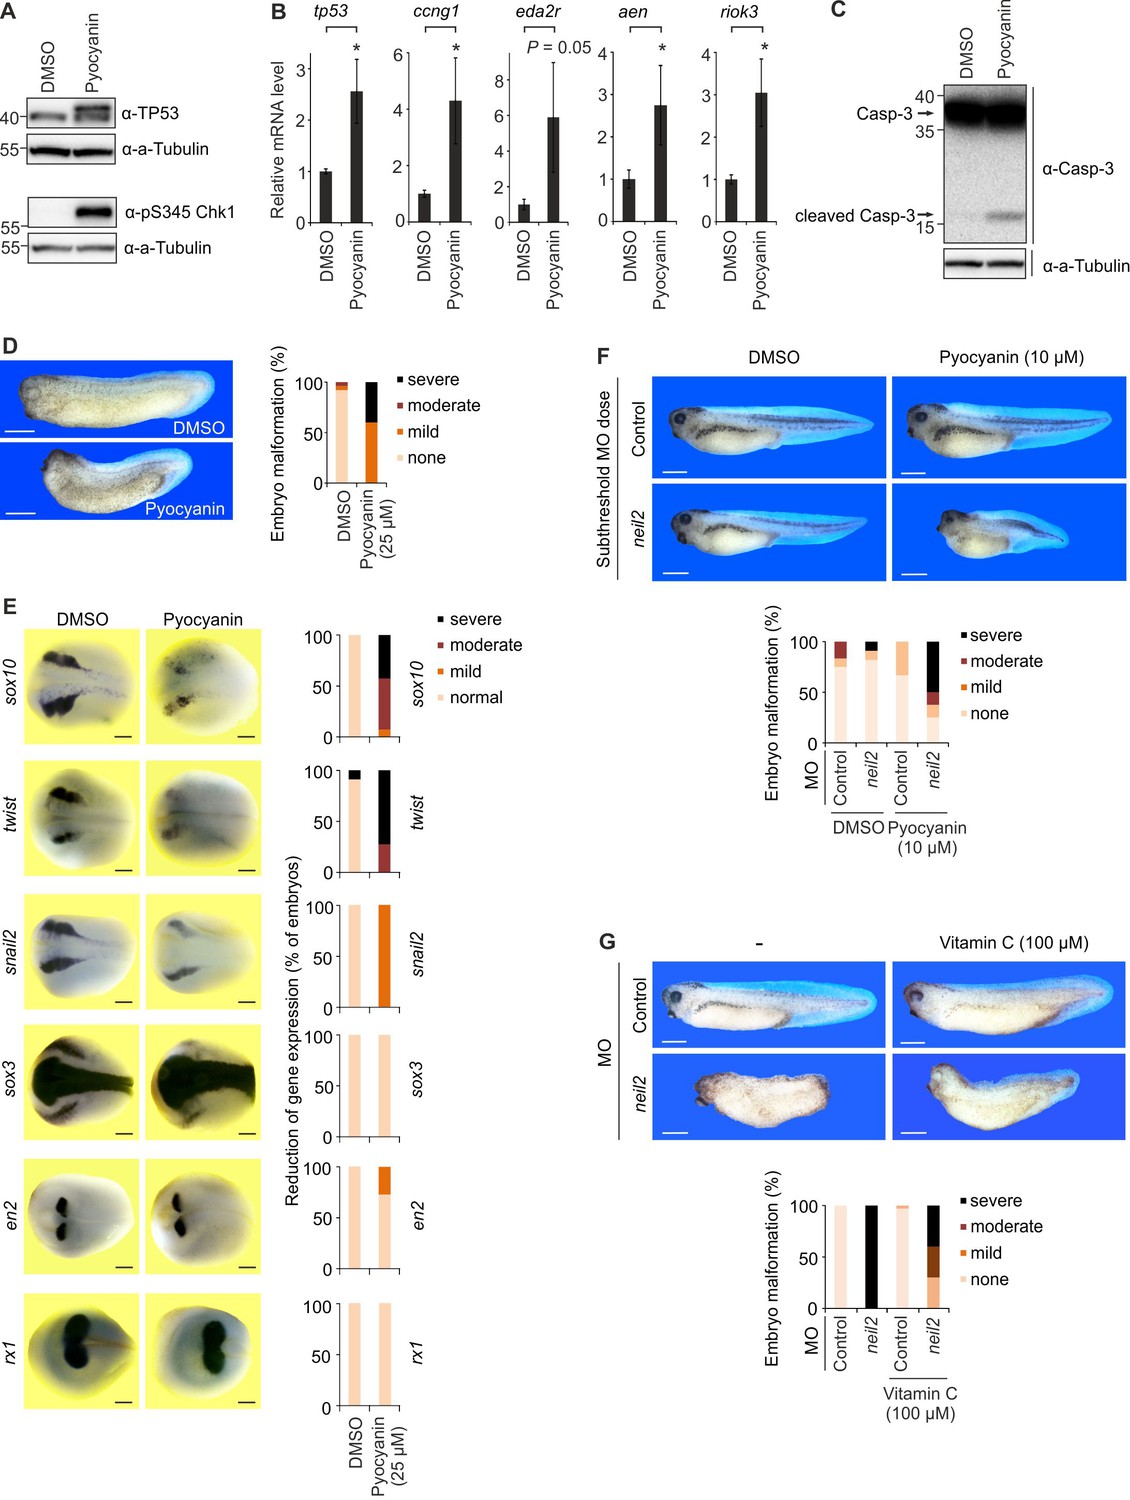
Oxidative stress causes neural crest defects in Neil2-deficient Xenopus embryos.
(A) Western blot analysis for total Tp53 and pS345 Chk1 of stage 14 embryos cultivated in 25 µM pyocyanin or DMSO (solvent). Alpha (a-) Tubulin served as loading control. Molecular weight of marker proteins [x10−3] is indicated on the left. (B) qPCR expression analysis of tp53 and Tp53 target genes in embryos at stage 14 cultivated in 25 µM pyocyanin or DMSO. Expression of examined genes was normalized to h4 and is presented relative to mRNA level of DMSO treated embryos (mean ±s.d., n = 3 embryo batches consisting of 6 embryos each). (C) Western blot analysis for Caspase-3 of stage 14 embryos cultivated in 25 µM pyocyanin or DMSO (solvent). Alpha (a-) Tubulin served as loading control. Uncleaved and cleaved (active) Caspase-3 are indicated (arrows). (D) Left, representative phenotypes of stage 32 embryos treated with 25 µM pyocyanin or DMSO (solvent). Right, quantification of embryo malformations (n = 25 and 15 embryos per group, from left to right). Scale bars, 500 µM. (E) Left, whole mount in situ hybridization of the indicated marker genes in stage 16 Xenopus embryos treated with 25 µM pyocyanin or DMSO (solvent). Right, quantification of embryo malformations [n = 10 and 14 embryos per group for sox10; 2 × 11 (twist); 15 and 7 (snail2); 11 and 14 (sox3); 2 × 11 (en2); 15 and 20 (rx1), from left to right]. Scale bars, 200 µM (F) Top, phenotypes of stage 39 embryos treated with 10 µM pyocyanin and injected with 15 ng/embryo of control and neil2 MOs (subthreshold dose). Bottom, quantification of embryo malformations (n = 12, 11, 6 and 8 embryos per group, from left to right). Scale bars, 500 µM. (G) Top, phenotypes of stage 37 embryos injected with 40 ng/embryo of control and neil2 MOs and treated with 100 µM Vitamin C. Bottom, quantification of embryo malformations (n = 16, 22, 33 and 10 embryos per group, from left to right). Scale bars, 500 µM.
Figure 4
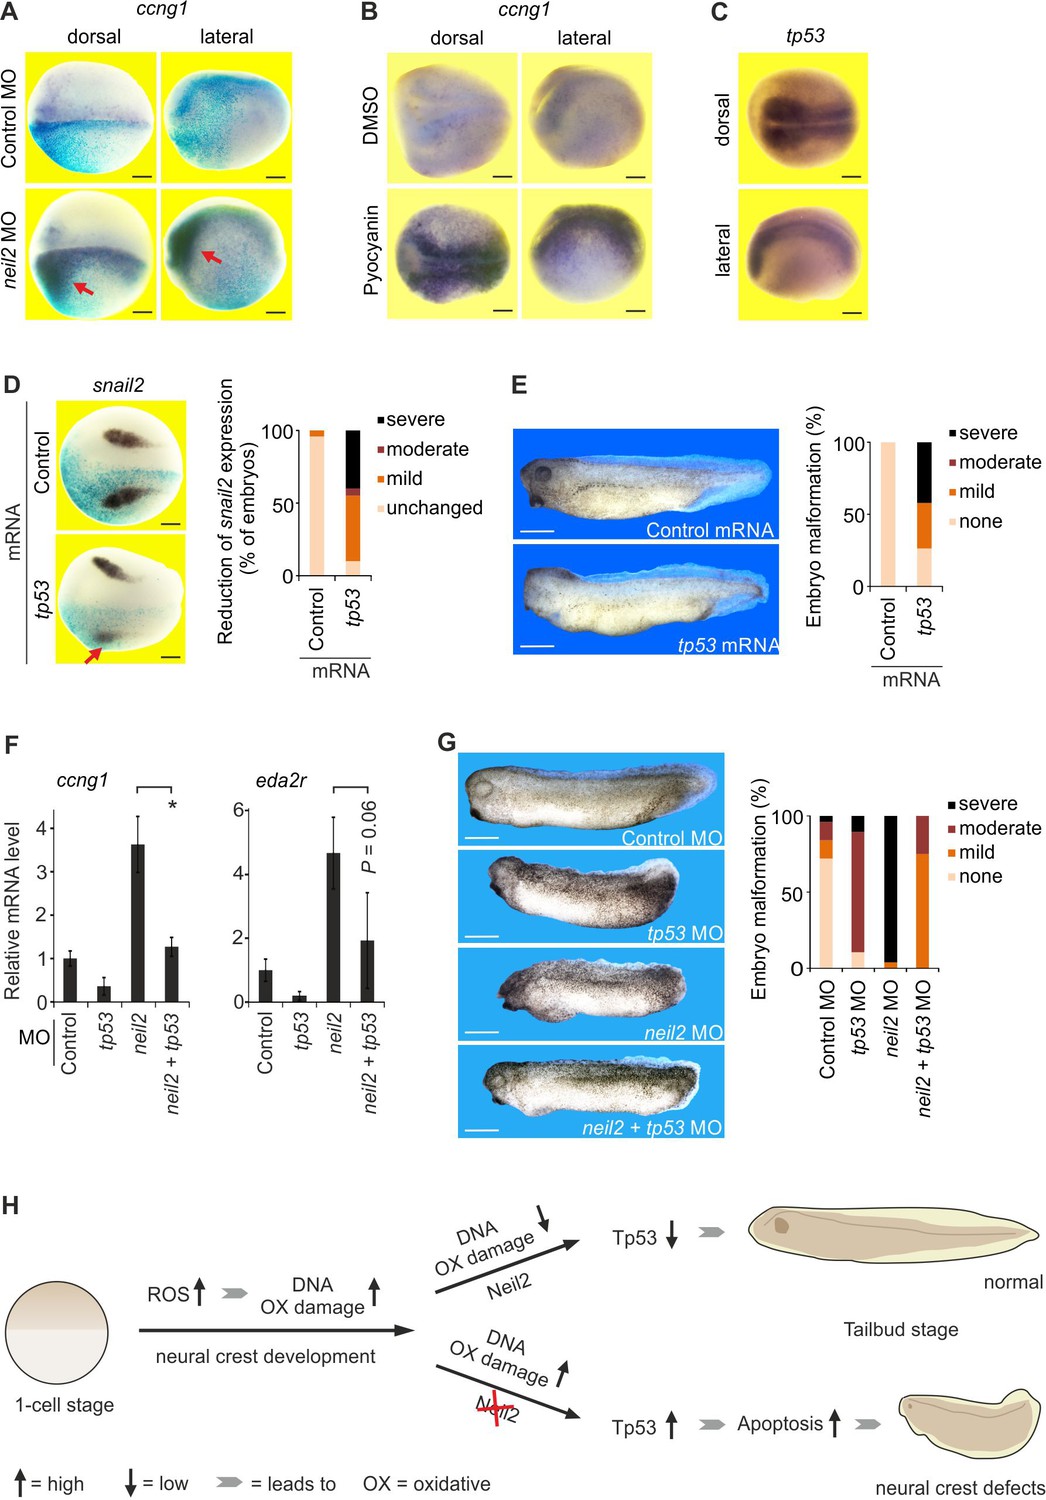
A neuroectoderm-restricted Tp53 DNA damage response triggers neural crest defects in Xenopus embryos.
(A–D) Whole mount in situ hybridization for the indicated marker genes in stage 18 Xenopus embryos shown in dorsal view or as indicated. Scale bars, 200 µm. (A) Embryos were injected unilaterally with control or neil2 MO (lineage-traced by co-injected lacZ mRNA, light blue speckles). (B) Embryos were treated with 25 µM pyocyanin or DMSO (solvent). (C) Expression of tp53 in untreated embryos. (D) Left, embryos were unilaterally injected with control or tp53 mRNA (lineage-traced by co-injected lacZ mRNA, light blue speckles). Note reduced snail2 expression in neural crest cells after tp53 mRNA injection (red arrow). Right, quantification of reduced snail2 expression (n = 24 and 20 embryos per group, from left to right). (E) Left, phenotype of stage 32 embryos injected with control or tp53 mRNA. Right, quantification of embryo malformations (n = 23 and 19 embryos per group, from left to right). Scale bars, 500 µm. (F) qPCR expression analysis of ccng1 and eda2r in embryos at stage 14 injected with MOs as indicated. Expression of ccng1 and eda2r was normalized to h4 expression and is presented relative to control MO-injected embryos. (mean ±s.d., n = 3 embryo batches consisting of 6 embryos each). (G) Left, phenotypes of stage 32 embryos injected with the indicated MOs. Scale bars, 500 µm. Right, quantification of embryo malformations (n = 25, 26, 19 and 28 embryos per group, from left to right). (H) Model for Neil2 function in Xenopus neural crest specification. During neural crest development ROS levels are increased and DNA is oxidatively damaged. Unrepaired DNA damage in the absence of Neil2 induces Tp53-DDR followed by intrinsic apoptosis and malformation of neural crest derivatives in the developing embryo. ROS, reactive oxygen species.
Figure 5
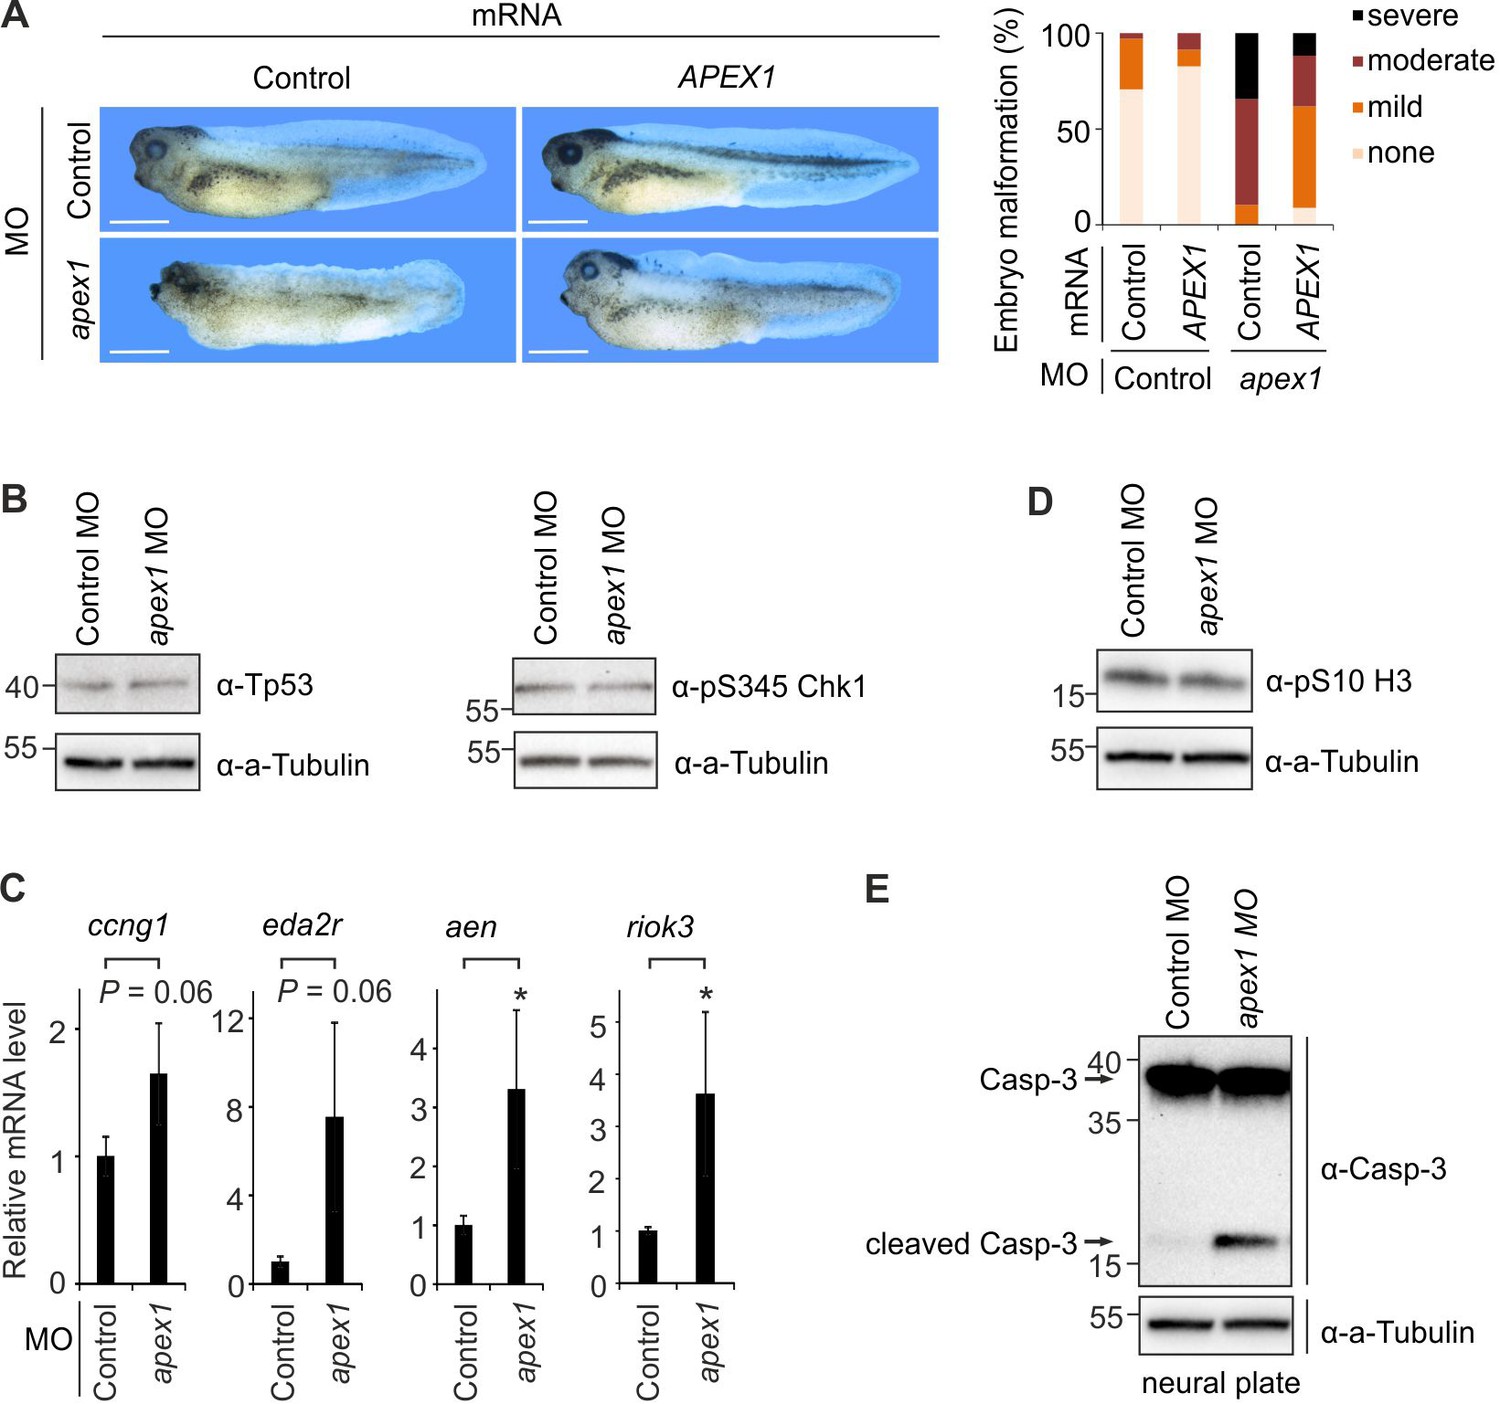
Apex1-deficiency phenocopies neural crest defects of Neil2-morphant Xenopus embryos.
(A) Left, phenotypes of stage 39 embryos injected with control and apex1 MO, and control and human APEX1 mRNA for phenotypic rescue. Scale bars, 500 µm. Right, quantification of embryo malformation in all four injection groups (n = 34, 23, 29 and 34 embryos per group, from left to right). (B) Western blot for total Tp53 and phosphoserine (pS345) Chk1 in stage 14 control and apex1 MO-injected embryos. Alpha (a-) Tubulin served as loading control. Molecular weight of marker proteins [x10−3] is indicated on the left. (C) qPCR expression analysis of Tp53 target genes in control and apex1 MO-injected embryos at stage 14. Expression of target genes was normalized to h4 and is presented as relative mRNA level of control MO-injected embryos (mean ±s.d., n = 3 embryo batches consisting of 6 embryos each). (D) Western blot for phosphoserine (pS10) histone H3 from control and apex1 MO-injected stage 14 embryos. Alpha (a-) Tubulin served as loading control. (E) Western blot analysis for Caspase-3 in control and apex1 MO-injected stage 14 embryos. Alpha (a-) Tubulin served as loading control. Uncleaved and cleaved (active) Caspase-3 are indicated (arrows).
Figure 6 with 2 supplements
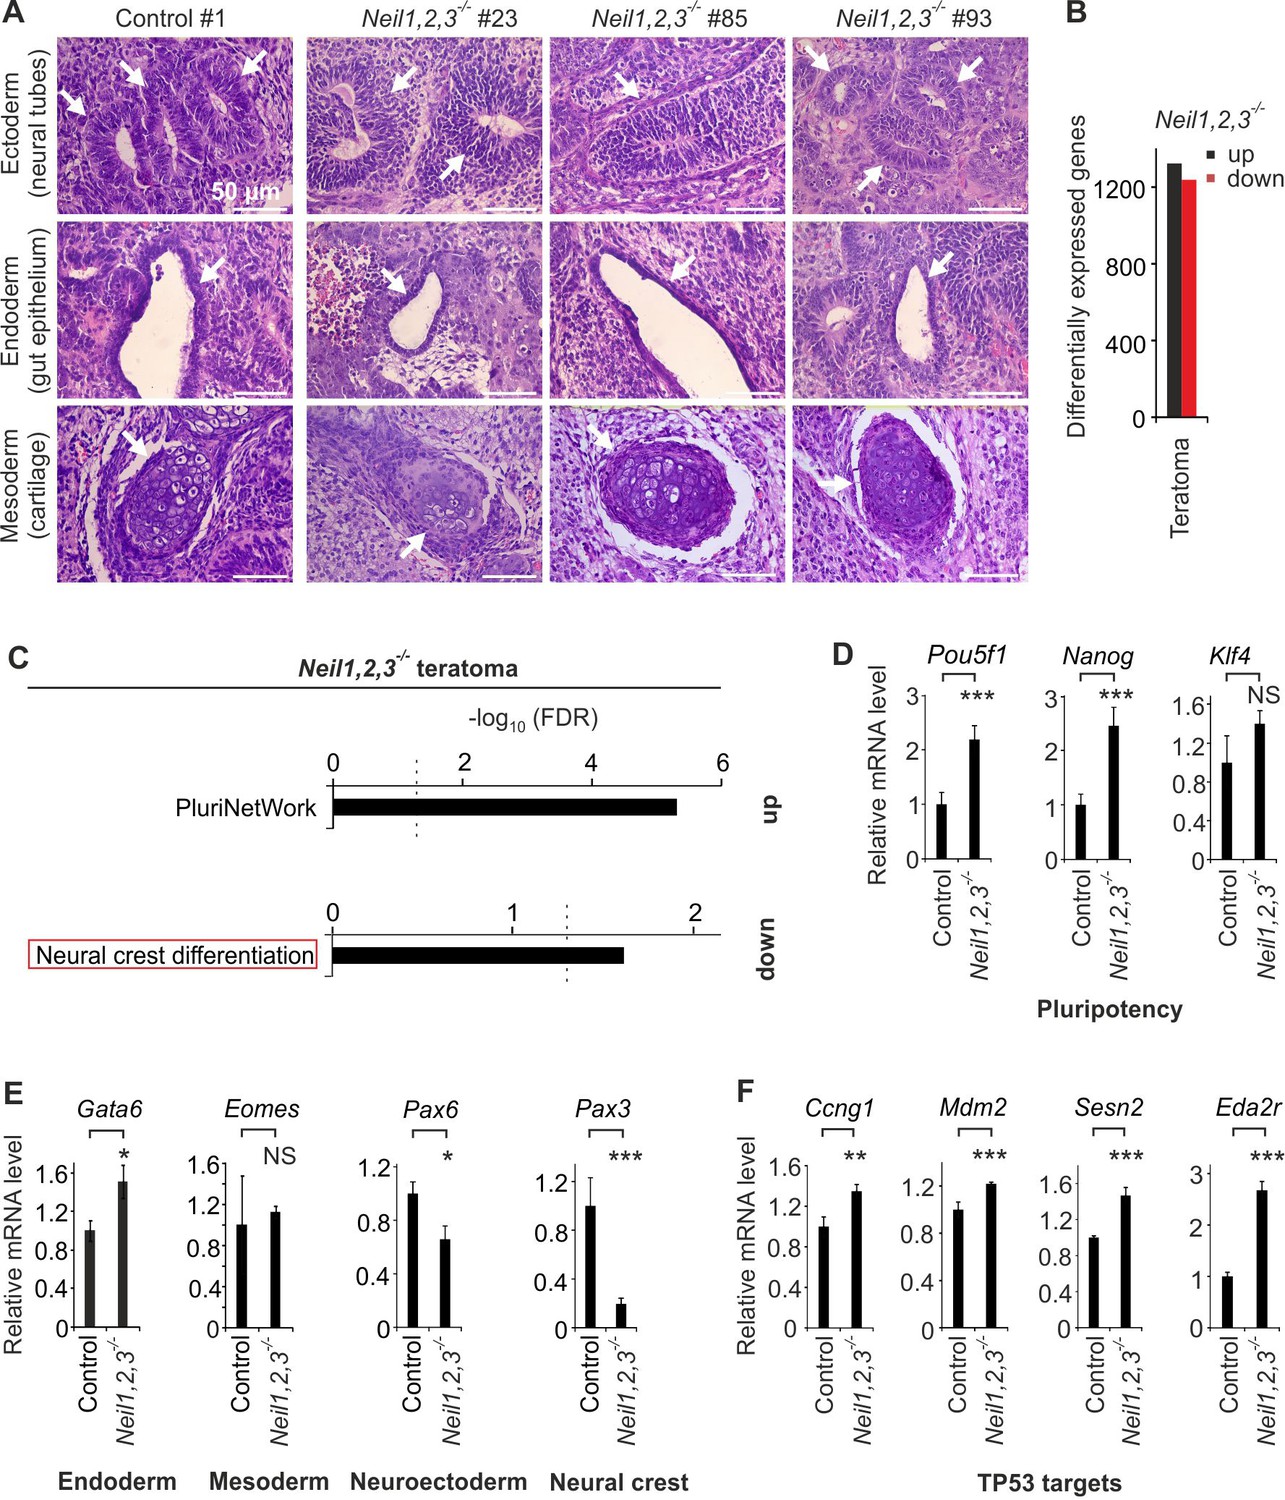
Neil1,2,3-deficient mESCs display neural crest cell differentiation defects.
(A) Histological analysis of H and E stained teratomas derived from control and Neil1,2,3-deficient mESC lines. Arrows indicate neural tube- (ectoderm), gut epithelium- (endoderm) and cartilage- (mesoderm) related structures within each section. (B) Quantification of differentially expressed genes in Neil1,2,3-deficient teratomas. (C) Pathway enrichment analysis of up- and downregulated genes in Neil1,2,3-deficient teratomas. Dashed line indicates the significance threshold FDR = 0.05. (D) qPCR expression analysis of pluripotency genes in control and Neil1,2,3 triple-deficient teratomas. Marker gene expression was normalized to Tbp and is presented relative to control teraomas (mean ±s.d., n = 3 biological replicates with each three technical replicates). (E) qPCR expression analysis as in (D) but of endoderm (Gata6), mesoderm (Eomes), neuroectoderm (Pax6) and neural crest (Pax3) marker genes of control and Neil1,2,3-deficient teratomas. (F) qPCR expression analysis as in (D) but of selected TP53 target genes.
Figure 6—figure supplement 1
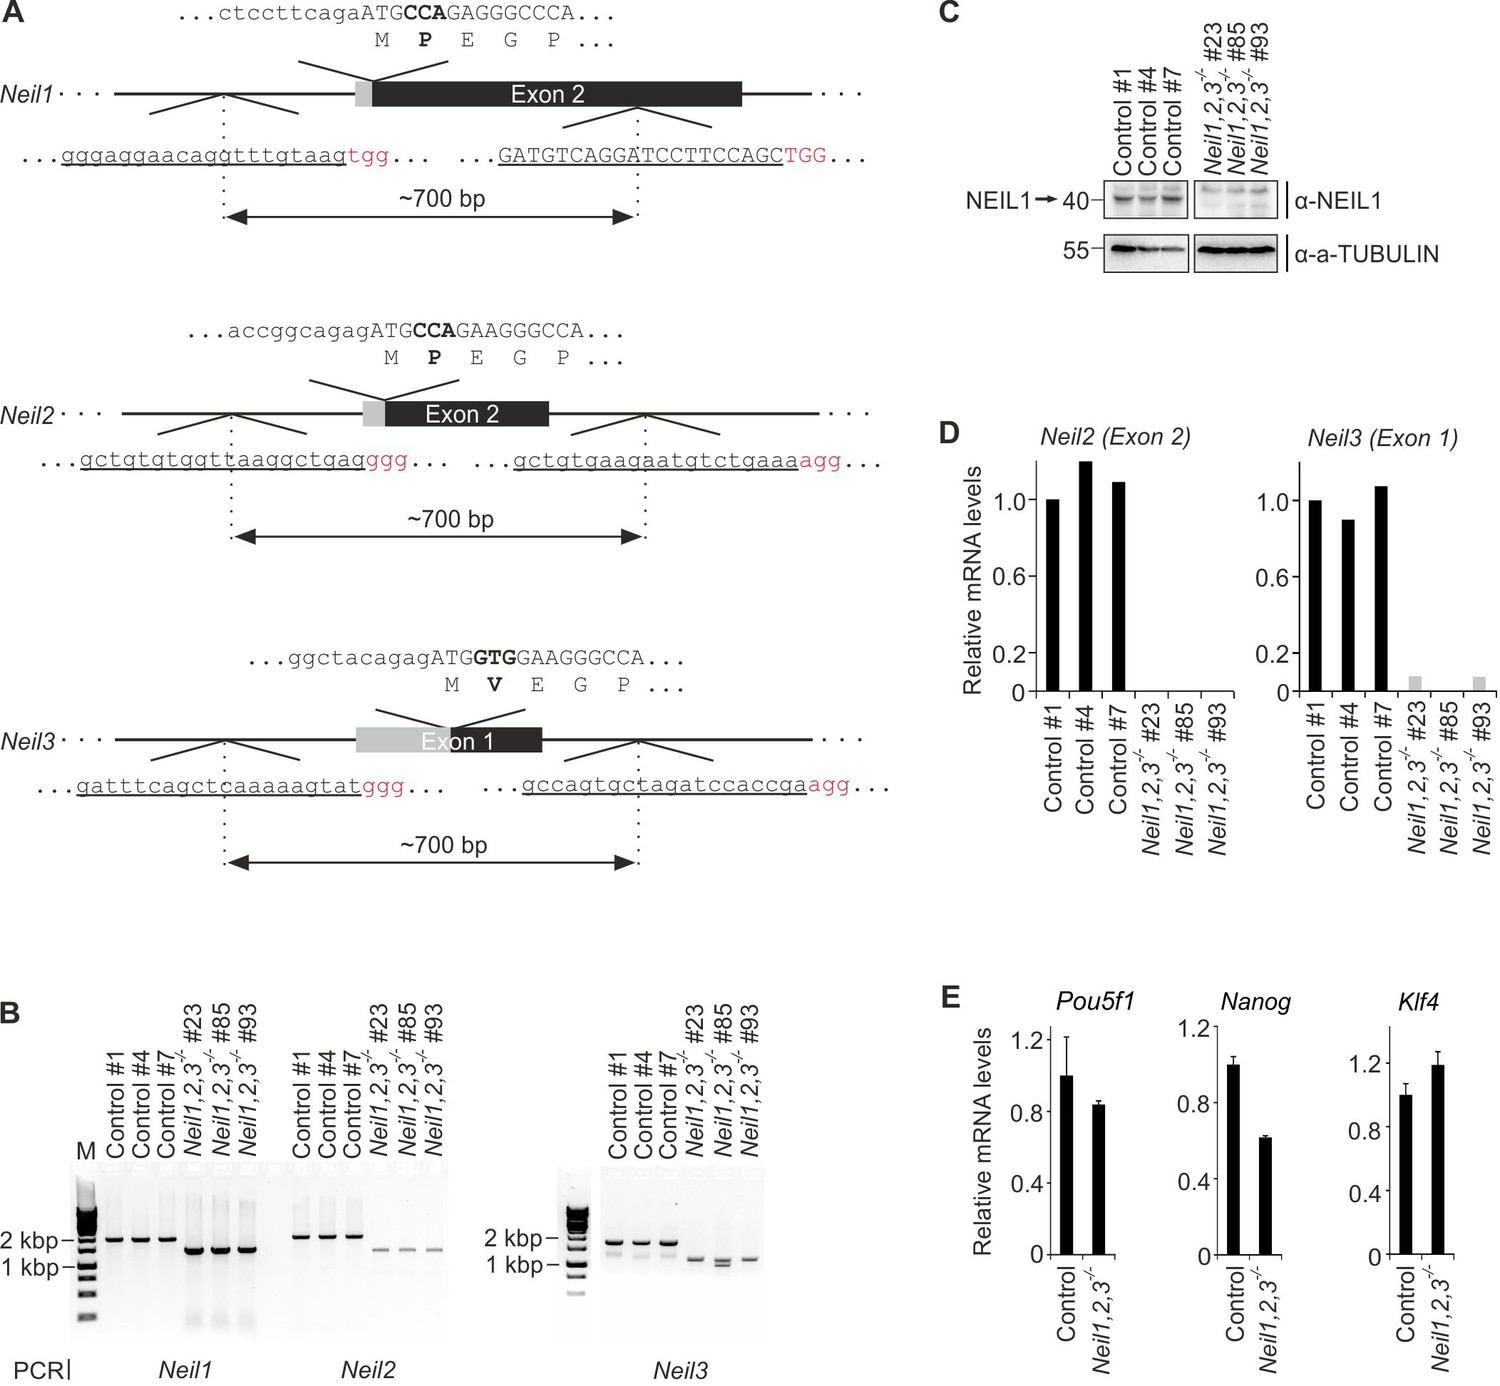
Generation and characterization of Neil-deficient mESCs.
(A) Scheme of CRISPR/Cas9 targeted Neil1 exon 2, Neil2 exon two and Neil3 exon one deletion mutations. To generate genomic deletions, two guide RNAs (underlined, PAM motif highlighted in red) per gene were designed to flank a 700 bp region harboring the coding sequence for the active site residues in NEIL1 (P2), NEIL2 (P2) and NEIL3 (V2), respectively. Coding region of translational start site including amino acid translation is depicted above the respective gene locus with the active site residue and its coding triplet in bold. Coding sequences are schematically shown by black exons and capitalized letters within the sequences. (B) Genotyping PCR of control and Neil1,2,3 triple-deficient mESC lines. Primers flank a ~ 2 kb region around the coding sequence for the active site residue in each gene. Note the smaller PCR products in Neil1,2,3 triple-deficient cells indicative of the expected deletions. (C) Western blot for NEIL1 in control and Neil1,2,3 triple-deficient mESC lines. Alpha (a-) TUBULIN served as loading control. Relative molecular weight of marker proteins [x10−3] is indicated on the left. The NEIL1-specific band is indicated by an arrow. (D) qPCR expression analysis of Neil2 (left panel) and Neil3 (right panel) in control and Neil1,2,3 triple-deficient cell lines. Expression of Neil2 and Neil3 was normalized to Tbp and is relative to control clone #1. (E) qPCR expression analysis of pluripotency genes in control and Neil1,2,3 triple-deficient mESC lines. Expression of genes was normalized to Tbp and is relative to control mESCs (s.d., n = 3 biological replicates with each three technical replicates).
Figure 6—figure supplement 2
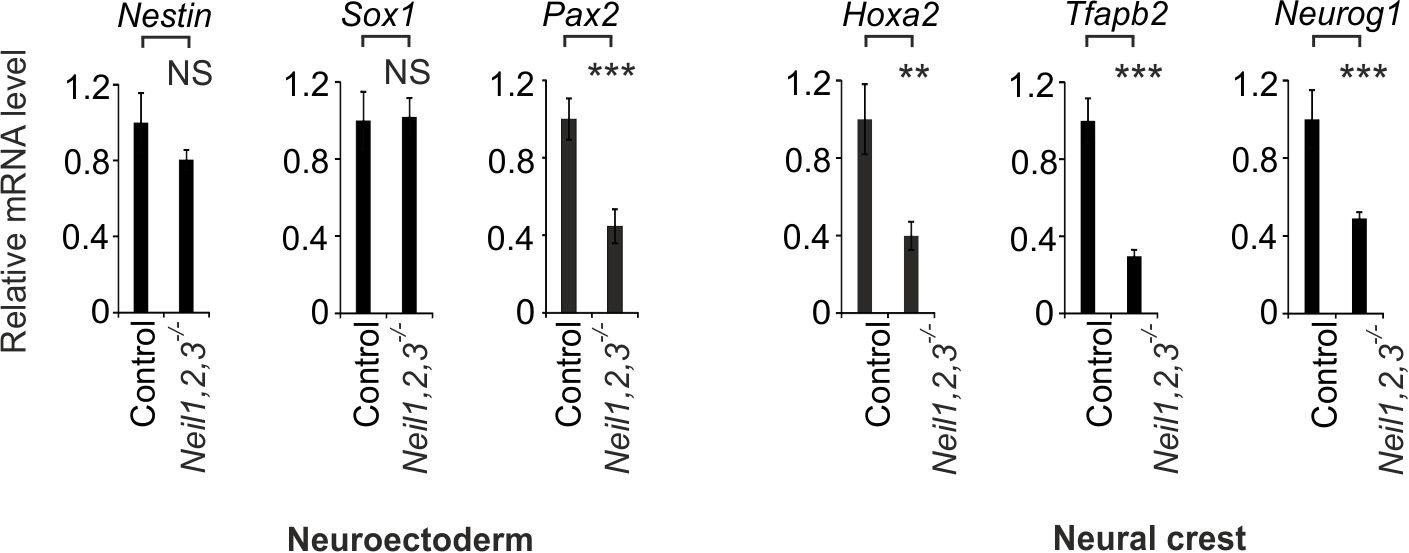
Extended neural and neural crest marker gene analysis in Neil triple-deficient teratomas.
qPCR expression analysis of marker genes for neuroectoderm (Nestin, Sox1, Pax2) and neural crest (Hoxa2, Tfapb2, Neurog1) in control and Neil1,2,3 triple-deficient teratomas. Marker gene expression was normalized to Tbp and is presented relative to control teratomas (mean ±s.d., n = 3 biological replicates with each three technical replicates).
Figure 7 with 4 supplements
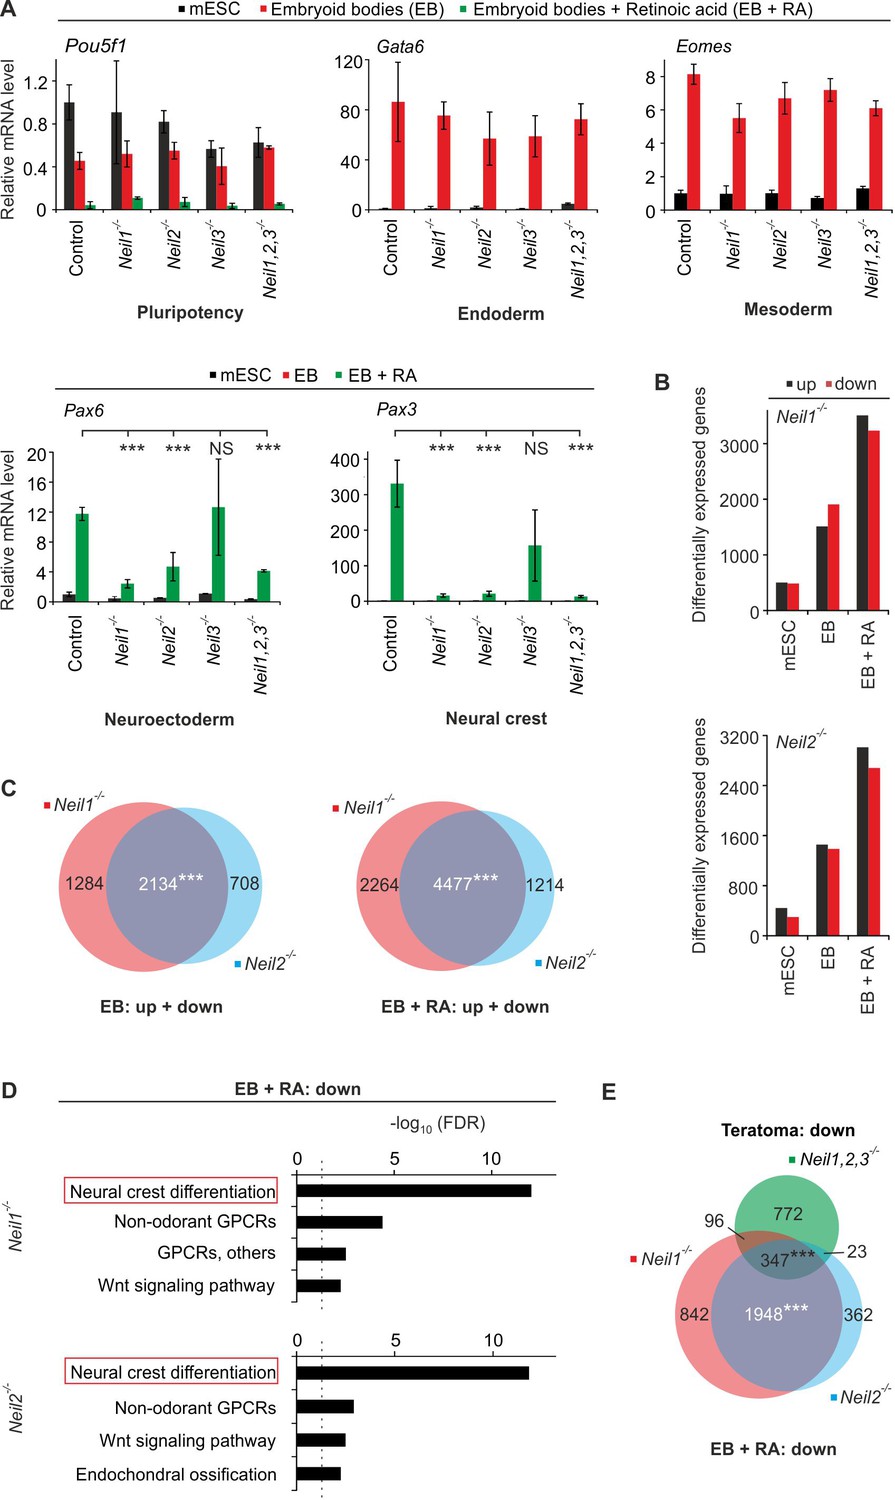
Neil1- and Neil2-deficient mESCs display neural crest cell differentiation defects in vitro.
(A) qPCR expression analysis of pluripotency (Pou5f1), endoderm (Gata6), mesoderm (Eomes), neuroectoderm (Pax6) and neural crest (Pax3) marker genes of the indicated Neil-mutant mESCs. Cells were differentiated into embryoid bodies (EBs) without or with retinoic acid (EBs + RA). Expression of marker genes was normalized to Tbp and is relative to control clones in mESC state. (s.d., n = 3 biological replicates). (B) Quantification of differentially expressed genes in Neil1 and Neil2 single-deficient mESCs, EBs and EBs + RA. (C) Overlap of differentially expressed genes from Neil1 and Neil2 single-deficient EBs (left panel) and EBs + RA (right panel) (D) Pathway enrichment analysis of downregulated genes from Neil1 (upper) and Neil2 (lower panel) single-deficient EBs + RA. Dashed lines indicate the significance threshold FDR = 0.05. (E) Overlap of downregulated genes from Neil1 and Neil2 single-deficient EBs + RA, and downregulated genes from Neil1,2,3-deficient teratomas.
Figure 7—figure supplement 1

Characterization of Neil single-deficient mESCs.
(A) Genotyping PCR of control and Neil1, Neil2 and Neil3 single-deficient mESC lines. Primers flank a ~ 2 kb region around the coding sequence for the active site residue in each gene. Note the smaller PCR products in all single-deficient cells indicative of the expected deletions. For construction see scheme of CRISPR/Cas9 targeting in Figure 6—figure supplement 1A. (B) Western blot for NEIL1 in control and Neil1 single-deficient mESC lines. Alpha (a-) TUBULIN served as loading control. Relative molecular weight of marker proteins [x10−3] is indicated on the left. The NEIL1-specific band is indicated by an arrow. (C) qPCR expression analysis of Neil2 (left panel) and Neil3 (right panel) in control and Neil2 and Neil3 single-deficient cell lines. Expression of Neil2 and Neil3 was normalized to Tbp and is relative to control clone #1. (D) qPCR expression analysis of pluripotency genes in control and Neil1,Neil2 and Neil3 single-deficient mESC lines. Expression of genes was normalized to Tbp and is relative to control mESCs (s.d., n = 3 biological replicates).
Figure 7—figure supplement 2
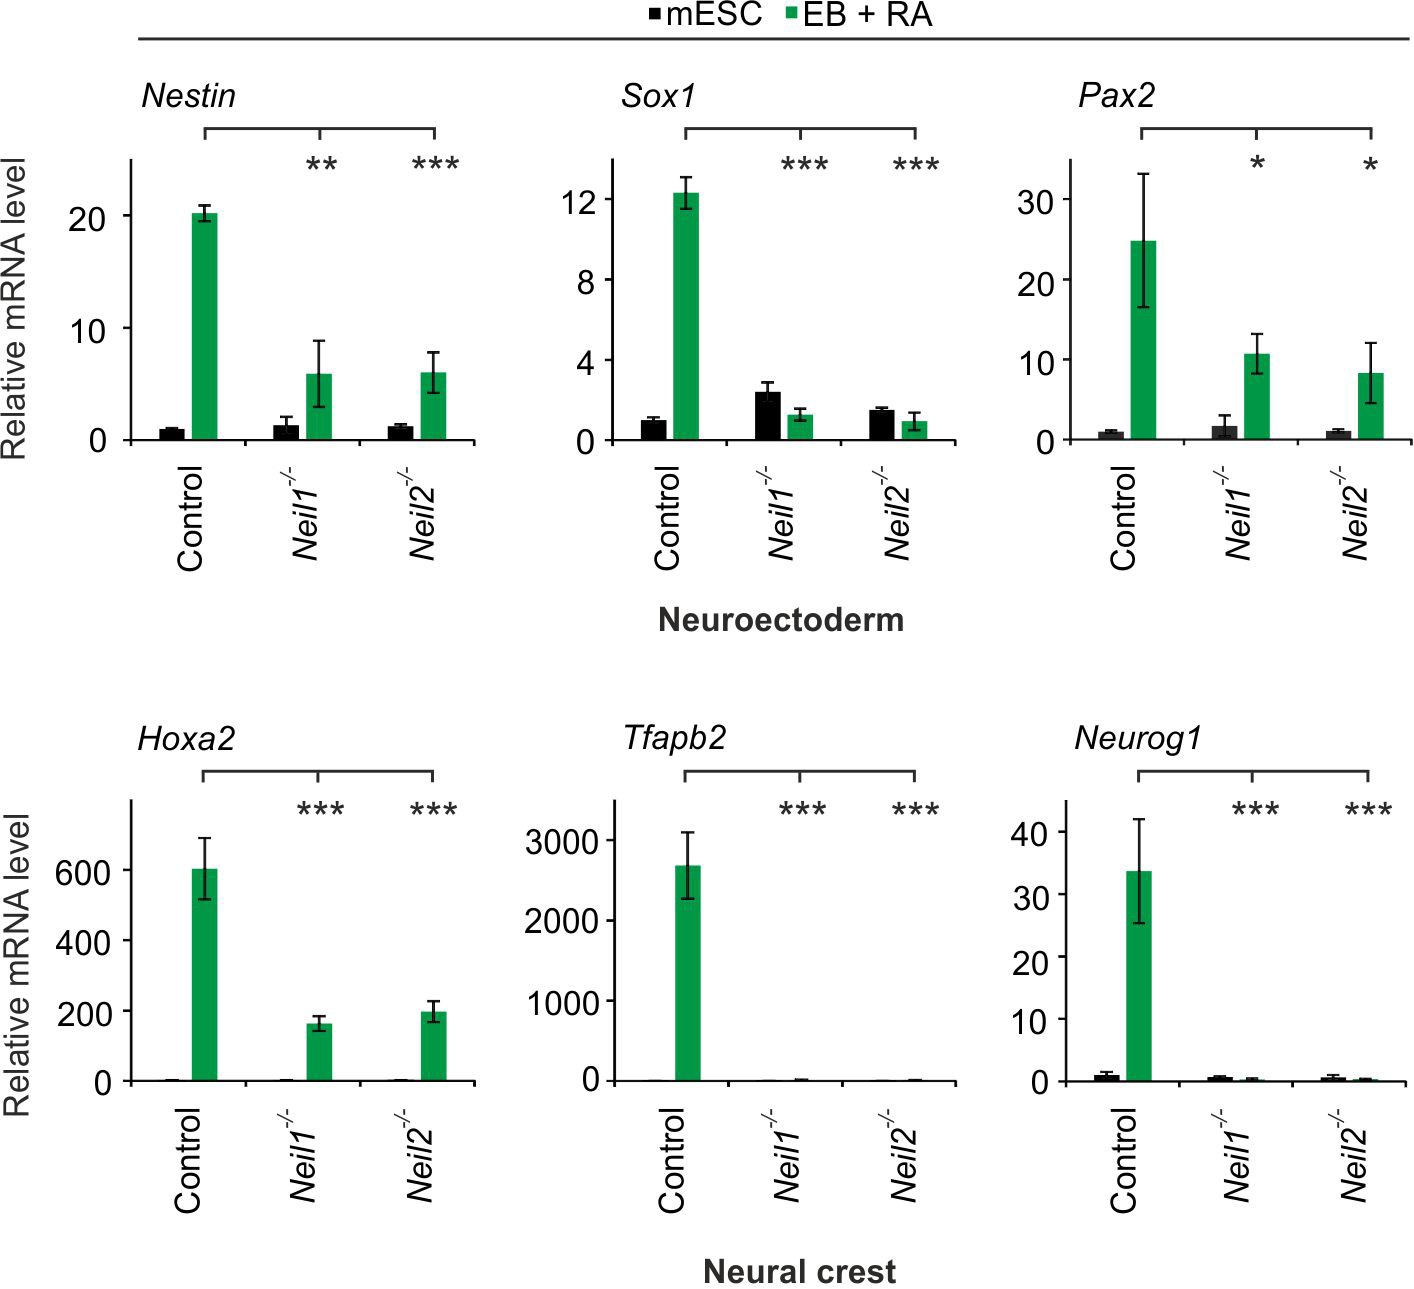
Extended neural and neural crest marker gene analysis in Neil single-deficient EBs + RA.
qPCR expression analysis of marker genes for neuroectoderm (Nestin, Sox1, Pax2) and neural crest (Hoxa2, Tfapb2, Neurog1) in control and Neil1 and Neil2 single-deficient EBs + RA. Marker gene expression was normalized to Tbp and is presented relative to control mESCs (mean ±s.d., n = 3 biological replicates).
Figure 7—figure supplement 3
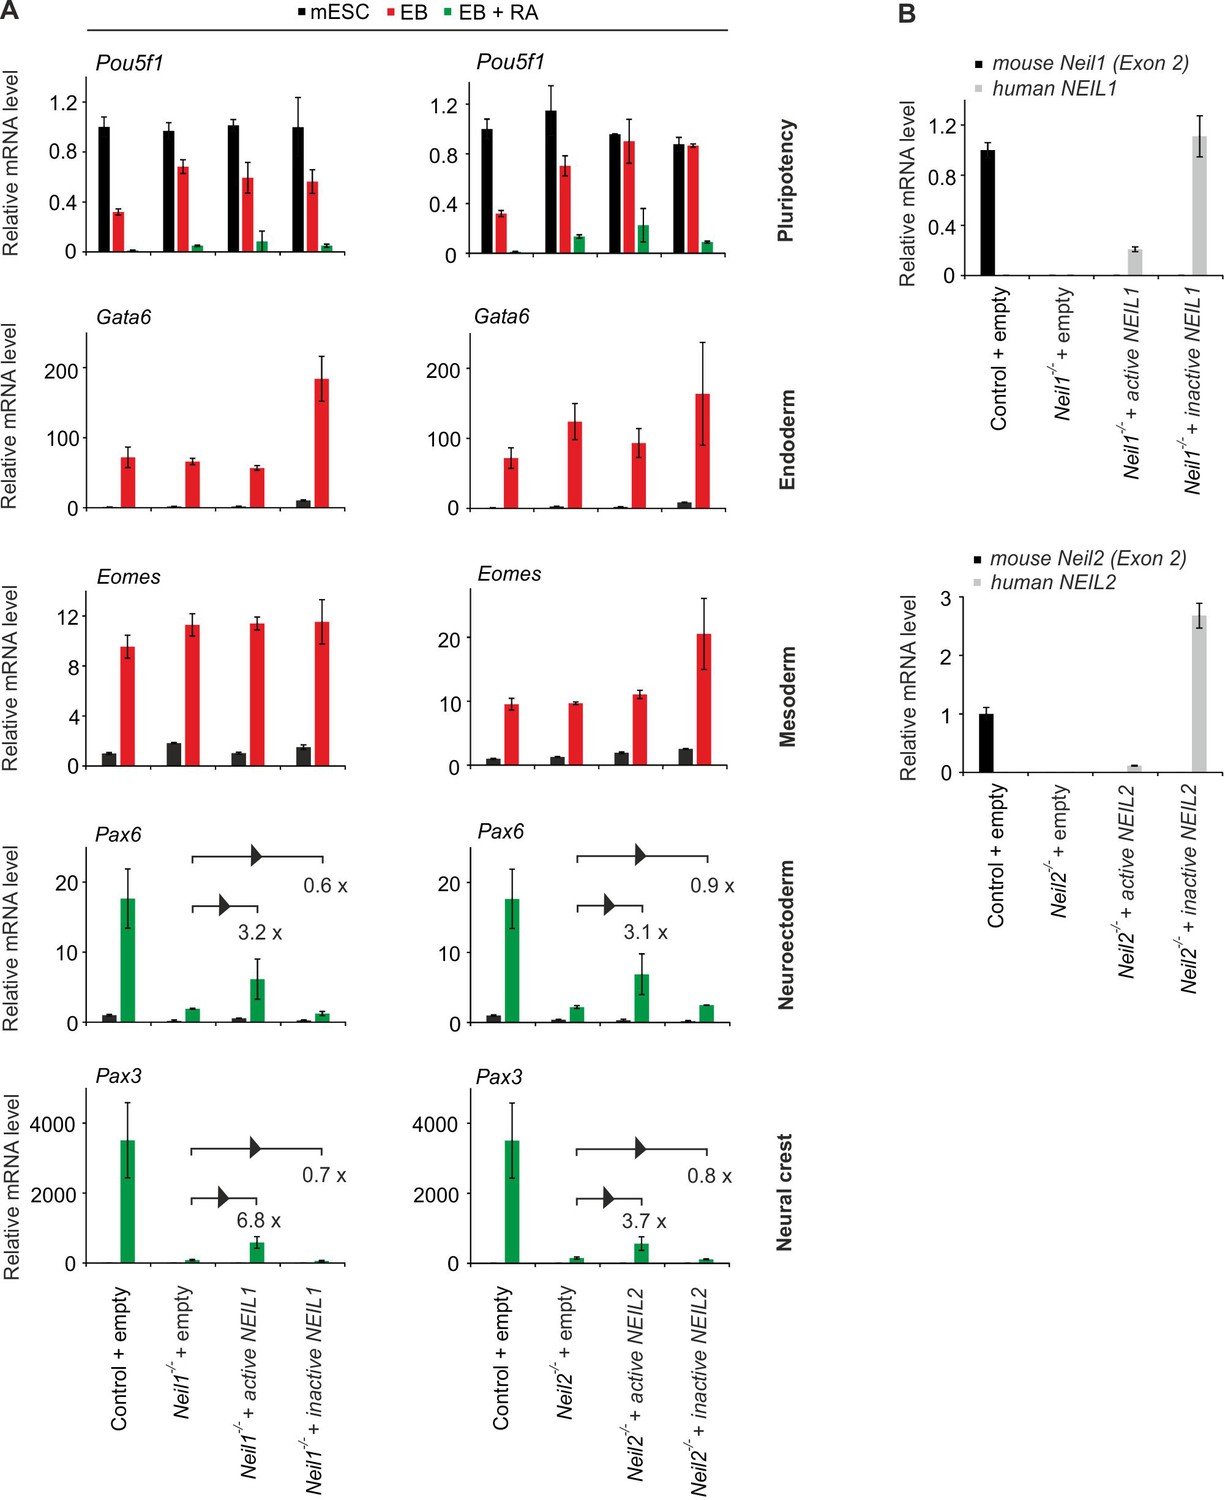
Knockout specificity of Neil-deficient cells.
(A) Right, qPCR expression analysis of pluripotency (Pou5f1), endoderm (Gata6), mesoderm (Eomes), neuroectoderm (Pax6) and neural crest (Pax3) marker genes in control and Neil1-deficient mESCs, EBs and EBs + RA stably transfected with empty vector (control) or human catalytically active and inactive NEIL1 expression constructs, respectively. Left, qPCR expression analysis as on the left but in control and Neil2-deficient cells stably transfected with empty vector or human catalytically active and inactive NEIL2 expression constructs, respectively. Expression of marker genes was normalized to Tbp and is relative to control mESCs. Fold change of Pax6 and Pax3 expression in NEIL-transfected EBs + RA compared to empty vector controls is depicted (s.d., n = 3 biological replicates). (B) qPCR expression analysis of murine Neil1 and human NEIL1 (top panel) and muirne Neil2 and human NEIL2 (bottom panel) in control and Neil1 or Neil2-deficient mESCs stably transfected with vector constructs as described in (A). Gene expression was normalized to Tbp and is relative to mmNeil1 (top panel) and mmNeil2 (bottom panel) in control mESCs (s.d., n = 3 biological replicates).
Figure 7—figure supplement 4

Gene misregulation in Neil-deficient embryoid bodies.
(A) Pathway enrichment analysis of downregulated genes from Neil1 (upper) and Neil2 (lower panel) single-deficient EBs. Dashed lines indicate the significance threshold FDR = 0.05. (B) Overlap of downregulated genes from Neil1 and Neil2 single-deficient EBs, and downregulated genes from Neil1,2,3-deficient teratoma. (C) Pathway enrichment analysis of upregulated genes from Neil1 (upper) and Neil2 (lower panel) single-deficient EBs + RA. Dashed lines indicate the significance threshold FDR = 0.05.
Figure 8 with 1 supplement

Apex1-deficiency leads to neural crest cell differentiation defects.
(A) qPCR expression analysis of pluripotency (Pou5f1), endoderm (Gata6), mesoderm (Eomes), neuroectoderm (Pax6) and neural crest (Pax3) marker genes of control and Apex1-deficient mESCs, EBs and EBs + RA. Expression of marker genes was normalized to Tbp and is relative to control mESCs (s.d., n = 3 technical replicates). (B) Quantification of differentially expressed genes in Apex1-deficient mESCs, EBs and EBs + RA. (C) Overlap of differentially expressed genes from Neil1, Neil2 and Apex1 single-deficient EBs + RA. (D) Pathway enrichment analysis of downregulated genes from Apex1-deficient EBs + RA. Dashed line indicates the significance threshold FDR = 0.05.
Figure 8—figure supplement 1
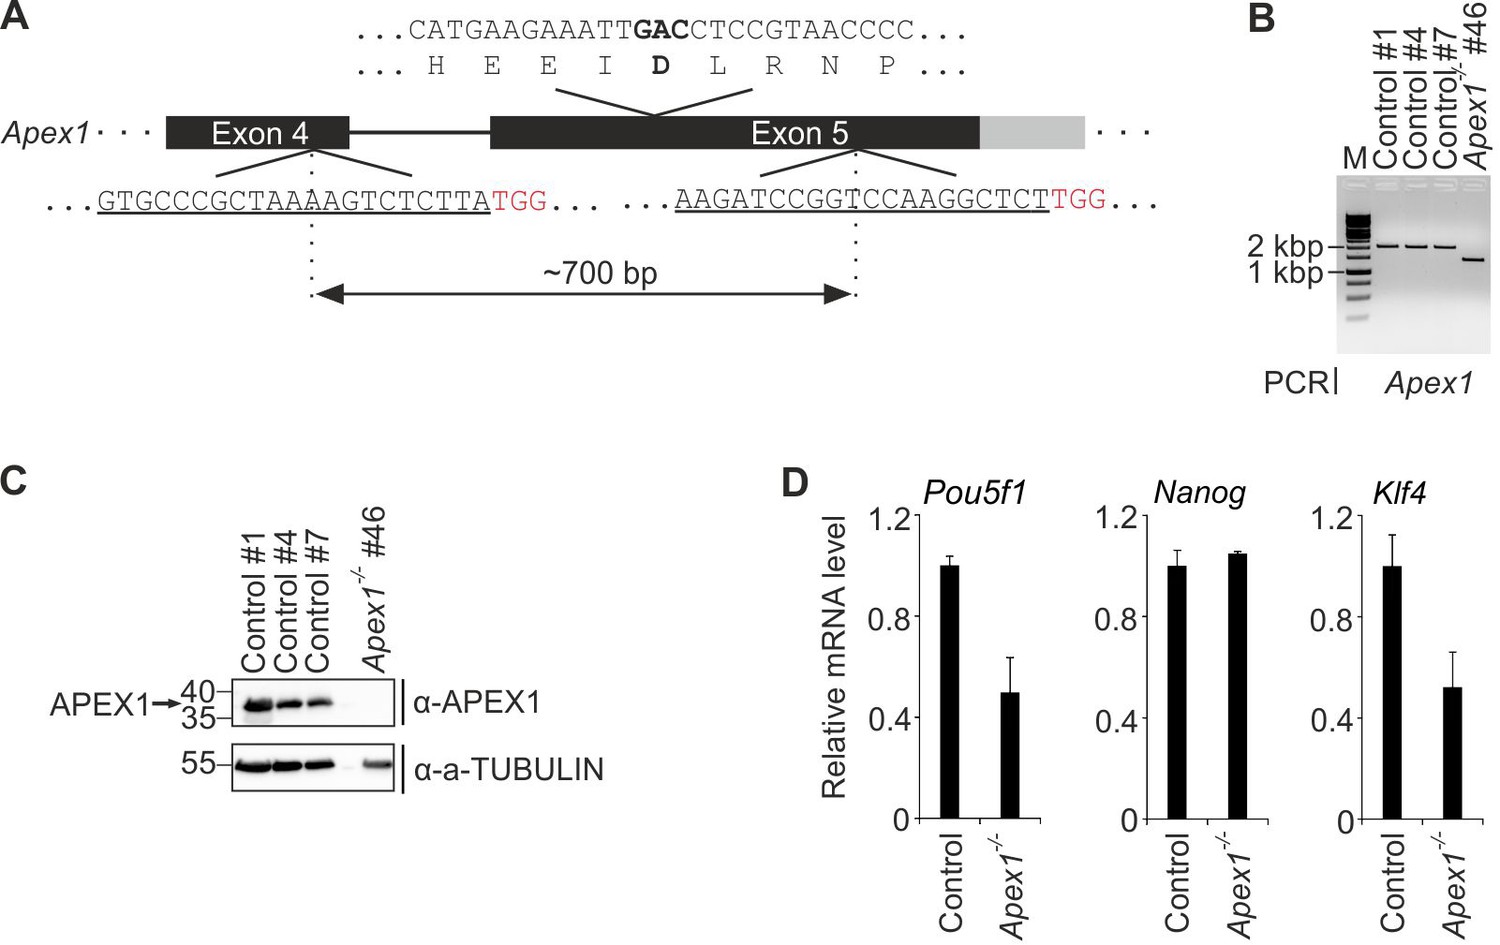
Construction and characterization of Apex1-deficient mESCs.
(A) Scheme of CRISPR/Cas9-targeted Apex1 exon five deletion mutation. To generate a genomic deletion, two guide RNAs (underlined, PAM motif highlighted in red) were designed to flank a 700 bp region harboring the coding sequence for the active site residue in APEX1 (D209). Scheme shows part of exon five coding sequence including amino acid translation above gene locus with the active site residue (D209) and its coding triplet in bold. Coding regions are schematically shown by black exons. (B) Genotyping PCR of control and Apex1-deficient mESC lines. Primers flank a ~ 2.0 kb region around the coding sequence for the active site residue in APEX1. Note the smaller PCR product in the Apex1-deficient line indicative of the expected deletion. (C) Western blot for APEX1 in control and Apex1-deficient mESC lines. Molecular weight of marker proteins [x10−3] is indicated on the left. The APEX1-specific band is indicated by an arrow. Alpha (a-) TUBULIN served as loading control. (D) qPCR expression analysis of pluripotency genes in control and Apex1-deficient mESC lines. Expression of genes was normalized to Tbp and is relative to control lines (s.d., n = 3 technical replicates).
Figure 9 with 2 supplements
Neural differentiation is independent of the role of NEIL DNA glycosylases in oxidative DNA demethylation.
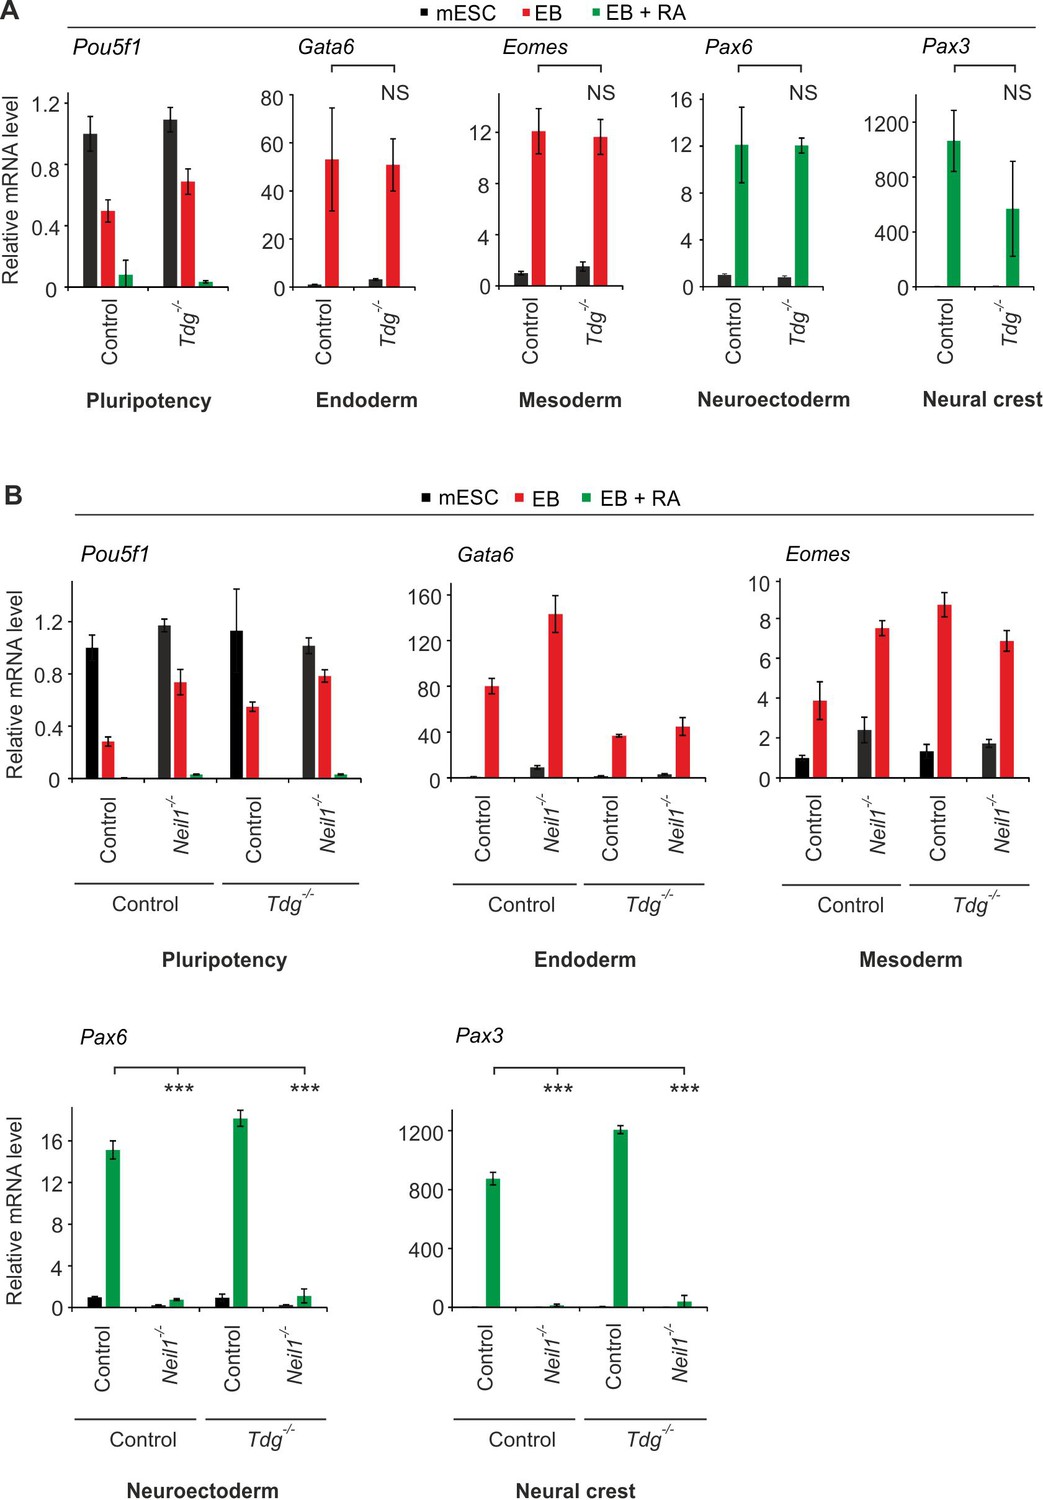
(A) qPCR expression analysis of pluripotency (Pou5f1), endoderm (Gata6), mesoderm (Eomes), neuroectoderm (Pax6) and neural crest (Pax3) marker genes of control and Tdg-deficient mESCs, EBs, and EBs + RA. Expression of marker genes was normalized to Tbp and is relative to control mESCs (s.d., n = 3 technical replicates). (B) qPCR expression analysis as in (A) but of control, Neil1 and Tdg single- and double-deficient mESCs, EBs and EBs + RA. Expression of marker genes was normalized to Tbp and is relative to double-control clone in mESC state (s.d., n = 3 technical replicates).
Figure 9—figure supplement 1
Construction and characterization of TDG-deficient mESCs.
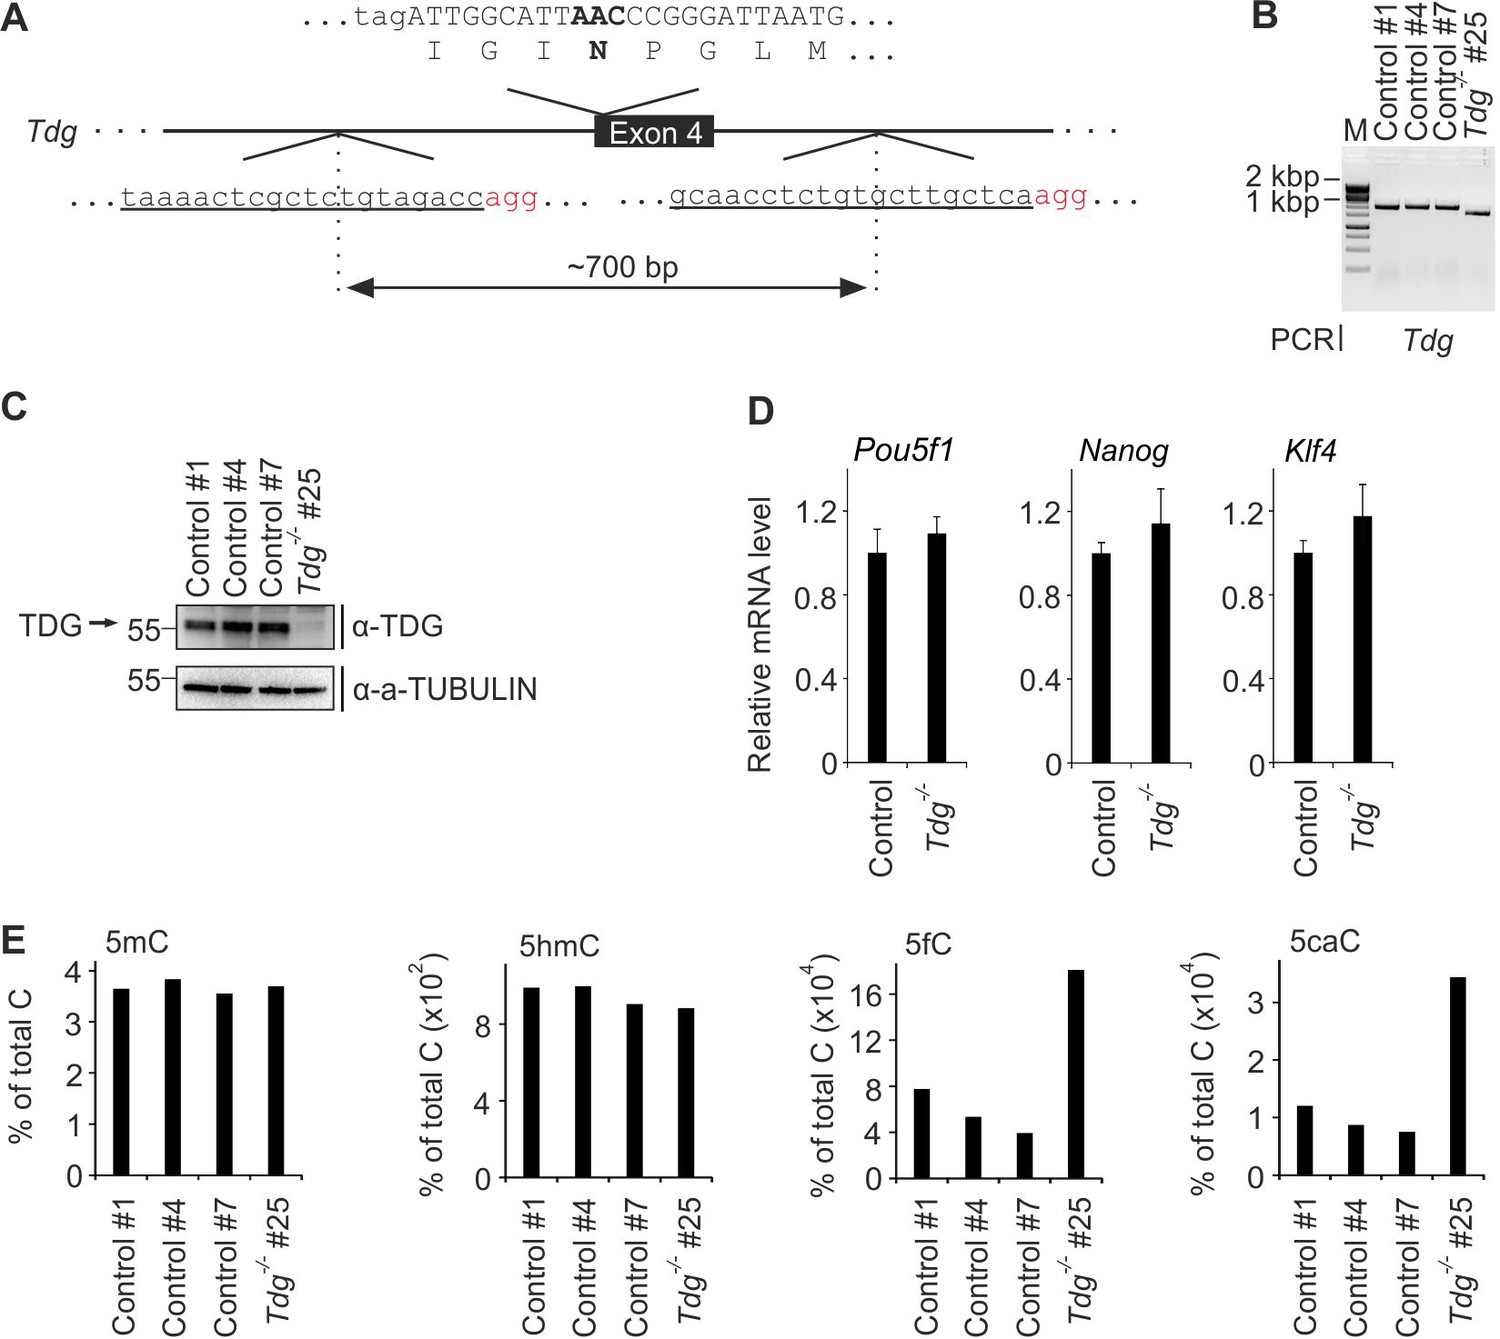
(A) Scheme of CRISPR/Cas9-targeted Tdg exon four deletion mutation. To generate a genomic deletion, two guide RNAs (underlined, PAM motif highlighted in red) were designed to flank a 700 bp region harboring the coding sequence for the active site residue in TDG (N151). Scheme shows part of exon four coding sequence including amino acid translation above the gene locus with the active site residue (N151) and its coding triplet in bold. (B) Genotyping PCR of control and Tdg-deficient mESC lines. Primers flank a ~ 2.0 kb region around the coding sequence for the active site residue in TDG. (C) Western blot for TDG in control and Tdg-deficient mESC lines. Alpha (a-) TUBULIN served as loading control. Molecular weight of marker proteins [x10−3] is indicated on the left. The TDG-specific band is indicated by an arrow. (D) qPCR expression analysis of pluripotency genes in control and Tdg-deficient mESC lines. Expression of genes was normalized to Tbp and is relative of control lines (s.d., n = 3 technical replicates). (E) LC-MS/MS quantification of genomic 5-methylcytosine (5mC), 5-hydroxymethylcytosine (5hmC), 5-formylcytosine (5fC) and 5-carboxylcytosine (5caC) in control and Tdg-deficient mESC lines.
Figure 9—figure supplement 2
Construction and characterization of Neil1/TDG double-deficient mESCs.
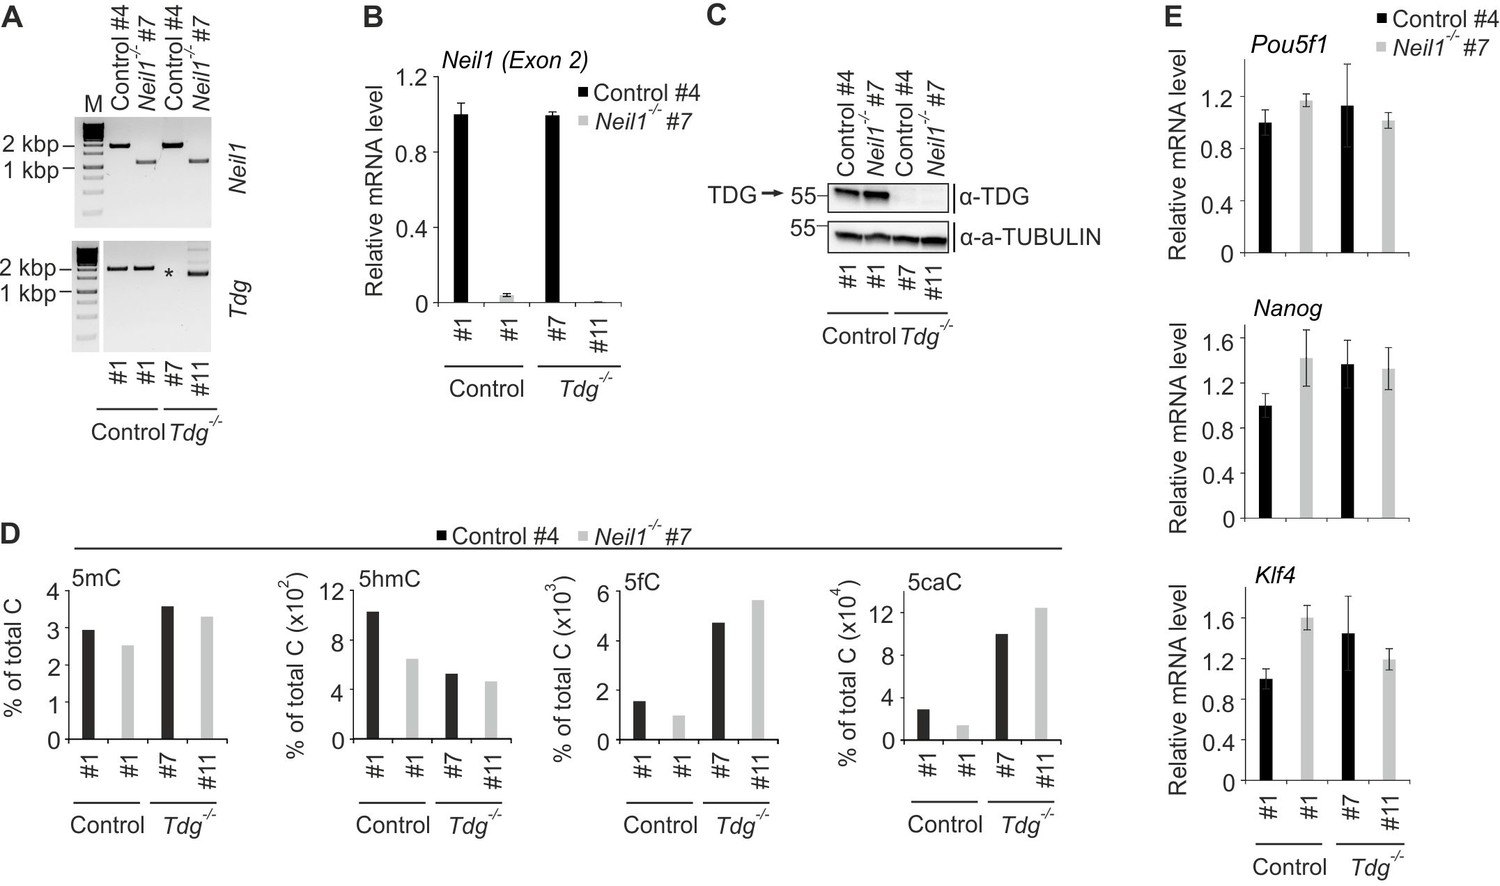
(A) Genotyping PCR of control, Neil1 and Tdg single- and double-deficient mESC lines as indicated. The asterisk indicates missing Tdg locus-specific PCR product in mES clone Control #4/Tdg #7 probably due to a large deletion around the coding sequence for the active site residue in TDG. (B) qPCR expression analysis of Neil1 in control, Neil1 and Tdg single- and double-deficient mESC lines as indicated. Expression of Neil1 was normalized to Tbp and is relative to clone Control #4/Control #1 (s.d., n = 3 technical replicates). (C) Western blot for TDG in control, Neil1 and Tdg single- and double-deficient mESC lines as indicated. Alpha (a-) TUBULIN served as loading control. Molecular weight of marker proteins [x10−3] is indicated on the left. The TDG-specific band is indicated by an arrow. (D) LC-MS/MS quantification of genomic 5-methylcytosine (5mC), 5-hydroxymethylcytosine (5hmC), 5-formylcytosine (5fC), and 5-carboxylcytosine (5caC) in control, Neil1 and Tdg single- and double-deficient mESC lines as indicated. (E) qPCR expression analysis of pluripotency genes in control, Neil1 and Tdg single- and double-deficient mESC lines as indicated. Expression of genes was normalized to Tbp and is relative to clone Control #4/Control #1 (s.d., n = 3 technical replicates).
Figure 10
Oxidative stress impairs cNCC differentiation in mESCs.
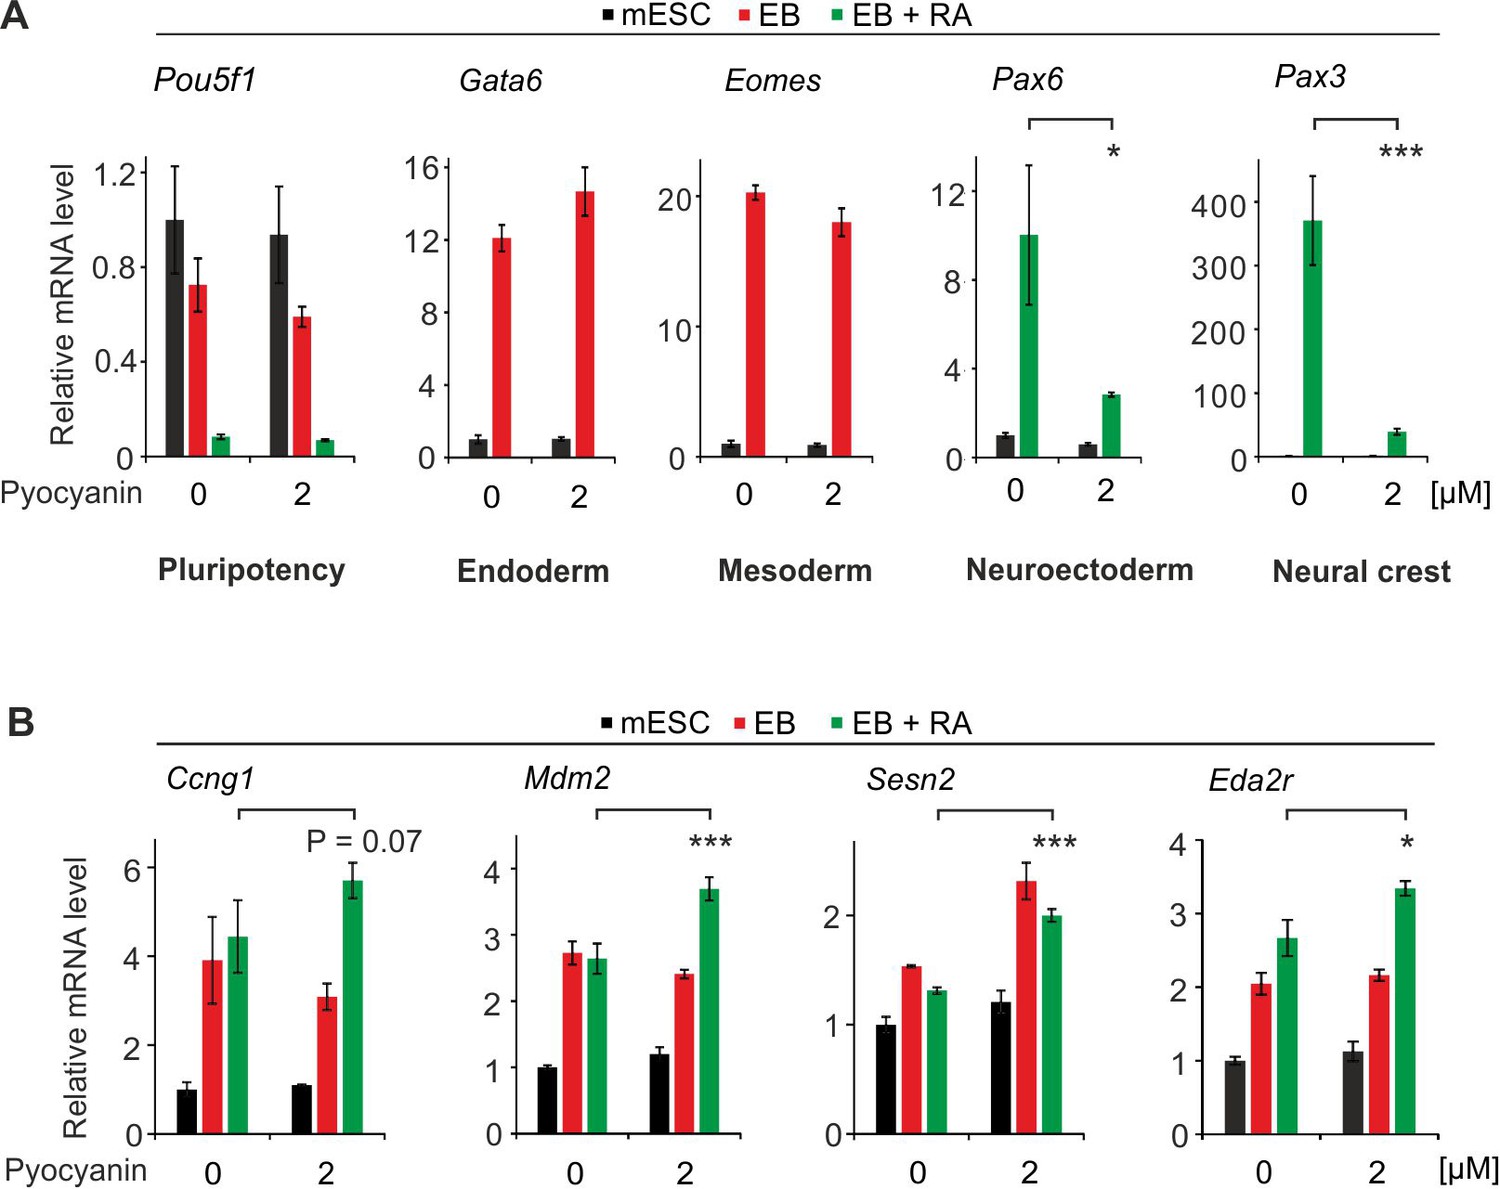
(A) qPCR expression analysis of pluripotency (Pou5f1), endoderm (Gata6), mesoderm (Eomes), neuroectoderm (Pax6) and neural crest (Pax3) marker genes of mock and pyocyanin-treated control mESCs, EBs and EBs + RA. Expression of marker genes was normalized to Tbp and is relative to mock-treated mESCs (s.d., n = 3 technical replicates). (B) qPCR expression analysis as in (A) but of selected TP53 target genes of mock (DMSO) and pyocyanin-treated control mESCs, EBs and EBs + RA.
Figure 11 with 1 supplement
Oxidative mtDNA damage and mitochondrial dysfunction in Neil1- and Neil2-deficient embryoid bodies.
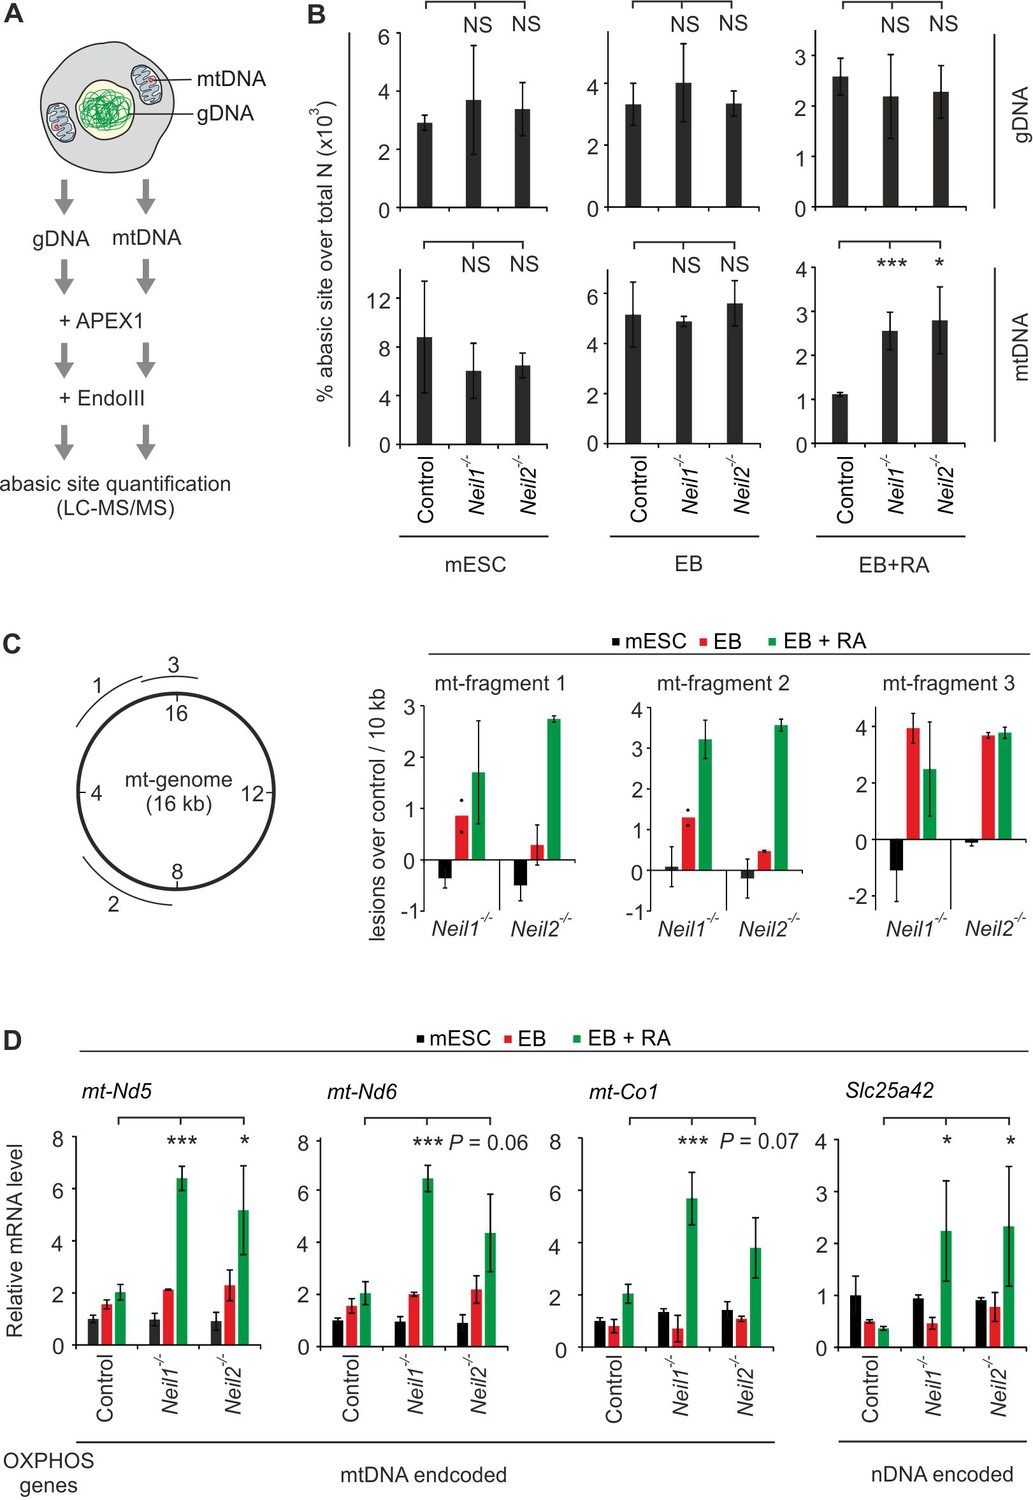
(A) Workflow to quantify oxidative base lesions in DNA. Isolated genomic and mtDNA is consecutively treated with recombinant APEX1 and EndoIII to monitor endogenous EndoIII-processed oxidative base damages by LC-MS/MS. (B) LC-MS/MS quantification of base lesions as described in (A) using gDNA and mtDNA of control, Neil1- and Neil2-deficient mESCs, EBs and EBs + RA as indicated (s.d., n = 3 biological replicates). Abasic site levels are presented in percent of total amount of nucleotides (N). (C) Left, position of the mitochondrial (mt-) genomic fragments tested for DNA damage (1-3) relative to the nucleotide annotation of the mt genome (inner circle numbers in kb). Right, mtDNA damage in mt-fragments 1–3 in Neil1- and Neil2-deficient mESCs, EBs and EBs + RA, respectively, calculated as lesions over control in 10 kb (s.d., n = 3 biological replicates). Note, a negative value corresponds to less damage in Neil-deficient compared to control cells. (D) qPCR expression analysis of genes for oxidative phosphorylation (OXPHOS) encoded either on mitochondrial (mt-) or nuclear (n-) DNA in control, Neil1 and Neil2 single-mutant mESCs, EBs and EBs + RA. Expression of marker genes was normalized to Tbp and is relative to control mESCs (s.d., n = 3 biological replicates).
Figure 11—figure supplement 1

LC-MS/MS analysis of abasic sites in gDNA and mtDNA of Neil1- and Neil2-deficient cells.
(A) qPCR analysis following isolation of mtDNA from mESCs, using primers specific for either genomic or mitochondrial DNA sequences. Fold enrichment was calculated by 2-(ΔΔCp) and is normalized to the gDNA isolation (s.d., n = 3 technical replicates). (B) Workflow to quantify oxidative base lesions in DNA. Isolated genomic and mtDNA is either not-treated or treated with recombinant APEX1 and EndoIII to monitor endogenous abasic sites or EndoIII-processed oxidative base damages, respectively. (C) LC-MS/MS quantification of abasic sites in synthetic oligonucleotides treated or not with APEX1 and Endonuclease (Endo) III as indicated (s.d., n = 3 technical replicates).’ Control’ corresponds to an unmodified 40 bp oligo, ‘AP + 5hU’ is a mixture of unmodified 40 bp oligo with 2% of an AP site containing- and 5% of a 5hU-containing 40 bp oligo. The theoretical expected increase of abasic sites in the mock-treated mixture over control is 0.025% of total nucleotides (N). The maximum gain of abasic sites by Endo III-treatment of the mixture is 0.063% of total N. Abasic site levels are presented in percent of total N. Note that the unmodified oligo bears a background value of 0.013% abasic site over total N. (D) LC-MS/MS-based quantification of abasic sites in gDNA from control mESCs (s.d., n = 3 technical replicates). DNA was mock treated or incubated with APEX1 with or without subsequent Endo III treatment as indicated. Abasic site levels are presented in percent of total N. Gain of abasic sites after EndoIII-treatment of APEX1-pretreated gDNA (=endogenous EndoIII-reactive base damages) is shown. (E) LC-MS/MS-based quantification of abasic sites as described in (B) without APEX1 and EndoIII-treatment (=endogenous abasic sites) using gDNA and mtDNA of control, Neil1- and Neil2-deficient mESCs, EBs and EBs + RA as indicated (s.d., n = 3 biological replicates). Abasic site levels are presented in percent of total N.
Figure 12 with 2 supplements
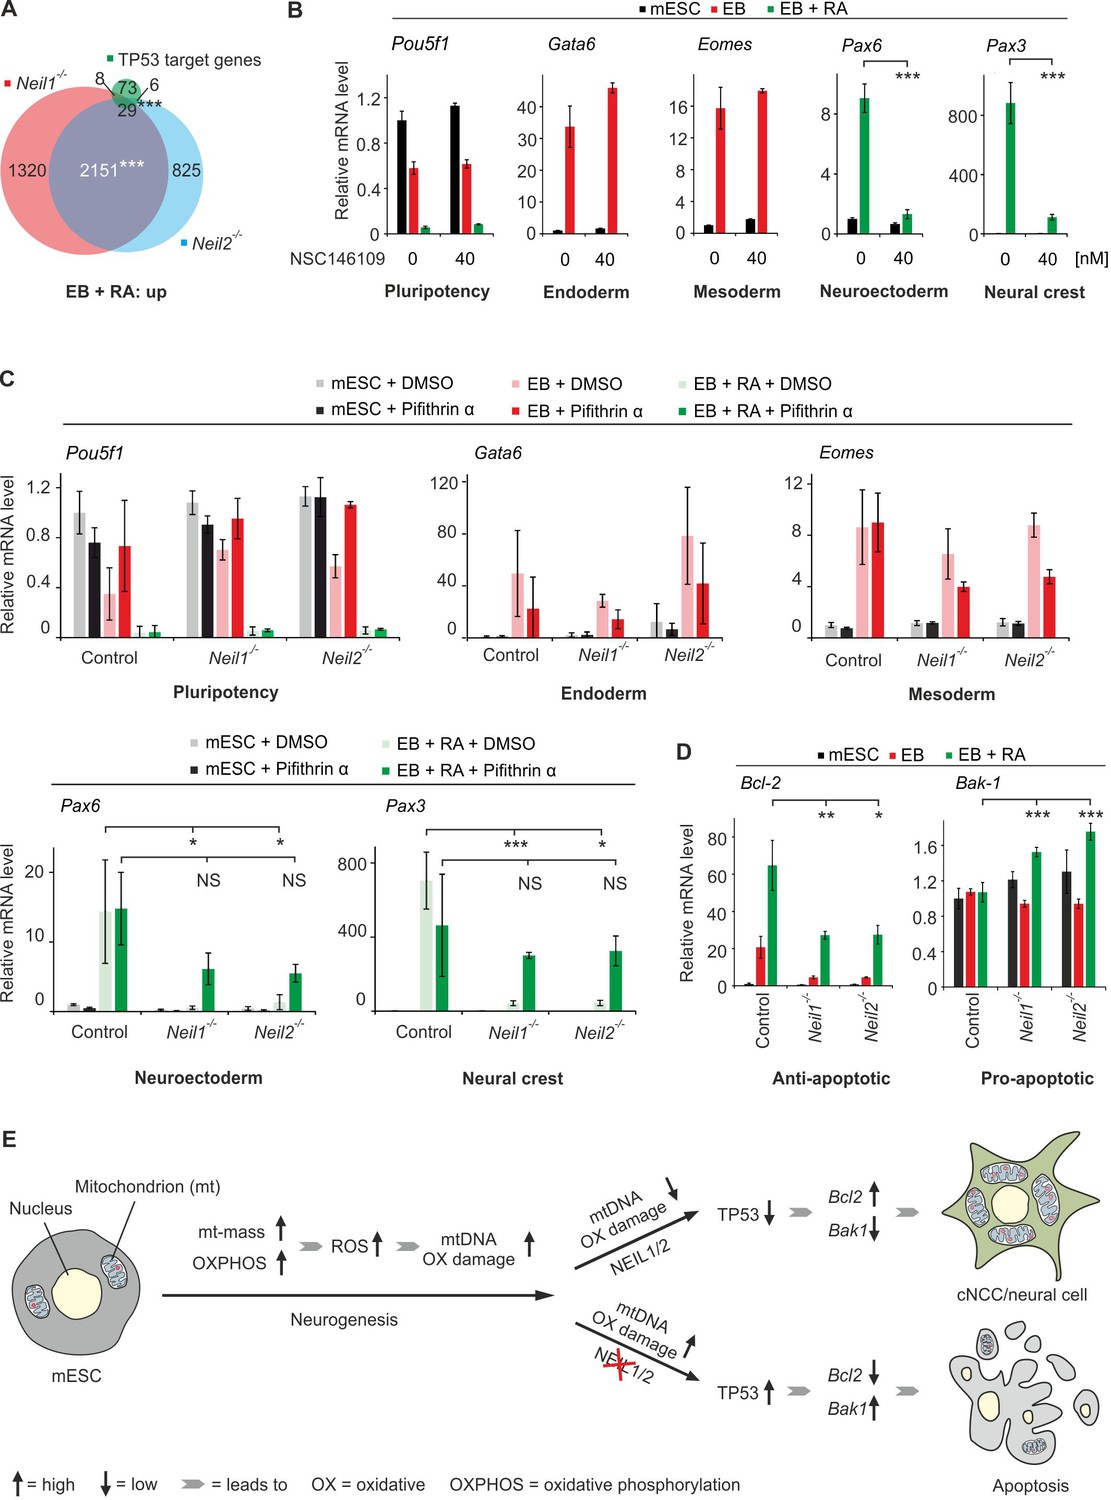
Neil-deficiency induces a TP53-mediated intrinsic apoptosis in embryoid bodies.
(A) Overlap of upregulated genes from Neil1 and Neil2 single-deficient EBs + RA, and 116 direct TP53 target genes (Fischer, 2017). (B) qPCR expression analysis of the indicated marker genes in mock (DMSO) and NSC 146109- (TP53 stabilizer) treated control mESCs, EBs and EBs + RA. Expression of marker genes was normalized to Tbp and is relative to mock-treated mESCs (s.d., n = 3 technical replicates). (C) qPCR expression analysis of marker genes as in (B) in control, Neil1 and Neil2 single-mutant mESCs, EBs and EBs + RA treated with 50 µM Pifithrin-α or mock treated (DMSO). Expression of marker genes was normalized to Tbp and is relative to mock-treated control mESCs (s.d., n = 3 biological replicates). (D) qPCR expression analysis of Bcl-2 and Bak-1 in Neil1 and Neil2 single-deficient mESCs, EBs and EBs + RA. Expression of both genes was normalized to Tbp and is relative to control mESC clones (s.d., n = 3 biological replicates). (E) Model for the role of NEIL1 and NEIL2 in mESC differentiation towards cNCC/neural cells. Neurogenesis is accompanied by a metabolic switch from glycolysis to oxidative phosphorylation, a concomitant increase in mass and number of mitochondria per cell and hence escalated oxidative stress. High ROS levels render neural and neural crest cells particularly vulnerable to oxidative DNA damage and thus dependent on efficient damage repair, including by NEIL1 and NEIL2. Upon NEIL-deficiency, oxidative mtDNA damage induces apoptosis impairing neural and neural crest differentiation. ROS, reactive oxygen species.
Figure 12—figure supplement 1
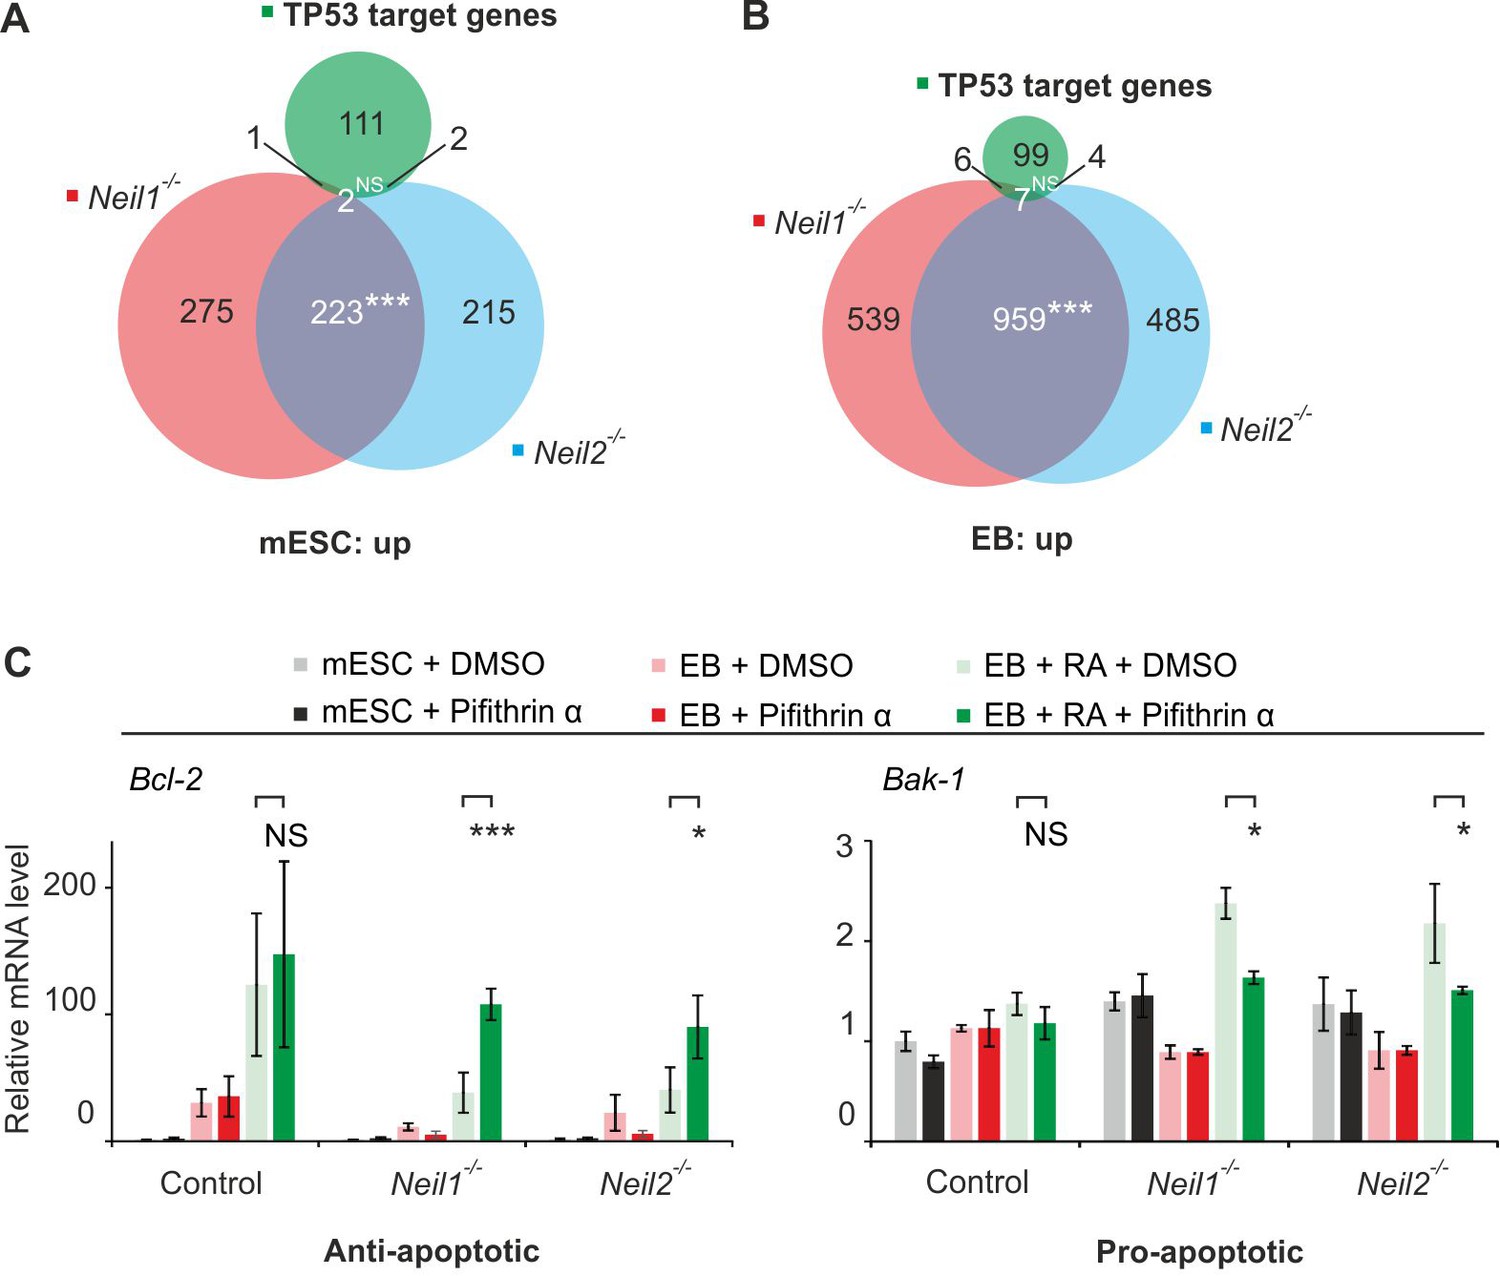
TP53 response in Neil-deficient cells.
(A) Overlap of upregulated genes from Neil1 and Neil2 single-deficient mESCs, and 116 TP53 target genes (Fischer, 2017). (B) Overlap of upregulated genes from Neil1 and Neil2 single-deficient EBs, and 116 TP53 target genes (Fischer, 2017). (C) qPCR expression analysis of Bcl2 and Bak1 in control, Neil1 and Neil2 single-mutant mESCs, EBs and EBs + RA treated with 50 µM Pifithrin-α or mock treated (DMSO). Expression of both genes was normalized to Tbp and is relative to mock-treated control mESCs (s.d., n = 3 biological replicates).
Figure 12—figure supplement 2
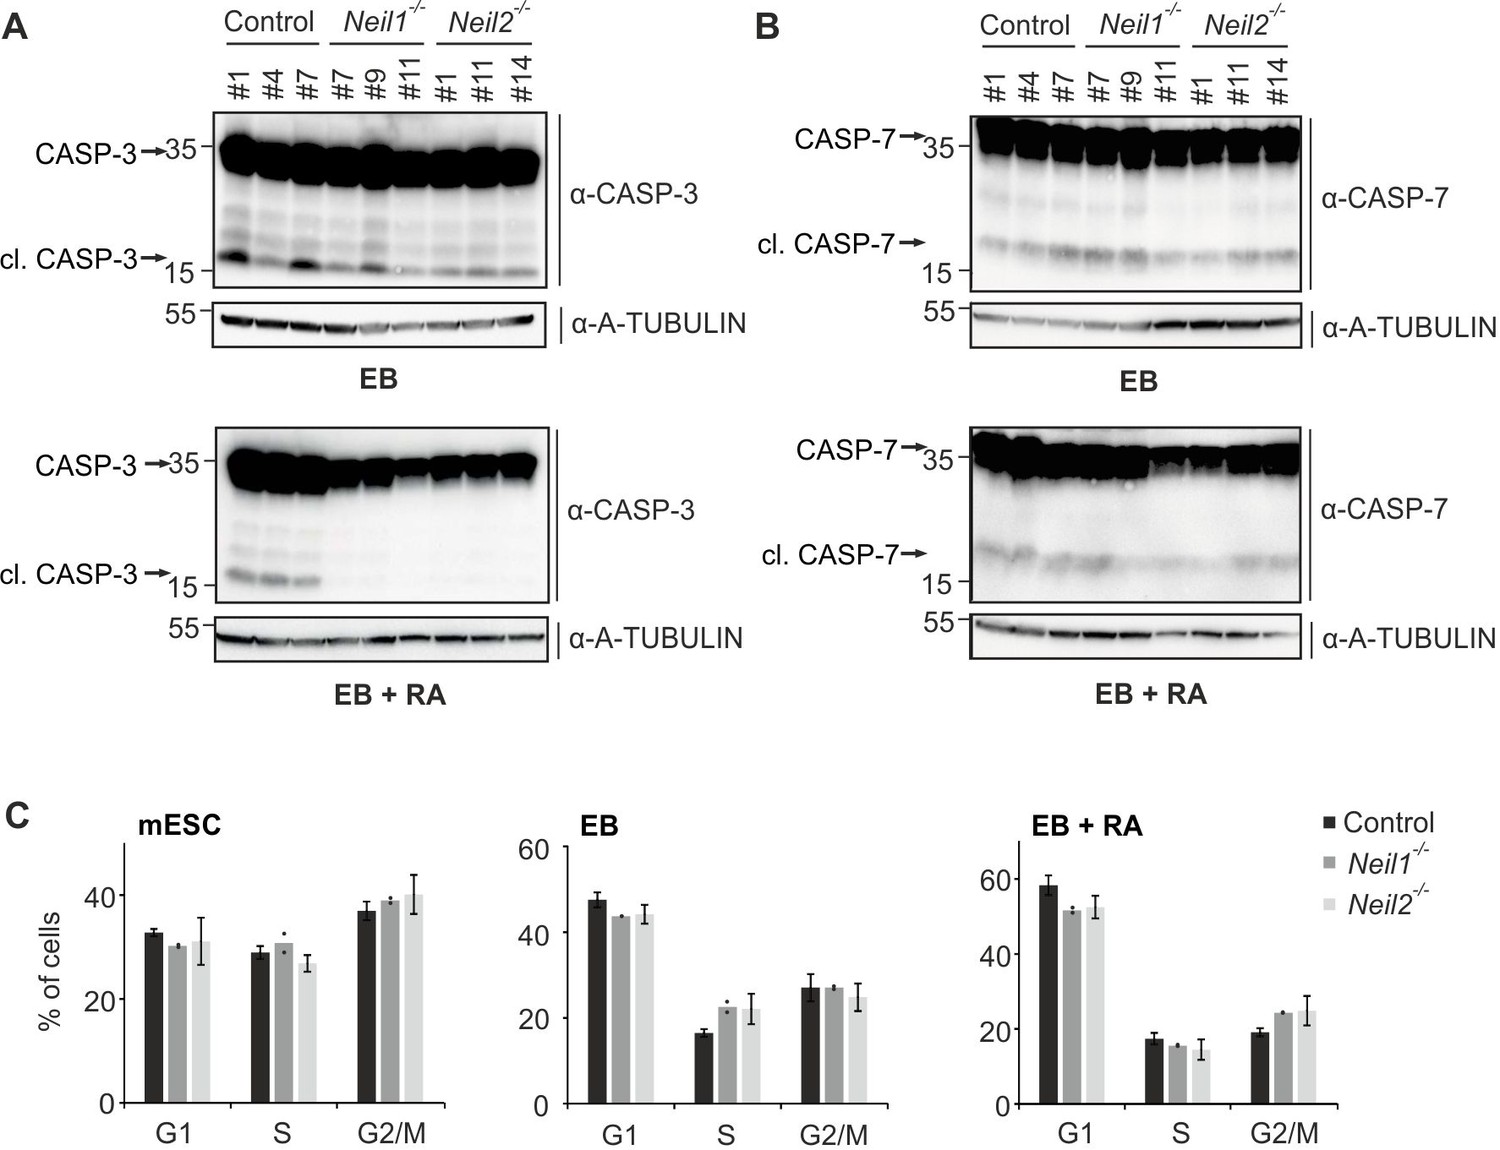
CASPASE levels and cell cycle profiles of Neil-deficient cells.
(A) Western blot analysis for CASPASE-3 in control, Neil1 and Neil2-mutant EBs and EBs + RA. Molecular weight of marker proteins [x10−3] is indicated on the left. Uncleaved and cleaved (active) CASPASE-3 are indicated. Alpha (a-) TUBULIN served as loading control. (B) Western blot analysis as in (A) but for CASPASE-7. (C) Cell cycle profiles of control, Neil1- and Neil2-mutant mESCs, EBs and EBs + RA assessed by flow cytometry analysis (s.d., n = 3 biological replicates).
Tables
Key resources table
| Reagent type (species) or resource | Designation | Source or reference | Identifiers | Additional information |
|---|---|---|---|---|
| Gene (Homo sapiens) | NEIL1 | ORFeome clone collection | BC010876.1 | |
| Gene (Homo sapiens) | NEIL2 | ORFeome clone collection | BC013964.2 | |
| Gene (Homo sapiens) | APEX1 | ORFeome clone collection | BC008145.1 | |
| Gene (Xenopus tropicalis) | bcl2l1 | Dharmacon | MXT1765-202788918 | |
| Strain, strain background (Xenopus laevis) | Xenopus leavis | Nasco | not available | |
| Cell line (Mus musculus) | E14TG2a | ATCC | CRL-1821 | murine embryonic stem cells |
| Cell line (Mus musculus) | E14TG2a clone Control #1 | this paper | generated from E14TG2a | |
| Cell line (Mus musculus) | E14TG2a clone Control #4 | this paper | generated from E14TG2a | |
| Cell line (Mus musculus) | E14TG2a clone Control #7 | this paper | generated from E14TG2a | |
| Cell line (Mus musculus) | E14TG2a clone Neil1,2,3-/- #23 | this paper | generated from E14TG2a | |
| Cell line (Mus musculus) | E14TG2a clone Neil1,2,3-/- #85 | this paper | generated from E14TG2a | |
| Cell line (Mus musculus) | E14TG2a clone Neil1,2,3-/- #93 | this paper | generated from E14TG2a | |
| Cell line (Mus musculus) | E14TG2a clone Neil1-/- #7 | this paper | generated from E14TG2a | |
| Cell line (Mus musculus) | E14TG2a clone Neil1-/- #9 | this paper | generated from E14TG2a | |
| Cell line (Mus musculus) | E14TG2a clone Neil1-/- #11 | this paper | generated from E14TG2a | |
| Cell line (Mus musculus) | E14TG2a clone Neil2-/- #1 | this paper | generated from E14TG2a | |
| Cell line (Mus musculus) | E14TG2a clone Neil2-/- #11 | this paper | generated from E14TG2a | |
| Cell line (Mus musculus) | E14TG2a clone Neil2-/- #14 | this paper | generated from E14TG2a | |
| Cell line (Mus musculus) | E14TG2a clone Neil3-/- #3 | this paper | generated from E14TG2a | |
| Cell line (Mus musculus) | E14TG2a clone Neil3-/- #23 | this paper | generated from E14TG2a | |
| Cell line (Mus musculus) | E14TG2a clone Neil3-/- #28 | this paper | generated from E14TG2a | |
| Cell line (Mus musculus) | E14TG2a clone Apex1-/- #46 | this paper | generated from E14TG2a | |
| Cell line (Mus musculus) | E14TG2a clone Tdg-/- #25 | this paper | generated from E14TG2a | |
| Cell line (Mus musculus) | E14TG2a clone Control #4 + Control #1 | this paper | generated from E14TG2a clone Control #4 | |
| Cell line (Mus musculus) | E14TG2a clone Neil1-/- #7 + Control #1 | this paper | generated from E14TG2a clone Neil1-/- #7 | |
| Cell line (Mus musculus) | E14TG2a clone Control #4 + Tdg-/- #7 | this paper | generated from E14TG2a clone Control #4 | |
| Cell line (Mus musculus) | E14TG2a clone Neil1-/- #7 + Tdg-/- #11 | this paper | generated from E14TG2a clone Neil1-/- #7 | |
| Cell line (Mus musculus) | E14TG2a clone Control #4 + pcDNA3.1_empty | this paper | generated from E14TG2a clone Control #4 | |
| Cell line (Mus musculus) | E14TG2a clone Neil1-/- #7 + pcDNA3.1_empty | this paper | generated from E14TG2a clone Neil1-/- #7 | |
| Cell line (Mus musculus) | E14TG2a clone Neil1-/- #7 + pcDNA3.1_NEIL1-2xFLAG (active) | this paper | generated from E14TG2a clone Neil1-/- #7 | |
| Cell line (Mus musculus) | E14TG2a clone Neil1-/- #7 + pcDNA3.1_2xFLAG-NEIL1 (inactive) | this paper | generated from E14TG2a clone Neil1-/- #7 | |
| Cell line (Mus musculus) | E14TG2a clone Neil2-/- #11 + pcDNA3.1_empty | this paper | generated from E14TG2a clone Neil2-/- #11 | |
| Cell line (Mus musculus) | E14TG2a clone Neil2-/- #11 + pcDNA3.1_NEIL2-2xFLAG (active) | this paper | generated from E14TG2a clone Neil2-/- #11 | |
| Cell line (Mus musculus) | E14TG2a clone Neil2-/- #11 + pcDNA3.1_2xFLAG-NEIL2 (inactive) | this paper | generated from E14TG2a clone Neil2-/- #11 | |
| Antibody | mouse monoclonal anti-alpha tubulin | Sigma | T5168 | (1: 1000) |
| Antibody | rabbit polyclonal anti-NEIL1 | Abcam | ab21337 (discontinued) | (1: 500) |
| Antibody | rabbit polyclonal anti-NEIL2 | Abcam | ab124106 (discontinued) | (1: 1000) |
| Antibody | rabbit polyclonal anti-APE1 | Abcam | ab137708 | (1: 1000) |
| Antibody | rabbit polyclonal anti-phospho-Chk1 (Ser345) | Cell Signaling | #2341 | (1: 1000) |
| Antibody | mouse monoclonal anti-p53 (X77) | Thermo Fisher Scientific | MA1-12549 | (1: 1000) |
| Antibody | rabbit polyclonal anti-histone H3 | Abcam | ab1791 | (1: 5000) |
| Antibody | rabbit polyclonal anti-histone H3 (Ser10) | Sigma | 06–570 | (1: 500) |
| Antibody | rabbit polyclonal anti-TDG | Active Motif | 61437 | (1: 1000) |
| Antibody | rabbit polyclonal anti-Caspase-3 | Cell Signaling | #9662 | (1: 1000) |
| Antibody | rabbit polyclonal anti-Caspase-7 | Cell Signaling | #9492 | (1: 1000) |
| Antibody | HRP-coupled goat polylonal anti rabbit IgG | Dianova | 111-035-144 | (1: 10000) |
| Antibody | HRP-coupled goat polyclonal anti mouse IgG | Dianova | 115-035-146 | (1: 10000) |
| Recombinant DNA reagent | pCS2FLAG | Addgene | RRID:Addgene_16331 | |
| Recombinant DNA reagent | pcDNA3.1(+) | Invitrogen | V79020 | |
| Recombinant DNA reagent | pX330-U6-Chimeric_BB-CBh-hSpCas9 | Addgene | RRID:Addgene_42230 | |
| Recombinant DNA reagent | pPGKPuro | Addgene | RRID:Addgene_11349 | |
| Recombinant DNA reagent | pCS105-xp53 | Stefano Piccolo | NA | |
| Peptide, recombinant protein | APE 1 | NEB | M0282 | |
| Peptide, recombinant protein | Endonuclease III (Nth) | NEB | M0268 | |
| Commercial assay or kit | RNeasy Mini Kit | Qiagen | 74104 | |
| Commercial assay or kit | DNeasy Blood and Tissue Kit | Qiagen | 69504 | |
| Commercial assay or kit | Blood and Cell Culture DNA Midi Kit | Qiagen | 13343 | |
| Commercial assay or kit | RNA 6000 Nano kit | Agilent | 5067–1511 | |
| Commercial assay or kit | Qubit dsDNA HS Assay Kit | Invitrogen | Q32851 | |
| Commercial assay or kit | TruSeq RNA Sample Preparation v2 Kit | Illumna | RS-122–2001/RS-122–2002 | |
| Commercial assay or kit | MEGAscript SP6 Transcription kit | Invitrogen | AM1330 | |
| Chemical compound, drug | Pyocyanin | Sigma | P0046 | |
| Chemical compound, drug | L-Ascorbic acid 2-phosphate sesquimagnesium salt hydrat | Sigma | A8960 | |
| Chemical compound, drug | Pifithrin α | Sigma | P4359 | |
| Chemical compound, drug | NSC 146109 | Santa Cruz Biotechnology | sc-203652 | |
| Chemical compound, drug | 2,6-Di-tert-butyl-4-methylphenol (BHT) | Sigma | B1378 | |
| Chemical compound, drug | deferoxamine mesylate | Sigma | D9533 | |
| Software, algorithm | LightCycler 480 software | Roche | 4994884001 | |
| Software, algorithm | bcl2fastq Conversion Software v.1.8.4 | Illumina | http://emea.support.illumina.com/downloads/bcl2fastq_conversion_software_184.html | |
| Software, algorithm | FastQC | Babraham Bioinformatics | https://www.bioinformatics.babraham.ac.uk/projects/fastqc/ | |
| Software, algorithm | STAR v.2.5.4b | PMID: 23104886 | ||
| Software, algorithm | Subread featureCounts v.1.5.1 | PMID: 24227677 | ||
| Software, algorithm | DESeq2 | PMID: 25516281 | ||
| Software, algorithm | PANTHER | The Gene Ontology Resource | http://pantherdb.org | |
| Software, algorithm | TopHat v. 2.0.9 | Johns Hopkins University | https://ccb.jhu.edu/software/tophat/index.shtml | |
| Software, algorithm | iGenomes | Illumina | http://emea.support.illumina.com/sequencing/sequencing_software/igenome.html | |
| Software, algorithm | BioVenn | PMID: 18925949 | http://www.biovenn.nl/ | |
| Software, algorithm | WebGestalt | PMID: 28472511 | http://webgestalt.org/ | |
| Software, algorithm | HTSeq-count v. 0.5.4 | https://htseq.readthedocs.io/en/release_0.11.1/ | ||
| Software, algorithm | Xenbase | PMID: 29059324 | ftp://ftp.xenbase.org/pub/Genomics/JGI/Xenla9.2 | |
| Software, algorithm | MassHunter Quantitative Analysis, v. B.05.02 | Agilent Technologies | https://www.agilent.com/en/products/software-informatics/masshunter-suite/masshunter/masshunter-software | |
| Software, algorithm | FACSDiva | BD | http://www.bdbiosciences.com/en-us/instruments/research-instruments/research-software/flow-cytometry-acquisition/facsdiva-software | |
| Software, algorithm | FlowJo software v. 10.5.3 | BD | https://www.flowjo.com/solutions/flowjo/downloads/previous-versions |
Additional files
-
Supplementary file 1
Differentially expressed genes in Neil2 MO vs. control MO stage 23 Xenopus laevis embryos.
- https://doi.org/10.7554/eLife.49044.027
-
Supplementary file 2
Differentially expressed genes in Neil1,2,3-triple knockout compared to control teratomas.
- https://doi.org/10.7554/eLife.49044.028
-
Supplementary file 3
Differentially expressed genes in Neil1-knockout compared to control mESCs, EBs and EBs + RA.
- https://doi.org/10.7554/eLife.49044.029
-
Supplementary file 4
Differentially expressed genes in Neil2-knockout compared to control mESCs, EBs and EBs + RA.
- https://doi.org/10.7554/eLife.49044.030
-
Supplementary file 5
Differentially expressed genes in Apex1-knockout compared to control mESCs, EBs and EBs + RA.
- https://doi.org/10.7554/eLife.49044.031
-
Supplementary file 6
Oligonucleotides used in this study.
- https://doi.org/10.7554/eLife.49044.032
-
Transparent reporting form
- https://doi.org/10.7554/eLife.49044.033
Download links
A two-part list of links to download the article, or parts of the article, in various formats.
Downloads (link to download the article as PDF)
Open citations (links to open the citations from this article in various online reference manager services)
Cite this article (links to download the citations from this article in formats compatible with various reference manager tools)
NEIL1 and NEIL2 DNA glycosylases protect neural crest development against mitochondrial oxidative stress
eLife 8:e49044.
https://doi.org/10.7554/eLife.49044


