Electric field causes volumetric changes in the human brain
- The Zucker Hillside Hospital, United States
- Center for Neuroscience, Feinstein Institute for Medical Research, United States
- Zucker School of Medicine, United States
- University of Bergen, Norway
- Haukeland University Hospital, Mohn Medical Imaging and Visualization Centre, Norway
- National Institute of Mental Health, United States
- University of California, Los Angeles, United States
- The City College of the City University of New York, United States
- University of California, San Diego, United States
- Bellvitge University Hospital-IDIBELL, Spain
- CIBERSAM, Carlos III Health Institute, Spain
- University of Muenster, Germany
- Amsterdam UMC, location VUmc, GGZinGeest, Old Age Psychiatry, Amsterdam Neuroscience, Netherlands
- Haukeland University Hospital, University of Bergen, Norway
- Keio University School of Medicine, Japan
- Center for Psychiatry and Behavioral Science, Komagino Hospital, Japan
- KU Leuven, Belgium
- Hospital del Mar, Spain
- Radboud University Medical Center, Netherlands
- Donders Institute for Brain Cognition and Behavior, Centre for Cognitive Neuroimaging, Netherlands
- University of Duisburg-Essen, Germany
- University of New Mexico School of Medicine, United States
Figures
Figure 1
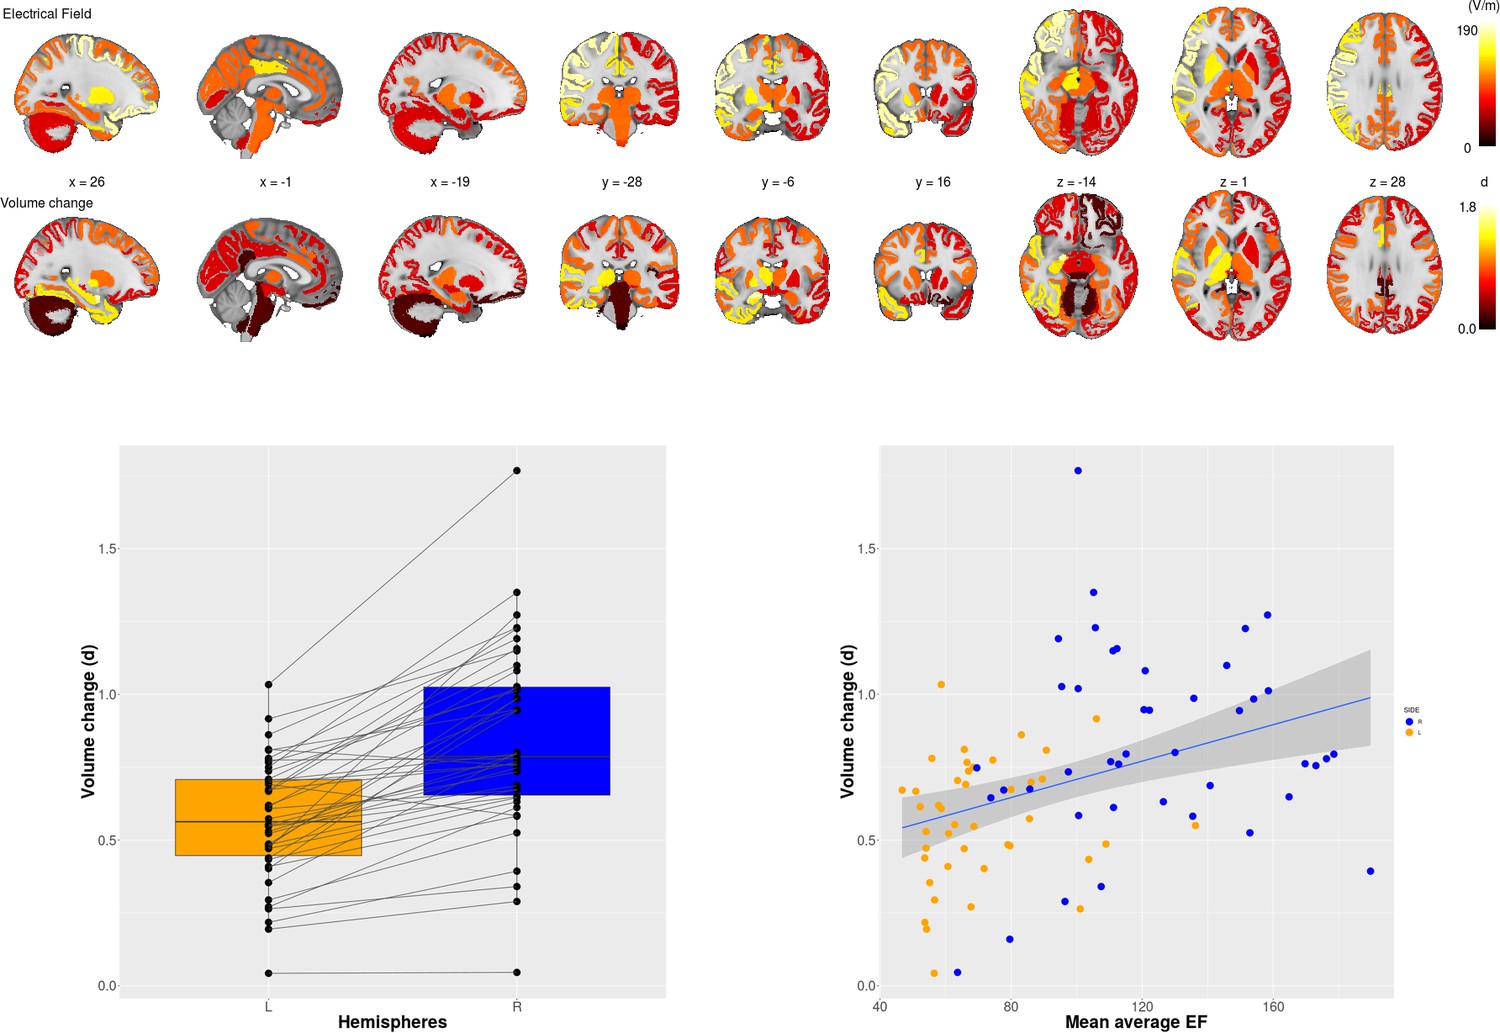
Electric Field (EF) and volume change across 85 brain regions.
Upper panel first row: Mean EF across 85 brain regions; second row: the effect size of volume changes between baseline and at the end of the course of ECT across 85 regions. Lower panel, left: Effect sizes of right unilateral stimulations were consistently higher on the right side than on the left side. Lower panel, right: Scatter plot of regional EF versus regional volume change (r = 0.38; p <0.001; df = 83; t = 3.77). (d) = Cohen’s d effect size..
-
Figure 1—source data 1
Mean electric field and volume change in 85 brain regions.
- https://cdn.elifesciences.org/articles/49115/elife-49115-fig1-data1-v2.csv
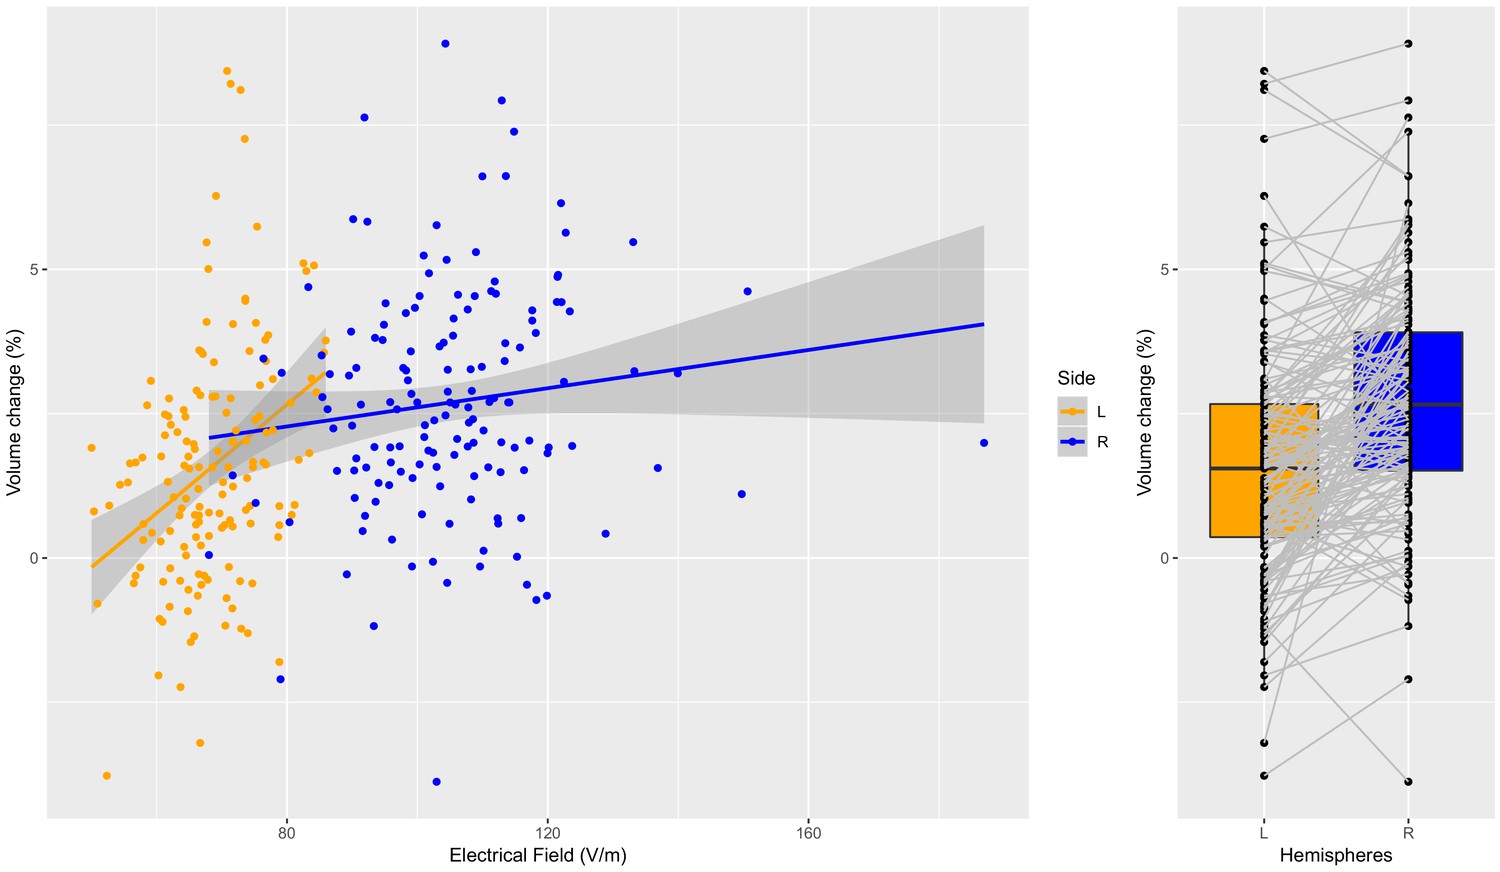
Figure 2

Laterality differences in EF and ∆vol (upper panel) as well as the relationship between laterality between EF/∆vol (lower panel).
Regression line indicates the correlation between laterality indices of EF and volume change (r = 0.32; p<0.05; df = 40; t = 2.13).
-
Figure 2—source data 1
Mean electric field and volume change asymteries in corresponding 42 brain regions.
- https://cdn.elifesciences.org/articles/49115/elife-49115-fig2-data1-v2.csv
Figure 3 with 1 supplement
Individual specific relationship between EF and volume change in the hippocampus.
Left: Scatterplot of EF versus volume change in the hippocampus (t = 5.97, df = 300, r = 0.33, p < 0.0001, left and right side together). There is a significant relationship on the left side (orange dots; t = 4.53, df = 149, r = 0.35, p < 0.0001), but not on the right side (probably due to ceiling effect) (t = 1.59, df = 149, r = 0.13, p = 0.11). Right: The difference in right and left hippocampal volume changes is significant (t = 7.76, df = 150, mean difference = 0.011, p < 0.0001).
-
Figure 3—source data 1
Left and right hippocampal EF and volume change in 151 individual.
- https://cdn.elifesciences.org/articles/49115/elife-49115-fig3-data1-v2.csv
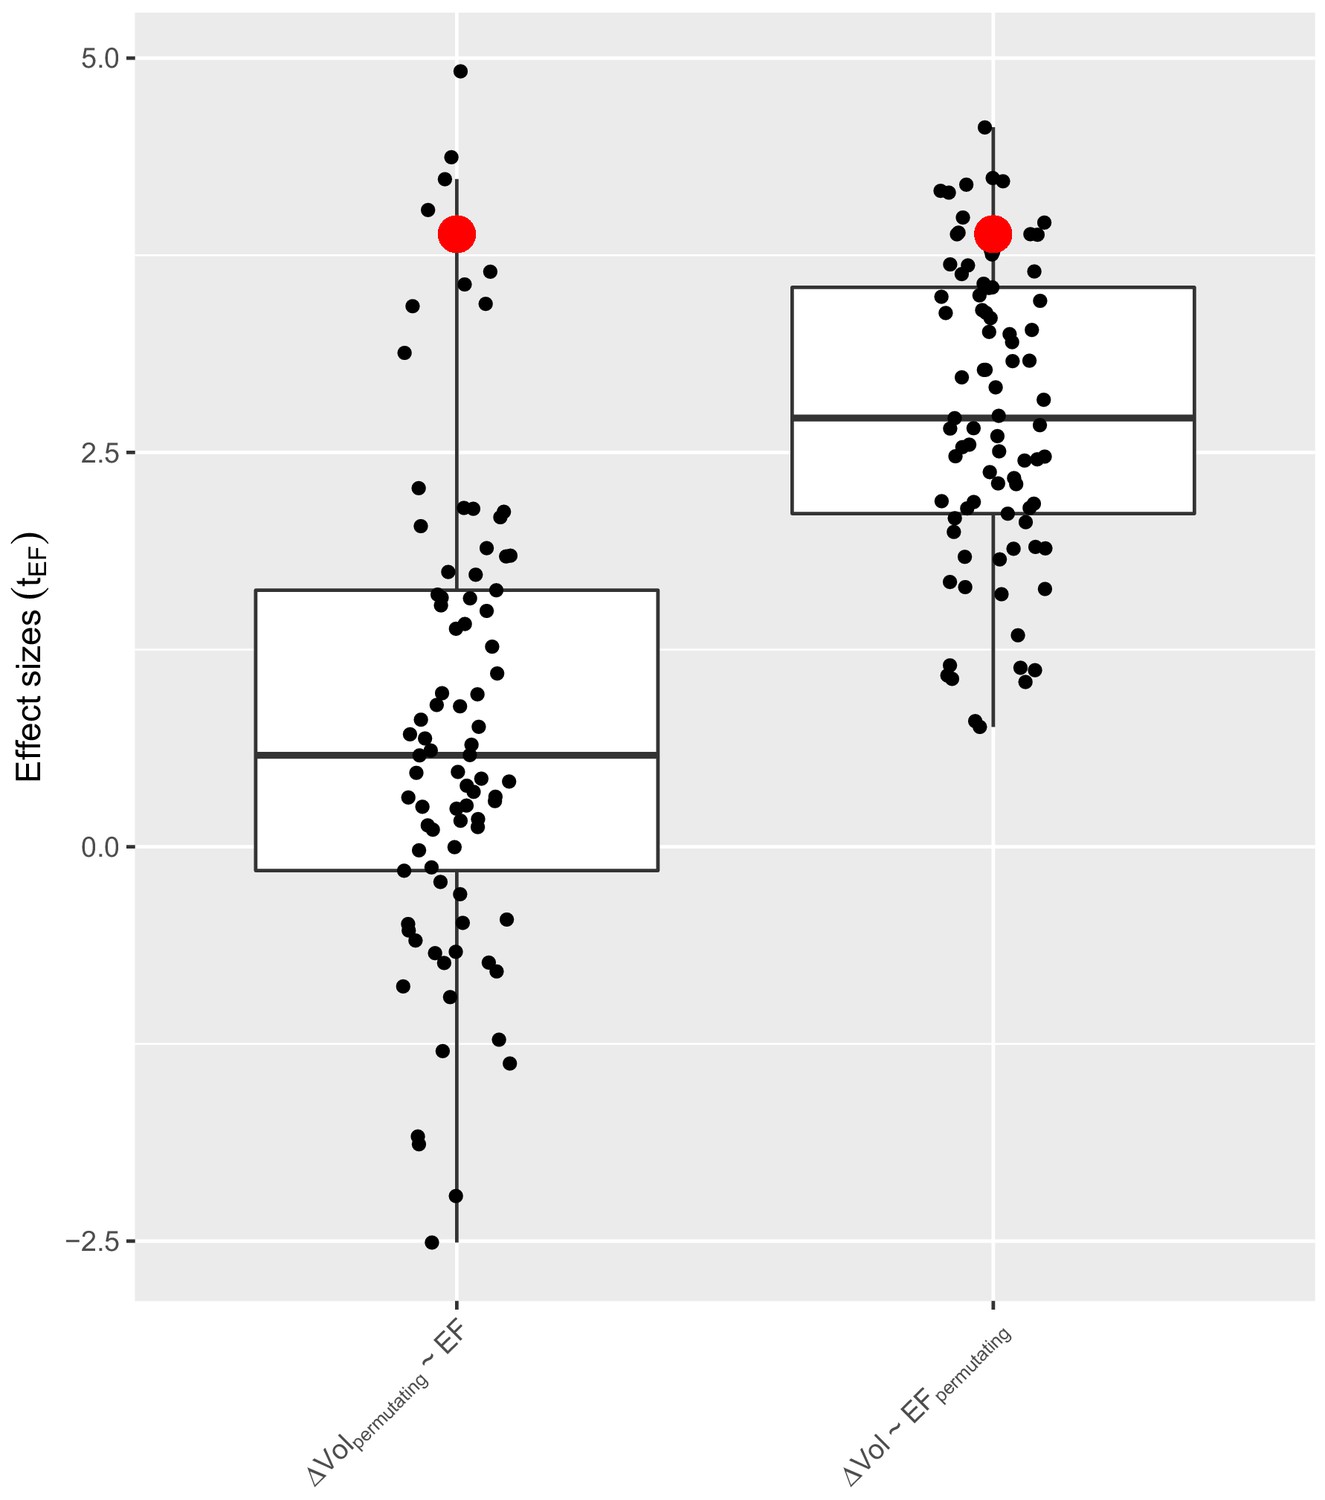
Figure 3—figure supplement 1
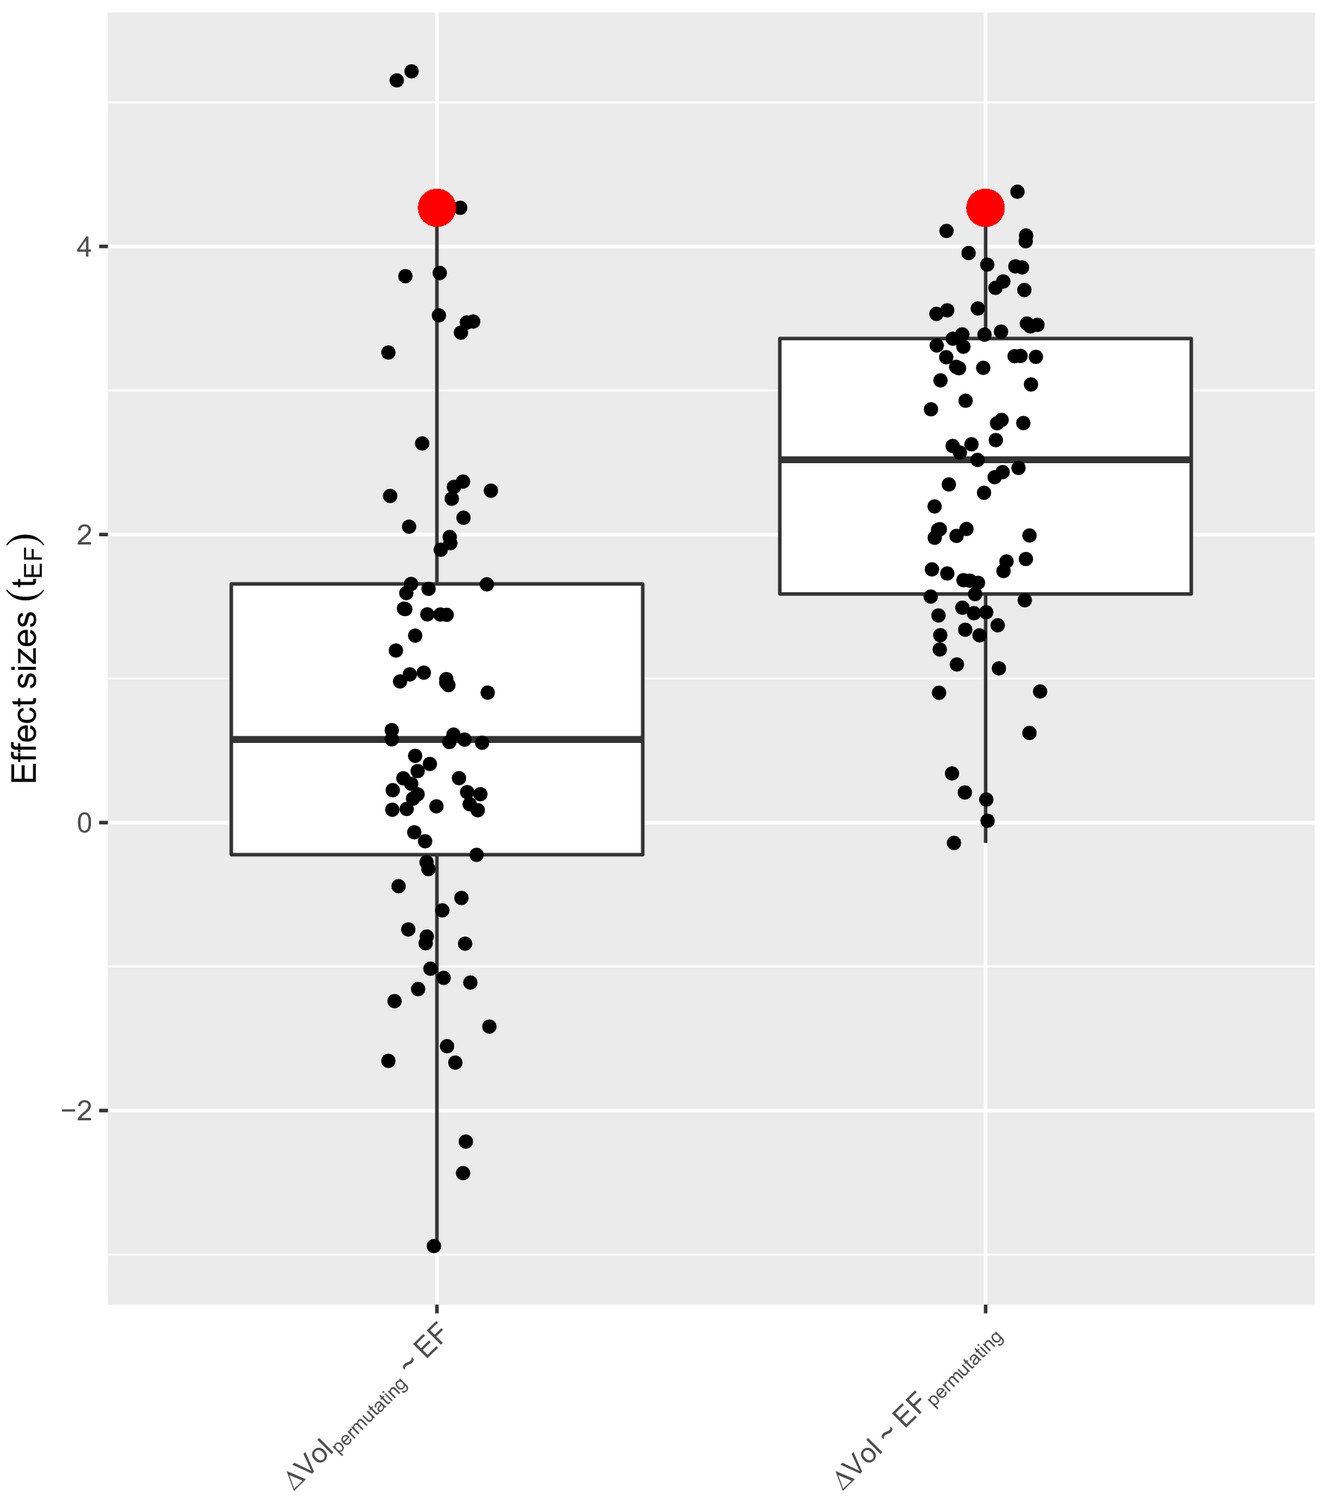
Hippocampal EF and volume change.
To test the specificity of our measures in the left hippocampus (FDR corrected finding) we permutated the labels across the 85 ROIs, both for the volume changes (left) and for the EF values (right) and calculated correlations between the EF and volume change of these regions, respectively. This way we received 85 different values, where one of them was the ‘correct’ correlation, indicated with red dots. The ‘correct’ correlations between the EF and corresponding volume outperformed the other correlations (were in the top five percentile) from non-matching pairs, indicating that our findings were not merely a general correlation with some average values across regions, further strengthening the casual link between EF and volume change.
-
Figure 3—figure supplement 1—source data 1
Hippocampal EF and volume change: permutation values.
- https://cdn.elifesciences.org/articles/49115/elife-49115-fig3-figsupp1-data1-v2.csv
Figure 4 with 1 supplement
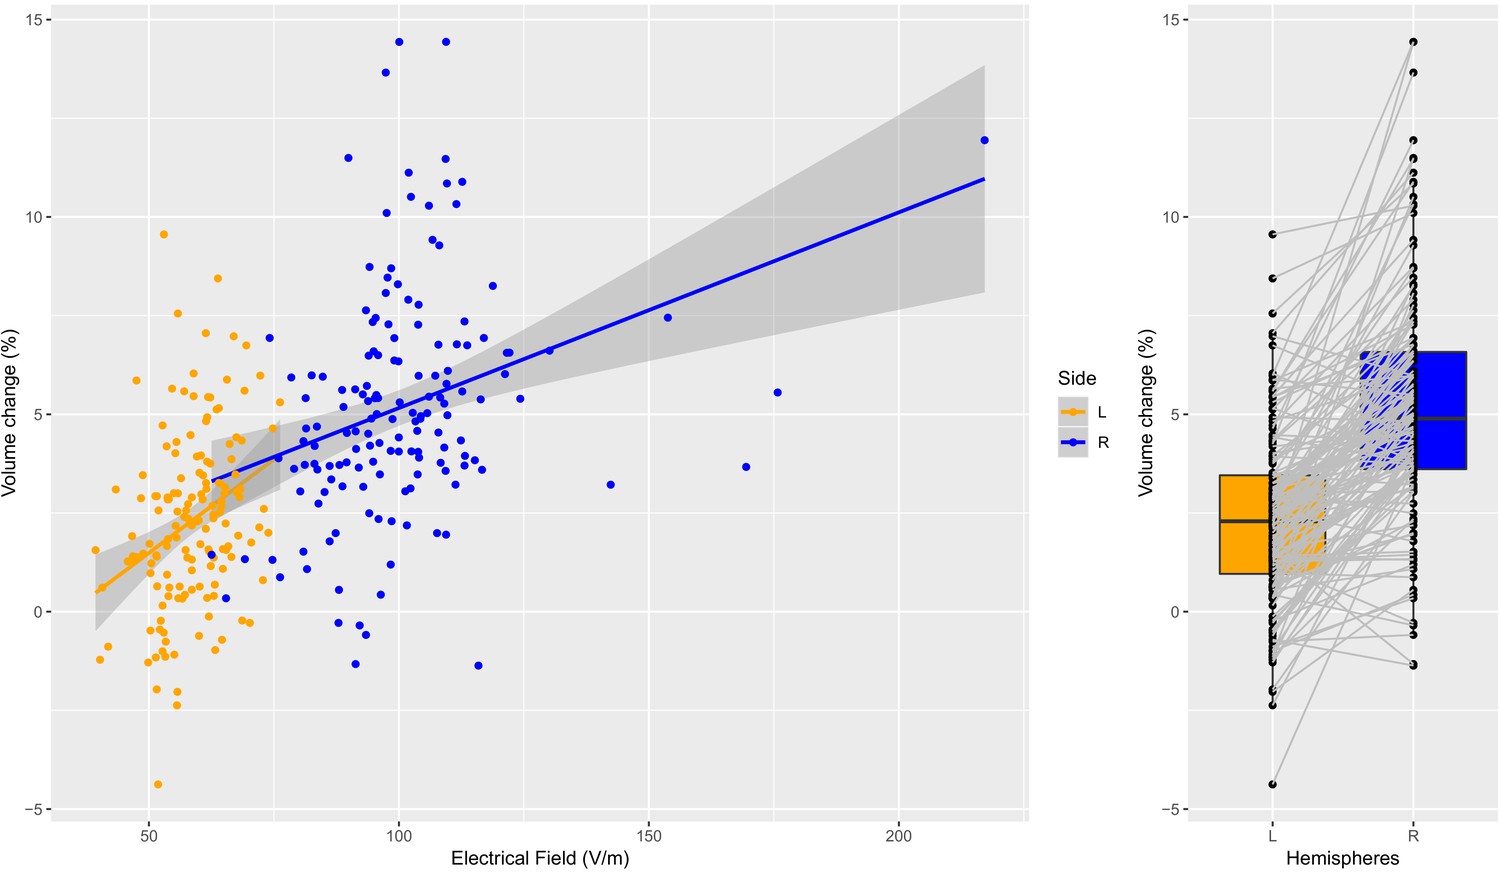
Individual specific relationship between EF and volume change in the amygdala.
Left: Scatterplot of EF versus volume change in the amygdala (t = 11.35, df = 300, r = 0.55, p<0.0001; left and right side together). Both the left (orange dots) and right (blue dots) hemisphere shows highly significant relationships (t = 4.01, df = 149, r = 0.31, p=0.0001; and t = 4.02, df = 149, r = 0.31, p=0.0001). Right: The difference in right and left amygdala volume changes is significant (t = 13.58, df = 150, mean difference = 0.029, p<0.0001).
-
Figure 4—source data 1
Left and right amygdala EF and volume change in 151 individual.
- https://cdn.elifesciences.org/articles/49115/elife-49115-fig4-data1-v2.csv
Figure 4—figure supplement 1
Amygdala EF and volume change.
To test the specificity of our measures in the left amygdala (FDR corrected finding) we permutated the labels across the 85 ROIs, both for the volume changes (left) and for the EF values (right) and calculated correlations between the EF and volume change of these regions, respectively. This way we received 85 different values, where one of them was the ‘correct’ correlation, indicated with red dots. The ‘correct’ correlations between the EF and corresponding volume outperformed the other correlations (were in the top five percentile) from non-matching pairs, indicating that our findings were not merely a general correlation with some average values across regions, further strengthening the casual link between EF and volume change.
-
Figure 4—figure supplement 1—source data 1
Amygdala EF and volume change: permutation values.
- https://cdn.elifesciences.org/articles/49115/elife-49115-fig4-figsupp1-data1-v2.csv
Figure 5
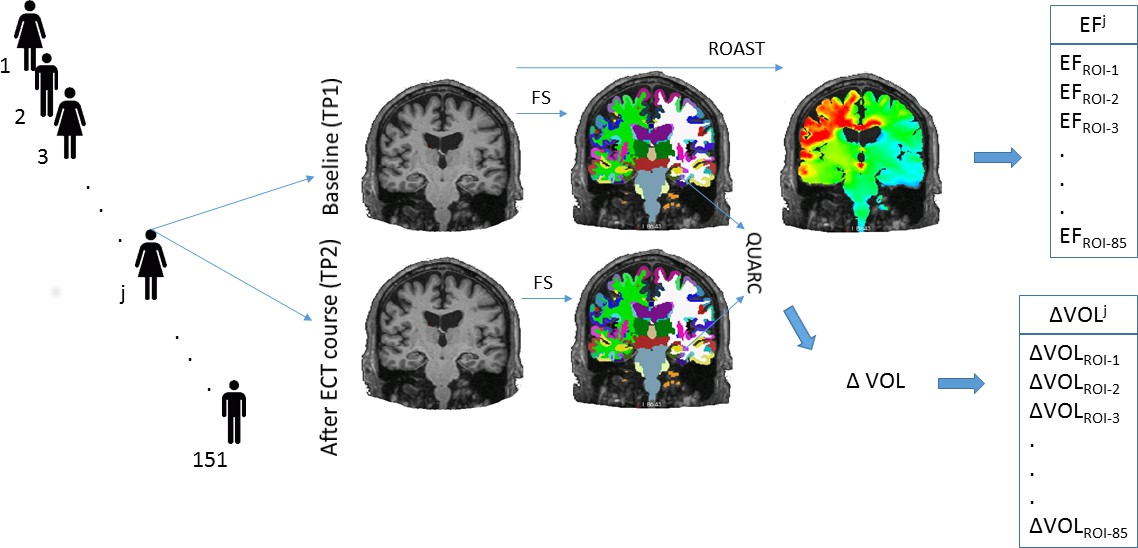
Illustration of the methods.
We analyzed longitudinal structural MRI data from 151 individuals. We calculated the volume change and the magnitude of electrical field in 85 regions across the human cortex and subcortical structures.
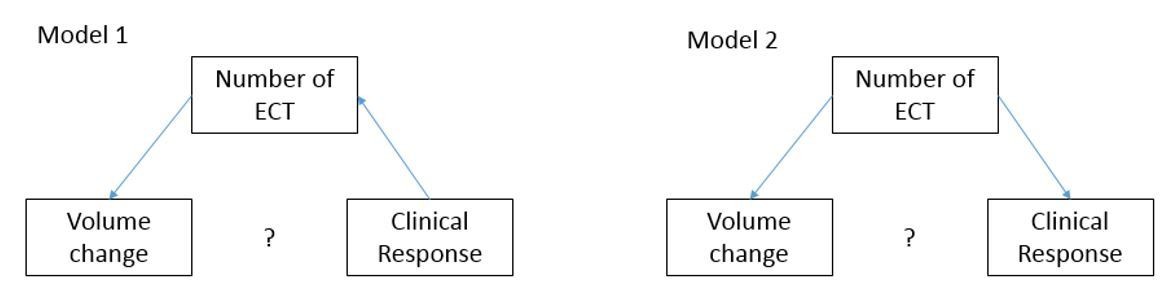
Author response image 1
Tables
Table 1
The relationship between volume changes and EF across individuals (Δ Vol ~ EF + Age + ECTnum).
| roi | tEF | pEF | tAge | tECTnum | BHEFFDR | |
|---|---|---|---|---|---|---|
| 1 | Δ VOLLeft.Cerebellum.Cortex | −0.3668 | 0.7143 | −0.1150 | 1.9368 | 0.8205 |
| 2 | Δ VOLLeft.Thalamus.Proper | 0.0244 | 0.9805 | −0.4046 | 2.8696 | 0.9952 |
| 3 | Δ VOLLeft.Caudate | 0.6555 | 0.5132 | −0.8301 | 2.6428 | 0.6924 |
| 4 | Δ VOLLeft.Putamen | 0.5737 | 0.5671 | −0.5992 | 1.3203 | 0.7212 |
| 5 | Δ VOLLeft.Pallidum | 0.0060 | 0.9952 | 0.1026 | 1.2295 | 0.9952 |
| 6 | Δ VOLBrain.Stem | 1.2114 | 0.2278 | 0.8536 | 1.2309 | 0.4466 |
| 7 | Δ VOLLeft.Hippocampus | 4.5102 | 0.0000 | −2.6814 | 3.3221 | 0.0012 |
| 8 | Δ VOLLeft.Amygdala | 3.9069 | 0.0001 | −1.0572 | 2.1018 | 0.0061 |
| 9 | Δ VOLLeft.Accumbens.area | 2.0238 | 0.0449 | −3.4456 | 1.7246 | 0.1737 |
| 10 | Δ VOLLeft.VentralDC | 0.1740 | 0.8621 | 0.0605 | 2.2614 | 0.9395 |
| 11 | Δ VOLRight.Cerebellum.Cortex | −0.5564 | 0.5788 | 0.0677 | 1.3212 | 0.7235 |
| 12 | Δ VOLRight.Thalamus.Proper | 0.4582 | 0.6475 | 0.3541 | 4.0787 | 0.7712 |
| 13 | Δ VOLRight.Caudate | 1.2293 | 0.2210 | 1.0254 | 1.5097 | 0.4466 |
| 14 | Δ VOLRight.Putamen | 1.0724 | 0.2854 | −0.5112 | 1.4987 | 0.4756 |
| 15 | Δ VOLRight.Pallidum | 0.6045 | 0.5465 | 0.8016 | 2.9589 | 0.7181 |
| 16 | Δ VOLRight.Hippocampus | 1.5090 | 0.1336 | −1.2924 | 3.2473 | 0.3441 |
| 17 | Δ VOLRight.Amygdala | 2.9945 | 0.0032 | −0.6087 | 4.2603 | 0.0344 |
| 18 | Δ VOLRight.Accumbens.area | 1.9563 | 0.0524 | −0.8782 | 3.5228 | 0.1937 |
| 19 | Δ VOLRight.VentralDC | 0.3488 | 0.7278 | 0.5197 | 0.7438 | 0.8248 |
| 20 | Δ VOLctx.lh.bankssts | 1.1757 | 0.2417 | −0.4102 | 2.5801 | 0.4466 |
| 21 | Δ VOLctx.lh.caudalanteriorcingulate | 1.3404 | 0.1823 | −1.2881 | 2.2330 | 0.4254 |
| 22 | Δ VOLctx.lh.caudalmiddlefrontal | −1.8989 | 0.0596 | −0.3804 | 2.0087 | 0.2112 |
| 23 | Δ VOLctx.lh.cuneus | 0.9827 | 0.3274 | 0.1037 | 2.0348 | 0.5352 |
| 24 | Δ VOLctx.lh.entorhinal | 3.2229 | 0.0016 | −1.2447 | 1.6659 | 0.0335 |
| 25 | Δ VOLctx.lh.fusiform | 3.0717 | 0.0026 | −0.1806 | 2.1319 | 0.0344 |
| 26 | Δ VOLctx.lh.inferiorparietal | 1.5131 | 0.1325 | 0.8515 | 2.3077 | 0.3441 |
| 27 | Δ VOLctx.lh.inferiortemporal | 2.6985 | 0.0078 | 0.6415 | 1.9131 | 0.0577 |
| 28 | Δ VOLctx.lh.isthmuscingulate | −0.3275 | 0.7438 | −0.4344 | 2.9060 | 0.8319 |
| 29 | Δ VOLctx.lh.lateraloccipital | 1.1916 | 0.2354 | 0.3669 | 1.2752 | 0.4466 |
| 30 | Δ VOLctx.lh.lateralorbitofrontal | 1.4274 | 0.1557 | −0.0081 | 1.5758 | 0.3780 |
| 31 | Δ VOLctx.lh.lingual | 0.1391 | 0.8896 | 0.3506 | 2.4745 | 0.9572 |
| 32 | Δ VOLctx.lh.medialorbitofrontal | 1.0744 | 0.2845 | −0.1246 | 1.1852 | 0.4756 |
| 33 | Δ VOLctx.lh.middletemporal | 2.0679 | 0.0405 | −0.3780 | 2.2600 | 0.1720 |
| 34 | Δ VOLctx.lh.parahippocampal | 1.2683 | 0.2068 | −0.2446 | 2.8373 | 0.4466 |
| 35 | Δ VOLctx.lh.paracentral | −2.0829 | 0.0391 | 0.2511 | 4.0937 | 0.1720 |
| 36 | Δ VOLctx.lh.parsopercularis | −0.6949 | 0.4883 | −0.7822 | 1.8435 | 0.6694 |
| 37 | Δ VOLctx.lh.parsorbitalis | 0.8057 | 0.4218 | −1.0427 | 0.9524 | 0.6289 |
| 38 | Δ VOLctx.lh.parstriangularis | 0.8228 | 0.4120 | −1.2157 | 2.7977 | 0.6254 |
| 39 | Δ VOLctx.lh.pericalcarine | 0.4426 | 0.6587 | −0.0479 | 1.8463 | 0.7712 |
| 40 | Δ VOLctx.lh.postcentral | 0.8692 | 0.3862 | −1.7655 | 2.5145 | 0.5969 |
| 41 | Δ VOLctx.lh.posteriorcingulate | −0.8698 | 0.3859 | −0.6961 | 3.3193 | 0.5969 |
| 42 | Δ VOLctx.lh.precentral | −0.7279 | 0.4679 | −1.2884 | 2.4234 | 0.6682 |
| 43 | Δ VOLctx.lh.precuneus | −1.5879 | 0.1145 | −0.4353 | 3.6729 | 0.3441 |
| 44 | Δ VOLctx.lh.rostralanteriorcingulate | 1.3315 | 0.1852 | −0.4449 | 0.5630 | 0.4254 |
| 45 | Δ VOLctx.lh.rostralmiddlefrontal | −0.7192 | 0.4732 | −1.6205 | 1.1936 | 0.6682 |
| 46 | Δ VOLctx.lh.superiorfrontal | −1.2073 | 0.2293 | −0.5851 | 2.1065 | 0.4466 |
| 47 | Δ VOLctx.lh.superiorparietal | −1.7423 | 0.0836 | 0.6952 | 3.3288 | 0.2734 |
| 48 | Δ VOLctx.lh.superiortemporal | 2.2820 | 0.0240 | −2.0868 | 1.6393 | 0.1199 |
| 49 | Δ VOLctx.lh.supramarginal | 0.5717 | 0.5685 | −0.2467 | 2.1282 | 0.7212 |
| 50 | Δ VOLctx.lh.frontalpole | −0.2029 | 0.8395 | −0.2904 | 0.4776 | 0.9267 |
| 51 | Δ VOLctx.lh.temporalpole | 2.5288 | 0.0125 | −0.0731 | 1.3167 | 0.0762 |
| 52 | Δ VOLctx.lh.transversetemporal | 0.4387 | 0.6616 | −0.4617 | 2.1817 | 0.7712 |
| 53 | Δ VOLctx.rh.bankssts | 0.1121 | 0.9109 | 2.0777 | 2.9991 | 0.9678 |
| 54 | Δ VOLctx.rh.caudalanteriorcingulate | −1.4295 | 0.1551 | 1.2935 | 2.4016 | 0.3780 |
| 55 | Δ VOLctx.rh.caudalmiddlefrontal | −2.9569 | 0.0036 | 1.6943 | 2.6065 | 0.0344 |
| 56 | Δ VOLctx.rh.cuneus | −0.0087 | 0.9930 | −1.1806 | 2.4017 | 0.9952 |
| 57 | Δ VOLctx.rh.entorhinal | 1.2514 | 0.2129 | 0.7897 | 2.4722 | 0.4466 |
| 58 | Δ VOLctx.rh.fusiform | 1.5380 | 0.1263 | 0.7997 | 4.7854 | 0.3441 |
| 59 | Δ VOLctx.rh.inferiorparietal | −2.9902 | 0.0033 | 1.6520 | 0.7114 | 0.0344 |
| 60 | Δ VOLctx.rh.inferiortemporal | 0.9300 | 0.3540 | 1.9310 | 3.3455 | 0.5677 |
| 61 | Δ VOLctx.rh.isthmuscingulate | 0.0325 | 0.9741 | 0.4230 | 1.1493 | 0.9952 |
| 62 | Δ VOLctx.rh.lateraloccipital | 1.1796 | 0.2401 | 0.6095 | 1.5161 | 0.4466 |
| 63 | Δ VOLctx.rh.lateralorbitofrontal | 0.5347 | 0.5937 | 0.3393 | 2.9240 | 0.7314 |
| 64 | Δ VOLctx.rh.lingual | −0.0753 | 0.9401 | −1.9555 | 3.5258 | 0.9865 |
| 65 | Δ VOLctx.rh.medialorbitofrontal | 0.7090 | 0.4795 | 1.5479 | 2.3419 | 0.6682 |
| 66 | Δ VOLctx.rh.middletemporal | −0.6005 | 0.5492 | 2.1275 | 3.6781 | 0.7181 |
| 67 | Δ VOLctx.rh.parahippocampal | 1.5217 | 0.1303 | 0.5057 | 3.1874 | 0.3441 |
| 68 | Δ VOLctx.rh.paracentral | −3.5101 | 0.0006 | 2.1809 | 2.2718 | 0.0170 |
| 69 | Δ VOLctx.rh.parsopercularis | −2.5585 | 0.0116 | 2.8854 | 2.9459 | 0.0756 |
| 70 | Δ VOLctx.rh.parsorbitalis | 1.0872 | 0.2788 | −0.5812 | 2.3737 | 0.4756 |
| 71 | Δ VOLctx.rh.parstriangularis | −1.2468 | 0.2146 | 1.0686 | 2.6086 | 0.4466 |
| 72 | Δ VOLctx.rh.pericalcarine | 1.5878 | 0.1146 | −0.0096 | 2.2815 | 0.3441 |
| 73 | Δ VOLctx.rh.postcentral | −1.7565 | 0.0812 | 1.2943 | 3.0605 | 0.2734 |
| 74 | Δ VOLctx.rh.posteriorcingulate | −1.5171 | 0.1315 | 2.0716 | 1.4731 | 0.3441 |
| 75 | Δ VOLctx.rh.precentral | −2.4918 | 0.0139 | 0.9967 | 3.7013 | 0.0762 |
| 76 | Δ VOLctx.rh.precuneus | −2.0231 | 0.0450 | −0.1921 | 2.5419 | 0.1737 |
| 77 | Δ VOLctx.rh.rostralanteriorcingulate | 2.2083 | 0.0288 | 1.3734 | 2.3606 | 0.1362 |
| 78 | Δ VOLctx.rh.rostralmiddlefrontal | −2.6842 | 0.0081 | 0.5804 | 2.2235 | 0.0577 |
| 79 | Δ VOLctx.rh.superiorfrontal | −3.0013 | 0.0032 | 1.1011 | 3.2699 | 0.0344 |
| 80 | Δ VOLctx.rh.superiorparietal | −2.7495 | 0.0067 | 0.9014 | 2.0779 | 0.0574 |
| 81 | Δ VOLctx.rh.superiortemporal | 0.4377 | 0.6623 | 1.2455 | 4.4002 | 0.7712 |
| 82 | Δ VOLctx.rh.supramarginal | −2.4794 | 0.0143 | 2.7408 | 3.0429 | 0.0762 |
| 83 | Δ VOLctx.rh.frontalpole | 1.1256 | 0.2623 | −0.1784 | 1.9185 | 0.4644 |
| 84 | Δ VOLctx.rh.temporalpole | 0.7274 | 0.4682 | 0.5099 | 3.7696 | 0.6682 |
| 85 | Δ VOLctx.rh.transversetemporal | 1.1426 | 0.2551 | 0.6448 | 3.2405 | 0.4614 |
Table 2
Clinical and demographics summary.
| Table 2A Overall Summary | |||||||
|---|---|---|---|---|---|---|---|
| Site | N | Age (sd) | Medications (med. free, SSRI/SNRI, TCA, AP*) | Average number of ECT | Baseline MADRS | Δ MADRS (%) | |
| All | 151 | 57.5 (17.1) | 69,65,10,62 | 10.6 | 33.9 | 61.3 | |
| Female | 92 | 56.4 (18.4) | 42,36,8,42 | 10.4 | 34.4 | 63.4 | |
| Male | 59 | 59.3 (14.7) | 27,29,2,20 | 10.9 | 33.3 | 58.1 | |
| Table 2B Site Summary | |||||||
| Site | N | Age (mean) | Age (sd) | Baseline MADRS | Δ MADRS (%) | ||
| 1 | 30 | 39.87 | 12.68 | 40.73 | 45.12 | ||
| 2 | 33 | 64.48 | 8.93 | 31.36 | 69.48 | ||
| 3 | 16 | 73.62 | 12.45 | 29.56 | 77.24 | ||
| 4 | 23 | 46.87 | 9.19 | 29.96 | 43.18 | ||
| 5 | 2 | 62.50 | 0.71 | 36.75 | 32.03 | ||
| 6 | 18 | 48.50 | 16.77 | 33.83 | 57.12 | ||
| 7 | 29 | 72.66 | 7.57 | 35.07 | 79.13 | ||
-
*med. free: medication free, SSRI: selective serotonin reuptake inhibitor, SNRI: serotonin and norepinephrine reuptake inhibitors, TCA: tricyclic antidepressants, AP: antipsychotic medications, there were not patients on MAO inhibitors.
Additional files
-
Source code 1
Once EF and ΔVol were collected across 85 ROI in 151 subjects, all the rest of the calculations were carried out in R environment.
This file is the source code of these calculations organized in org-mode (https://orgmode.org/) for reproducibility.
- https://cdn.elifesciences.org/articles/49115/elife-49115-code1-v2.org
-
Supplementary file 1
Volume changes following electroconvulsive treatment (ECT).
One sample t-test in each ROIs. The table indicates t, uncorrected p, Cohen’s d effect size, and FDR corrected p values. This sample is a sub-cohort of a recent publication of 331 subjects (Ousdal et al., 2019). In contrast with that publication we included patients with RUL only electrode placement.
- https://cdn.elifesciences.org/articles/49115/elife-49115-supp1-v2.docx
-
Supplementary file 2
The laterality of volume changes after RUL ECT.
The table contains the results of 42 pairwise t-tests between the volume changes of the right and the left side of the corresponding regions. The table indicates t, uncorrected p, mean, Cohen’s d effect size and FDR corrected p values.
- https://cdn.elifesciences.org/articles/49115/elife-49115-supp2-v2.docx
-
Supplementary file 3
The relationship between clinical response and volume change across individuals.
The table indicates the t values of the corresponding clinical covariates modeled as fixed effects: volume change, age, and number of ECT.
- https://cdn.elifesciences.org/articles/49115/elife-49115-supp3-v2.docx
-
Supplementary file 4
The relationship between clinical response and electric field across individuals.
The table indicates the t values of the corresponding clinical covariates modeled as fixed effects: electric field, age, and number of ECT.
- https://cdn.elifesciences.org/articles/49115/elife-49115-supp4-v2.docx
-
Supplementary file 5
The relationship between the baseline volume and age across 85 ROIs.
- https://cdn.elifesciences.org/articles/49115/elife-49115-supp5-v2.docx
-
Supplementary file 6
MRI summary.
The table indicates the parameters of the structural image acquisition across sites.
- https://cdn.elifesciences.org/articles/49115/elife-49115-supp6-v2.docx
-
Transparent reporting form
- https://cdn.elifesciences.org/articles/49115/elife-49115-transrepform-v2.pdf
Download links
A two-part list of links to download the article, or parts of the article, in various formats.
Downloads (link to download the article as PDF)
Open citations (links to open the citations from this article in various online reference manager services)
Cite this article (links to download the citations from this article in formats compatible with various reference manager tools)
Electric field causes volumetric changes in the human brain
eLife 8:e49115.
https://doi.org/10.7554/eLife.49115


