The endonuclease Cue2 cleaves mRNAs at stalled ribosomes during No Go Decay
- Howard Hughes Medical Institute, Johns Hopkins University School of Medicine, United States
- University of Toronto, Canada
Figures
Figure 1 with 1 supplement
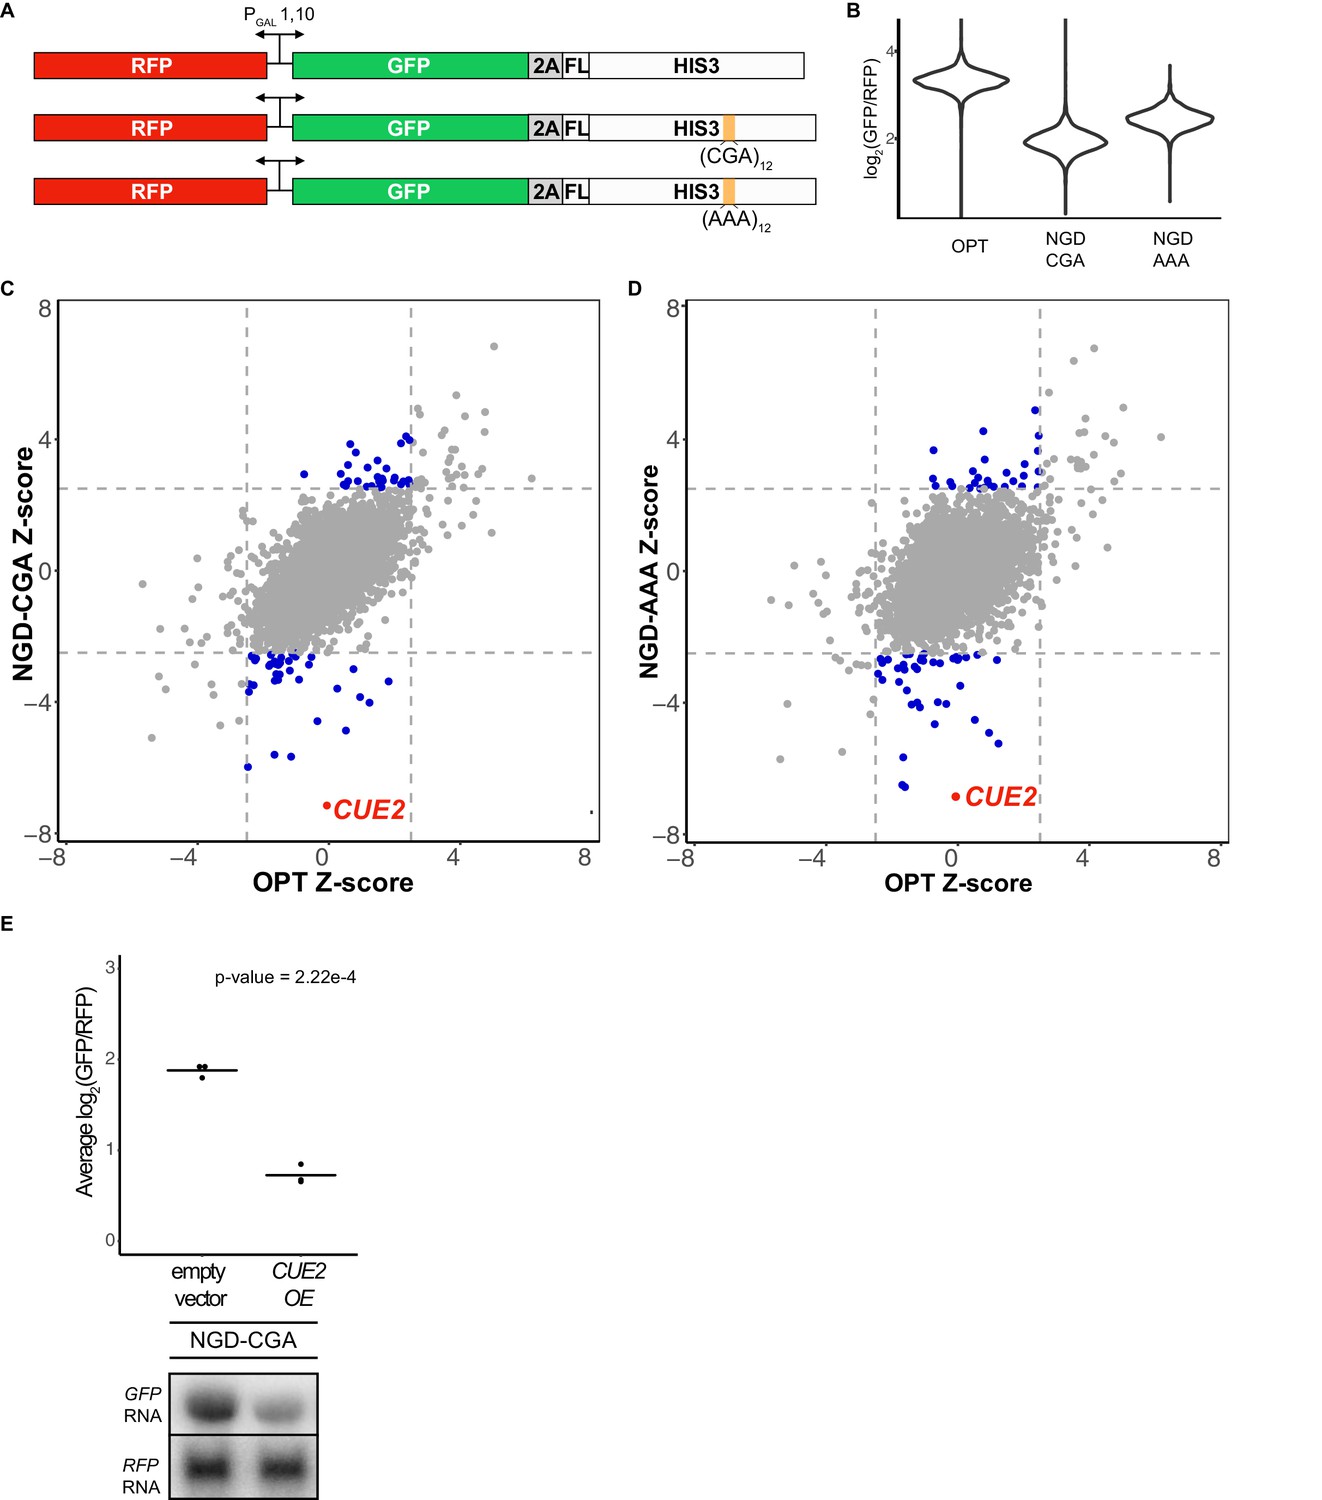
Yeast overexpression screens identify a novel factor involved in NGD.
(A) Schematic of reporters used in genetic screens. Top is 'OPT'; middle is 'NGD-CGA'; bottom is 'NGD-AAA'. (B) Normalized reporter GFP levels. Violin plots show flow cytometry data from >4000 WT cells containing the indicated reporter. (C–D) Plots of Z-scores from overexpression screens comparing the NGD-CGA and NGD-AAA reporters to OPT. Z-scores reflecting the significance of log2(GFP/RFP) values from each strain are plotted against each other for the two reporters. Dashed lines represent cutoffs at a Z-score greater than 2.5 or less than −2.5 for each reporter. Blue dots represent overexpression strains that have a Z-score value outside the cut-off for the NGD reporters, but not the OPT. Red dots identify the CUE2 overexpression strain. (E) Validation data for overexpression screen candidate CUE2. Top, three averages from individual flow cytometry experiments are plotted for the NGD-CGA reporter strain without CUE2 overexpression (left), and with CUE2 overexpression (right). Bottom, northern blots of steady state mRNA levels for the same strains. See Figure 1—figure supplement 1.
-
Figure 1—source data 1
Overexpression screen results.
- https://doi.org/10.7554/eLife.49117.004
Figure 1—figure supplement 1
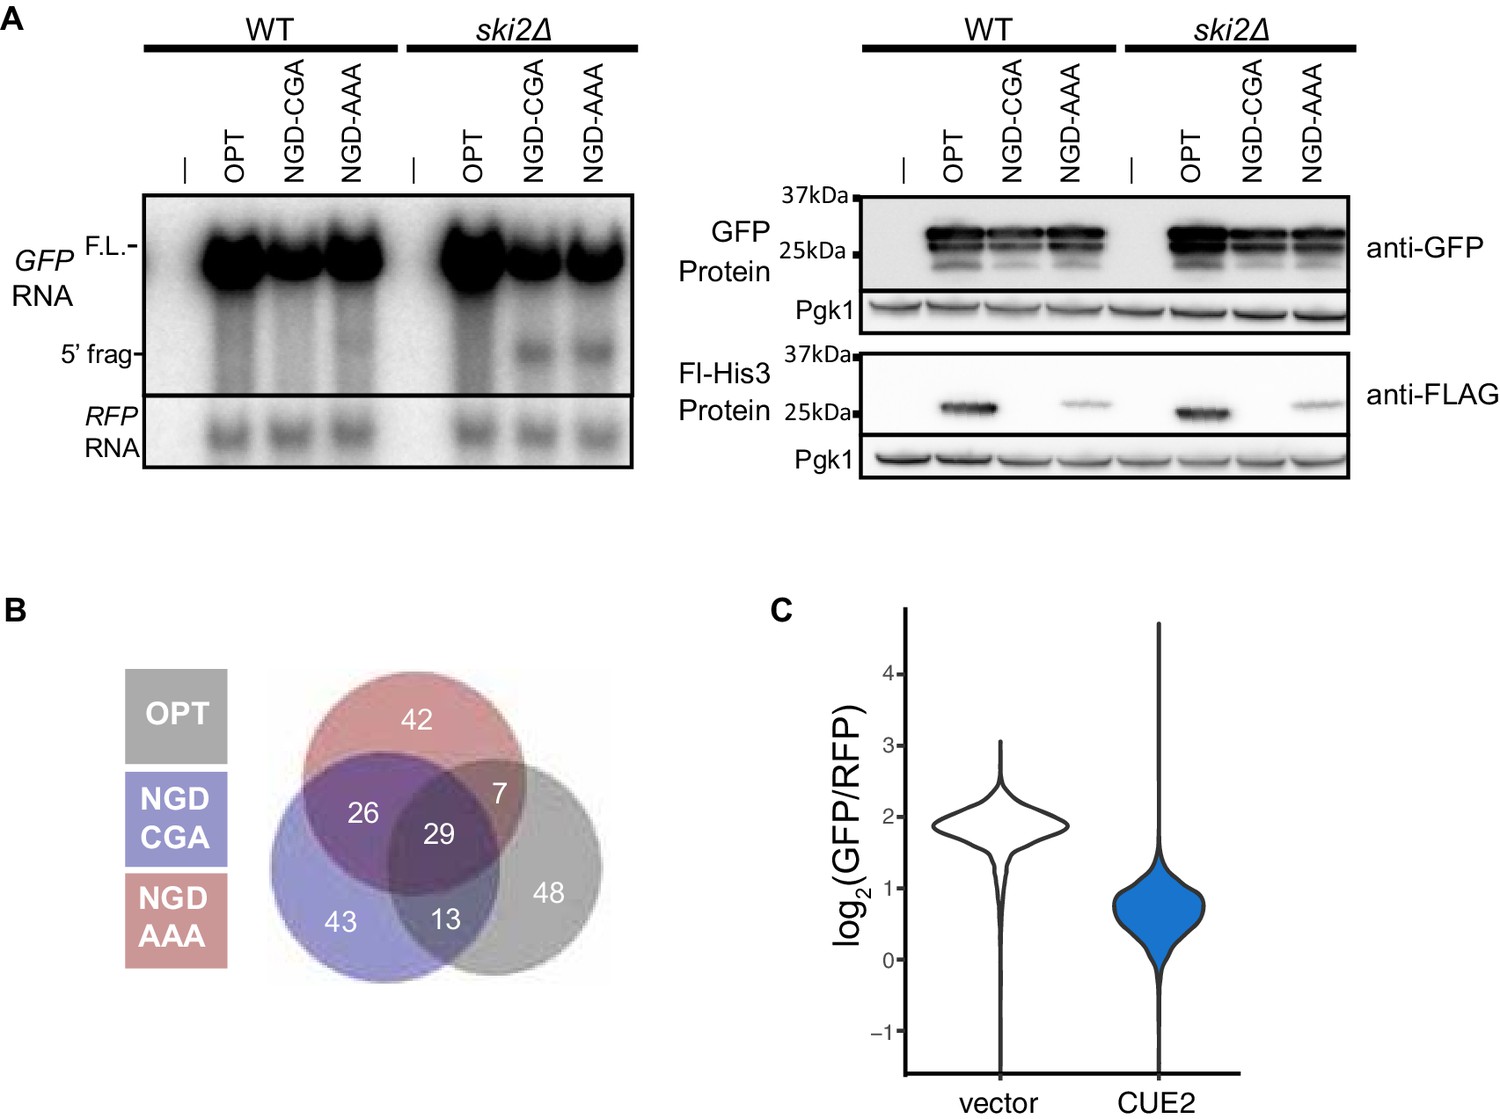
Validation of NGD reporters and screen results.
(A) Northern (left) and western blot (right) data for the indicated strains and reporters. (B) Venn diagram of top outliers from the overexpression screen. (C) Raw flow cytometry data from >4000 cells from empty vector and CUE2 overexpression strains. This data is from one replicate of the triplicates in Figure 1E.
Figure 2 with 1 supplement
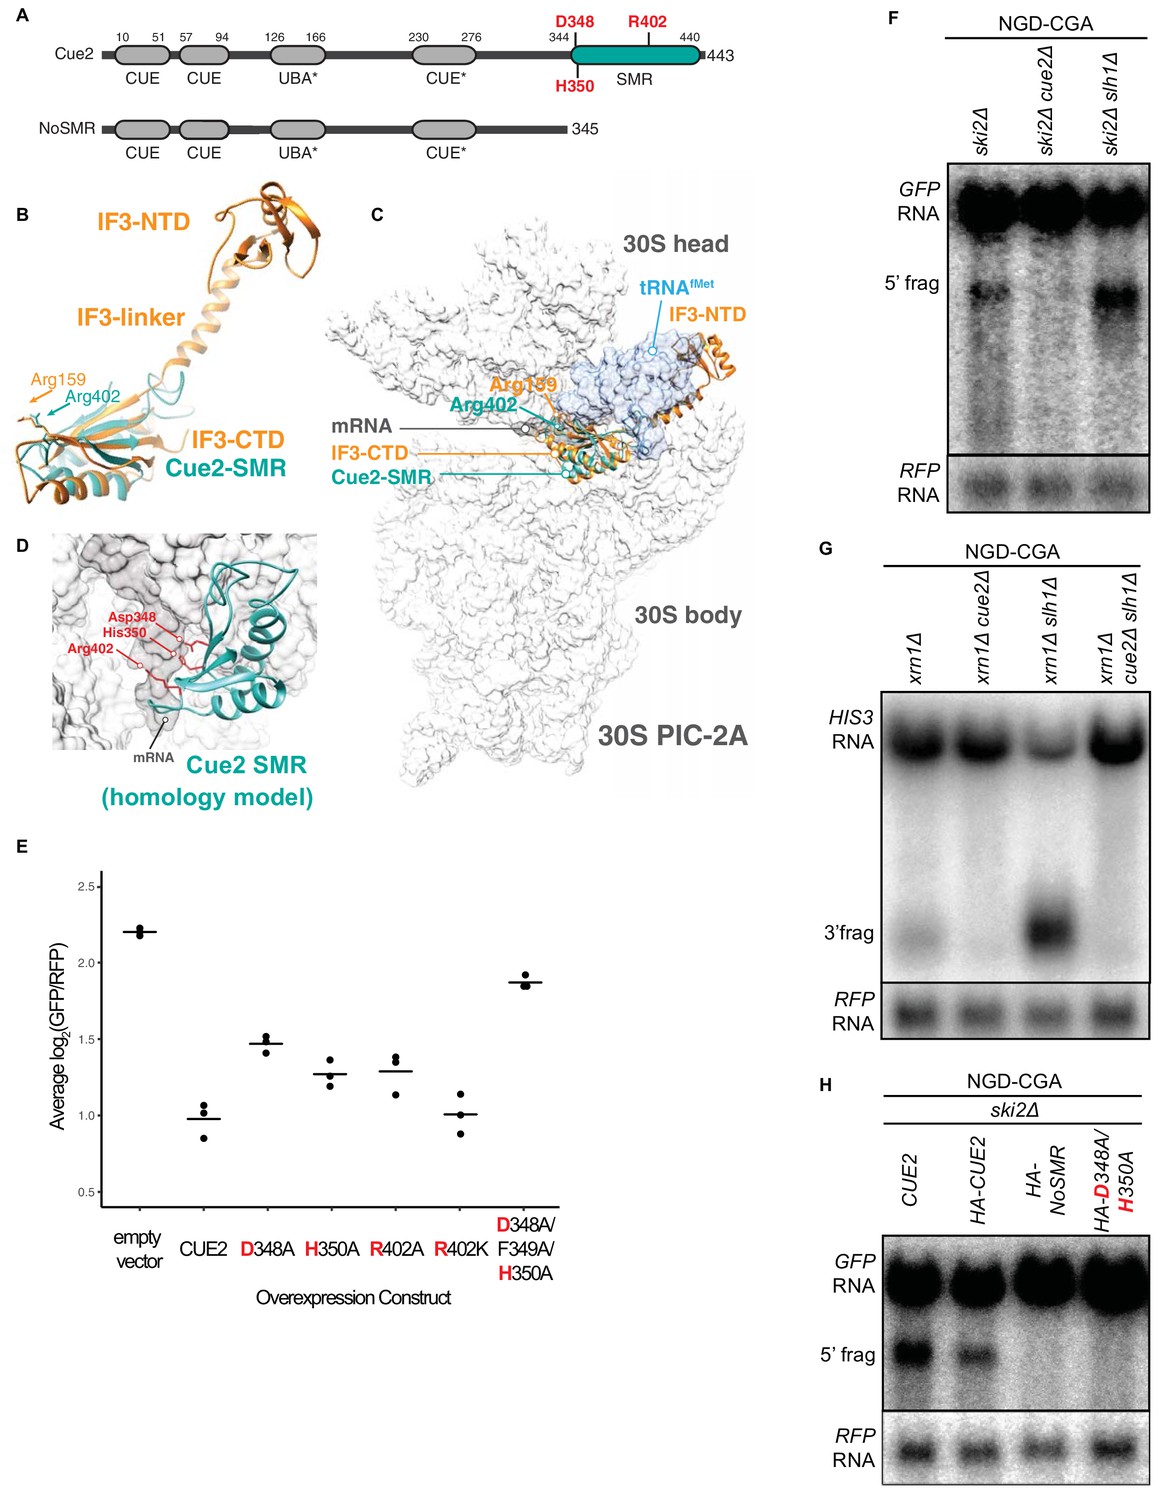
Cue2 domain structure and in vivo characterization of Cue2 in NGD.
(A) Domain organization of S. cerevisiae Cue2, with the ‘NoSMR’ mutant schematic below the WT Cue2. Putative ubiquitin binding domains indicated by asterisks. (B) Superimposition of homology model of Cue2-SMR domain (cyan) (templated on human N4BP2-SMR; PDB: 2VKC [Diercks et al., 2008]) on full-length IF3 (orange, PDB: 5LMQ [Hussain et al., 2016]). Positions of Arg-159 of IF3-CTD and Arg-402 of Cue2-SMR are indicated. (C) Putative positioning of Cue2-SMR in the context of IF3 and tRNAfMet bound to the small ribosome subunit. 30S PIC-2A (as described in Hussain et al., 2016) is light gray; mRNA is dark gray; tRNAfMet is blue; IF3 is orange; Cue2-SMR is cyan. (D) Cue2-SMR homology model in the same orientation as seen in Figure 2—figure supplement 1F showing putative positions of Asp-348, His-350 and Arg-402 with 30S pre-initiation complex (PIC) with tRNAfMet density subtracted (PDB: 5LMQ, State 2A [Hussain et al., 2016]). (E) Mutational analysis of the Cue2-SMR domain. Cue2 WT and mutants are all HA tagged at the N-terminus. Three averages for individual sets of log2(GFP/RFP) values of flow cytometry experiments for each indicated overexpression construct are shown. p-Values for the mutant HA-CUE2 as compared to WT HA-CUE2 are 0.007195, 0.02602, 0.03857, 0.7788, and 0.002127 for D348A, H350A, R402A, R402K, D348A/F349A/H350A, respectively. (F–G) Northern blot analysis of the indicated strains, with full-length mRNA and the 5’ (F) and 3’ (G) fragments labeled; RFP probed for normalization. (H) Northern blot analysis of 5’ NGD-CGA cleavage fragments in the ski2Δ strain with the indicated mutations made at the endogenous CUE2 locus; RFP probed for normalization. See Figure 2—figure supplement 1.
Figure 2—figure supplement 1
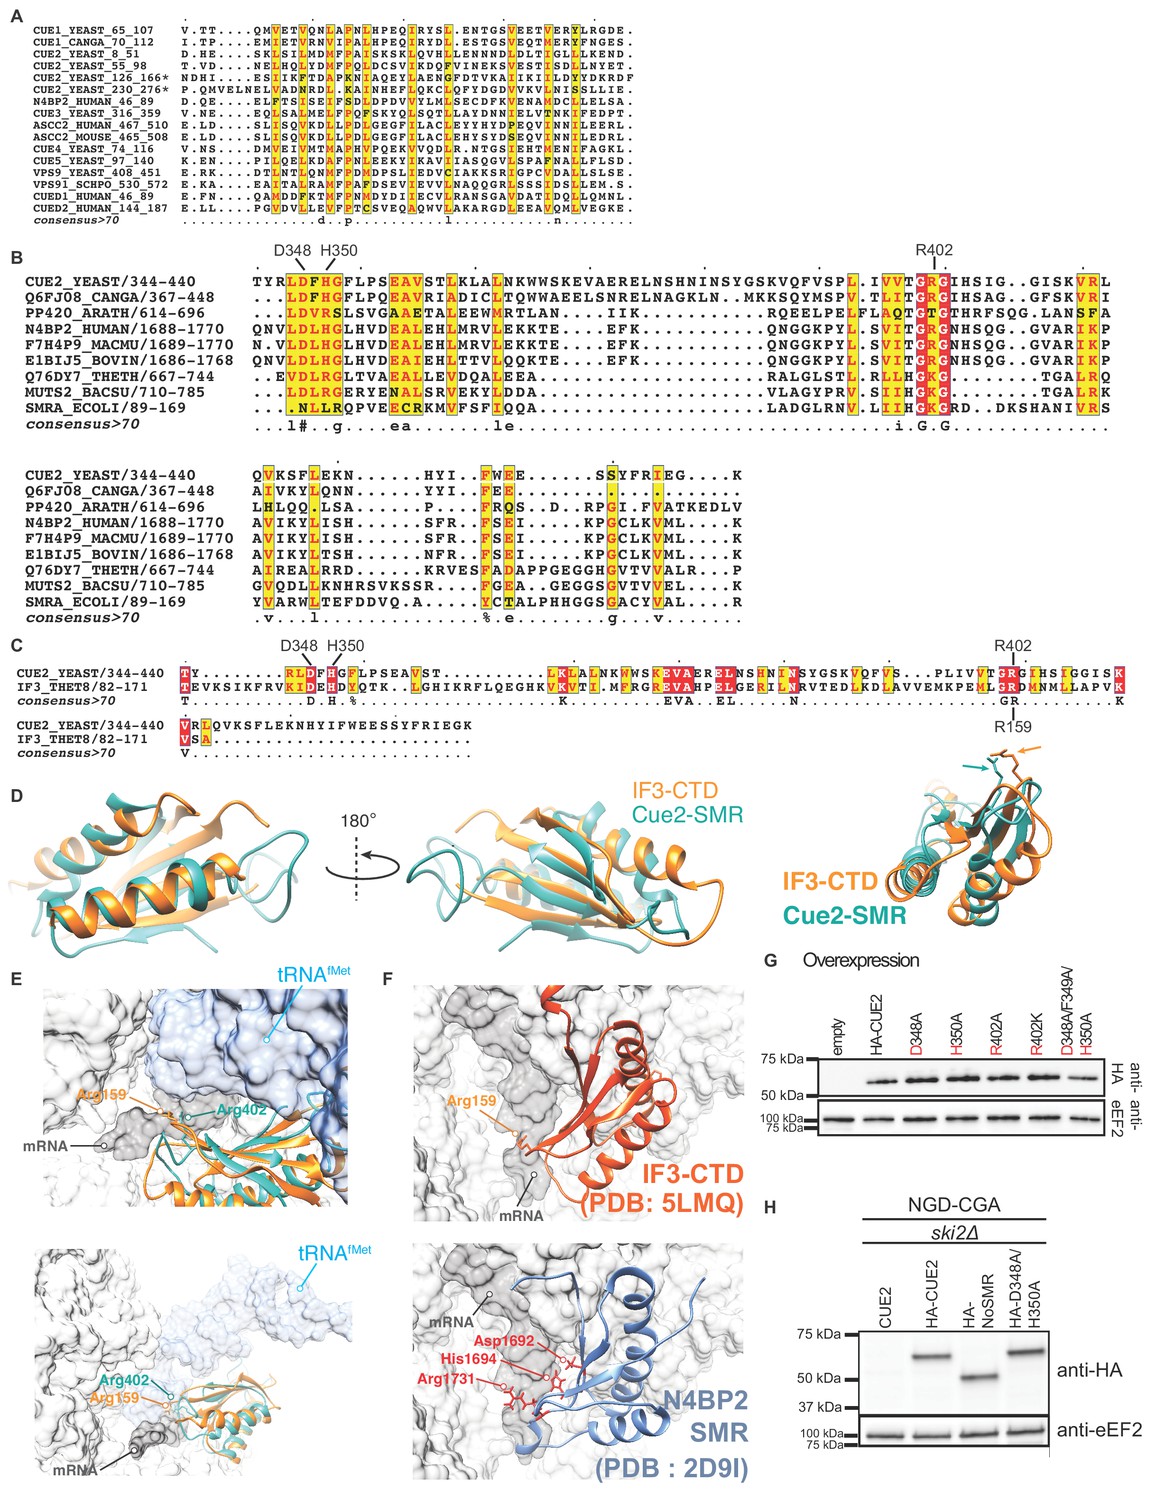
Characterizing Cue2 domains and confirming mutant in vivo expression levels.
(A) Sequence alignment of CUE domains of representative proteins. Conserved residues depicted in red on yellow background. Putative ubiquitin binding domains of Cue2 indicated by asterisks. (B) Sequence alignment of SMR domains of representative proteins. Identical residues shown in white on red background; conserved residues shown in red on yellow background. (C) Structure-based sequence alignment of the SMR domain of Saccharomyces cerevisiae Cue2 (residues 344–440) with the C-terminal domain (CTD) of Thermus thermophilus translation initiation factor 3 (IF-3) (residues 82–171). Identical residues depicted in white on red background; conserved residues depicted in red on yellow background. (D) Superimposition of the CTD of IF3 (orange, PDB: 1TIG [Biou et al., 1995]) and a homology model of the SMR domain of Cue2 (cyan) showing structural conservation between the two domains. (E) Modeling of the Cue2-SMR homology model in the context of IF3 and tRNAfMet bound 30S pre-initiation complex (PIC) (PDB: 5LMQ, State 2A [Hussain et al., 2016], also see Figure 2C–D). Light gray, 30S; dark gray, mRNA; blue, tRNAfMet; orange, IF3; cyan, Cue2-SMR. Vignettes show the position of Arg-159 of IF3 near the AUG-start codon at the P site, with the putative position of the catalytic Arg-402 of Cue2-SMR in the vicinity of the mRNA, based on homology modeling. (F) Alternate view of IF3-CTD (top panel) bound to 30S pre-initiation complex (PIC) with the tRNAfMet density subtracted (PDB: 5LMQ, State 2A, [Hussain et al., 2016]), and N4BP2 SMR domain (bottom panel) showing putative positions of the corresponding Asp-1692, His-1694 and Arg-1731 residues (PDB: 2D9I [Diercks et al., 2008]). (G) Western blot analysis of HA-tagged WT and mutant Cue2 overexpression levels for flow cytometry data in Figure 2E. (H) Western blot analysis of HA-tagged endogenous WT and mutant Cue2 levels for northern blot analysis in Figure 2H.
Figure 3
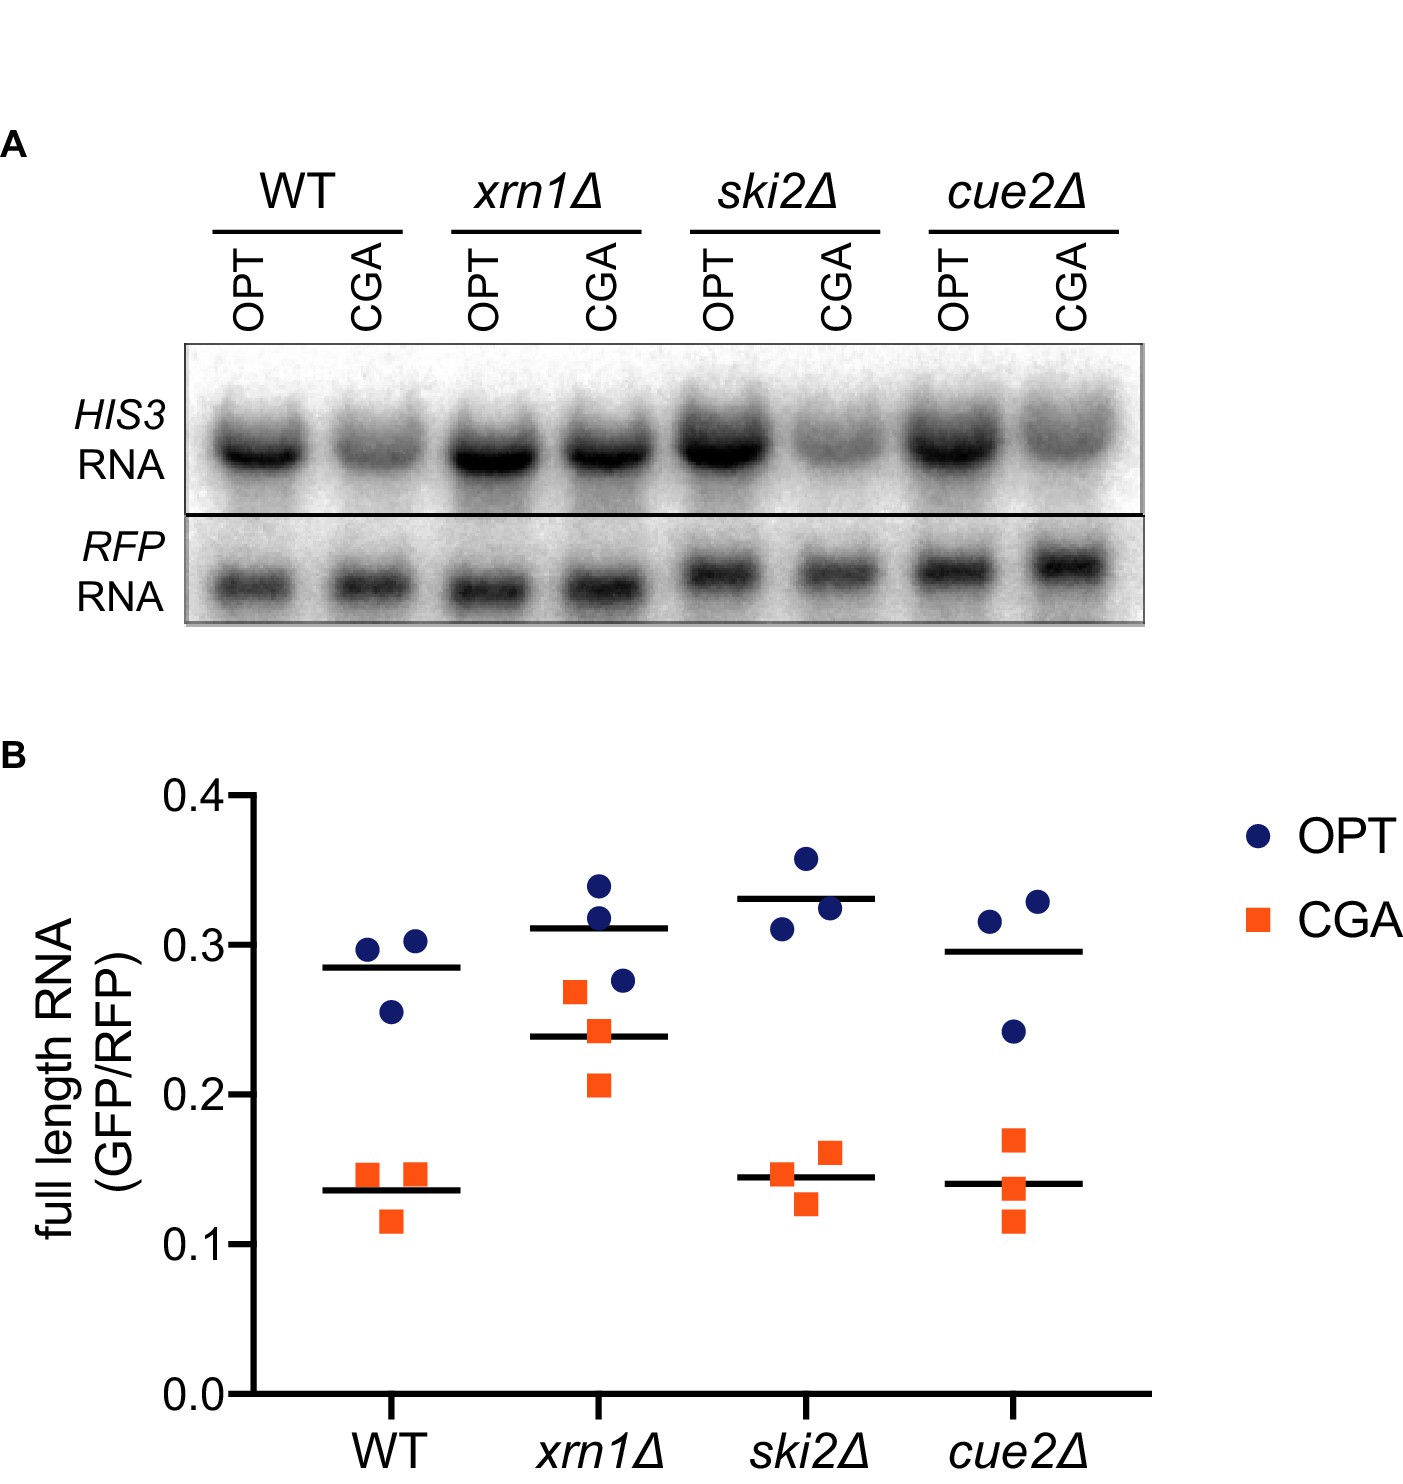
Canonical exonucleolytic decay by Xrn1 is the major contributor to NGD.
(A) Northern blot analysis of full length OPT and NGD-CGA reporter levels in the indicated strains. (B) Quantitated northern blot signals (in triplicate) from full length GFP/RFP mRNA levels for the indicated strains are plotted.
Figure 4 with 2 supplements
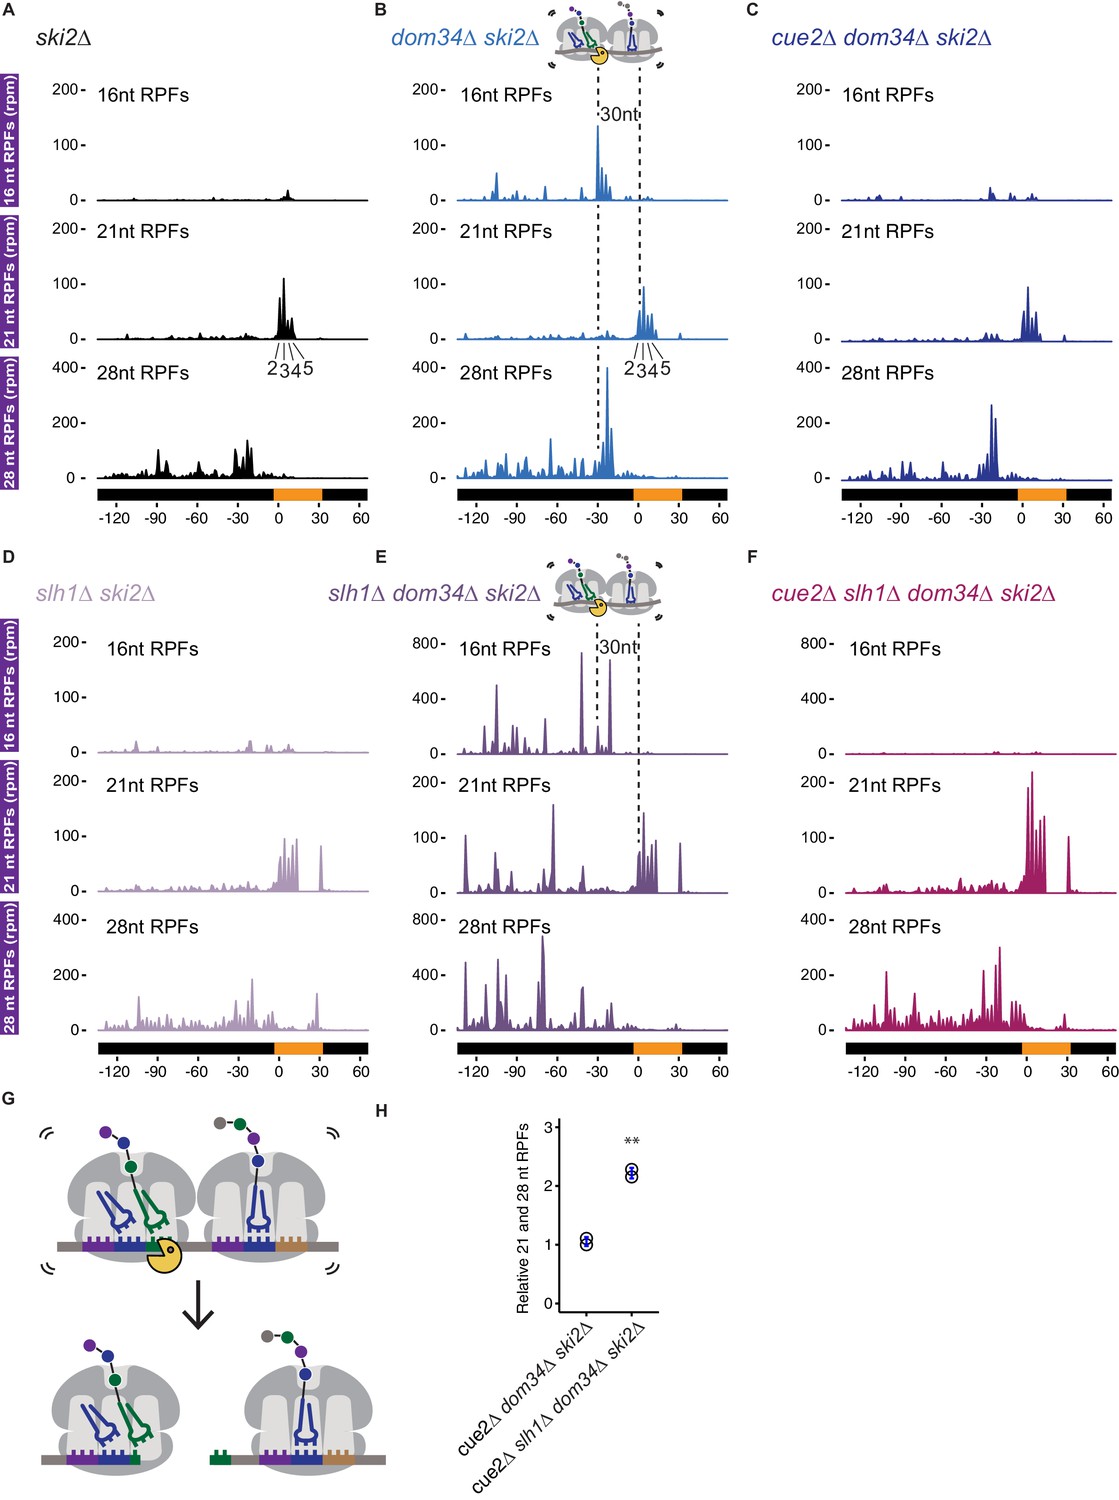
Ribosome profiling analysis of NGD on reporter mRNAs in various genetic backgrounds.
(A–F) 16, 21 and 28 nt RPFs mapped to NGD-CGA reporter in ski2∆ (A), dom34∆ ski2∆ (B), cue2∆ dom34∆ ski2∆ (C), slh1∆ ski2∆ (D), slh1∆ dom34∆ ski2∆ (E), and cue2∆ slh1∆ dom34∆ ski2∆ (F) strains with schematic depicting Cue2-mediated cleavage in the A sites of collided ribosomes. (G) Schematic of the precise Cue2 cleavage location on the mRNA, relative to collided ribosomes. (H) Comparison of the combined 21 and 28 nt ribosome occupancies on GFP, from 300 nt upstream of the (CGA)12 to the end of the (CGA)12 sequence, normalized to RFP for the indicated strains (n = 2). p-value from Student’s t-test is indicated by asterisks. **, p<0.01. See Figure 4—figure supplements 1–2.
Figure 4—figure supplement 1
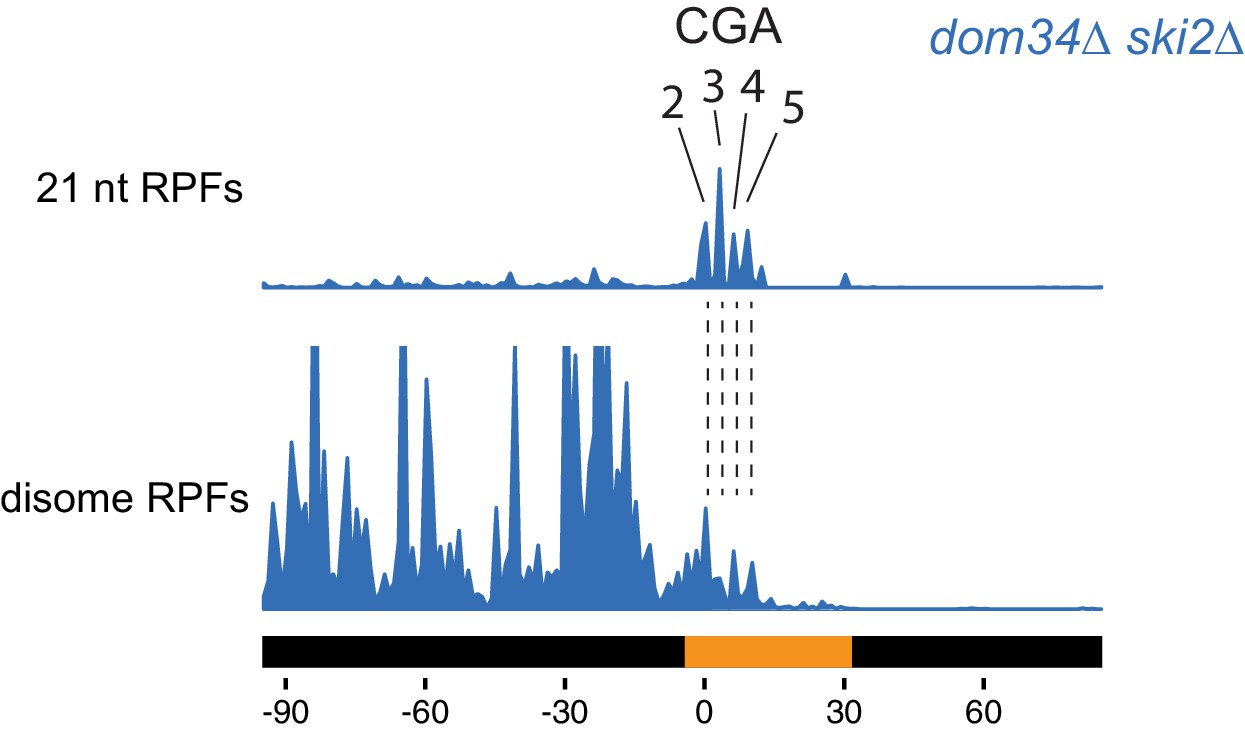
Disome and monosome footprints are consistent in mapping the leading ribosome.
Comparison between monosome 21 nt RPFs and disome footprints. Disome footprints show predominant ribosome stall site at the 2nd to 5th CGA codons.
Figure 4—figure supplement 2
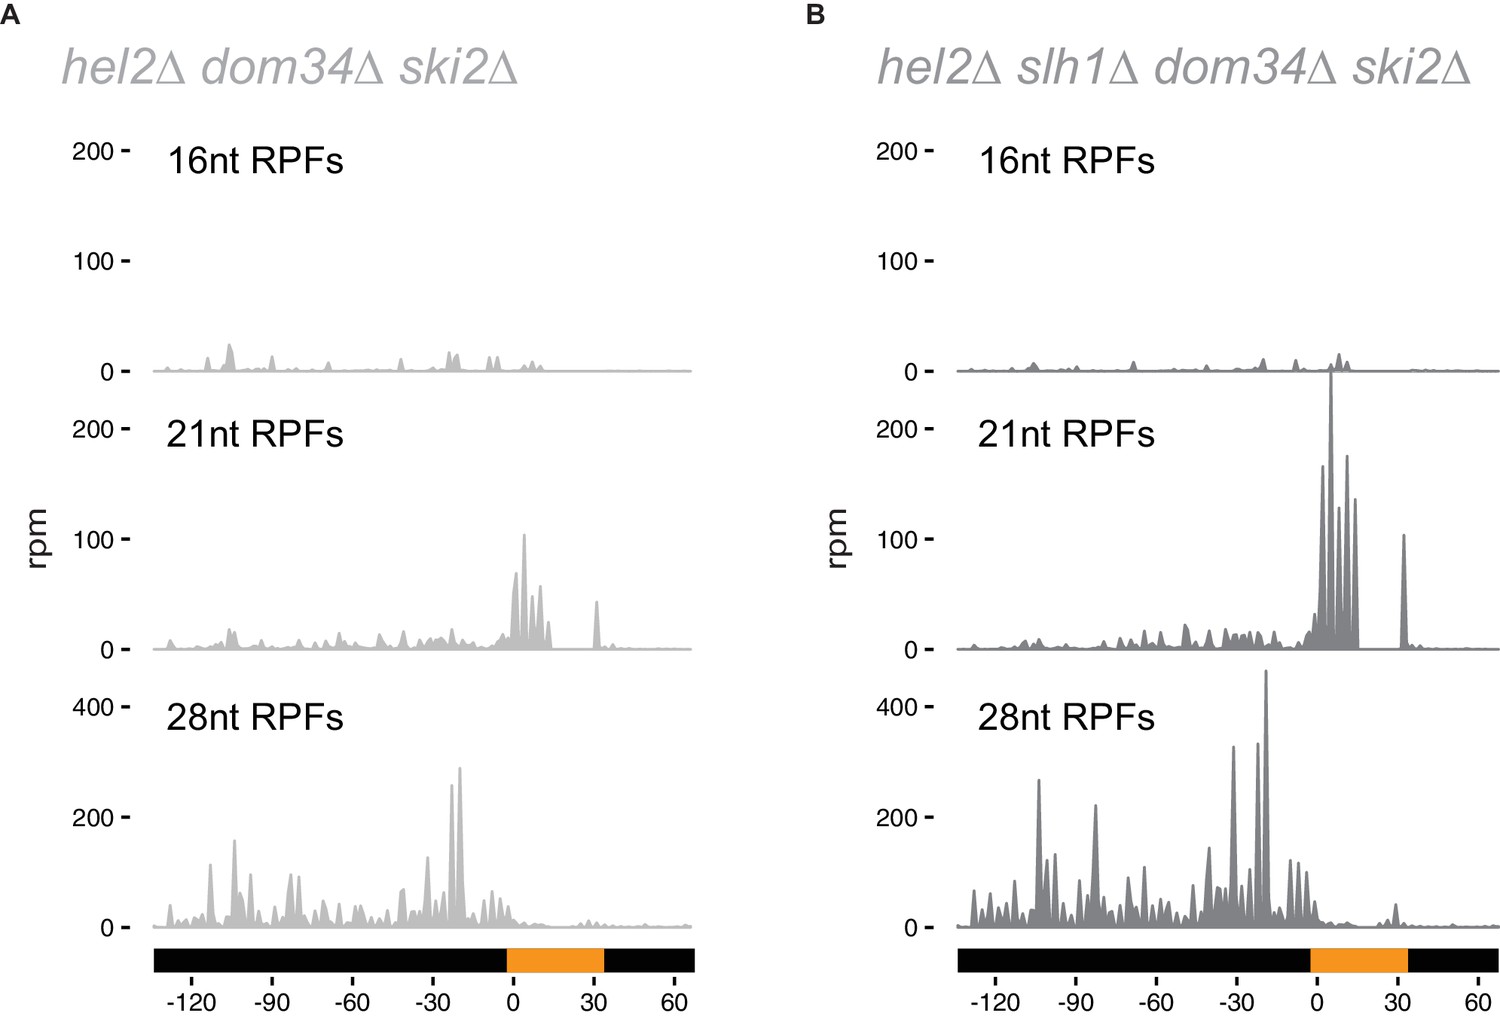
Hel2 is required for endonucleolytic cleavage at stall sites.
16, 21 and 28 nt RPFs on the NGD-CGA reporter from hel2∆ dom34∆ ski2∆ (A) and hel2∆ slh1∆ dom34∆ ski2∆ (B) strains.
Figure 5 with 1 supplement
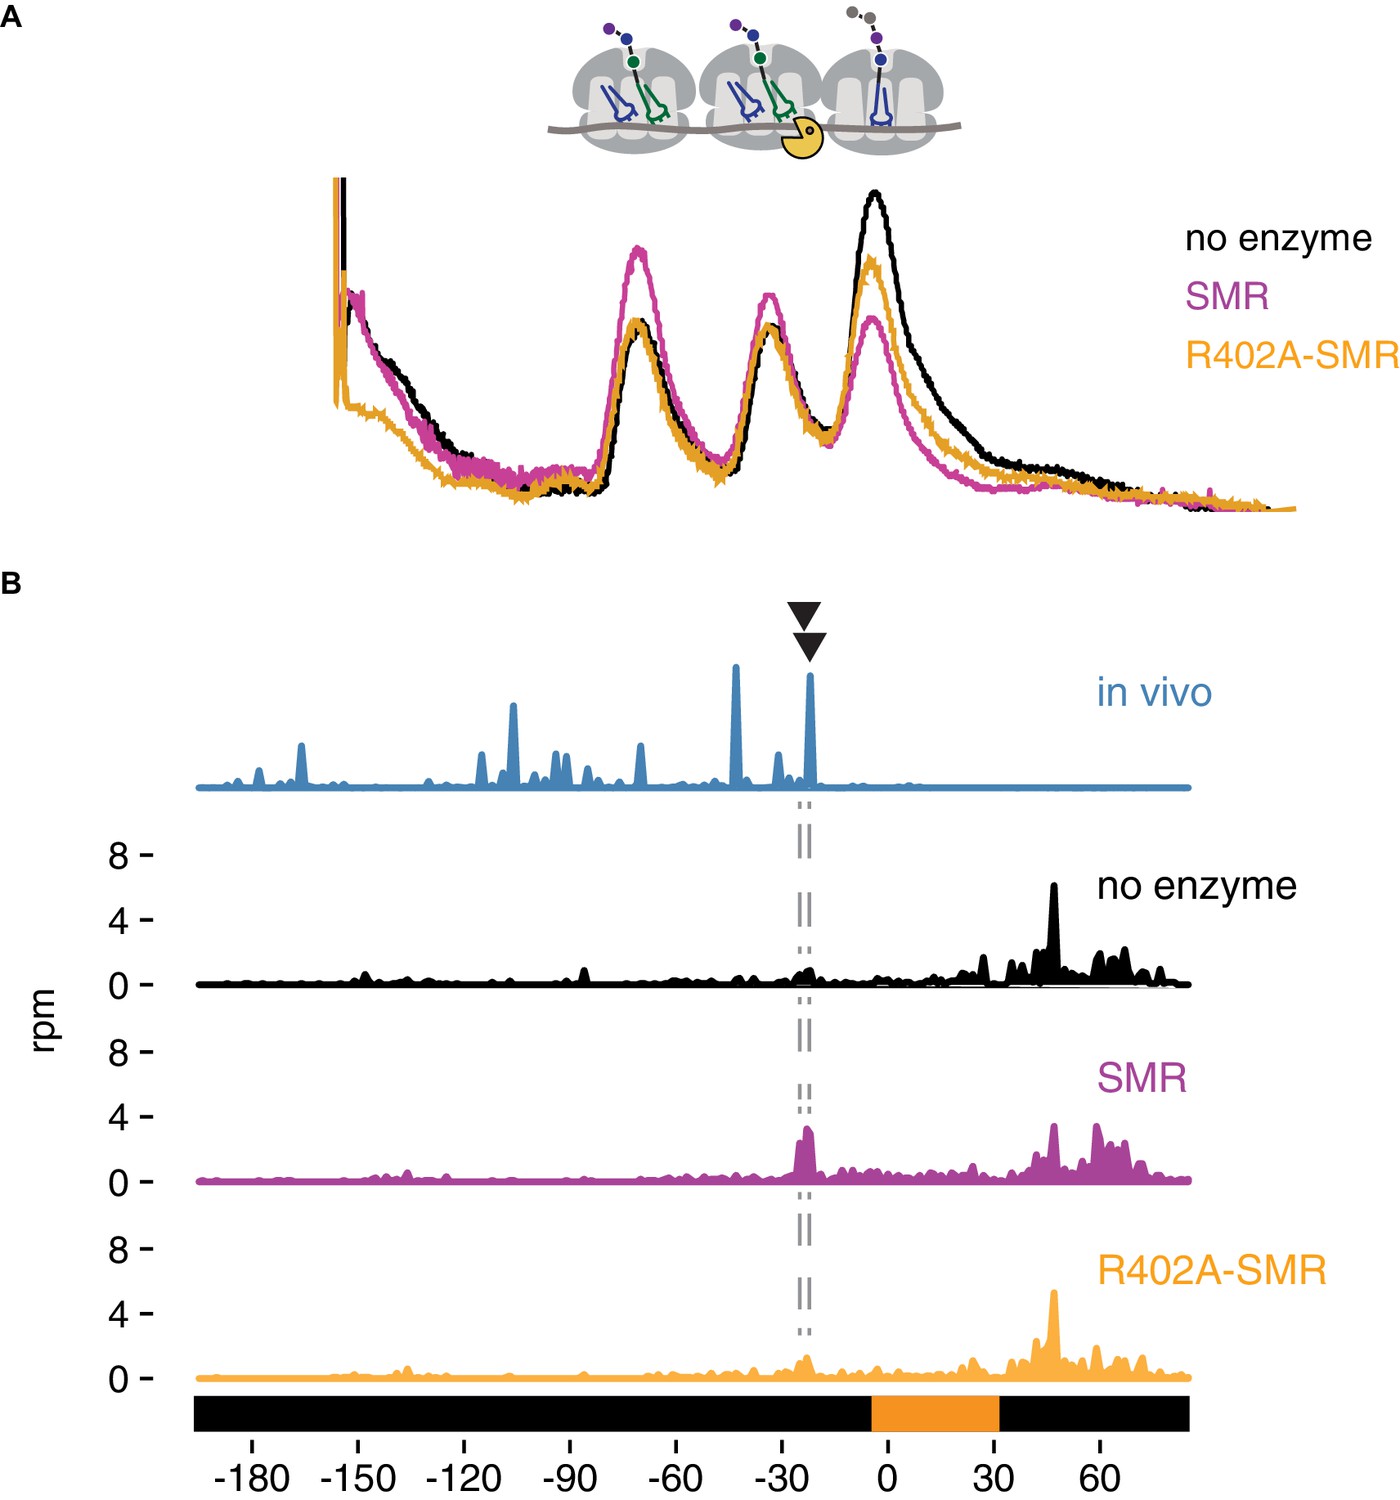
In vitro cleavage of colliding ribosomes by purified Cue2-SMR.
(A) Absorbance at 260 nm (y-axis) for sucrose gradient of nuclease resistant trisomes treated with no enzyme (black), the SMR domain of Cue2 (pink), or the SMR-R402A mutant Cue2 (orange). (B) In vivo 16 nt RPFs from the slh1∆ dom34∆ ski2∆ strain (cyan) aligned relative to the 60–65 nt RPFs from the combined fractions (mono-, di- and trisomes) treated with no enzyme (black), SMR domain (pink), or R402-SMR (orange) in vitro. Arrowheads indicate the positions where the in vitro and the in vivo cleavages coincide. See Figure 5—figure supplement 1.
Figure 5—figure supplement 1
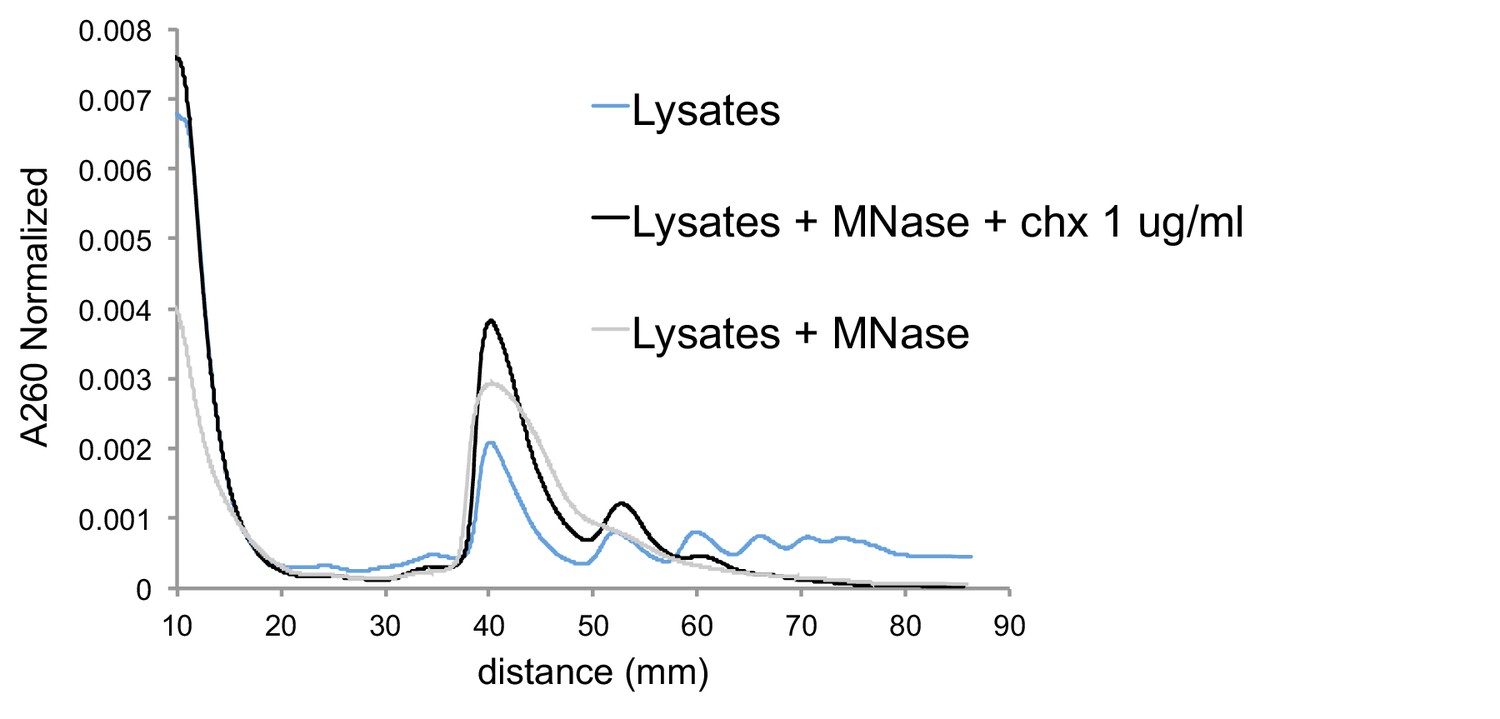
Cycloheximide-induced cells give MNase-resistant trisome peak.
Sucrose gradients of undigested lysates from cells with low-dose cycloheximide treatment (blue), MNase digested lysates from cells with no drug treatment (gray), and MNase digested lysates from cells with low-dose cycloheximide treatment (black). A260s are normalized to area under the curve, excluding mRNPs.
Figure 6 with 1 supplement

Cue2 targets prematurely polyadenylated mRNAs genome-wide for NGD.
(A) Ratio of 16 nt over 20–32 nt RPFs plotted in dom34∆ ski2∆ and cue2∆ dom34∆ ski2∆ strains. Genes in orange correspond to those with reproducibly decreased 16 nt RPFs upon CUE2 deletion. Pink dots indicate genes where premature polyadenylation was identified empirically from sequencing data. Red dots indicate the overlap between the pink and orange dots. NGD-CGA reporter, YAP1 and RNA14 are labeled and shown in green, blue and purple, respectively. (B) Overlap (red) between annotated prematurely polyadenylated genes (pink) and genes on which CUE2 deletion had a substantial effect on 16 nt RPFs (orange). (C) Gene model examples of 16 nt RPFs mapped to genes, RNA14 (left) and YAP1 (right), in dom34∆ ski2∆ and cue2∆ dom34∆ ski2∆ strains with known premature polyadenylation sites indicated (gray traces; Pelechano et al., 2013). See Figure 6—figure supplement 1.
Figure 6—figure supplement 1
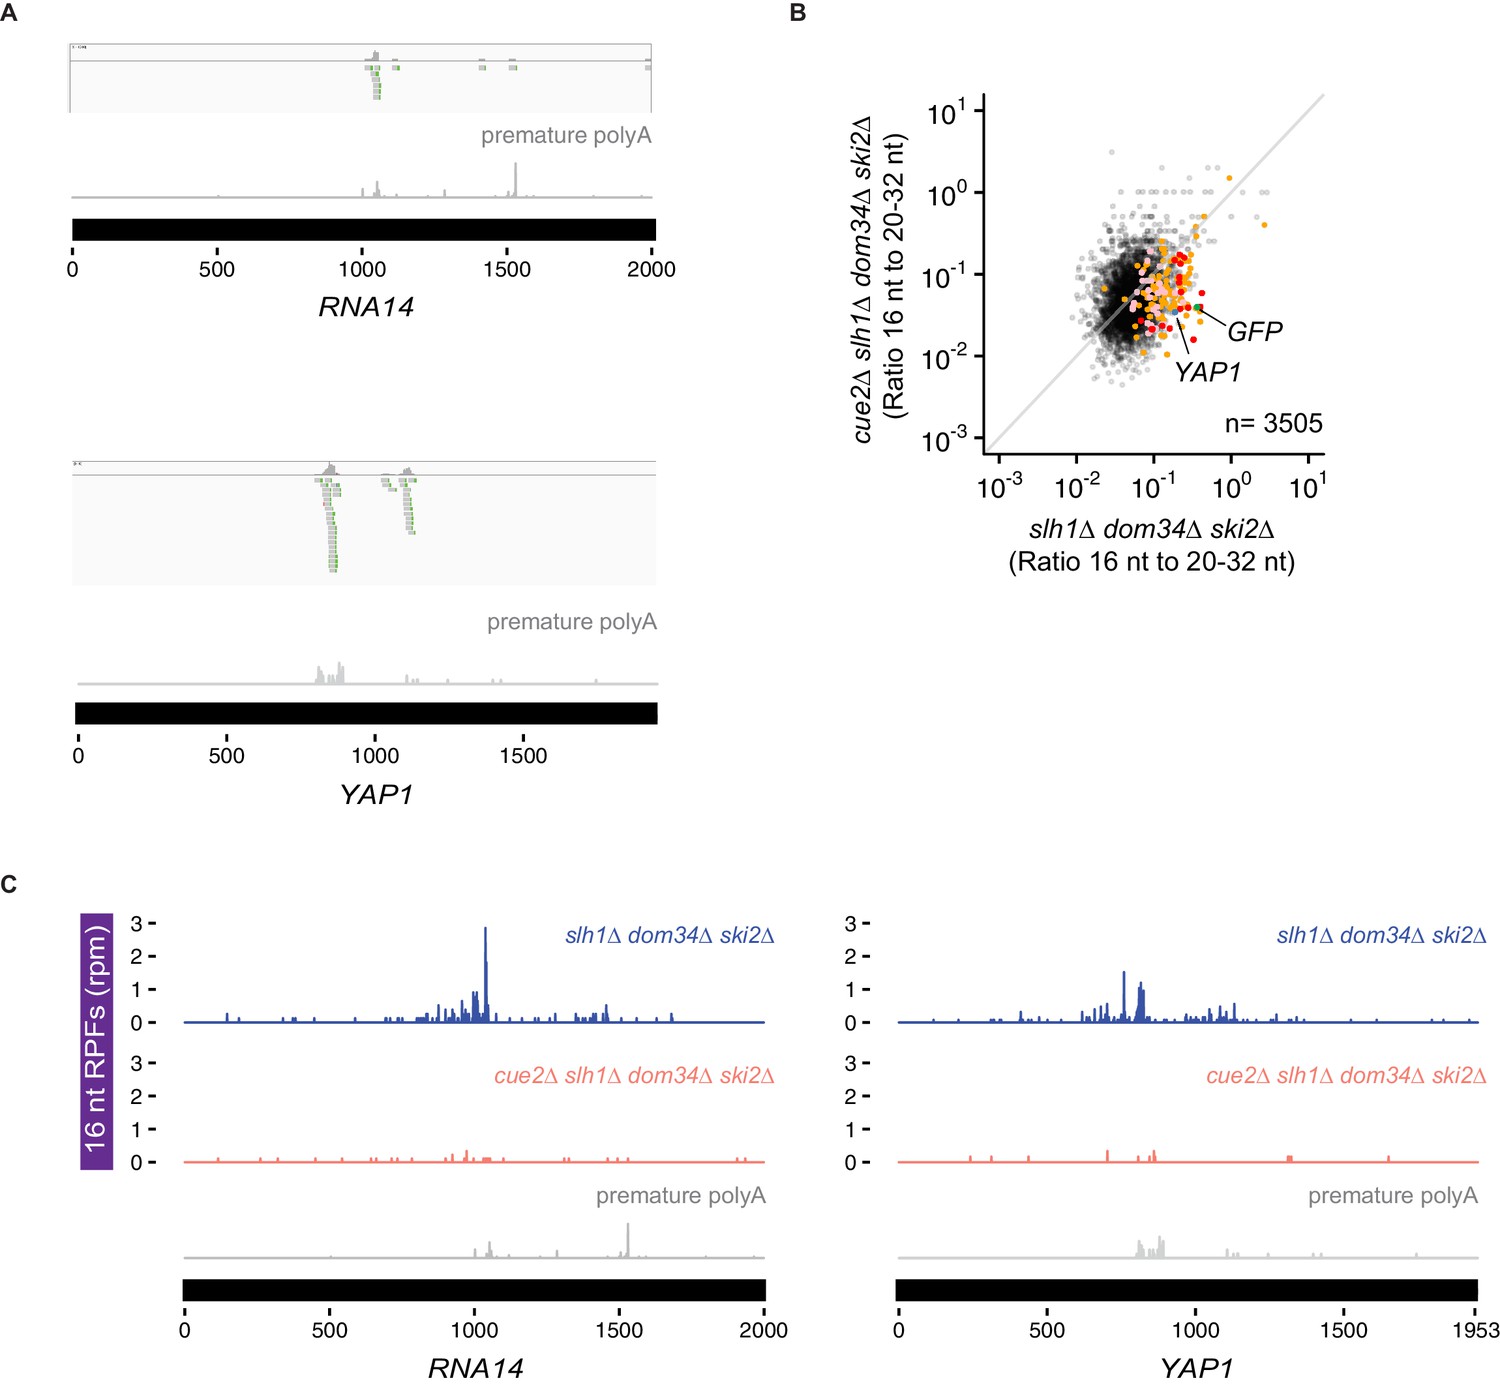
Cue2-dependent 16 nt RPFs on prematurely polyadenylated mRNAs.
(A) Examples of reads with untemplated A’s on RNA14 (top) and YAP1 (bottom). (B) Ratio of 16 nt over 20–32 nt RPFs plotted from slh1∆ dom34∆ ski2∆ and cue2∆ slh1∆ dom34∆ ski2∆ strains. Genes in orange indicate those with reproducibly decreased 16 nt RPFs upon CUE2 deletion. Pink dots indicate genes with premature polyadenylation identified empirically. NGD-CGA reporter, YAP1 and RNA14 are labeled and shown in green, blue and purple, respectively (C) Examples of 16 nt RPFs mapped to genes, RNA14 (left) and YAP1 (right) in slh1∆ dom34∆ ski2∆ and cue2∆ slh1∆ dom34∆ ski2∆ strains with known premature polyadenylation sites (gray traces, from Pelechano et al., 2013).
Figure 7

Multiple converging pathways for mRNA decay on NGD substrates.
Ribosome stalling triggers decay either by the exonuclease Xrn1 or by the endonuclease Cue2. The relative contributions of these pathways are modulated by the activity of Slh1 (member of the RQT complex). Ribosomes are gray; open reading frame is yellow; ‘xxx’ indicates a stalling sequence in the mRNA.
Tables
Key resources table
| Reagent type (species) or resource | Designation | Source or reference | Identifiers | Additional information |
|---|---|---|---|---|
| Antibody | GFP primary antibody – mouse monoclonal | Takara | 632381 | (1:5000) |
| Antibody | FLAG primary antibody – mouse monoclonal | Sigma | F3165 | (1:5000) |
| Antibody | PGK1 primary antibody – mouse monoclonal | Invitrogen | 22C5D8 | (1:5000) |
| Antibody | HA primary antibody – rat monoclonal | Roche | 11867423001 | (1:5000) |
| Antibody | eEF2 primary antibody – rabbit polyclonal | Kerafast | ED7002 | (1:10000) |
| Software, algorithm | Rstudio | http://www.rstudio.com/ | ||
| Software, algorithm | Graphpad prism | www.graphpad.com | ||
| Software, algorithm | skewer | Jiang et al., 2014 | Version 0.2.2 | |
| Software, algorithm | seqtk | https://github.com/lh3/seqtk | ||
| Software, algorithm | STAR | Dobin et al., 2013 | STAR_2.5.3a_modified | |
| Software, algorithm | ImageQuant TL | GE Healthcare Life Sciences | Version 8.1 | |
| Software, algorithm | Spotfinder | Saeed et al., 2003 | ||
| Software, algorithm | SGAtools | http://sgatools.ccbr.utoronto.ca/ | ||
| Software, algorithm | Custom software | https://github.com/ greenlabjhmi/Cue2eLife | yeast_KD2.gff | Find information on use in Materials and methods section 'Analysis of ribosome profiling data' |
| Software, algorithm | Custom software | https://github.com/greenlabjhmi/Cue2eLife | StarAlignment_KD2.py | Find information on use in Materials and methods section 'Analysis of ribosome profiling data' |
| Software, algorithm | Custom software | https://github.com/greenlabjhmi/Cue2eLife | Screen_data_analysis.R | Find information on use in Materials and methods section 'Screen data analysis' |
| Strains | All strains | Supplementary file 1 | ||
| Recombinant DNA reagent | All plasmids | Supplementary file 1 | ||
| Sequence based reagent | All primers and oligos | Supplementary file 1 | ||
| Peptide, recombinant protein | Cue2-SMR, and Cue2-SMR-R402A | This study | Find information in Materials and methods section – 'Cue2 E. coli expression plasmids' and 'Cue2-SMR prep' |
Additional files
-
Supplementary file 1
Methods supplementary table.
- https://doi.org/10.7554/eLife.49117.016
-
Transparent reporting form
- https://doi.org/10.7554/eLife.49117.017
Download links
A two-part list of links to download the article, or parts of the article, in various formats.
Downloads (link to download the article as PDF)
Open citations (links to open the citations from this article in various online reference manager services)
Cite this article (links to download the citations from this article in formats compatible with various reference manager tools)
The endonuclease Cue2 cleaves mRNAs at stalled ribosomes during No Go Decay
eLife 8:e49117.
https://doi.org/10.7554/eLife.49117


