Cortical tau deposition follows patterns of entorhinal functional connectivity in aging
- Helen Wills Neuroscience Institute, UC Berkeley, United States
- German Center for Neurodegenerative Disease, Germany
- Lawrence Berkeley National Laboratory, United States
Figures
Figure 1 with 2 supplements
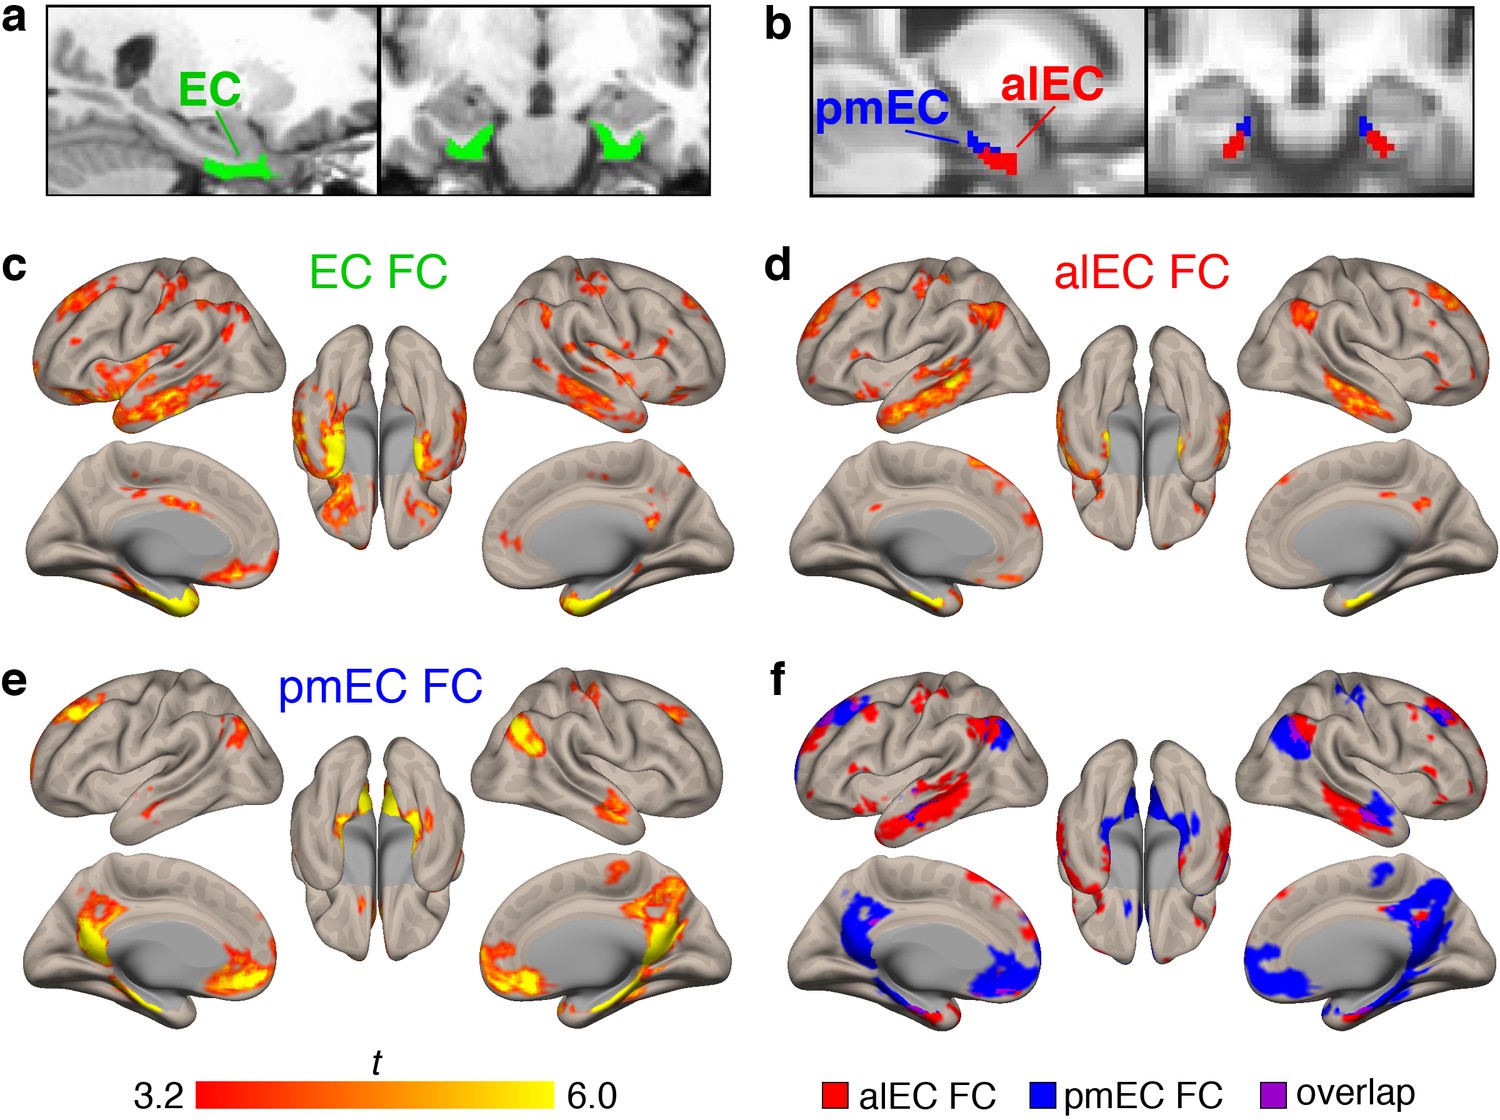
Functional connectivity (FC) of the different entorhinal seeds in healthy young adult (YA) participants.
(a) The full entorhinal seed (EC, green), including transentorhinal, lateral, and medial regions, was derived from FreeSurfer segmentation of each participant’s native space T1, and time series were extracted from native space fMRI data. (b) The anterolateral EC (alEC, red) and posteromedial EC (pmEC, blue) seeds were applied in template space, and time series were extracted before smoothing to preserve the spatial resolution of the seeds. (c–e) Seed-to-voxel FC analyses were performed for each seed with semi-partial correlations. Group level FC results were derived from one-sample t-tests controlling for age and sex, and thresholded at the voxel (p<0.001 uncorrected) and cluster level (p<0.05, FDR corrected). Results reflect t-statistics. (c) FC of the EC seed included medial temporal, lateral temporal, and limbic regions. (d) FC of the alEC seed included anterior temporal regions, such as medial and lateral temporal lobe. (e) FC of the pmEC seed included posterior medial regions, such as the parahippocampal gyrus and posterior cingulate. (f) Binary maps of alEC (red) and pmEC (blue) FC show little spatial overlap (purple) between the FC patterns. See Figure 1—figure supplement 1 for parallel results using OA FC. See Figure 1—figure supplement 2 for a visualization of gray matter voxels removed due to signal drop out, and alEC and pmEC seeds overlaid on the group-mean functional image.
Figure 1—figure supplement 1
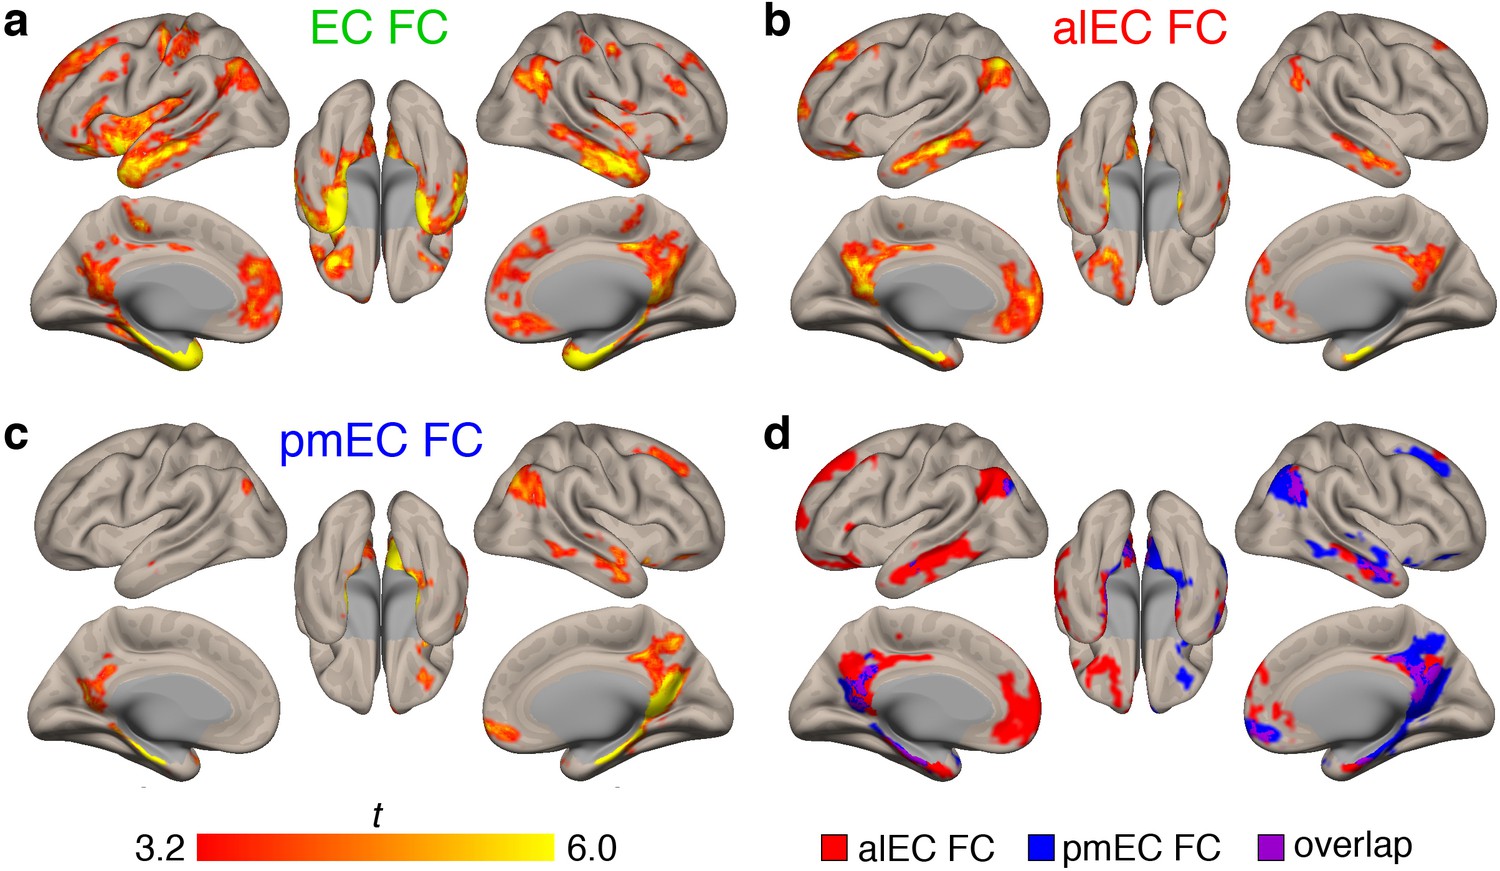
Functional connectivity (FC) of the different entorhinal seeds in older adult (OA) participants.
Seed-to-voxel FC analyses were performed for each seed. Group level FC results were derived from one-sample t-tests controlling for age and sex, and thresholded at the voxel (p<0.001 uncorrected) and cluster (p<0.05 FDR corrected) levels. Results reflect t-statistics. (a) FC of the EC seed included medial temporal, lateral temporal, and limbic regions. The dice similarity coefficient (DSC) between the YA and OA EC maps was 0.45, reflecting moderate overlap. (b) FC of the alEC seed included anterior temporal regions, as well as some posterior medial regions such as the posterior cingulate cortex. DSC between YA and OA alEC maps was 0.36, reflecting fair overlap. (e) FC of the pmEC seed included posterior medial regions, although reduced in scope compared to YA FC patterns. DSC between YA and OA pmEC maps was 0.53, reflecting moderate overlap. (f) Binary maps of the alEC (red) and pmEC (blue) FC show spatial overlap (purple) between the FC patterns, especially in posteromedial cortex.
Figure 1—figure supplement 2
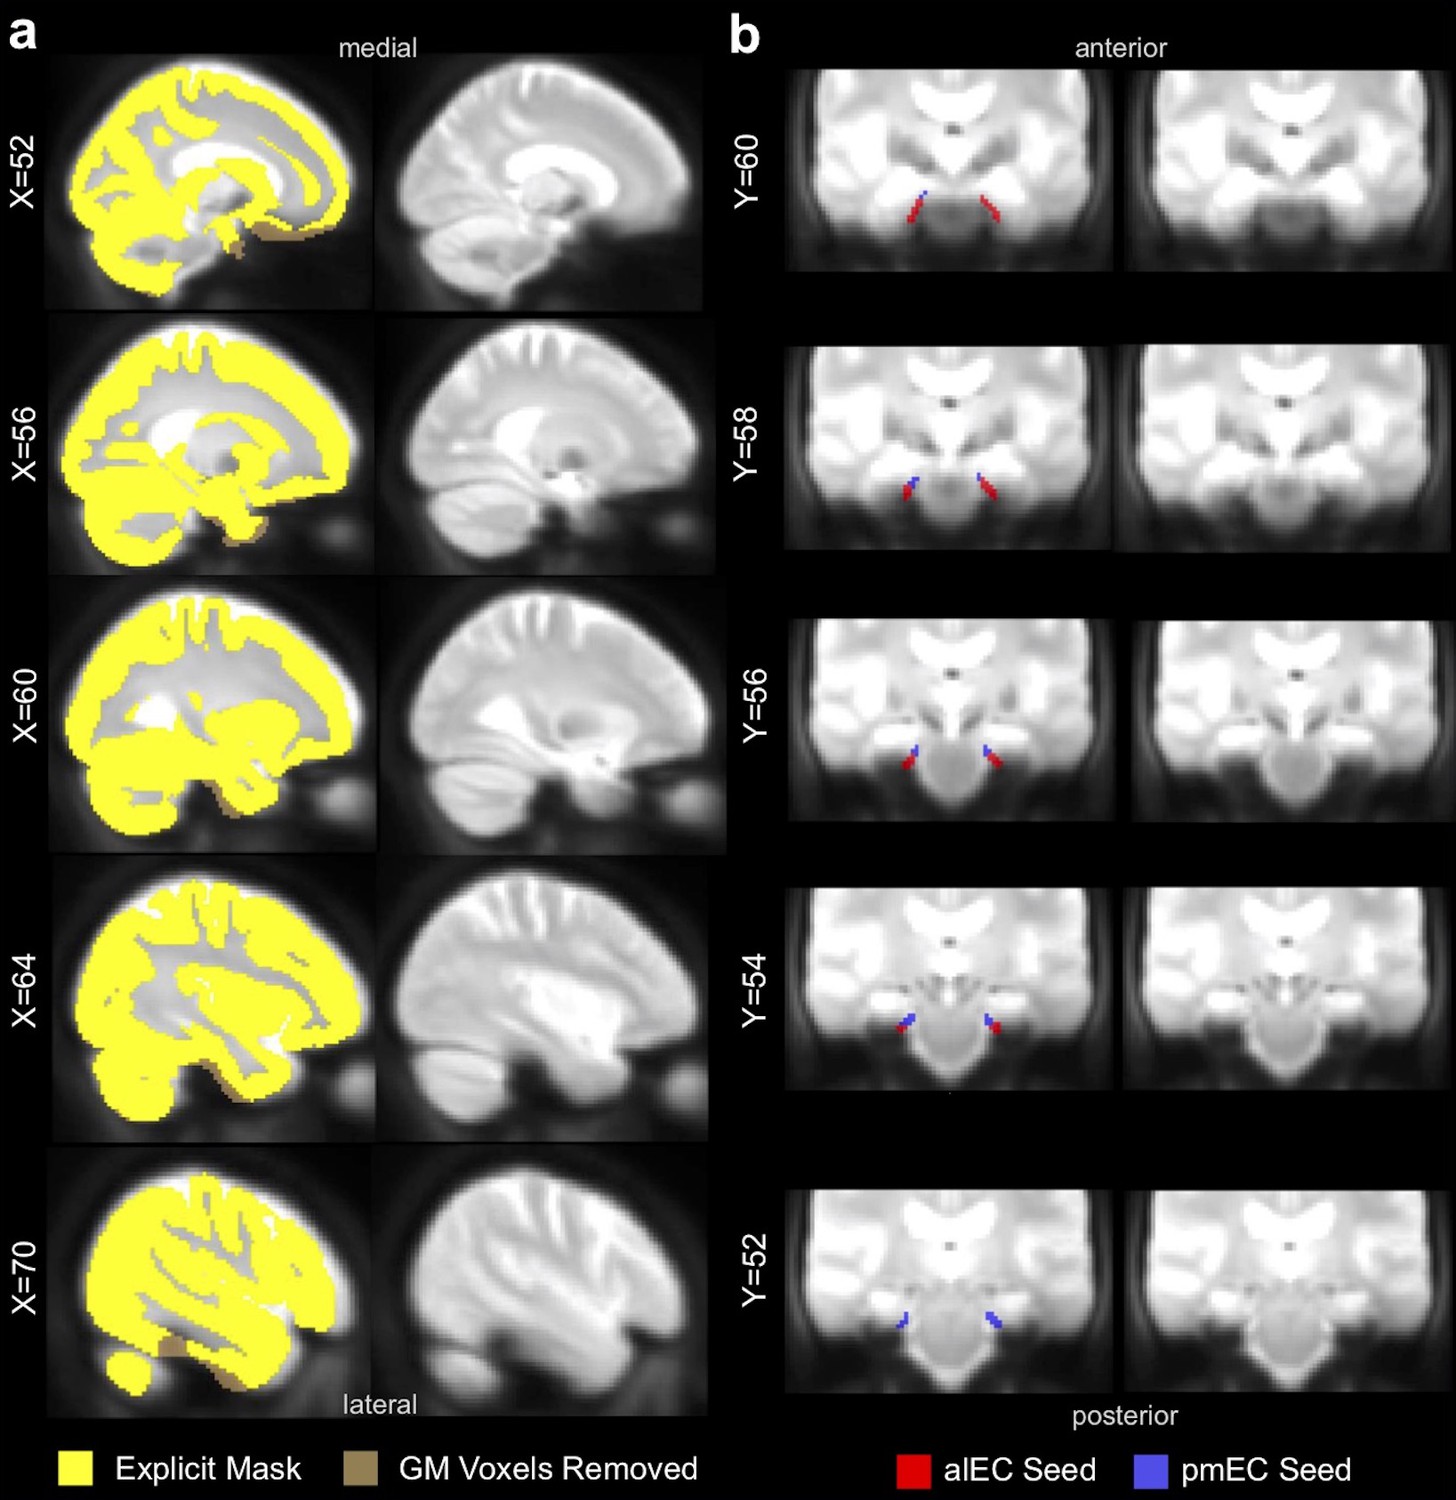
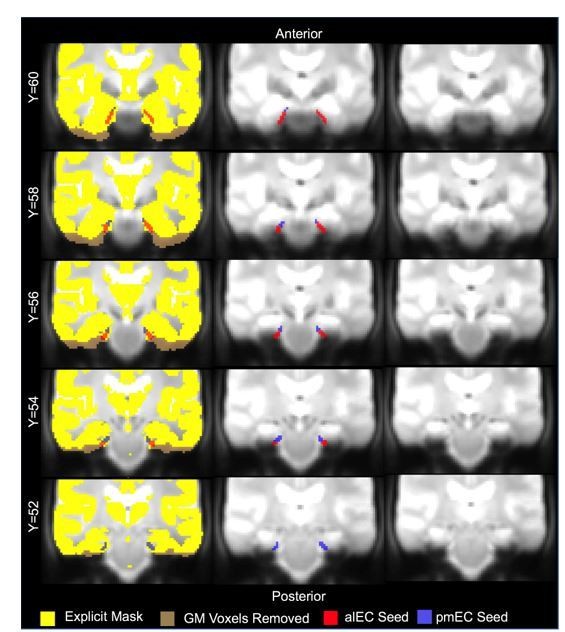
Signal drop out demonstrated with group-mean functional images.
(a) A group-level explicit mask (yellow) was created by removing GM voxels of low signal (<40% of the mean signal across the gray matter; shown in brown) from a gray matter mask. This explicit mask was applied to all functional connectivity analyses to ensure regions of low signal did not contribute to results. (b) alEC (red) and pmEC (blue) template space seeds are overlaid on the group-mean functional image to visually demonstrate the average signal in these regions. For functional connectivity analyses, voxels of low signal were removed from each ROI on a participant-level basis.
Figure 2 with 1 supplement
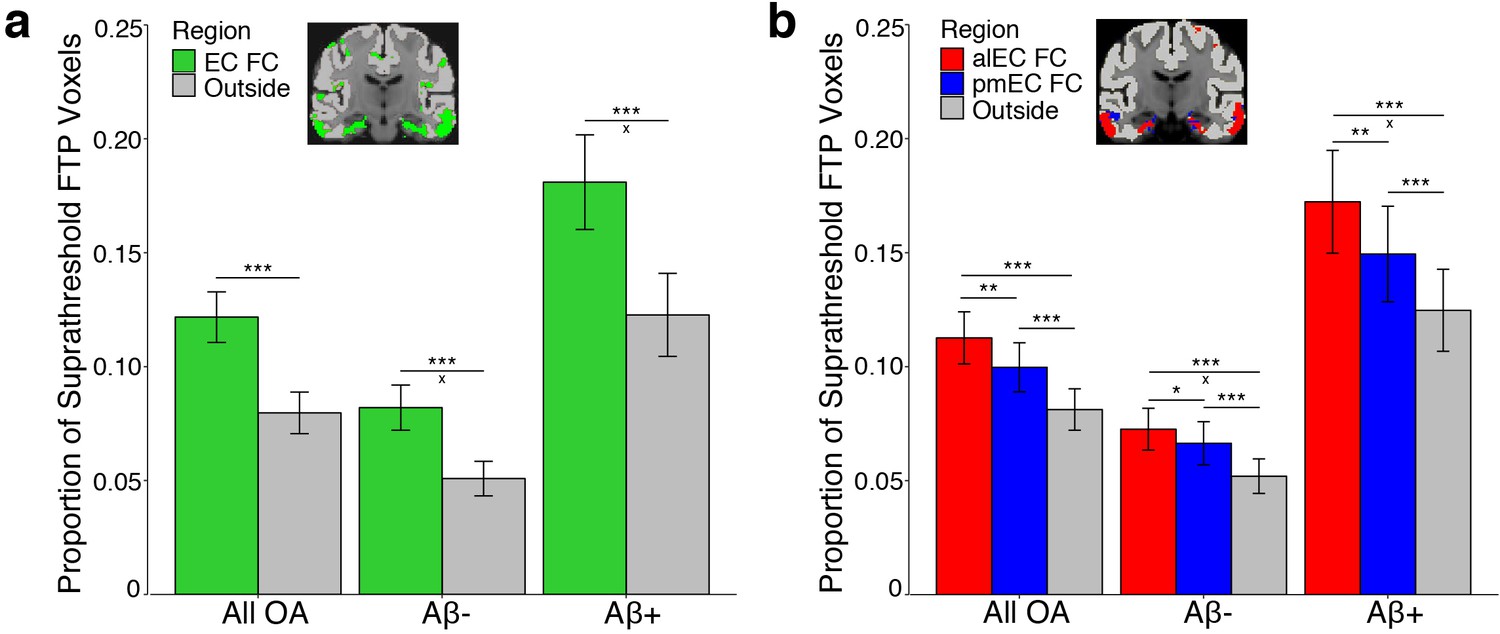
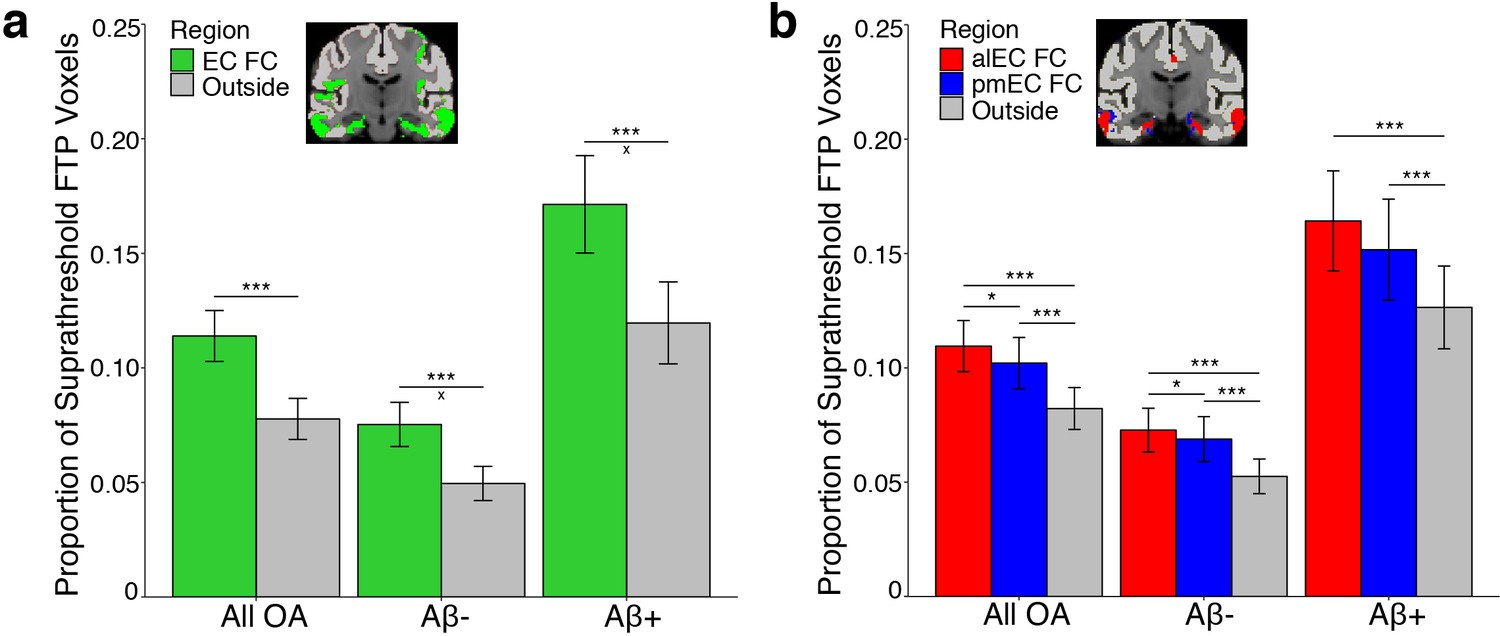
Tau preferentially deposits within regions of functional connectivity (FC) with entorhinal cortex.
Tau deposition, defined as the proportion of suprathreshold FTP voxels (>1.4 SUVR), was measured in each FC mask and in cortical regions that did not demonstrate FC with the seeds (‘Outside’). Tau deposition in each region was contrasted with repeated measures ANCOVAs and post-hoc t-tests. (a) Tau preferentially deposited within regions of EC FC (green) compared to outside cortical regions (gray). Region by Aβ status interactions were driven by an increased mean difference between the EC and outside cortical regions in the Aβ+ compared to the Aβ- group. (b) Tau preferentially deposited within regions of alEC FC (red) compared to both pmEC FC (blue) and outside cortical regions (gray), and in pmEC FC compared to outside cortical regions. Region by Aβ status interactions were driven by an increased mean difference between alEC FC and outside cortical regions in the Aβ+ compared to the Aβ- group. See Figure 2—figure supplement 1 for parallel results using OA FC. ***p<0.001, **p<0.01, *p<0.05; ‘x’ indicates the drivers of significant Aβ status interactions (p<0.05); Error bars indicate the standard error of the mean.
-
Figure 2—source data 1
Source data for the data visualized in Figure 2.
- https://doi.org/10.7554/eLife.49132.011
Figure 2—figure supplement 1
Tau deposition within regions of functional connectivity (FC) with entorhinal cortex derived from FC from the older adult (OA) participants.
Tau deposition, defined as the proportion of suprathreshold FTP voxels (>1.4 SUVR), was measured in each FC mask and in outside cortical regions that did not demonstrate FC. Tau deposition in each region was contrasted with repeated measures ANCOVAs and post-hoc t-tests. (a) Tau preferentially deposited within regions of significant EC FC (green) compared to outside cortical regions (gray). Region by Aβ status interactions were driven by an increased mean difference between the EC and outside cortical regions in the Aβ+ compared to the Aβ- group. (b) Tau preferentially deposited within regions of alEC FC (red) compared to both pmEC FC (blue) and outside cortical regions (gray), and in pmEC FC compared to outside cortical regions. Region by Aβ status interactions were reduced to a trend. ***p<0.001, **p<0.01, *p<0.05; ‘x’ indicates the drivers of significant Aβ status interactions (p<0.05). Error bars indicate the standard error of the mean.
-
Figure 2—figure supplement 1—source data 1
Source data for the data visualized in Figure 2—figure supplement 1.
- https://doi.org/10.7554/eLife.49132.010
Figure 3 with 1 supplement
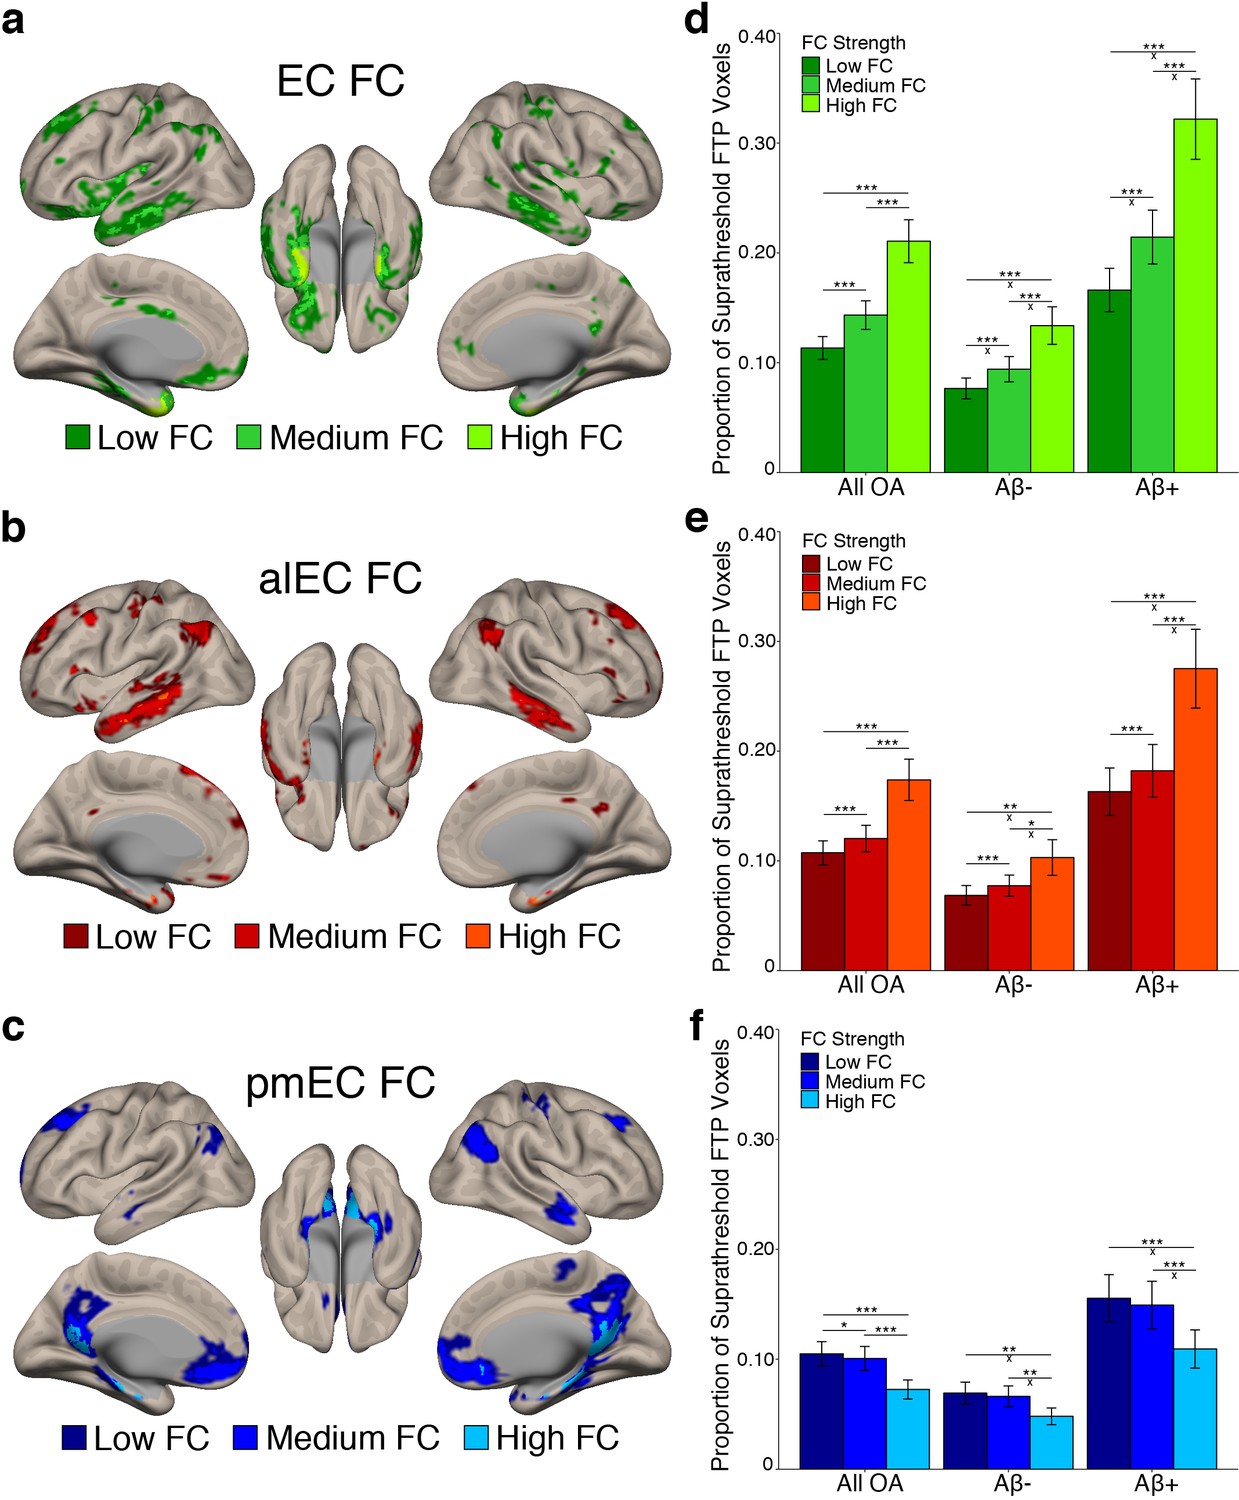
Stronger FC with a region is associated with higher levels of tau deposition in that region.
(a-c) To examine associations between tau and FC strength, group level YA FC masks for each EC seed were clustered into regions of low, medium, and high FC based upon the mean YA FC strength (beta value) of each voxel. (d-f) The proportion of suprathreshold FTP voxels (>1.4 SUVR) was calculated for each FC strength region (‘tau deposition’). Repeated measures ANCOVAs and post-hoc t-tests were performed to contrast tau deposition between each FC strength region. (d) EC FC strength was significantly related to tau deposition in a stepwise pattern, with tau increasing in low < medium < high FC regions. Aβ status interactions were observed between all comparisons. (e) Increasing alEC FC strength was also related to higher tau deposition in a stepwise fashion, and Aβ interactions were driven by the difference between high-medium and high-low FC regions. (f) Increasing pmEC FC strength was associated with decreases in tau deposition, and Aβ interactions were driven by the difference between high-medium and high-low FC regions. See Figure 3—figure supplement 1 for parallel results using OA FC. ***p<0.001, **p<0.01, *p<0.05; ‘x’ indicates the drivers of significant Aβ interactions (p<0.05). Error bars indicate the standard error of the mean.
-
Figure 3—source data 1
Source data for the data visualized in Figure 3.
- https://doi.org/10.7554/eLife.49132.015
Figure 3—figure supplement 1
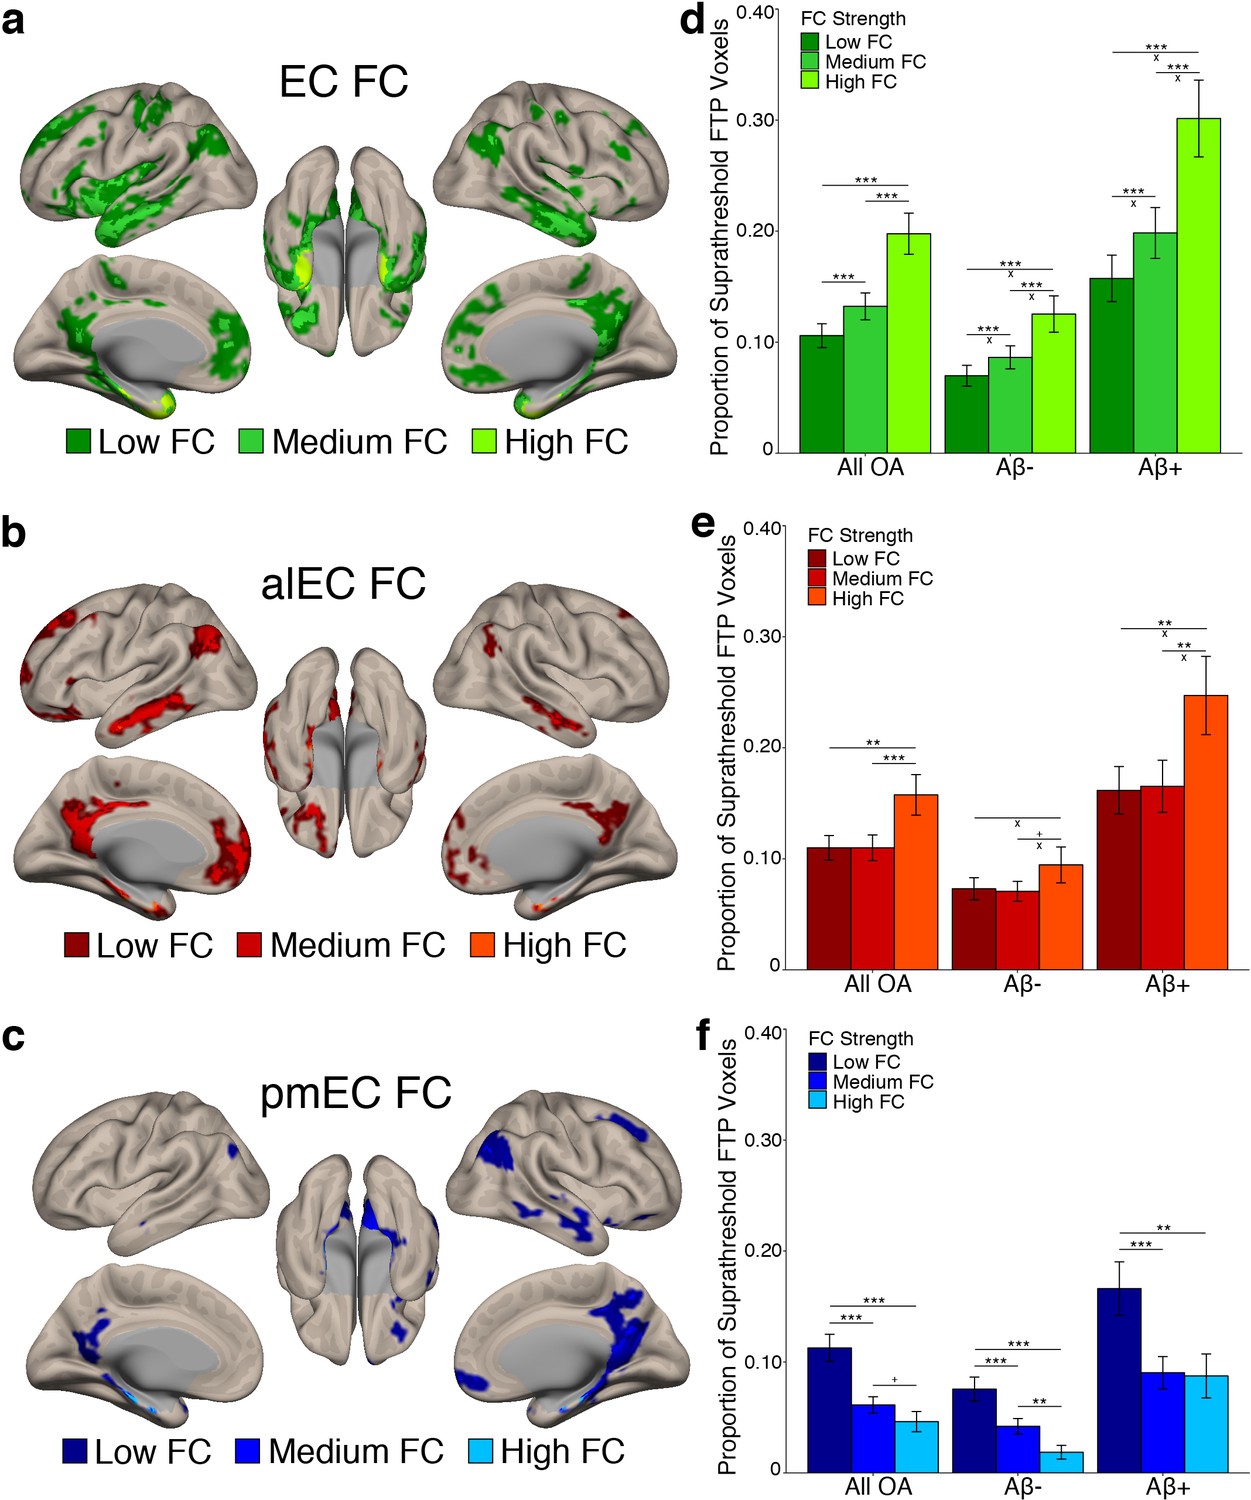
Stronger older adult (OA) functional connectivity (FC) to a region is associated with higher levels of tau deposition to that region.
(a-c) Group level FC masks from the OA participants for each seed were divided into regions of low, medium, and high FC based upon the mean FC strength (beta value) of each voxel with one-dimensional k-means clustering. (d-f) The proportion of suprathreshold FTP voxels (>1.4 SUVR) was calculated in each FC strength region (‘tau deposition’). Repeated measures ANCOVAs and post-hoc t-tests were performed to contrast tau deposition in each FC strength region. (d) EC FC strength was significantly related to tau deposition in a stepwise pattern, with tau increasing in low <medium < high FC regions. Aβ status interactions were observed between all comparisons. (e) Regions of high alEC FC strength had more tau deposition than regions of medium or low FC. Aβ interactions were driven by the difference between high-medium and high-low FC regions. (f) Regions of low pmEC FC strength had more tau deposition than regions of medium or high FC. Aβ interactions were reduced to a trend. ***p<0.001, **p<0.01, *p<0.05; ‘x’ indicates the drivers of significant Aβ interactions (p<0.05). Error bars indicate the standard error of the mean.
-
Figure 3—figure supplement 1—source data 1
Source data for the data visualized in Figure 3—figure supplement 1.
- https://doi.org/10.7554/eLife.49132.014
Figure 4 with 1 supplement
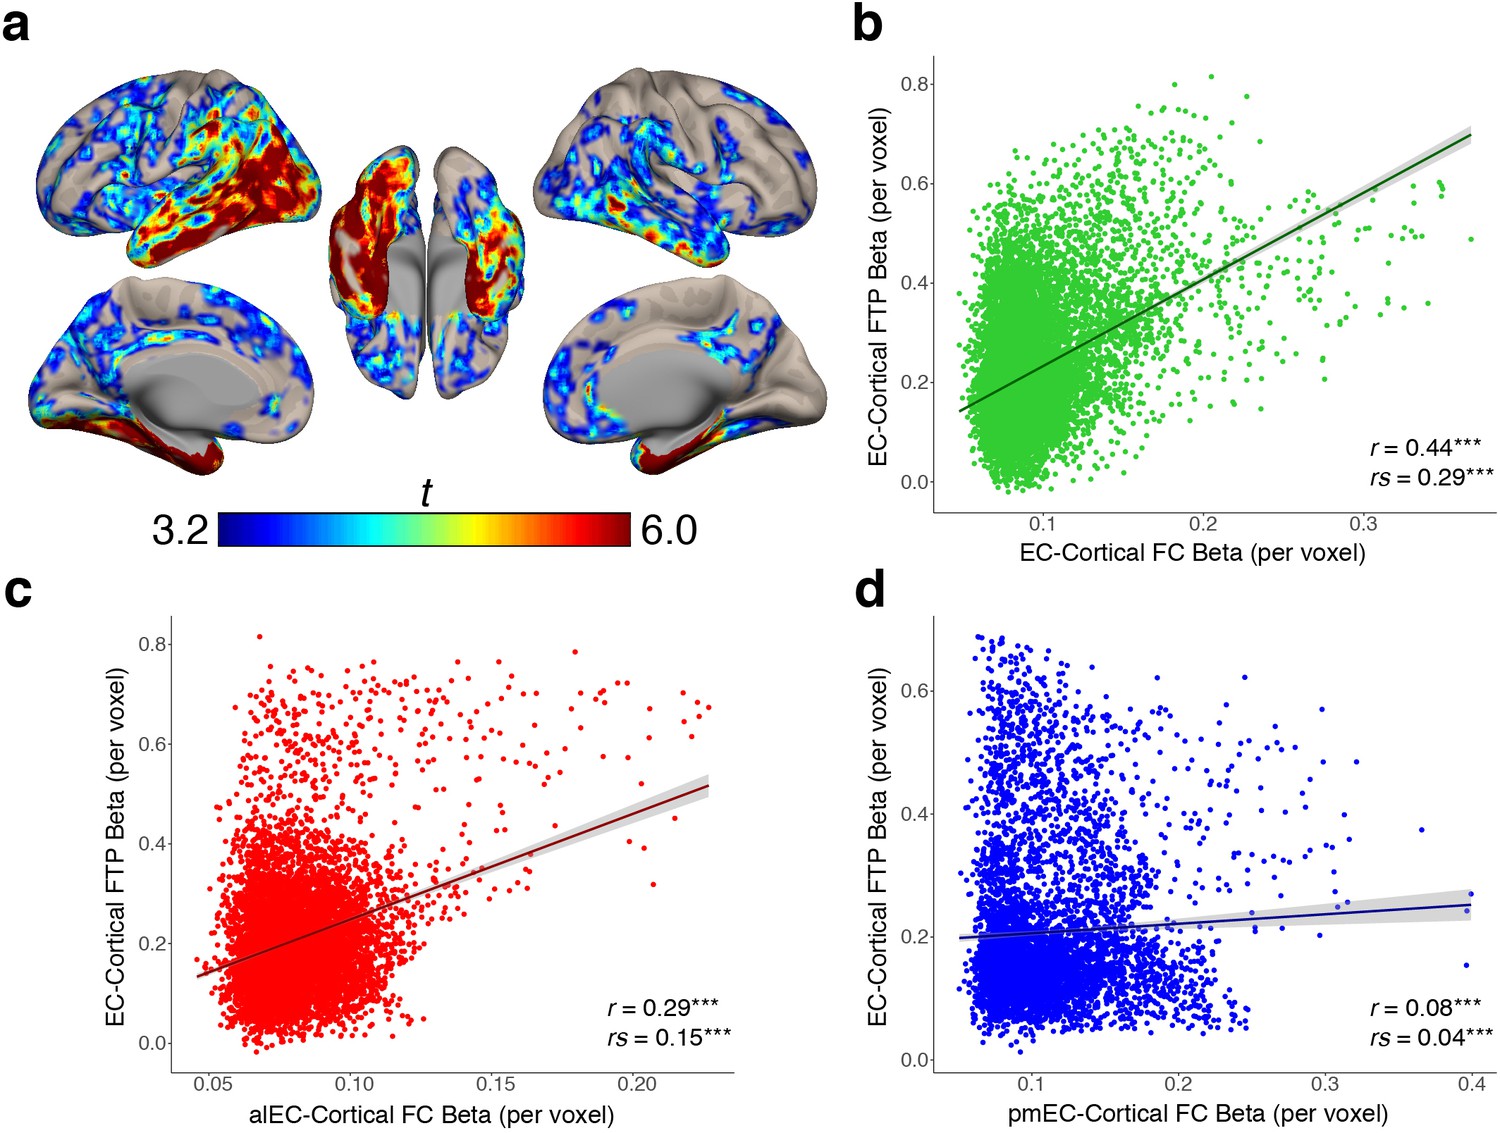
EC-cortical tau associations and relationships with FC strength.
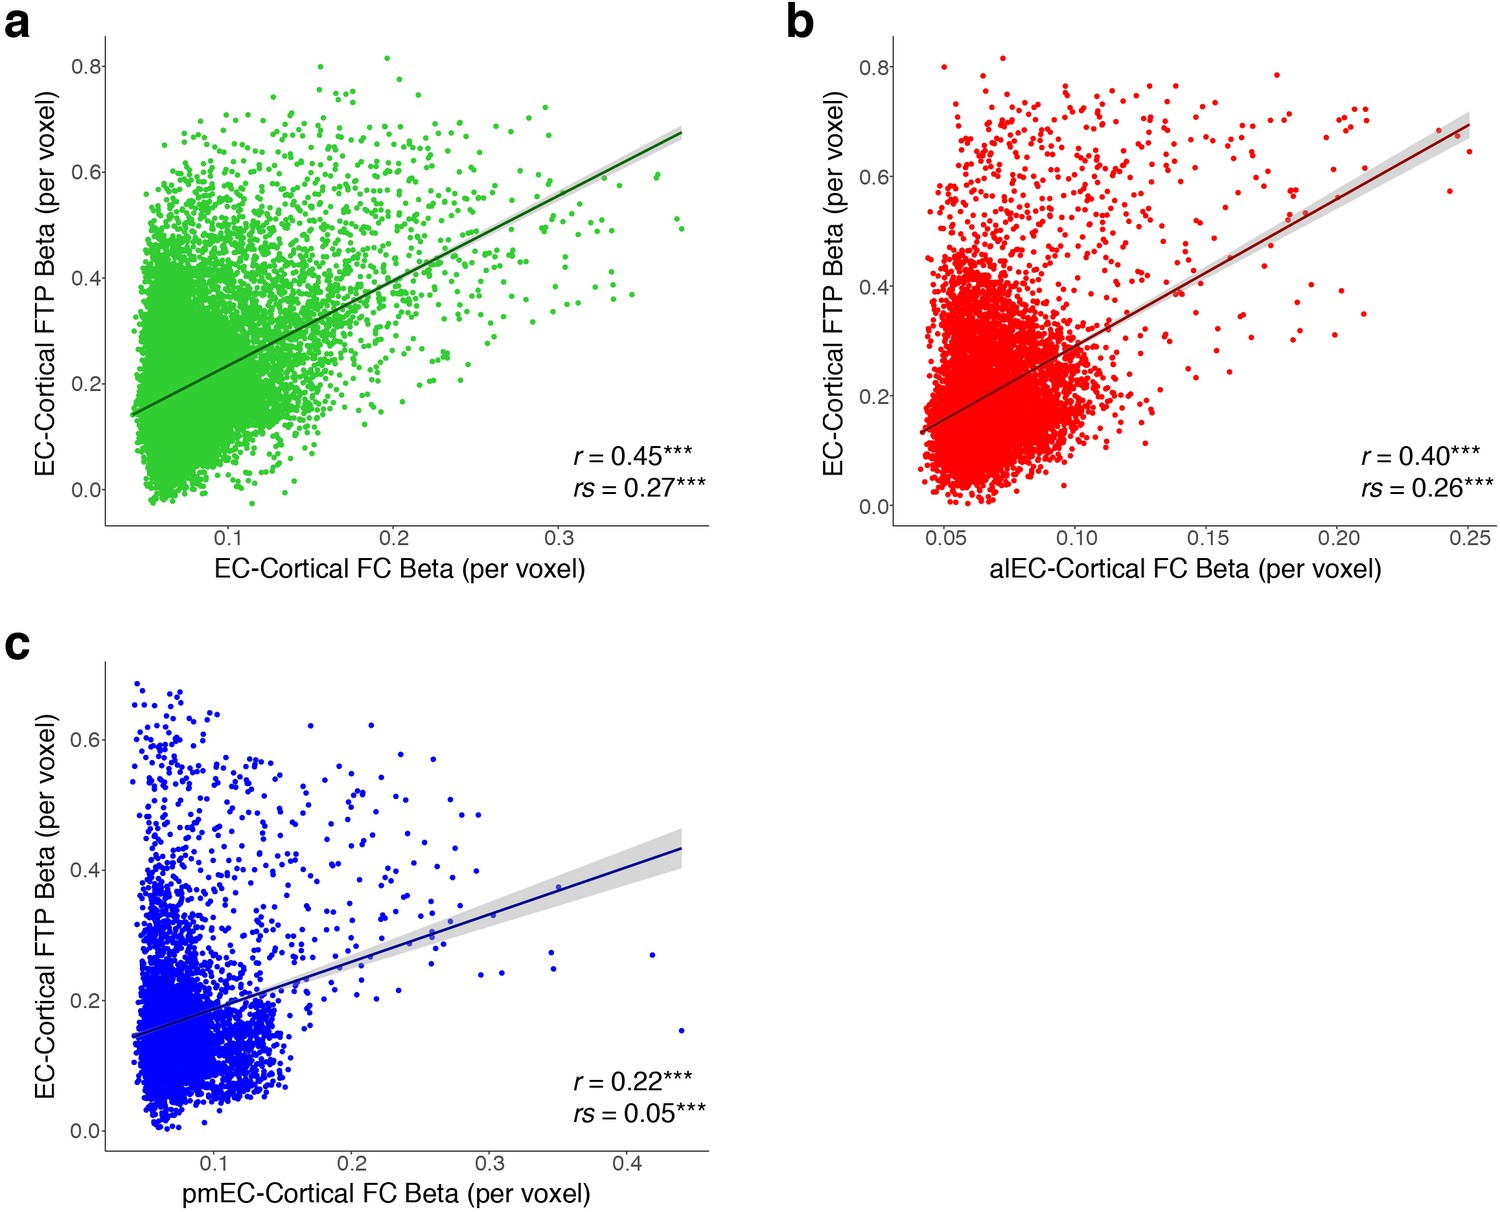
(a) Voxelwise regressions were performed across OA participants between the mean EC FTP SUVR predicting voxelwise FTP. One-sample t-tests show a group level map depicting voxels that had strong positive associations between their FTP and the amount of FTP in the EC. (b–d) YA average FC strength per voxel (beta) was correlated with each voxel’s EC-cortical tau association strength (beta). FC of the EC (b) and alEC (c) seeds demonstrated positive associations, where stronger FC to a voxel was correlated with a stronger association between EC FTP and that voxel’s FTP. The pmEC (d) showed a weak association. See Figure 4—figure supplement 1 for parallel results using OA FC. ***p<0.001.
Figure 4—figure supplement 1
EC-cortical tau associations and relationships with functional connectivity (FC) strength from older adult (OA) participants.
(a-c) Group average FC strength per voxel derived from the OA participants was correlated with each voxel’s EC-cortical tau association strength, where stronger FC to a voxel was correlated with a stronger association between EC FTP and that voxel’s FTP. The EC (a) and alEC (b) demonstrated positive associations that were of similar strength to the YA FC data, while the pmEC (d) had a stronger positive association than found in the YA data. ***p<0.001.
Author response image 1
Visualization of alEC and pmEC seeds using the group-level explicit mask method to remove signal drop out.
The alEC and pmEC seeds are overlaid on the explicit mask (yellow). Regions of low signal (brown) were removed from these seeds to test functional connectivity. The resulting functional connectivity maps are shown in Author response image 2. We also show the seeds overlaid on the group-mean functional image (middle), and the group-mean functional image without the seeds (right).
Author response image 2
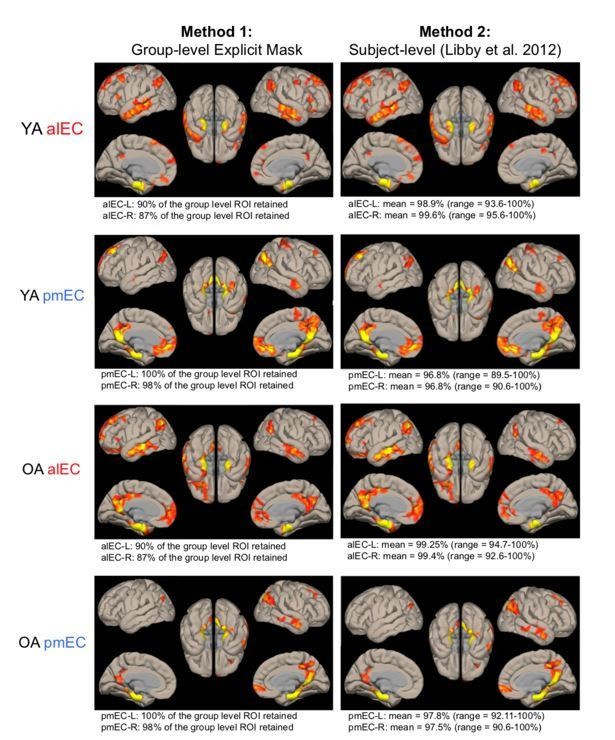
Comparison of signal drop out methods for the alEC and pmEC seeds, and their resulting functional connectivity maps.
Functional connectivity maps for Method 1 (group-level explicit mask, see Author response image 1) and Method 2 (subject-level from Libby et al., 2012) of removing signal drop out from alEC/pmEC seeds were nearly identical. Quantification of voxels retained is shown below each image. Due to the similarity of the methods, and wanting consistency with the EC seed, we used Method 2 in the manuscript.
Author response image 3
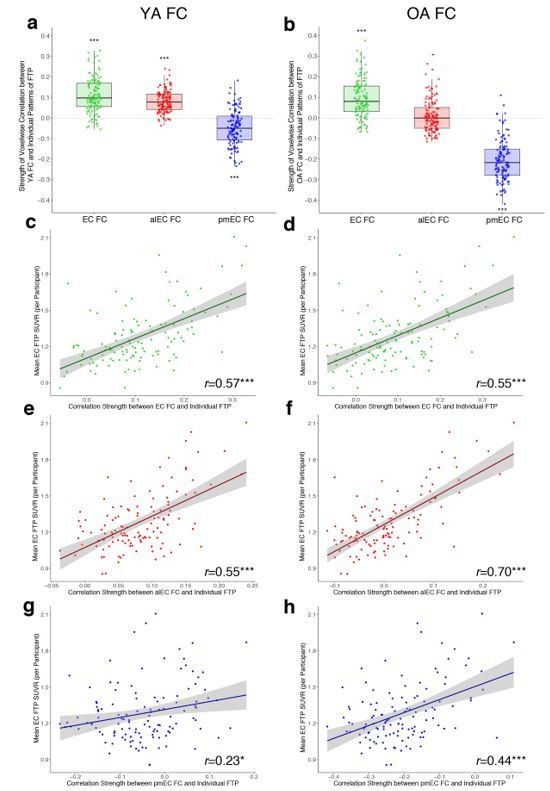
Functional connectivity strength predicting individual-level patterns of tau deposition.
For the young adult (a) and older adult (b) connectivity, we ran voxelwise correlations between group-average connectivity strength (β) and individual voxelwise FTP SUVR. This resulted in a correlation coefficient per subject indicating how well patterns of FC predicted their individual pattern of tau (each data point = one subject’s correlation). Distributions of the correlations were compared to zero with one-sample t-tests. c-h, To explore the variability in these correlation results, and to parallel findings from Figure 4 of the main manuscript, we correlated each subjects correlation strength between FC and FTP (data points from a and b) with their mean EC FTP. We found positive correlations, indicating that as a subject’s mean EC tau increased, patterns of FC better predicted their individual pattern of cortical tau deposition. * p<0.05 **p<0.01 ***p<0.001.
Tables
Table 1
Demographic information for the young adult (YA) and older adult (OA) samples.
https://doi.org/10.7554/eLife.49132.003| YA FC (n = 55) | OA FC (n = 87) | OA PET (n = 123) | OA FC vs. OA PET | ||
|---|---|---|---|---|---|
| M (SD) or n (%) | T or X2 | P | |||
| Age (years)* | 24.9 (4.4) | 77.5 (6.1) | 76.5 (6.5) | 1.17 | 0.24 |
| Sex (female) | 26 (47.3%) | 55 (63.2%) | 73 (59.3%) | 1.84 | 0.17 |
| Education (years) | 16.2 (1.9)† | 16.7 (1.9) | 16.9 (1.9) | −0.69 | 0.49 |
| MMSE | 29.3 (1.1)‡ | 28.7 (1.3) | 28.7 (1.2) | −0.28 | 0.78 |
| Global PiB† | N/A | 1.16 (0.24) | 1.15 (0.23) | 0.57 | 0.57 |
| Aβ+§ | N/A | 39 (45.3%) | 49 (40.2%) | 3.26 | 0.07 |
| APOE ε4+¶ | N/A | 26 (30.6%) | 31 (25.8%) | 3.44 | 0.06 |
-
YA, Young adult; OA, Older adult; FC, functional connectivity; MMSE, Mini Mental State Exam; Aβ+, Aβ-positive participants (Global PiB DVR > 1.065); APOE, alolipoprotein E; *Age at FC or age at tau; †6 YA missing education; ‡3 YA missing MMSE; §1 OA missing PiB (in both FC and PET samples); ¶2 OA missing APOE from FC sample, 3 from PET sample.
-
Table 1—source data 1
Source data for the demographic information presented in Table 1.
- https://doi.org/10.7554/eLife.49132.004
Additional files
-
Source data 1
Source data for the FC specific tau deposition correlations presented in Supplementary file 2.
- https://doi.org/10.7554/eLife.49132.018
-
Supplementary file 1
Results of ANCOVA models investigating tau deposition within regions of functional connectivity from the older adult sample.
- https://doi.org/10.7554/eLife.49132.019
-
Supplementary file 2
Associations between functional connectivity specific tau deposition and both Aβ and EC tau.
- https://doi.org/10.7554/eLife.49132.020
-
Supplementary file 3
Results of ANCOVA models comparing tau deposition in different functional connectivity strength regions using older adult FC.
- https://doi.org/10.7554/eLife.49132.021
-
Supplementary file 4
Quantification of voxels removed from seed regions due to signal drop out.
- https://doi.org/10.7554/eLife.49132.022
-
Transparent reporting form
- https://doi.org/10.7554/eLife.49132.023
Download links
A two-part list of links to download the article, or parts of the article, in various formats.
Downloads (link to download the article as PDF)
Open citations (links to open the citations from this article in various online reference manager services)
Cite this article (links to download the citations from this article in formats compatible with various reference manager tools)
Cortical tau deposition follows patterns of entorhinal functional connectivity in aging
eLife 8:e49132.
https://doi.org/10.7554/eLife.49132


