Metacontrol of decision-making strategies in human aging
- Technische Universität Dresden, Germany
- Harvard University, United States
- Washington University in St. Louis, United States
- University College London, United Kingdom
- Max Planck UCL Centre for Computational Psychiatry and Ageing Research, United Kingdom
- Concordia University, Canada
Figures
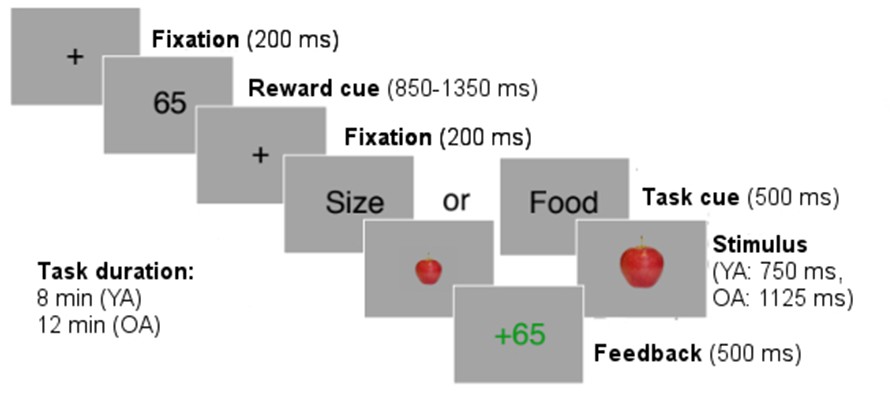
Figure 1
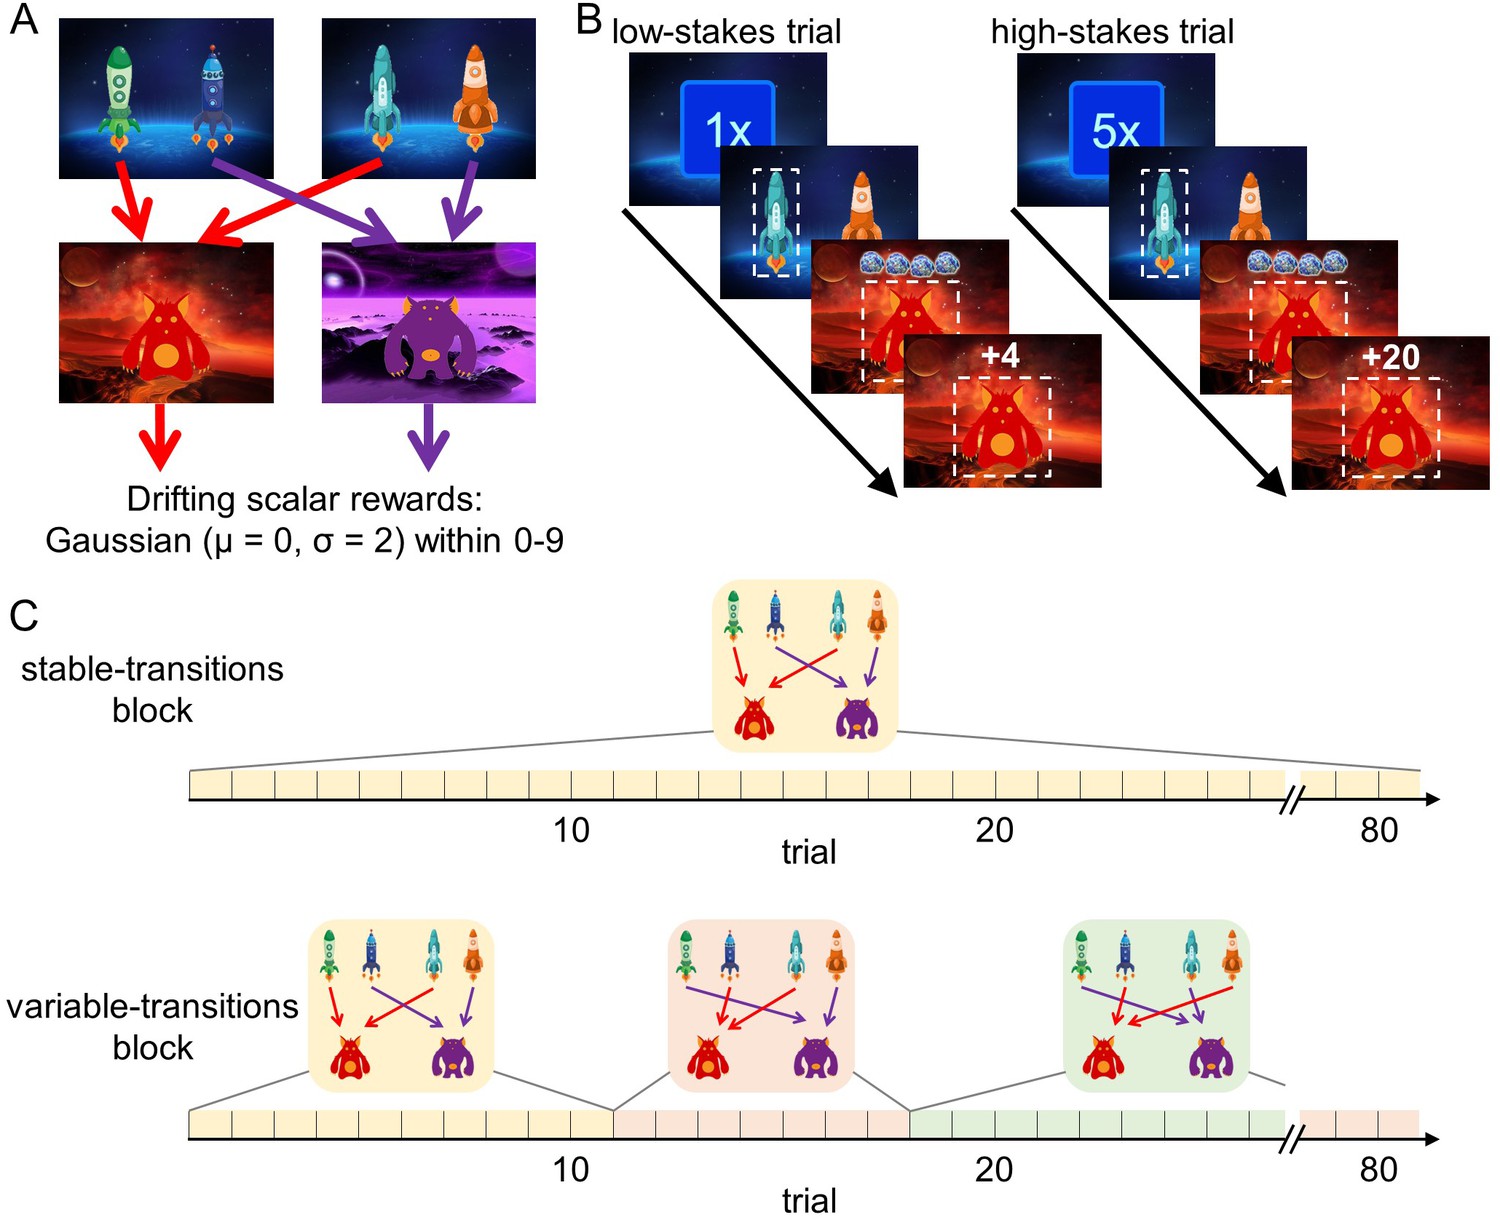
Design of the sequential decision-making task.
(A) State transition structure of the task. (B) Trial structure. At the beginning of each trial, a stakes cue signaled the stakes condition of the current trial (low-stakes trial vs. high-stakes trials). Participants started in one of two first-stage states where they selected one spaceship. They then transitioned to a planet (second stage) where they received a certain amount of space treasure. Space treasure was converted into points depending on the stakes condition. (C) In stable-transitions blocks, spaceships maintained their destination planets throughout a block of 80 trials. In variable-transitions blocks, every 6 to 14 trials, one pair of spaceships swapped their destination planets.
Figure 2 with 1 supplement
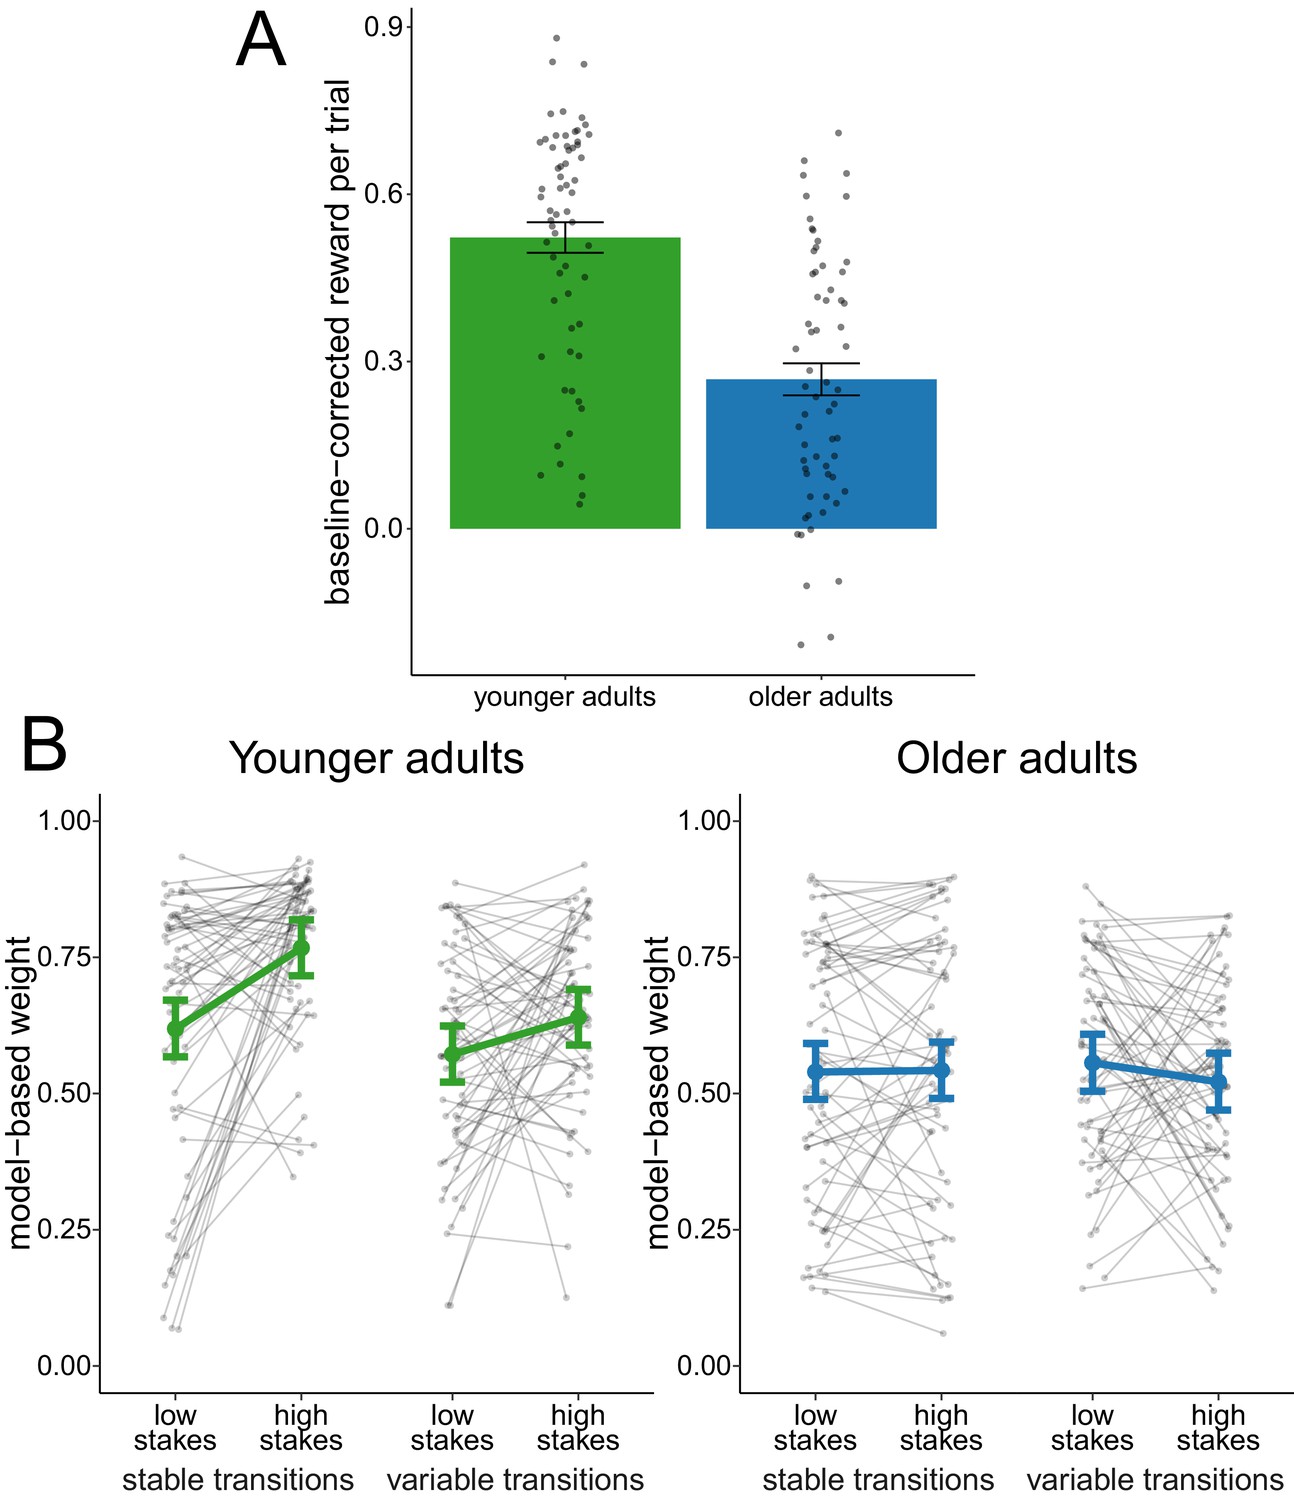
Analysis of complete sample.
(A) Reward per trial (baseline-corrected). Gray dots indicate values for individual participants and bars indicate group means with error bars representing standard error of the mean. (B) Degree of model-based control. Model-based weights are depicted for the complete sample of younger and older adults as a function of stakes condition and transition variability condition. Gray dots indicate values for individual participants. Colored dots indicate group means as predicted by the hierarchical regression model with error bars representing Bayesian 95% credible intervals.
Figure 2—figure supplement 1
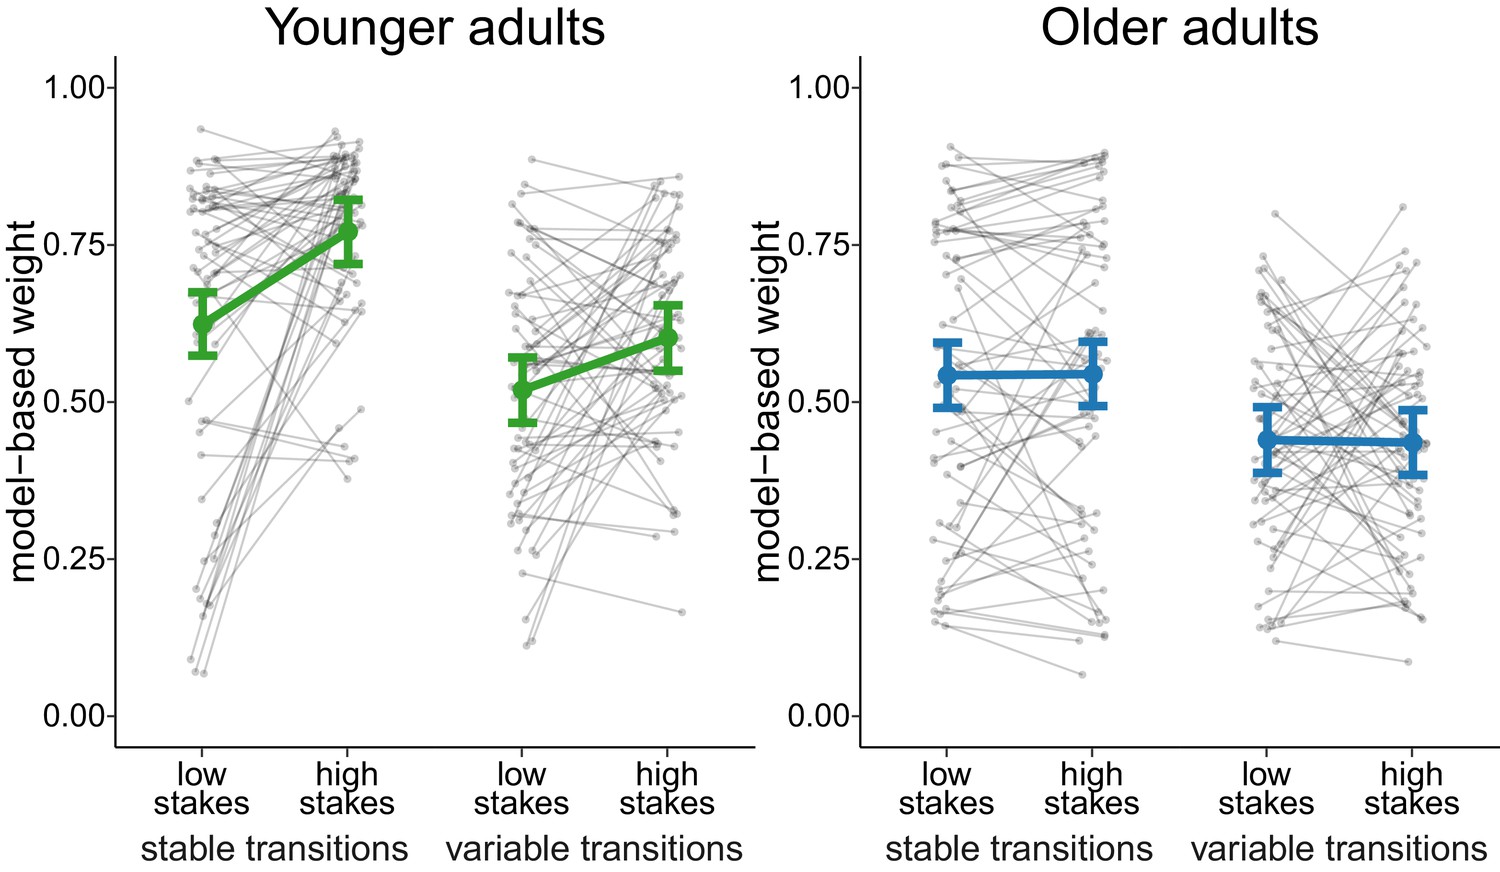
Degree of model-based control under the assumption of perfect transition learning.
Model-based weights are depicted for the complete sample of younger and older adults as a function of stakes condition and transition variability condition. Gray dots indicate values for individual participants. Colored dots indicate group means as predicted by the hierarchical regression model with error bars representing Bayesian 95% credible intervals.
Figure 3
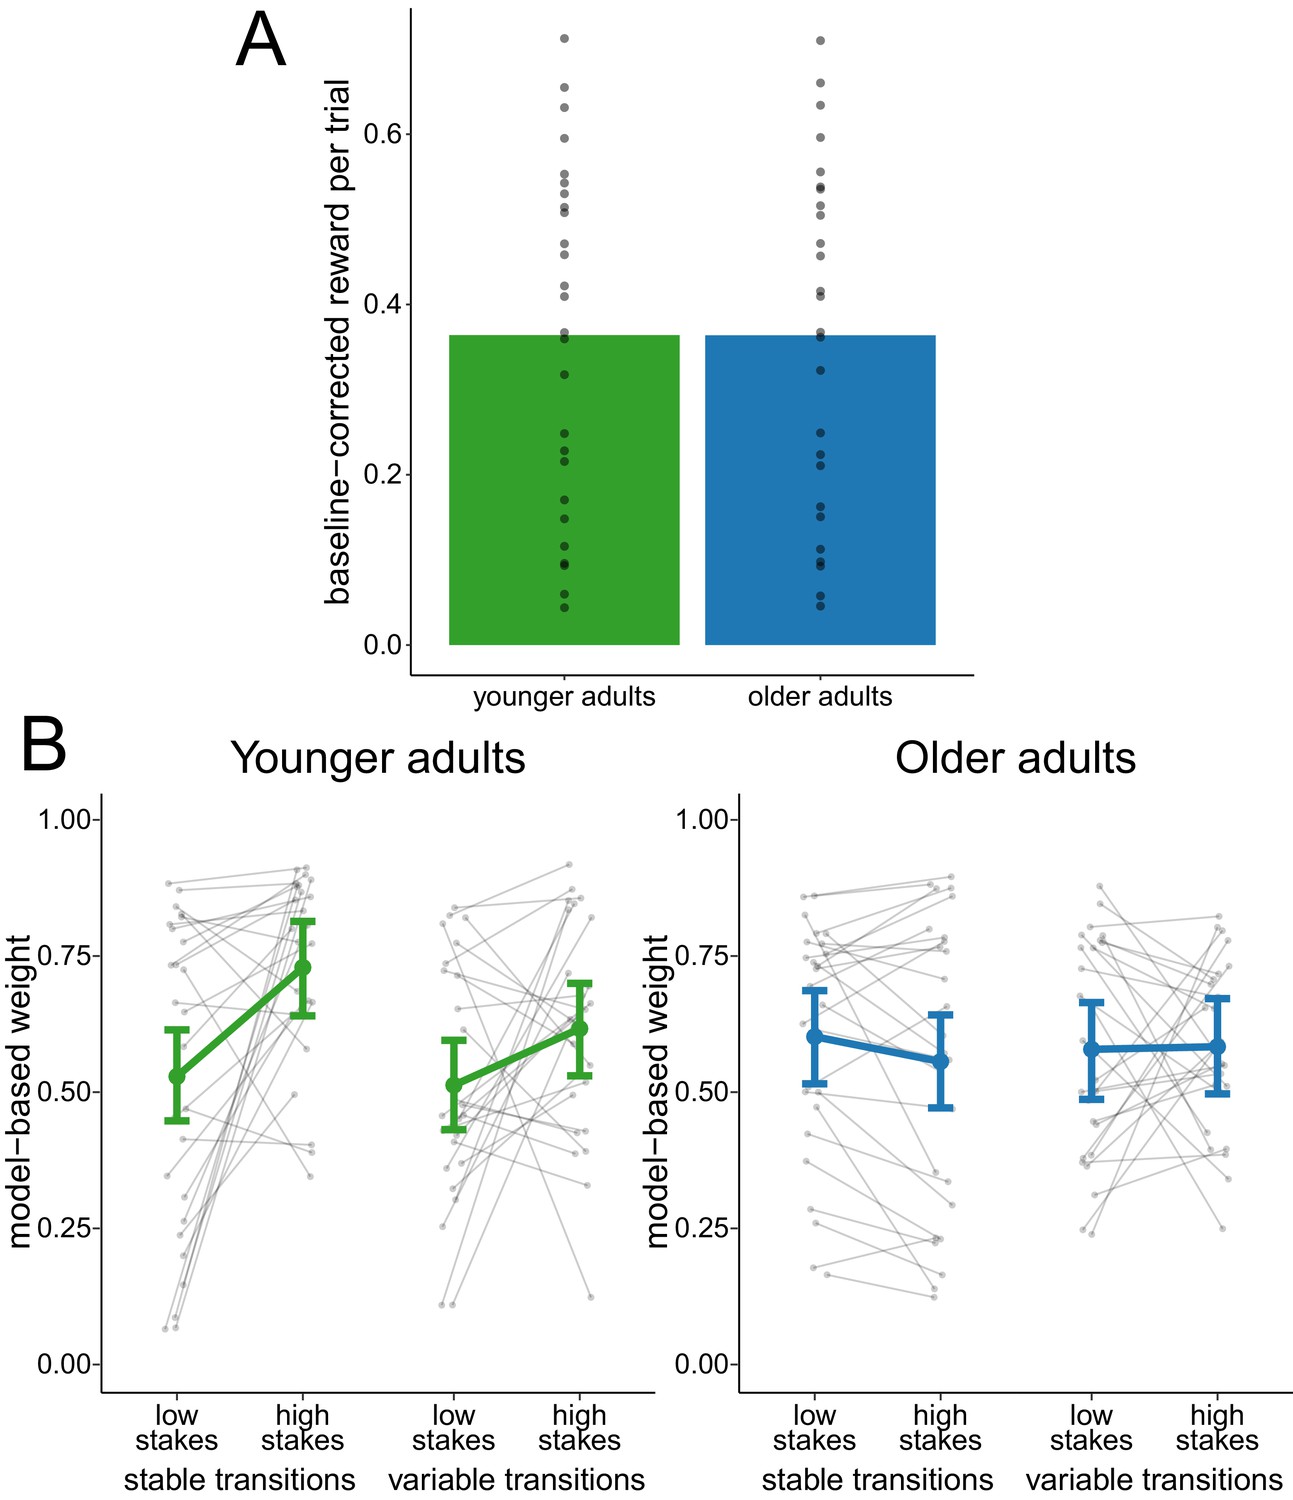
Analysis of performance-matched subsample.
(A) Reward per trial (baseline-corrected) for participants in the performance-matched sample. Gray dots indicate values for individual participants and bars indicate group means. (B) Degree of model-based control for younger and older adults in the performance-matched sample as a function of stakes condition and transition variability condition. Gray dots indicate values for individual participants. Colored dots indicate group means as predicted by the hierarchical regression model with error bars representing Bayesian 95% credible intervals.
Figure 4
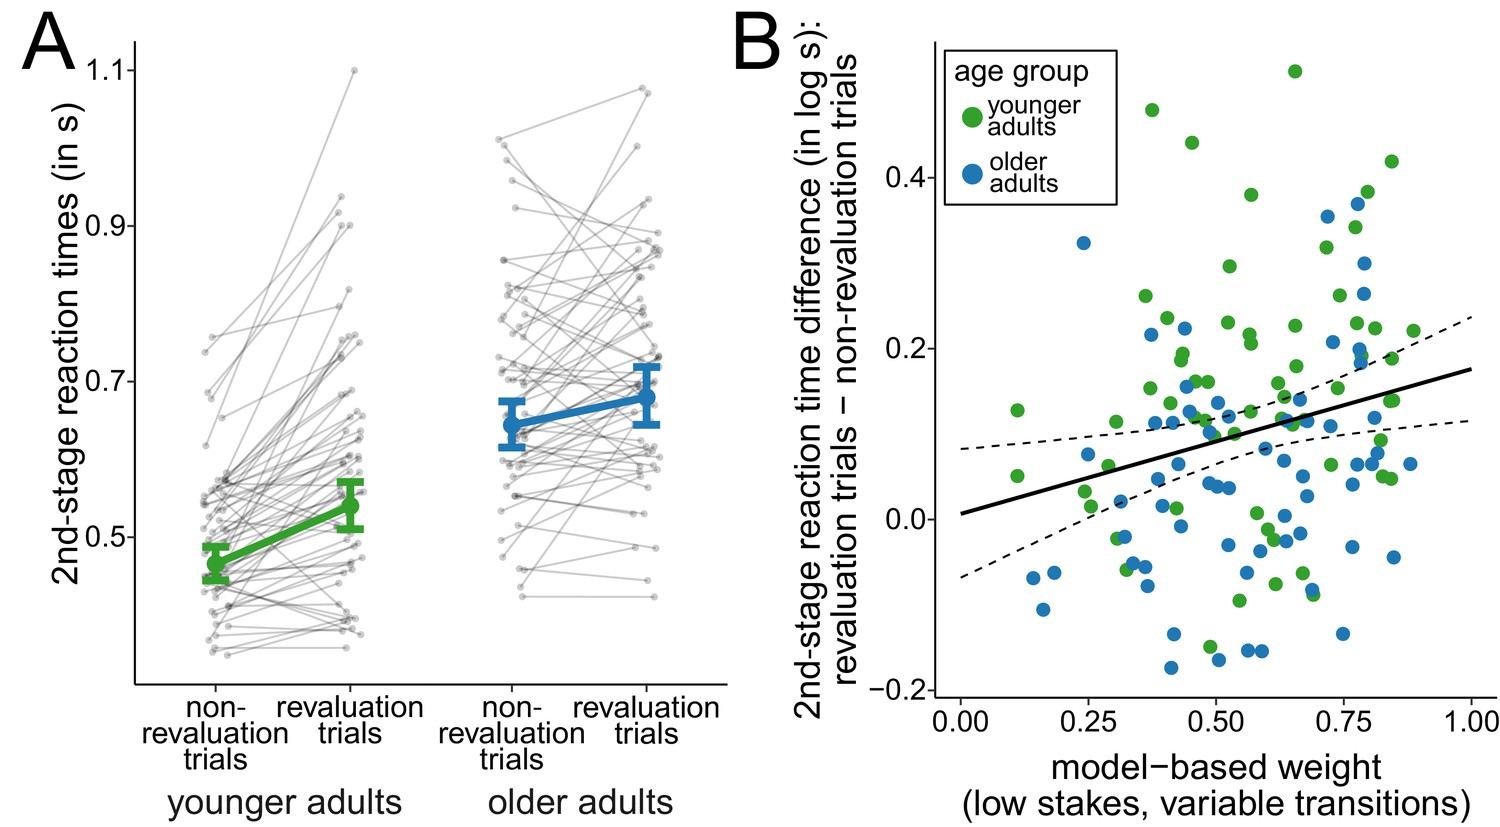
Analysis of second-stage reaction times.
(A) Reaction times at the second stage during variable-transitions blocks for trials in which a change of the task transition structure was observed for the first time (revaluation trials) and all other trials (non-revaluation trials). Gray dots indicate mean values for individual participants. Colored dots indicate group means as predicted by the hierarchical regression model with error bars representing Bayesian 95% credible intervals. (B) Relationship between model-based control and reaction time slowing in revaluation trials. Solid line represents prediction from the hierarchical regression model and dashed lines indicate 95% confidence region.
Appendix 1—figure 1
Structure of the task-switching task.
https://doi.org/10.7554/eLife.49154.011
Appendix 2—figure 1
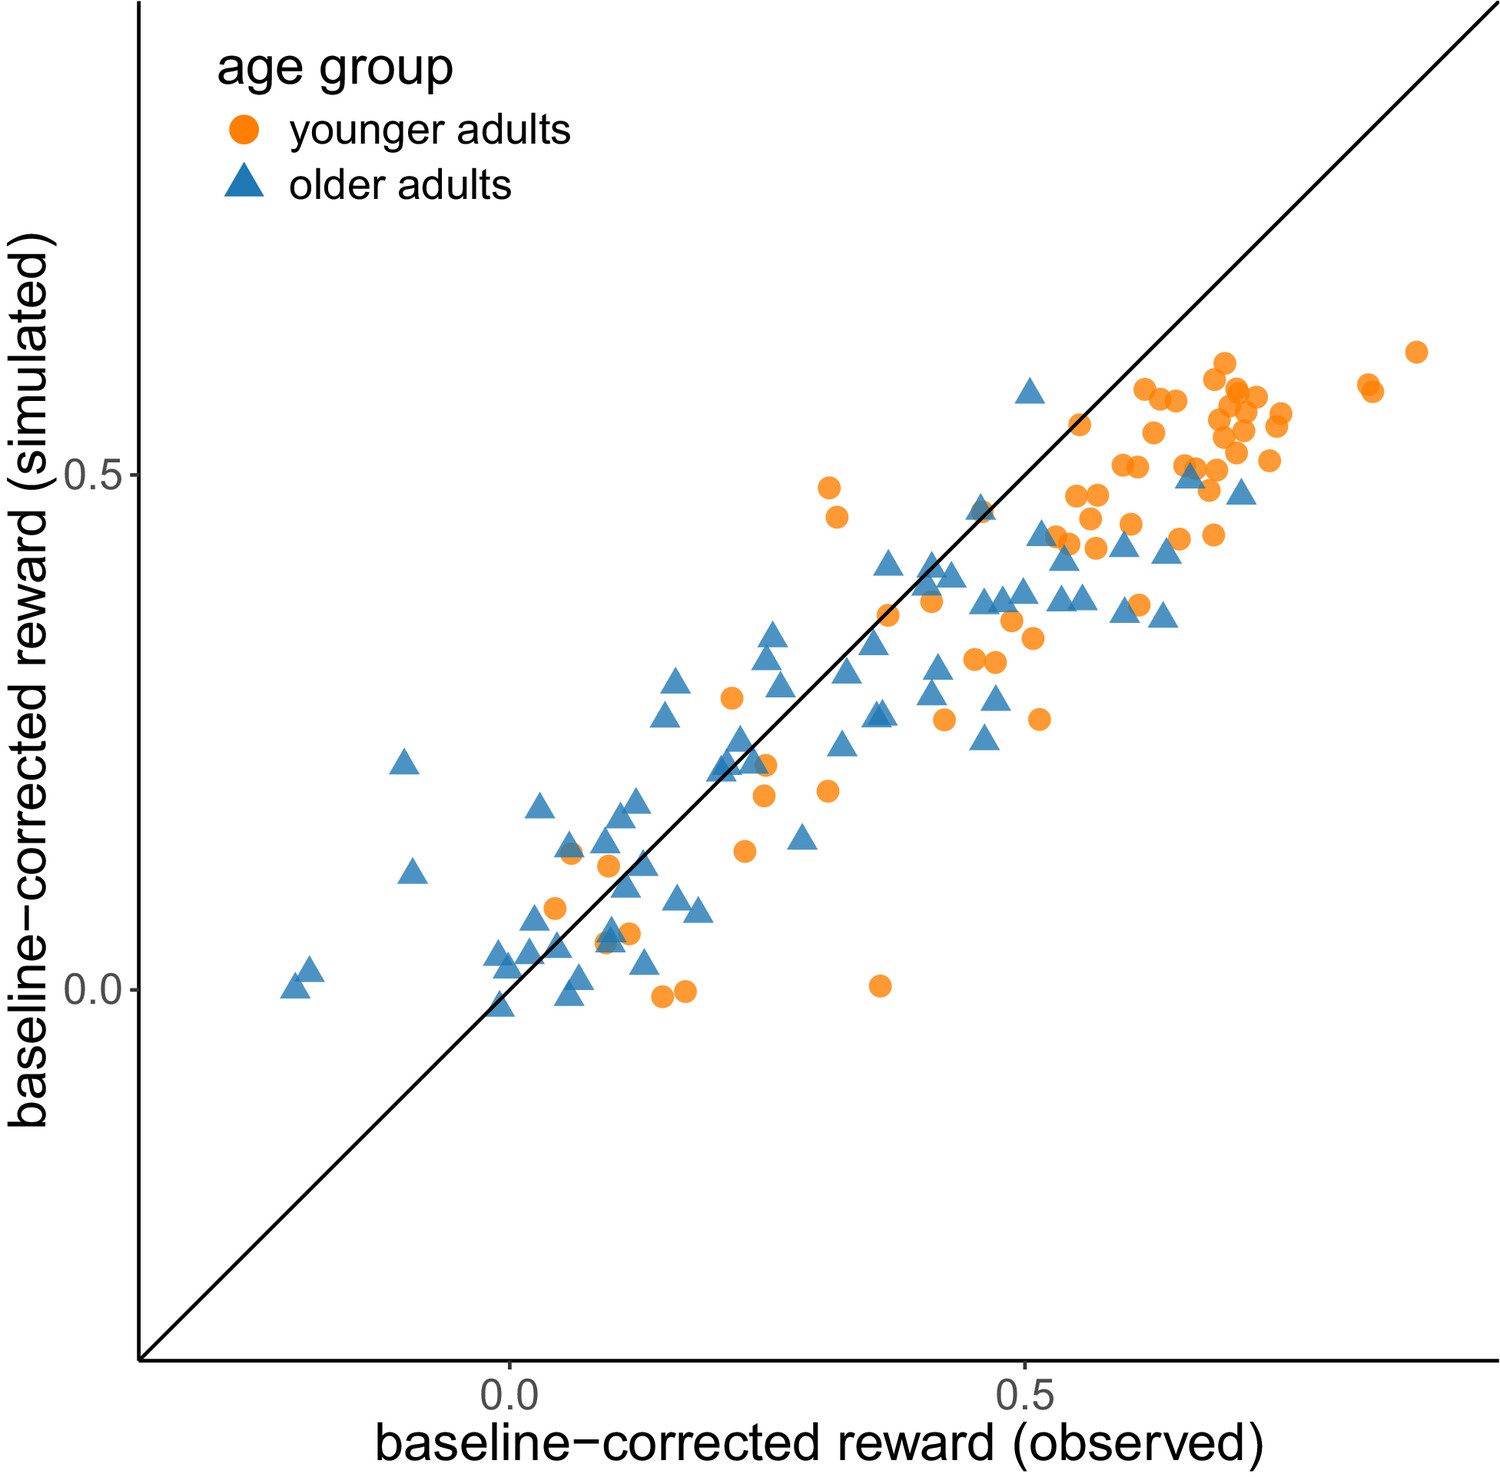
Posterior predictive check.
Comparison of simulated vs. empirically observed values for baseline-corrected reward. The diagonal represents the identity line.
Tables
Table 1
Psychometric assessment of complete sample.
https://doi.org/10.7554/eLife.49154.007| Variable | N assessed (younger/older adults) | Mean (SD) younger adults | Mean (SD) older adults | Bayes Factor* |
|---|---|---|---|---|
| Working memory | 62/61 | 18.42 (3.80) | 15.95 (4.22) | 31.88 |
| Verbal intelligence | 60/60 | 69.07% (11.82) | 81.94% (5.71) | >100 |
| Processing speed (reaction times) | 61/60 | 2032.17 s (315.87) | 3319.93 s (516.42) | >100 |
| Processing speed (accuracy) | 61/60 | 94.10% (6.02) | 94.84% (5.48) | 0.24 |
| Need for cognition | 61/59 | 82.18 (13.25) | 81.44 (13.24) | 0.20 |
-
*Bayes Factors quantify the evidence in favor of one hypothesis (here: non-equal means) as opposed to a competing hypothesis (here: equal means). Commonly, Bayes Factors between 3 and 10 are considered as representing moderate evidence for the hypothesis and Bayes Factor above 10 as representing strong evidence for the hypothesis. Conversely, Bayes Factors between 1/3 and 1/10 represent moderate evidence for the competing hypothesis and Bayes Factors below 1/10 represent strong evidence for the competing hypothesis (Lee and Wagenmakers, 2013). We calculated Bayes Factors with the BayesFactors package (Morey et al., 2015).
Additional files
-
Supplementary file 1
Tables for model parameters, model comparison and statistical results.
- https://doi.org/10.7554/eLife.49154.008
-
Transparent reporting form
- https://doi.org/10.7554/eLife.49154.009
Download links
A two-part list of links to download the article, or parts of the article, in various formats.
Downloads (link to download the article as PDF)
Open citations (links to open the citations from this article in various online reference manager services)
Cite this article (links to download the citations from this article in formats compatible with various reference manager tools)
Metacontrol of decision-making strategies in human aging
eLife 8:e49154.
https://doi.org/10.7554/eLife.49154


