Deamidation disrupts native and transient contacts to weaken the interaction between UBC13 and RING-finger E3 ligases
- Tata Institute of Fundamental Research, India
Figures
Figure 1 with 3 supplements
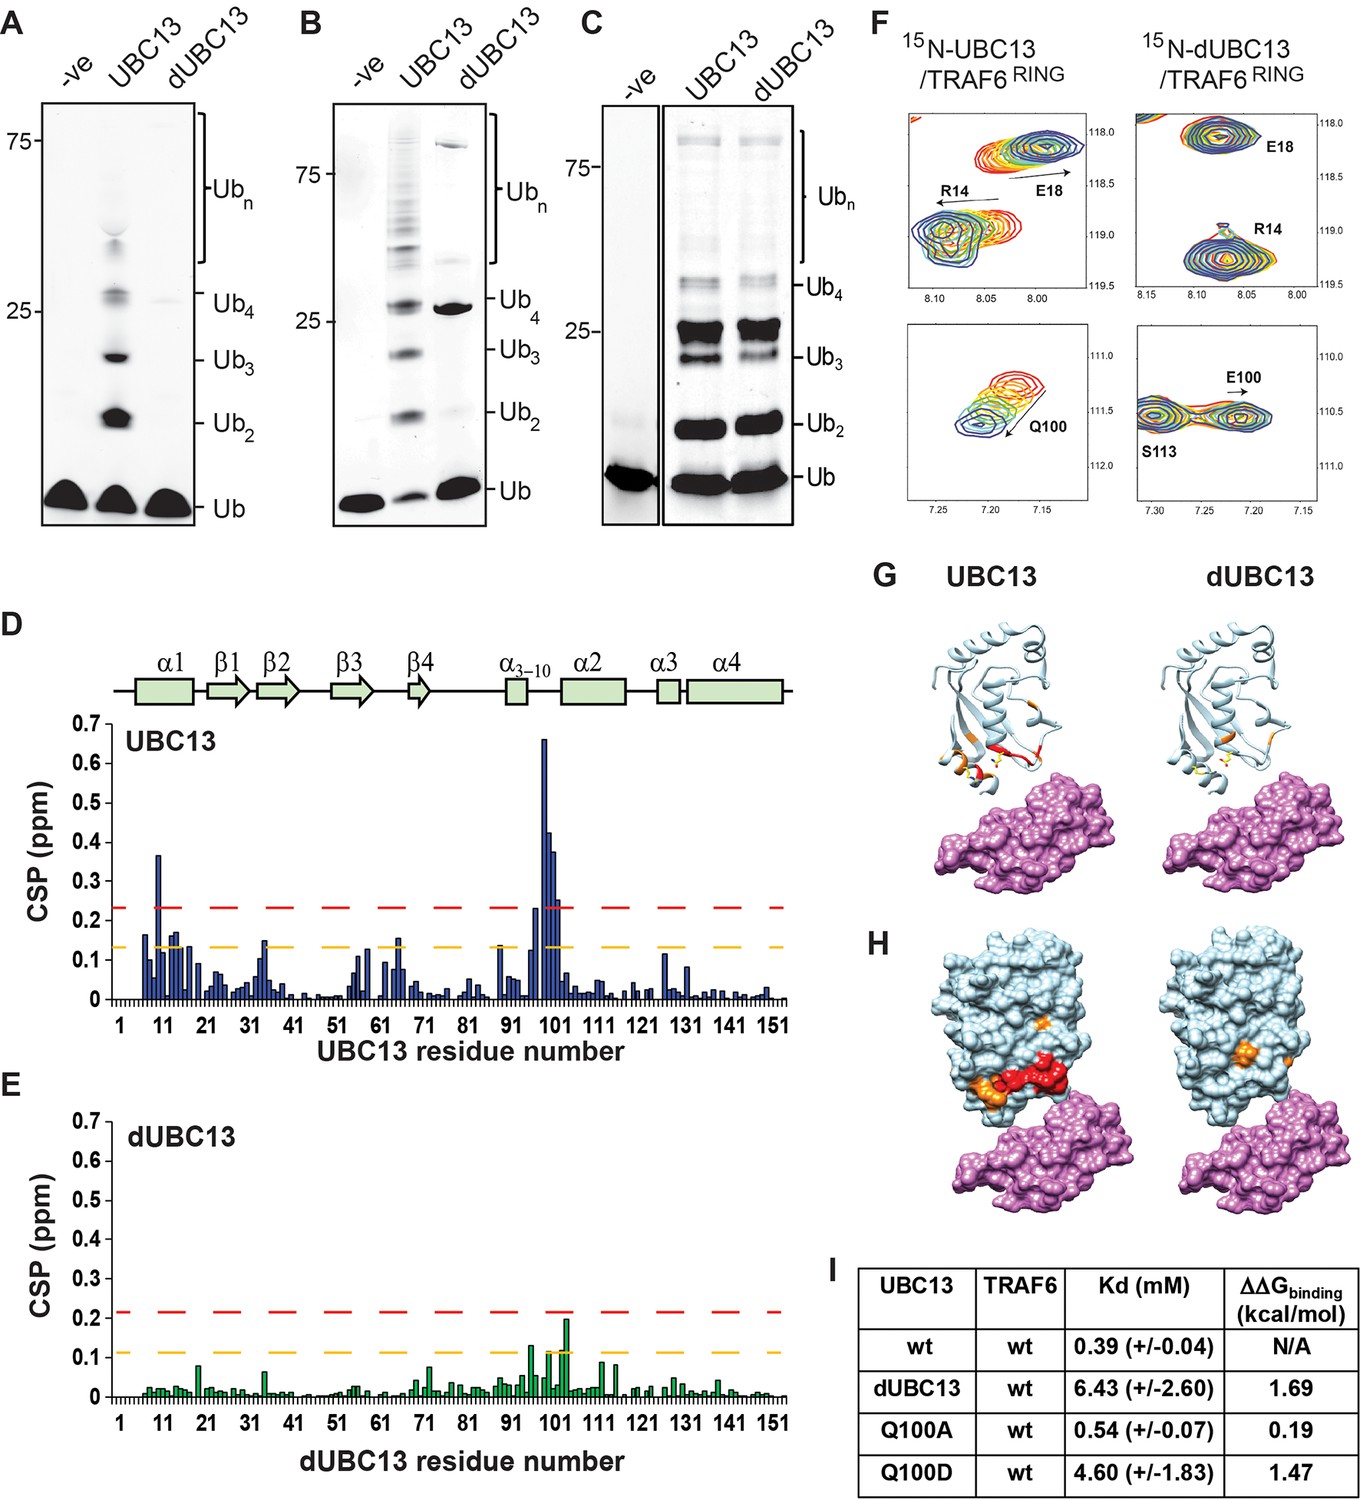
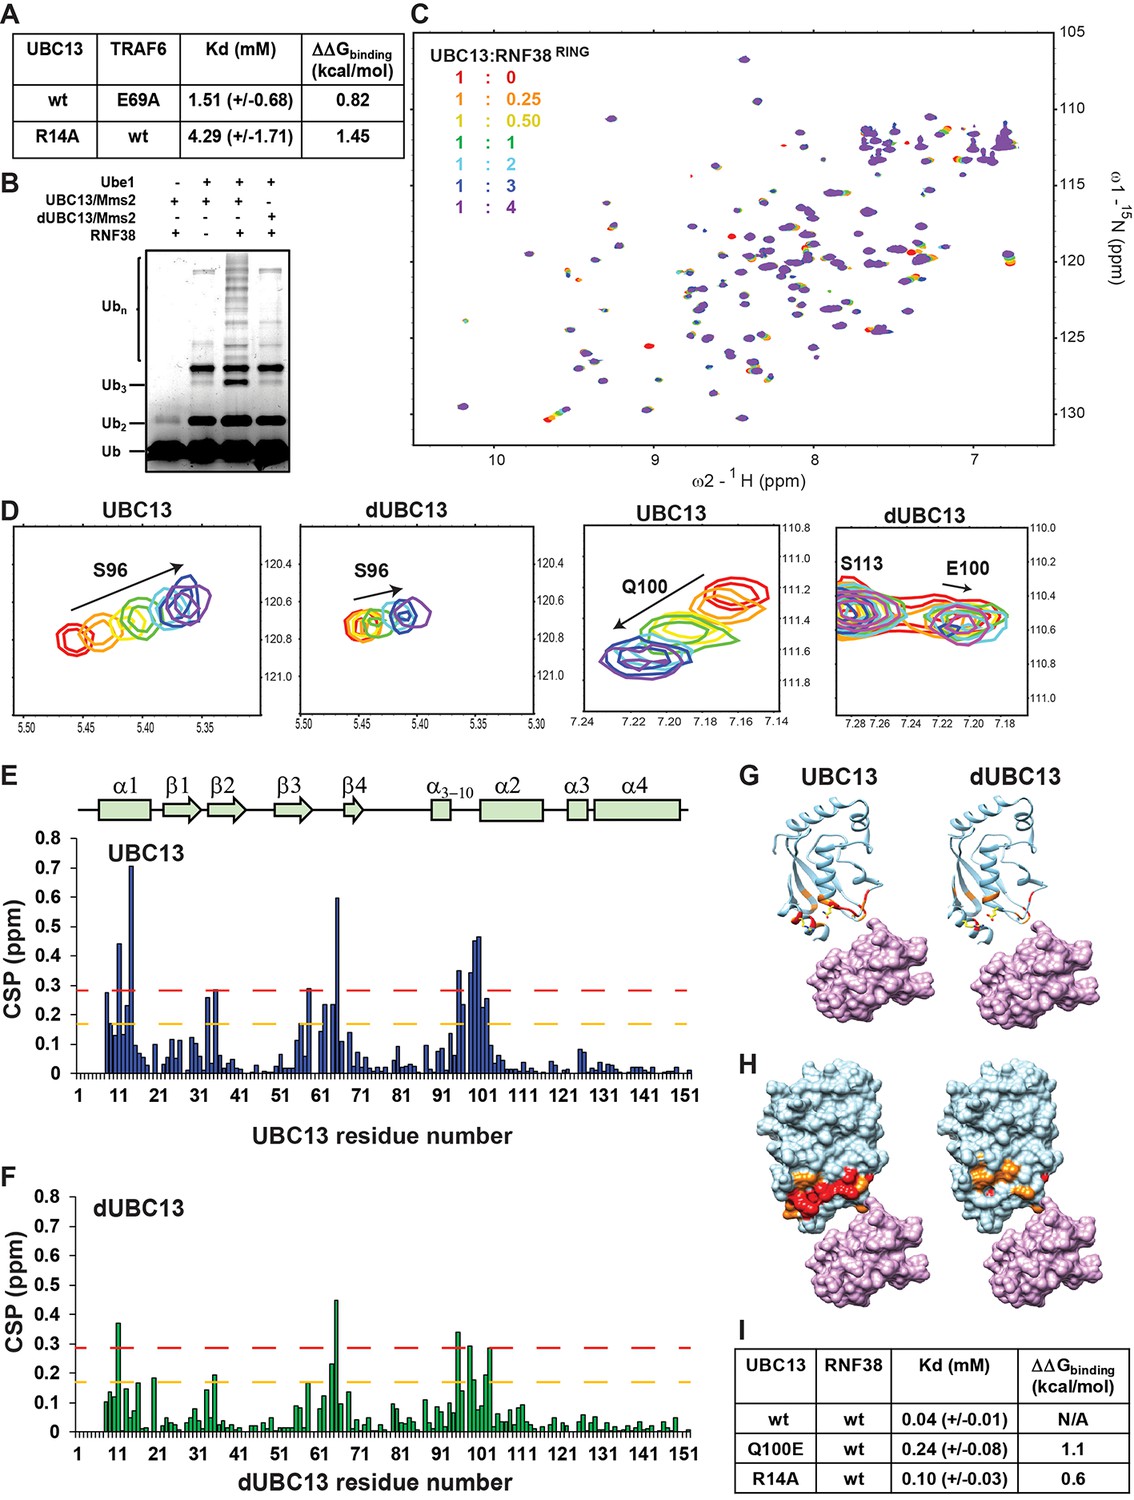
Interactions between UBC13 and TRAF6RING studied by NMR.
(A) In-vitro ubiquitination reaction was carried out using TRAF6RZ3 as the E3 and UBC13 or dUBC13 as the E2 for 10 min. Mms2 was used as a co-factor in the reaction. The –ve lane is the same reaction without ATP. (B) In-vitro ubiquitination reaction was carried out on GST beads for 10 min using GST-TRAF6RING as the E3 and UBC13 or dUBC13 as the E2. Mms2 was used as a co-factor in the reaction. The –ve lane is the same reaction without ATP. (C) In-vitro ubiquitination reaction carried out for 30 min using UBC13 or dUBC13 as the E2 and Mms2 as its co-factor. (D)The CSPs for residues in UBC13 upon binding to TRAF6RING. The chemical shift perturbations (CSP) between the free and the bound form are calculated as CSP = [(δHfree – δHbound)2+ ((δNfree – δNbound))2]1/2, where δH and δN is the chemical shift of the amide hydrogen and nitrogen, respectively. The orange and red dashed lines correspond to Mean + SD and Mean + 2*SD, respectively. The secondary structure alignment of UBC13 against its sequence is provided above the plot. (E) The CSPs for residues in dUBC13 upon binding to TRAF6RING. The dashed lines are replicated from (D). (F) Two regions of the titration HSQC spectra are expanded to show UBC13, but not dUBC13 peaks shift upon titration with TRAF6RING. Significant CSPs were mapped on the UBC13 and dUBC13 structure both in the (G) ribbon and (H) surface representation. The UBC13 and dUBC13 are colored in light blue. The residues with CSPs above Mean + SD and Mean + 2*SD are colored in orange and red, respectively. The surface of TRAF6RING domain shown in magenta. The UBC13/TRAF6RING complex is modeled from PDB 3HCU. (I) The measured dissociation constants of UBC13 and its mutants with TRAF6RING are provided as Mean+/-SD. The difference of free energy of binding was calculated as ΔΔGbinding = RTln(Kd/Kdwt), where T is 298K, and wt is the wild type complex.
-
Figure 1—source data 1
Source data of chemical shift perturbations against UBC13 residue numbers in the UBC13/TRAF6RING titration.
- https://cdn.elifesciences.org/articles/49223/elife-49223-fig1-data1-v2.xls
-
Figure 1—source data 2
Source data of chemical shift perturbations against dUBC13 residue numbers in the dUBC13/TRAF6RING titration.
- https://cdn.elifesciences.org/articles/49223/elife-49223-fig1-data2-v2.xls
Figure 1—figure supplement 1

Binding studies of UBC13/TRAF6RING interaction.
Overlay of the 15N-edited HSQC spectra of free UBC13 (red) with different stoichiometric ratios of TRAF6RING as given in the top left-hand side of the spectra. The fit of UBC13 peak shifts against the concentration ratio [TRAF6RING]/[UBC13] ([Lt]/[Pt]) yielded the Kd of the complex. The fit of nine typical residues is shown.
Figure 1—figure supplement 2
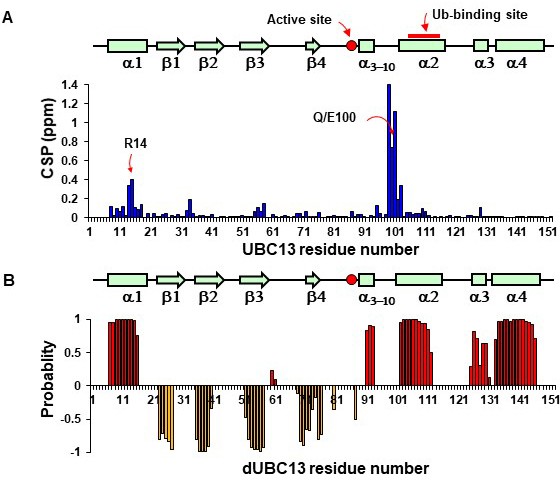
NMR studies of UBC13 and dUBC13.
(A) The Chemical Shift Perturbations (CSPs) observed in amide resonances of UBC13 upon deamidation is plotted against the UBC13 residue numbers. The residues R14 and Q/E100 are shown by arrows. The linear arrangement of the secondary structural elements of UBC13 is indicated on the top for reference. The active site cysteine and the Ub-binding site are shown. (B) Secondary structure prediction of dUBC13 obtained by analyzing the backbone and 13Cβ chemical shifts by TALOS+(Shen et al., 2009). Positive values indicate α-helices, and negative values indicate β-strands. The linear arrangement of the secondary structural elements of UBC13 is shown on the top for reference.
Figure 1—figure supplement 3
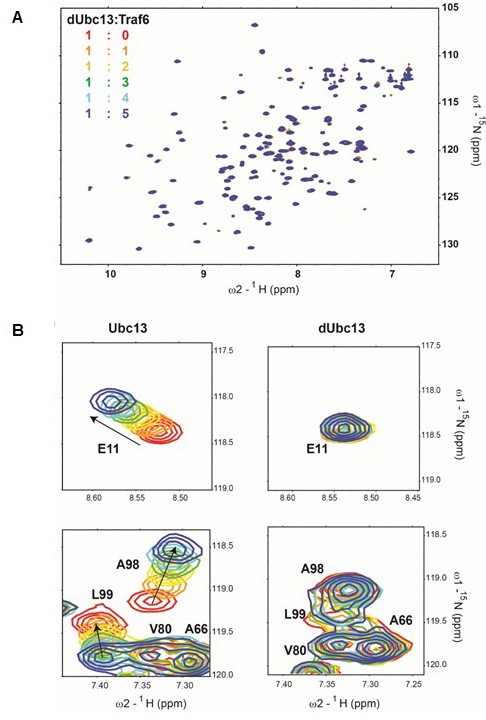
Binding studies of dUBC13/TRAF6RING interaction.
(A) Overlay of the 15N-edited HSQC spectra of free dUBC13 (red) with different stoichiometric ratios of TRAF6 as given in the top left-hand side of the spectra. (B) Two regions of the spectra are expanded to show amide resonances (E11, A98, L99) that shift significantly in UBC13 but not dUBC13 Two regions of the spectra are expanded to show amide resonances (E11, A98, L99) that shift significantly in UBC13 but not dUBC13.
Figure 2 with 2 supplements

A new intramolecular salt-bridge forms upon deamidation of UBC13.
(A) Crystal structure of the UBC13/TRAF6RING complex (PDB 3HCU, Left). Inset (right) indicates the position of Q100 and the network of salt-bridges/hydrogen bonds (red connecting lines) at the interface of UBC13/TRAF6RING complex. The length of the bonds are provided in red (in Å). The distances from Q100 to its closest atom in TRAF6 residue L74, and to E69, are shown as magenta lines with distances in red. These distances are longer than the default criteria of contacts measured in UCSF Chimera. (B) The distance between R14-Cζ and E100-Cδ atoms against time in the conventional MD simulation of dUBC13 is given (top). The presence/absence of a salt-bridge based on a 0.5 nm cutoff value are digitized to a Markov chain, where the presence of a salt-bridge is one and absence is 0. The occupancy of the R14/E100 salt-bridge is 48%. (C) Overlay of UBC13 and dUBC13 15N-1H HSQC spectra zoomed around the Arginine Nε-Hε resonances shows that R7, R14, and R102 sidechain resonances shift upon deamidation. (D) Schematic of Arginine sidechain atoms. (E) and (F) are the 15Nε/η-13Cζ correlation spectra for UBC13 and dUBC13, respectively. The 15Nε/η and 13Cζ resonance shifts are in the y- and x-axis, respectively. The R33 and R14 15Nη resonances of dUBC13 are expanded in (G).
Figure 2—figure supplement 1
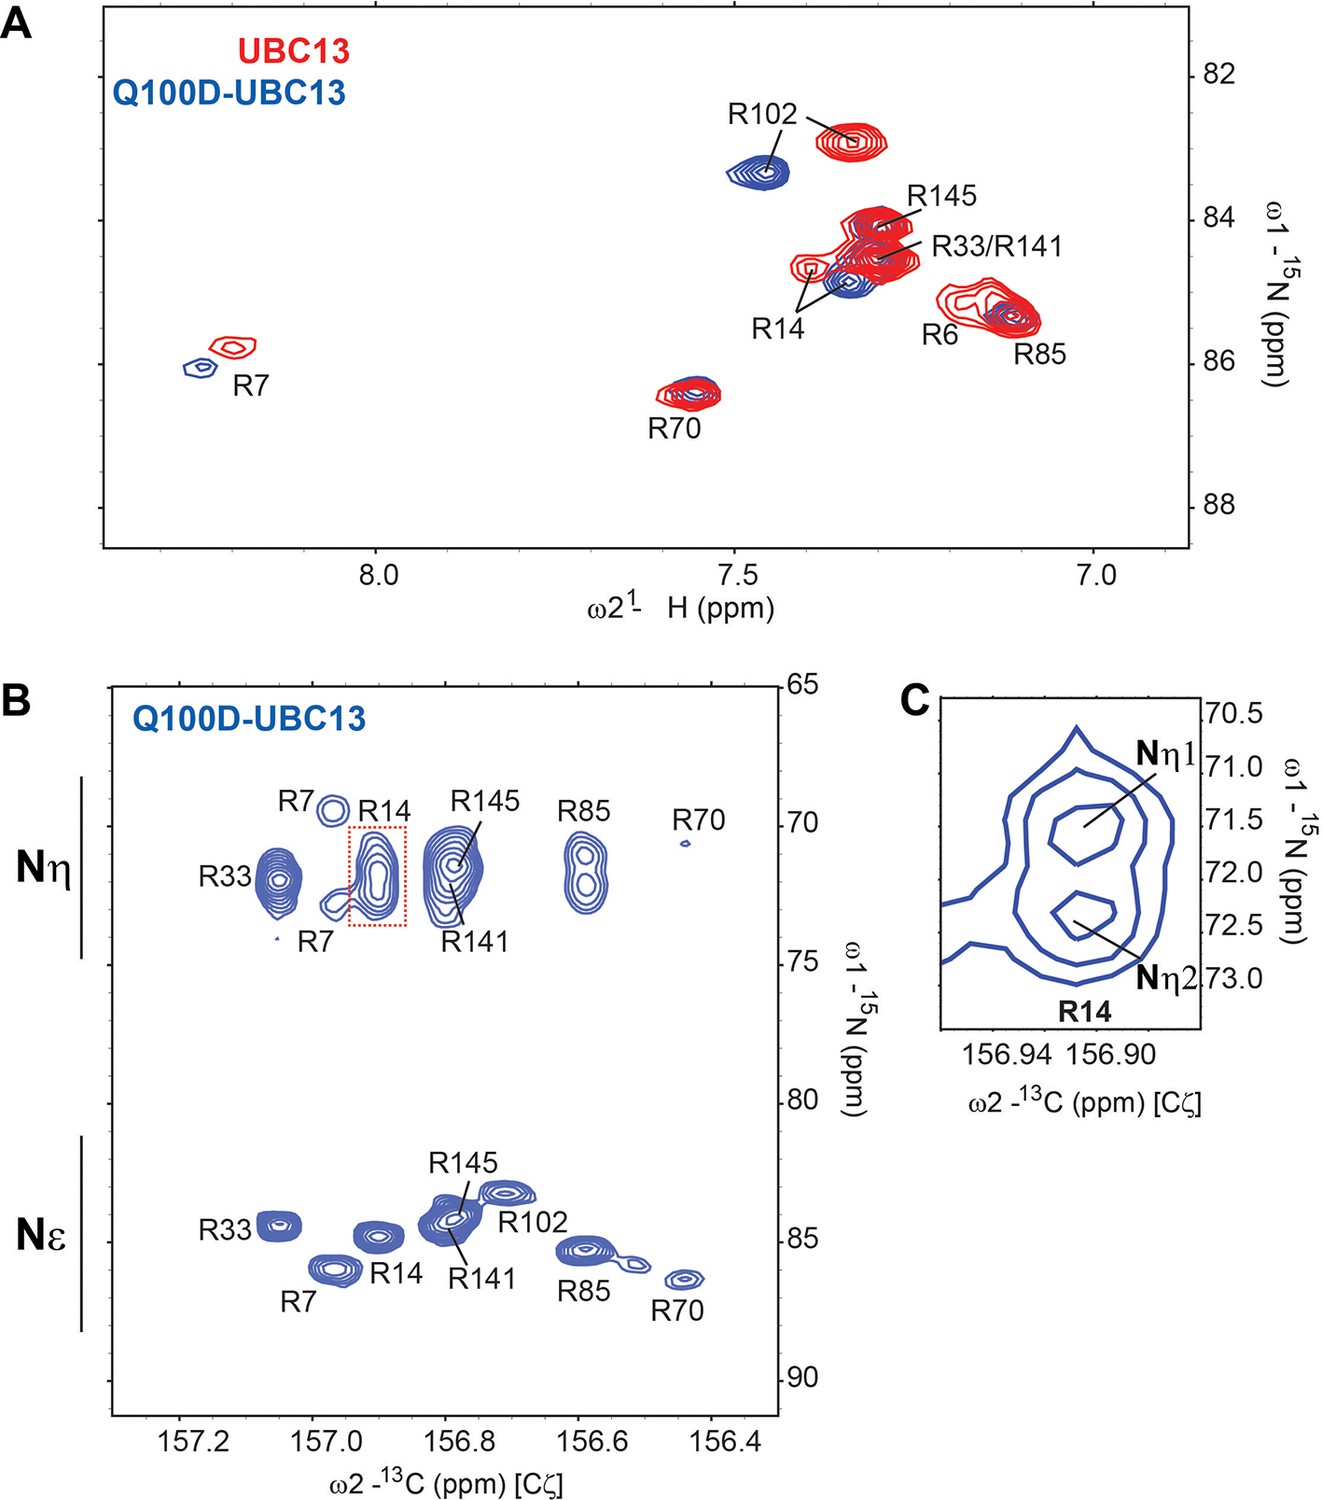
Intramolecular salt-bridge persisted in Q100D-UBC13.
(A) Overlay of UBC13 and Q100D-UBC13 15N-1H HSQC spectra zoomed around the Arginine Nε-Hε resonances, shows that R7, R14, and R102 sidechains resonances shift upon deamidation. (B) The 15Nε/η-13Cζ correlation spectra for Q100D-UBC13. The 15Nε/η and 13Cζ resonance shifts are in the x- and y-axis, respectively. (C) 15Nε/η-13Cζ correlation spectra for Q100D-UBC13 was processed with Gaussian window function and zoomed around the R14 15Nη resonances to clearly show the splitting due to intramolecular salt-bridge.
Figure 2—figure supplement 2
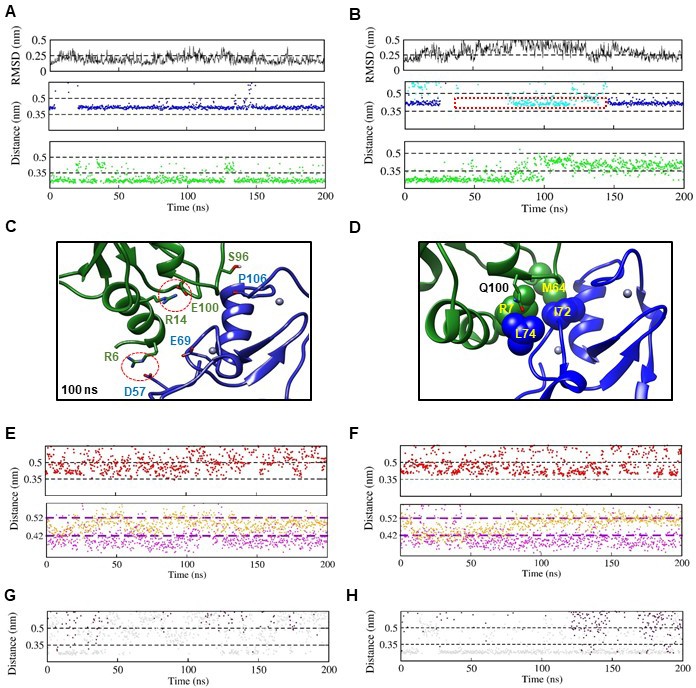
Conventional MD simulations of the UBC13/ TRAF6RING and dUBC13/ TRAF6RING native complexes.
(A) RMSD and contact analysis of UBC13/TRAF6RING complex from a 200 ns MD simulation. (B) RMSD and contact analysis of the dUBC13/TRAF6RING complex from a 200 ns MD simulation. For each trajectory in A and B, the top panel describes the RMSD variation of TRAF6RING with respect to the native complex as a function of time. The middle/bottom panels show the contact distance of two polar contacts against time: R14-Cζ/E69-Cδ (blue) and S96-Oγ/P106-N (green). The broken lines denote the corresponding distances observed in the crystal structure plus 0.05 nm for R14-E69 and 0.08 nm for S96-P106. In the middle panel of B, cyan dots depict the distance between the R14-Cζ and E100-Cδ atoms. The dotted box indicates the portion of the trajectory when the R14/E100 intramolecular salt-bridge formed. (C) A snapshot from the dUBC13/TRAF6RING native complex simulation at 100 ns showed that the R14/E100 salt-bridge could compete to disrupt the R14/E69 intermolecular salt-bridge. D)The interactions between R7 and M64 from UBC13, and, I72 and L74 from TRAF6RING in the UBC13/TRAF6RING complex (PDB 3HCU) are shown. (E) The top panel shows the contact distance of R6/D57 salt-bridge (red) for the UBC13/TRAF6RING complex. The bottom panel describes the dynamics of two non-polar contacts R7/L74 (orange) and M64/L72 (magenta). The distances are calculated between R7-Cζ and I72-Cγ atoms for the R7/I72 interaction. The same is calculated between M64-Cε and L74/Cγ2 atoms for the M64/L74 interaction. The cut-offs are the distances observed in the crystal structure + 0.02 nm. (F) Same contacts as in E are analyzed for the dUBC13/TRAF6RING complex. (G) Variation in the contact distances of two hydrogen bonds K10/L74 (turquoise) and K94/N109 (maroon) against time are shown. Based on the significant variation in the contact distance in the simulations, these hydrogen bonds are not analyzed subsequently. (H) Same contacts as in G are shown for the dUBC13/TRAF6RING complex.
Figure 3 with 1 supplement
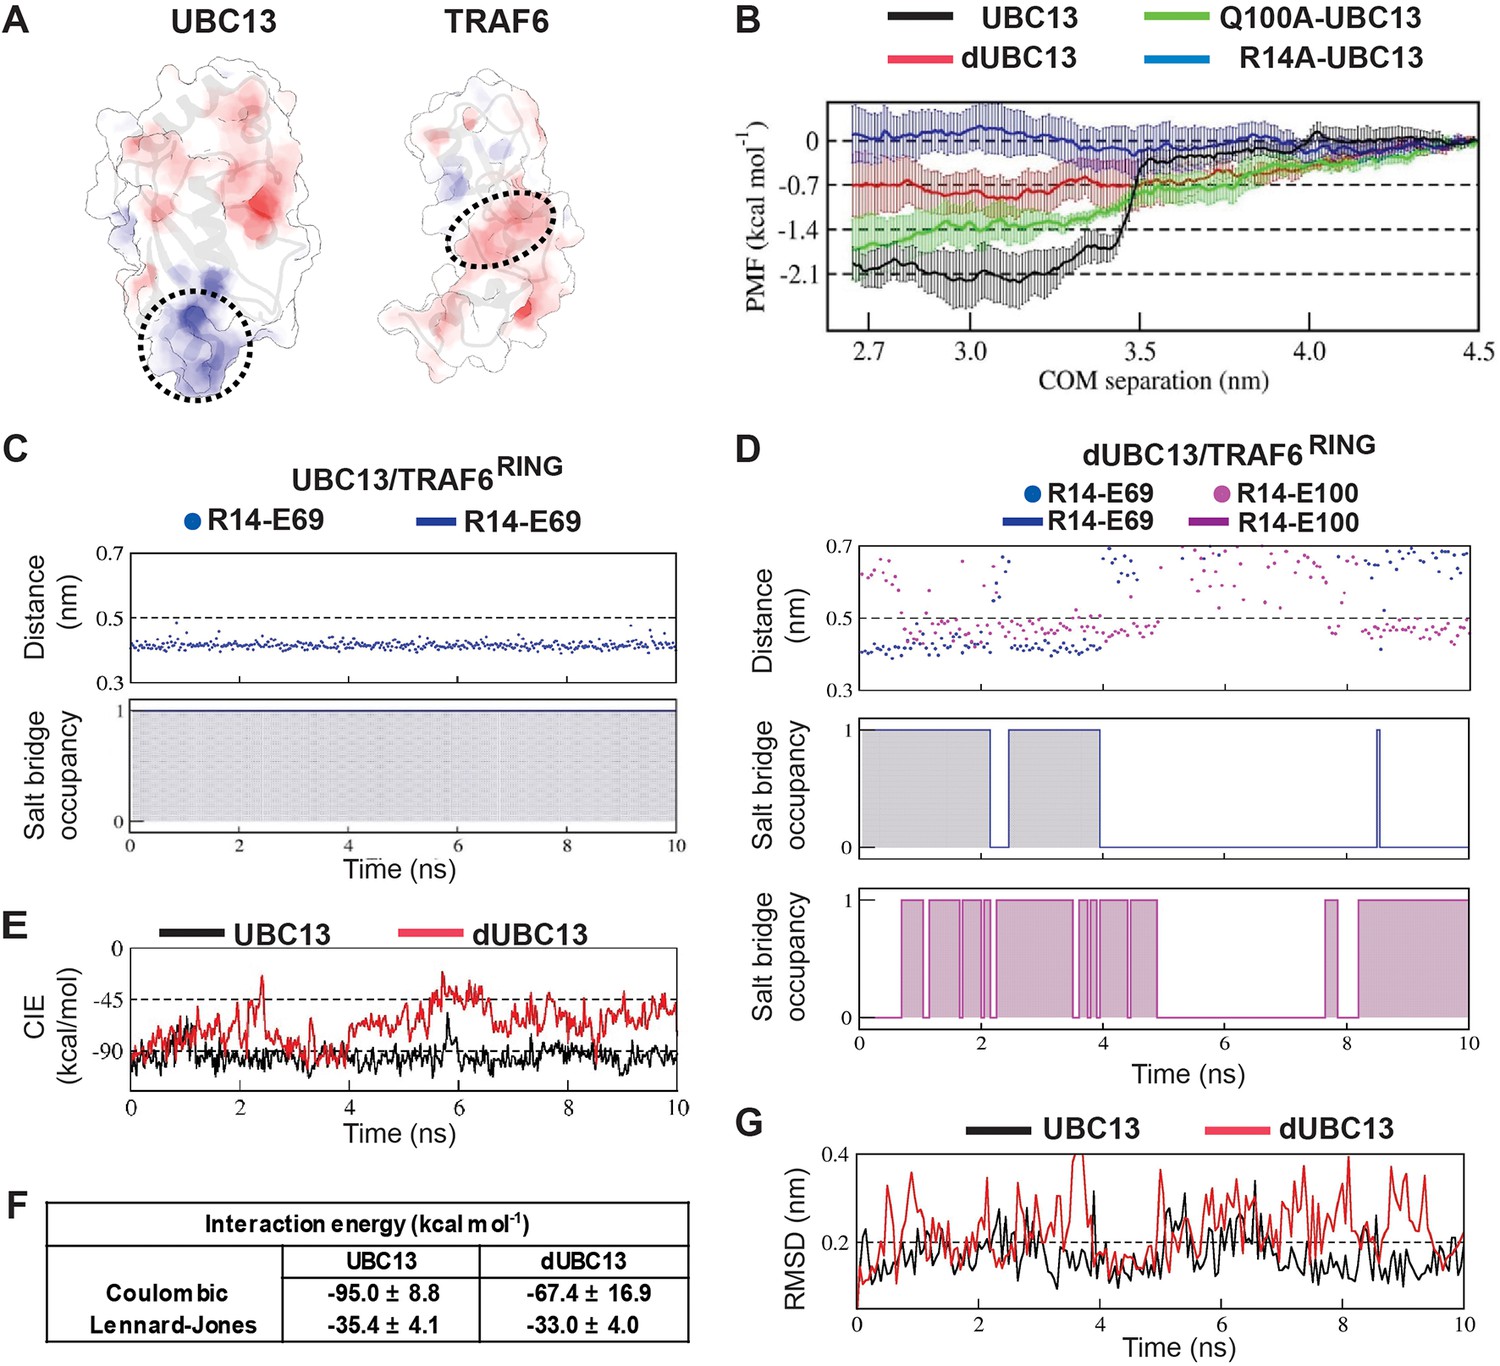
Deamidation induces salt-bridge competition to weaken UBC13/TRAF6RING interaction.
(A) Surface electrostatic potentials of UBC13 and TRAF6RING. Circled regions indicate the complementary electrostatic surfaces on UBC13 and TRAF6RING interfaces. The color scale ranges from −8 to +8 kT/e. (B) Potential of mean force (PMF) profiles as a function of COM separation along the x-axis for the association between UBC13 variants and TRAF6RING. PMF profiles were calculated by averaging over five PMF profiles ranging from 2.5 ns to 10 ns. Error bars represent ± one standard error of the mean (SEM). (C) Stability and occupancy of the R14-E69 salt-bridge in the native window for the wild-type complex. D) Stability and occupancy of the R14-E69 and R14-E100 salt-bridge in the native window for the dUBC13/ TRAF6RING complex. In (C) and (D), distance plots indicate the distance between R14 Cζ and E69/E100 Cδ atoms. The salt-bridge occupancy plots were generated as in Figure 2B. The salt-bridge occupancies are provided in Supplementary file 1-table S5. (E) Coulombic interaction energies (CIE) between UBC13 wild-type/Q100E and TRAF6RING in native windows (mean COM separation = 2.7 nm) from the US simulations. The table in (F) reports the Mean ± SD of the interaction energies over 10 ns. (G) RMSD of TRAF6RING (aa:70–109) against time in the UBC13 and dUBC13 complexes.
Figure 3—figure supplement 1
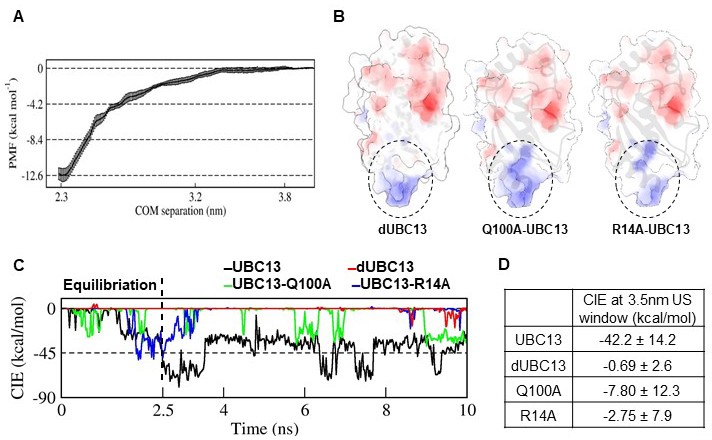
PMF profile for the Barnase-Barstar complex and CIE calculations for the UBC13 complexes at 3.5 nm US window.
(A) The PMF of Barnase-Barstar complex is plotted against the Center of Mass separation. (B) Surface electrostatic potentials of dUBC13, Q100A-UBC13, and R14A-UBC13. (C) CIE profiles of wt and mutant complexes at US window of 3.5 nm. (D) The average CIEs from (C) for the duration of 2.5 ns - 10ns.
Figure 4 with 2 supplements
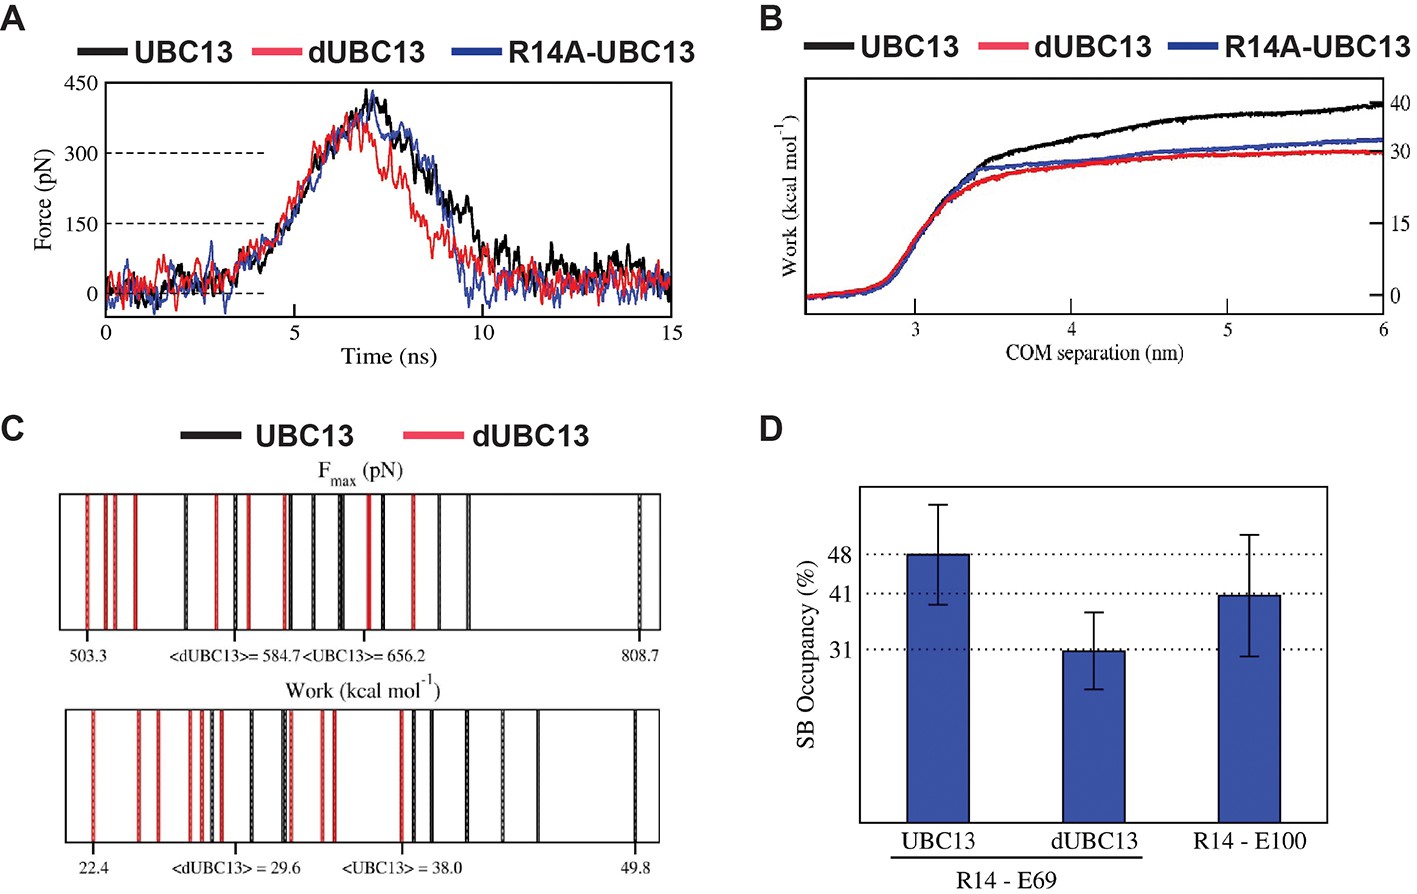
Steered MD of the UBC13/TRAF6RING and dUBC13/TRAF6RING complex.
(A) Average force-extension profiles for wild-type and mutant complexes are plotted. The profiles were smoothened over 250 ps time intervals. (B) The plot of average work against COM separation indicated the cumulative work done to separate wild-type and mutant complexes. (C) Distribution of Fmax (top) and unbinding work (bottom) values obtained from ten individual SMD trajectories for wild-type (black) and mutant (red) complexes are shown. In each plot, the minimum, maximum, and average (< >) values are indicated on the x-axis. Both plots reveal a shift in the range of Fmax and unbinding work towards lower values for the dUBC13/TRAF6RING complex, which correlate with the reduced binding. (D) Mean ± one standard error (SEM) of R14-E69/E100 salt-bridge (SB) occupancies averaged from 5 to 15 ns of ten individual SMD trajectories are shown. SEM for all three occupancies is within 11%.
-
Figure 4—source data 1
Source data of average salt-bridge occupancies in the SMD simulations.
- https://cdn.elifesciences.org/articles/49223/elife-49223-fig4-data1-v2.xlsx
Figure 4—figure supplement 1
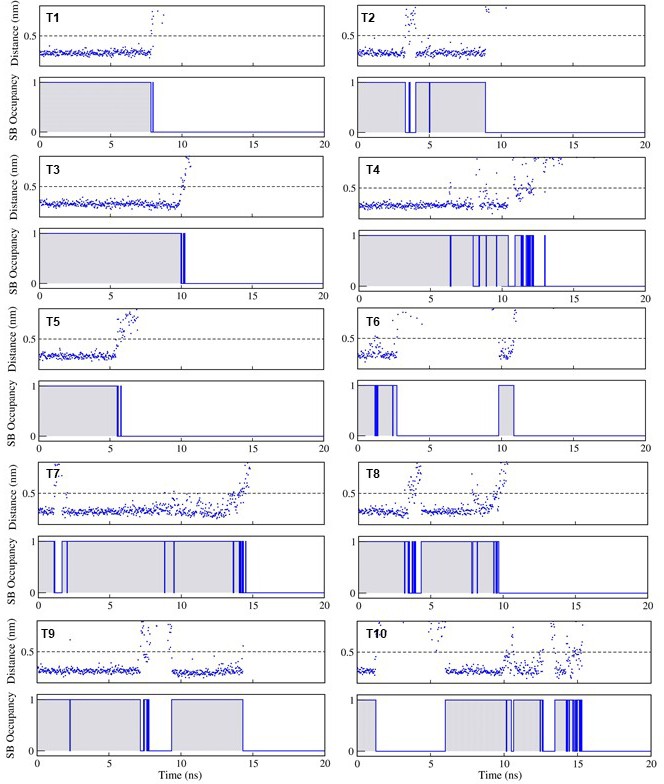
R14-E69 salt-bridge dynamics across ten trajectories (T1-T10) during dissociation of the UBC13/TRAF6RING complex by SMD.
For each trajectory, the actual distance variation and an occupancy plot are shown to indicate the presence (1) or absence (0) of the salt-bridge in a trajectory snapshot. The occupancies are obtained, as described in Figure 3A.
Figure 4—figure supplement 2
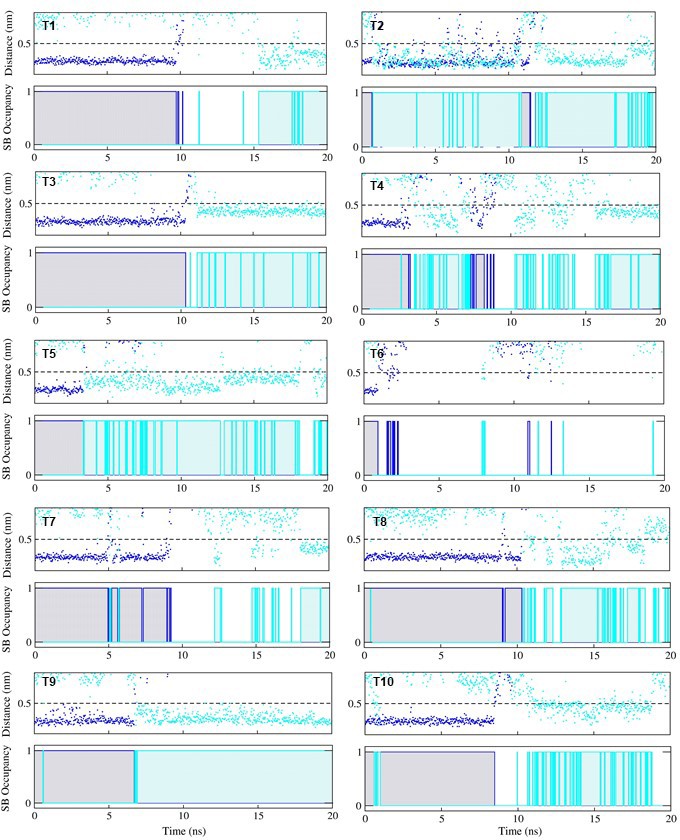
R14-E69 (blue)/R14-E100 (cyan) salt-bridge dynamics across ten trajectories (T1–T10) during dissociation of the dUBC13/TRAF6RING complex by SMD.
For each trajectory, the actual distance variation and an occupancy plot are shown to indicate the presence (1) or absence (0) of the salt-bridge in a trajectory snapshot. The occupancies are obtained, as described in Figure 3A.
Figure 5 with 1 supplement

Pathway of UBC13/TRAF6RING complex dissociation from steered MD.
(A) Top: The distance between R14-Cζ and E69-Cδ atoms against time during SMD. Bottom: The distance between S96-Oγ and P106-O atoms against time during SMD. (B) Occupancy plots of (A) calculated as in Figure 2B. (C) Two snapshots from the trajectory in (A) are shown. S96-P106 contact is disrupted at 8.3 ns followed by the R6-D57 salt-bridge break at 8.8 ns. Red dotted circles indicate the polar contacts. (D) Same as (A) for the dUBC13/TRAF6RING complex. The distance between R14-Cζ and E100-Cδ atoms against time is added here. (E) Occupancy plots of R14-E69 (blue), R14-E100 (magenta) and S96-P106 (green) contacts for the dUBC13/TRAF6RING complex. (F) Two snapshots from trajectory analyzed in (D) showed competition between R14-E100/E69 salt-bridges as the complex starts to dissociate at 6.5 ns.
Figure 5—figure supplement 1
Dynamics of R6-D57 salt-bridge and hydrophobic interactions in SMD.
The contact distance of R6-D57 salt-bridge and hydrophobic contacts for (A) UBC13/TRAF6RING and (B) dUBC13/TRAF6RING. In both A and B, the top panel describes the dynamics of R6-D57 salt-bridge (red, cut-off <= 0.5 nm) while the bottom panel describes the dynamics of two non-polar contacts - R7-L74 (in orange, cut-off <= 0.42 nm) and M64-L72 (in magenta, cut-off <= 0.52 nm).
Figure 6 with 1 supplement
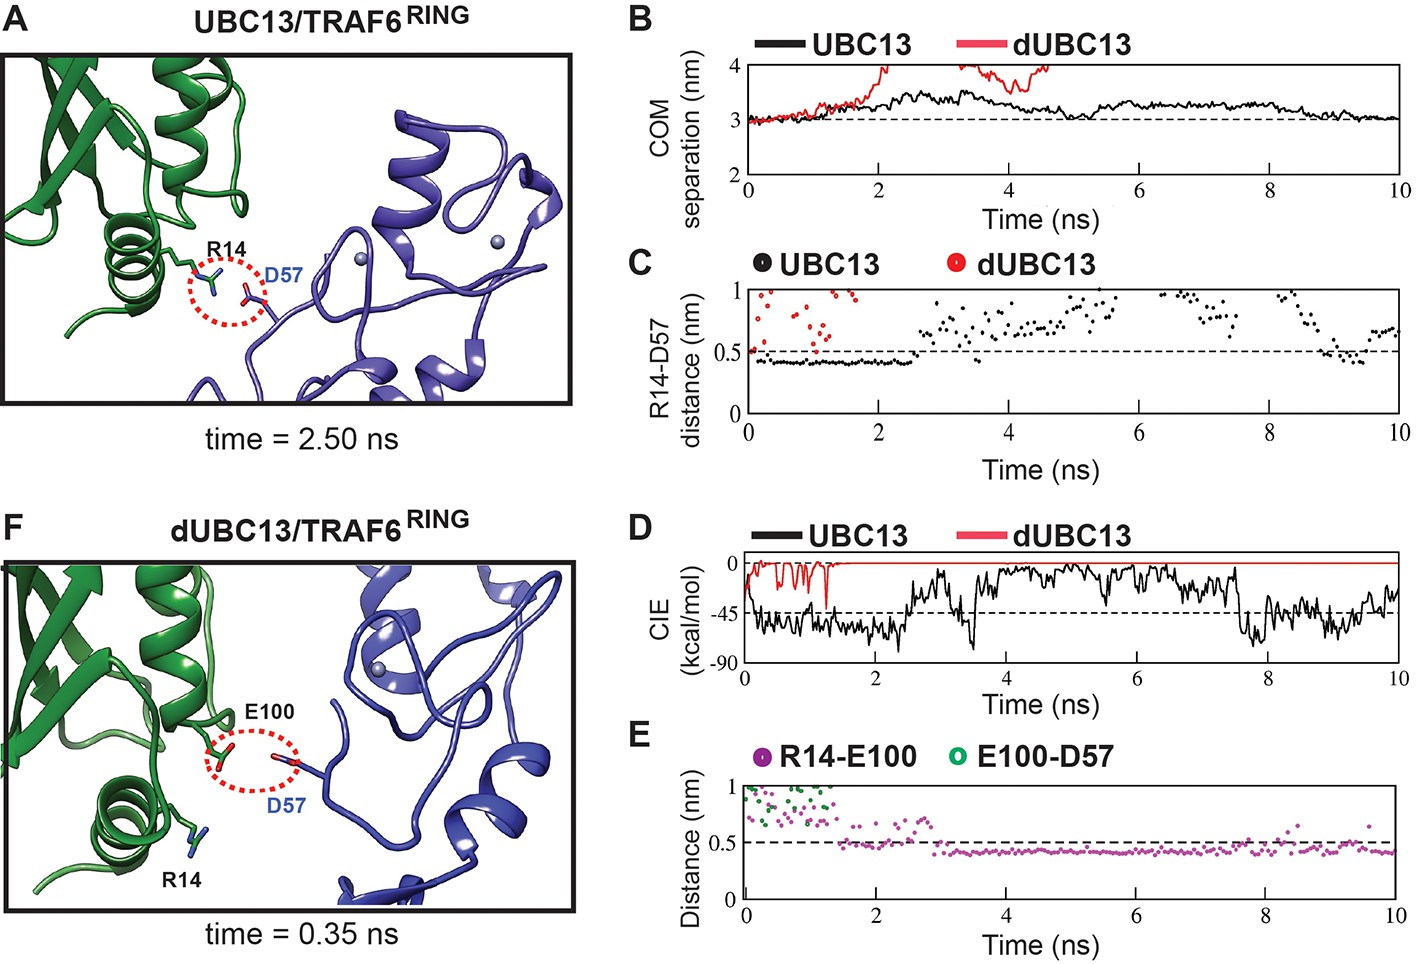
Analysis of transient complexes formed in the US simulations.
The US window corresponding to 3 nm COM distance of separation was analyzed. (A) The transient complex of UBC13 and TRAF6RING at t = 2.50 ns is shown. A transient intermolecular salt-bridge between R14 and D57 is indicated by a red dotted circle. (B) The plot of COM separation against time for the UBC13/TRAF6RING and dUBC13/TRAF6RING complexes. (C) The distance between the R14-D57 transient contact is compared between the two complexes. The distances were measured between R14-Cζ and D57-Cγ atoms. (D) Coulombic interaction energy (CIE) plotted against time. (E) The contact distance of E100-D57 and R14-E100 contacts are shown against time for the dUBC13/TRAF6RING complex. The distances were measured between R14-Cζ, E100-Cδ, and D57-Cγ atoms. (F) The transient complex of dUBC13 and TRAF6 at t = 0.35 ns, where E100 contacted D57.
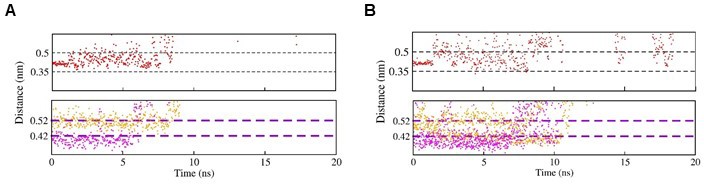
Figure 6—figure supplement 1
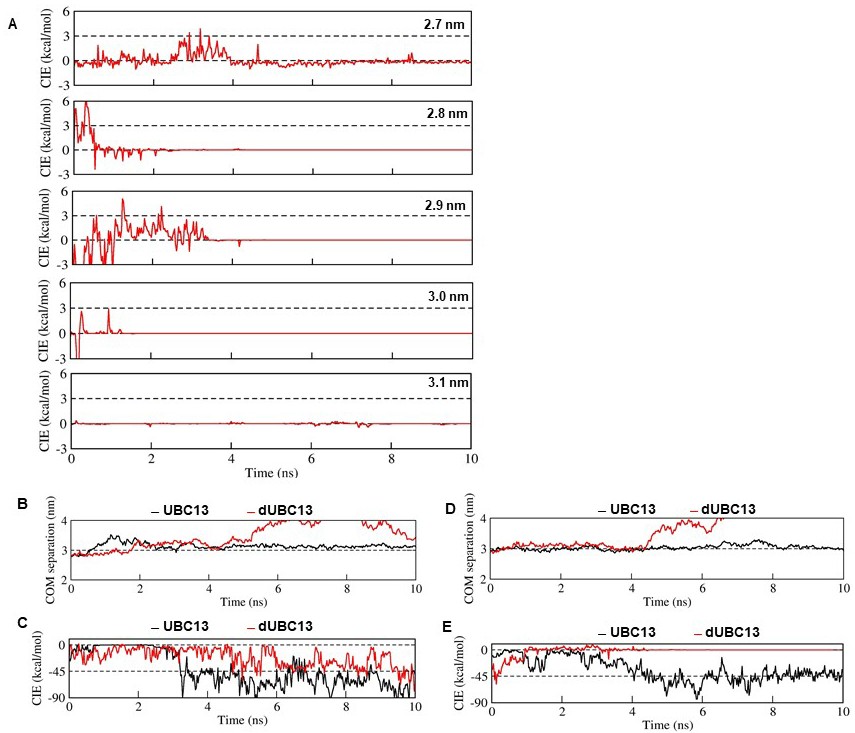
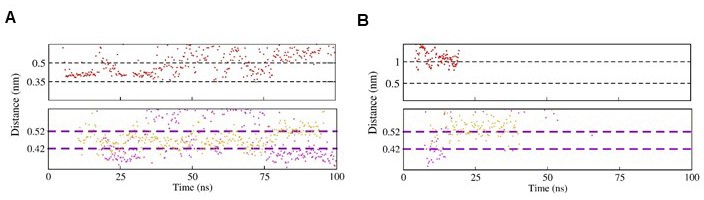
Analysis of interaction energy and COM separation between UBC13 and dUBC13 complexes from multiple umbrella sampling windows.
(A) Coulombic interaction energy between E100UBC13 and TRAF6RING in US windows from 2.7 to 3.1 nm COM separation. Beyond 3.1 nm, the energy profile is negligible. Repulsive interactions represented by positive CIE values were observed between E100 (carboxylate oxygens) and TRAF6RING within 3.0 nm COM separation in US simulations. (B) and (D) are the plots of COM separation against time for the UBC13/TRAF6RING and dUBC13/TRAF6RING complexes at 2.8 nm and 2.9 nm US windows, respectively. (C) and (E) are the plots of CIE between UBC13 (or dUBC13) and TRAF6RING at 2.8 nm and 2.9 nm US windows, respectively.
Figure 7 with 2 supplements
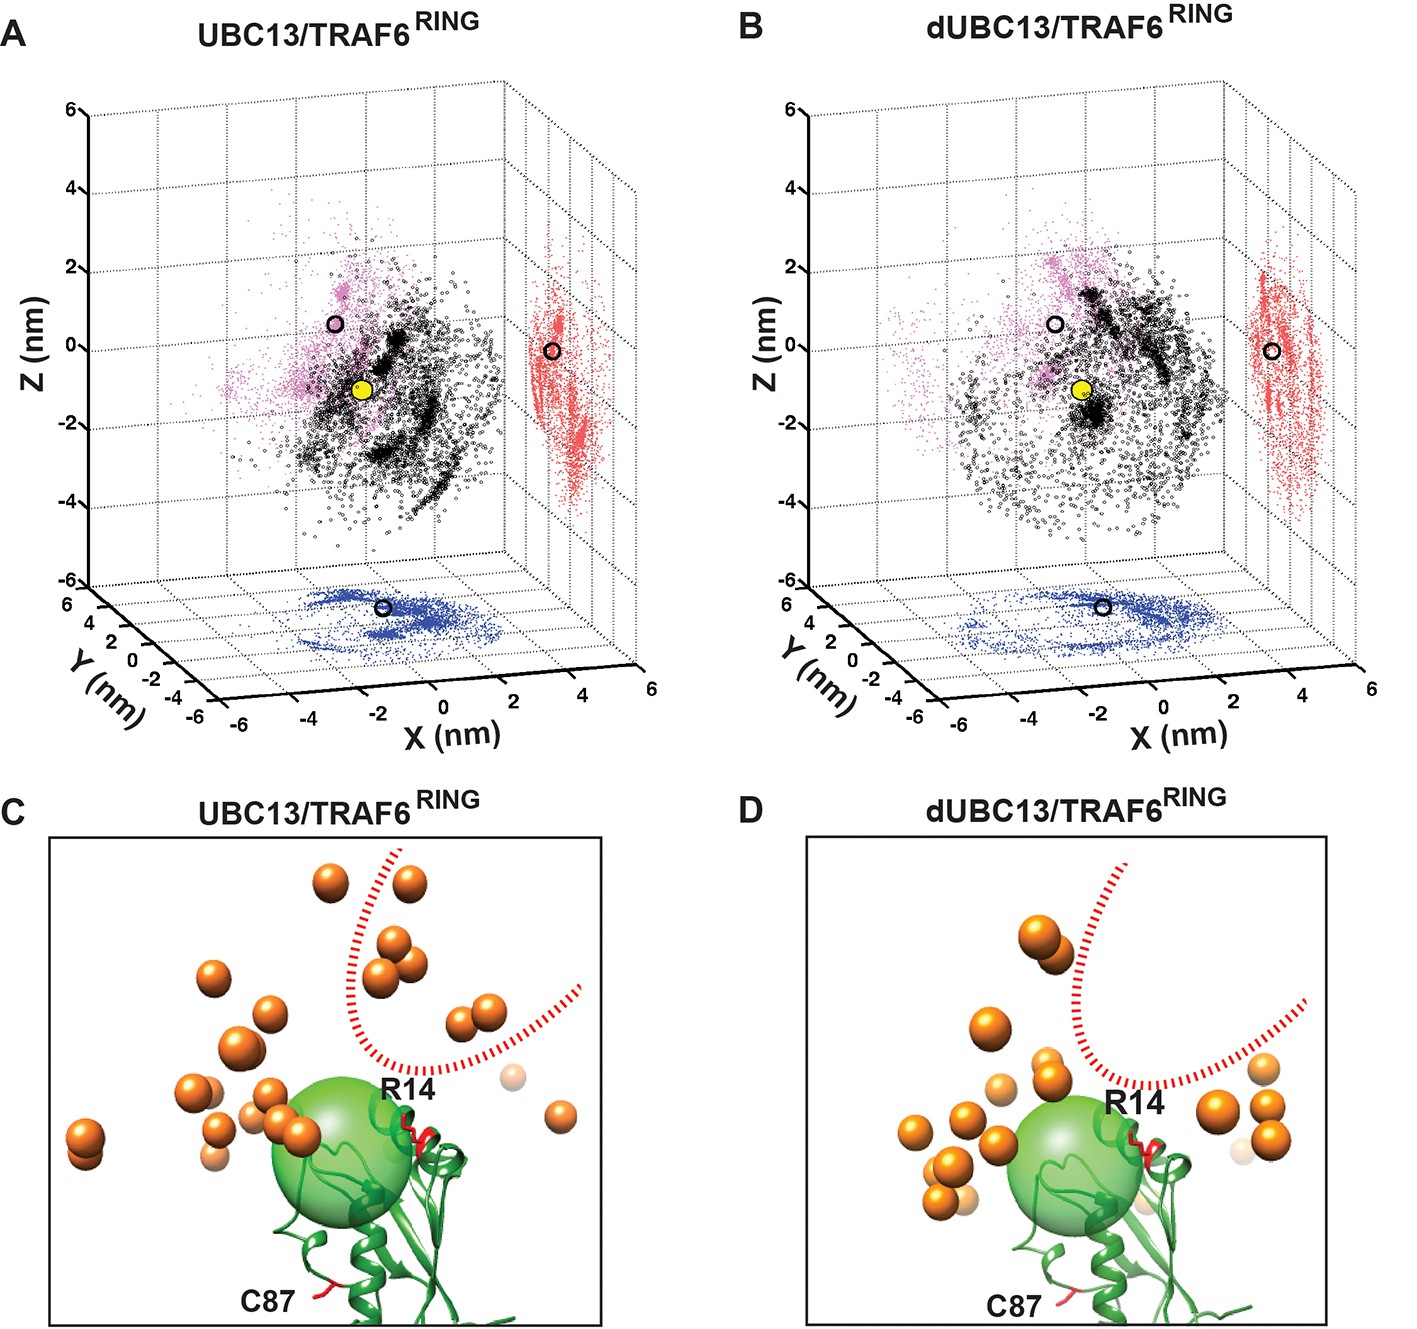
Transient complexes observed during unbiased association simulations.
(A) Black open circles denote TRAF6RING (aa:70–109) centers of mass around UBC13 in the Cartesian coordinate space. Red, pink and blue colored symbols denote projections of the centers of masses on the coordinate planes. Projections of the centers of mass of TRAF6RING in the native complex are shown as black open circles on the coordinate planes. The center of mass of the UBC13 helix α1, which is at the center of UBC13 interface, is shown as a yellow sphere at the origin. (B) Same as in (A) for dUBC13. (C) TRAF6RING clusters calculated based on pairwise RMSD between UBC13/TRAF6RING complexes (cutoff = 0.45 nm) are shown as orange spheres. Only representatives for clusters with greater than ten structures are shown. The UBC13 is represented in ribbon and colored green. The center of mass of UBC13 interface is shown as a green transparent sphere with 1 nm radius. The sidechain of R14 is shown and colored red. (D) Same as (C) for dUBC13. The region near R14, where TRAF6RING clusters were absent in dUBC13 is shown as a red dotted curve in (C) and (D).
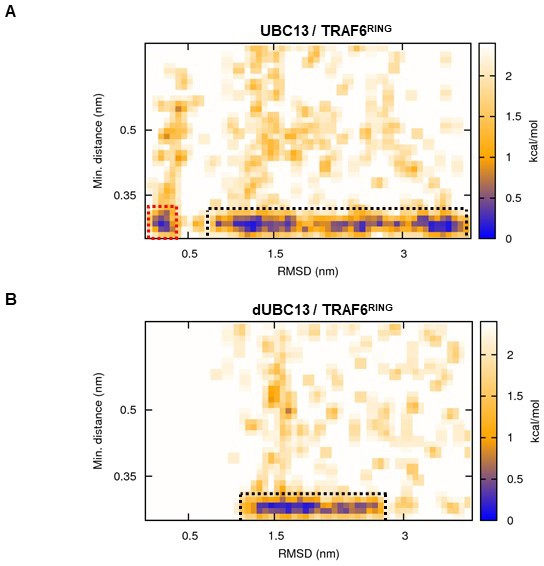
Figure 7—figure supplement 1
Free energy landscapes obtained from association MD (10 mM NaCl).
(A) and (B) are 2D-free energy landscapes of UBC13/TRAF6RING and dUBC13/TRAF6RING association, respectively. Both (A) and (B) are calculated as a function of minimum intermolecular salt-bridge distance (see Materials and methods) and TRAF6RING RMSD with respect to its crystallographic orientation. Dotted black boxes indicate the native-like transient complex ensemble while the red dotted box in A indicates the native complex. Bins equal to or greater than 2.4 kcal mol−1 are colored white.
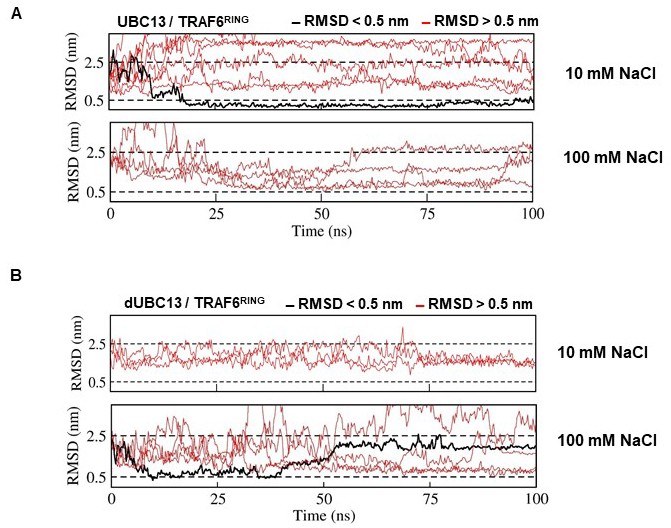
Figure 7—figure supplement 2
RMSD analysis of UBC13/dUBC13 and TRAF6RING association trajectories.
(A) RMSD analysis of the UBC13/TRAF6RING trajectories, which show a native-like association. One trajectory at 10 mM NaCl showed TRAF6RING RMSD values close (~0.25 nm) to its crystallographic orientation. (B) RMSD analysis of the dUBC13/TRAF6RING association trajectories, which show a native-like association. In only one trajectory at 100 mM NaCl (black lines), TRAF6RING RMSD values were transiently below 0.5 nm.
Figure 8 with 1 supplement
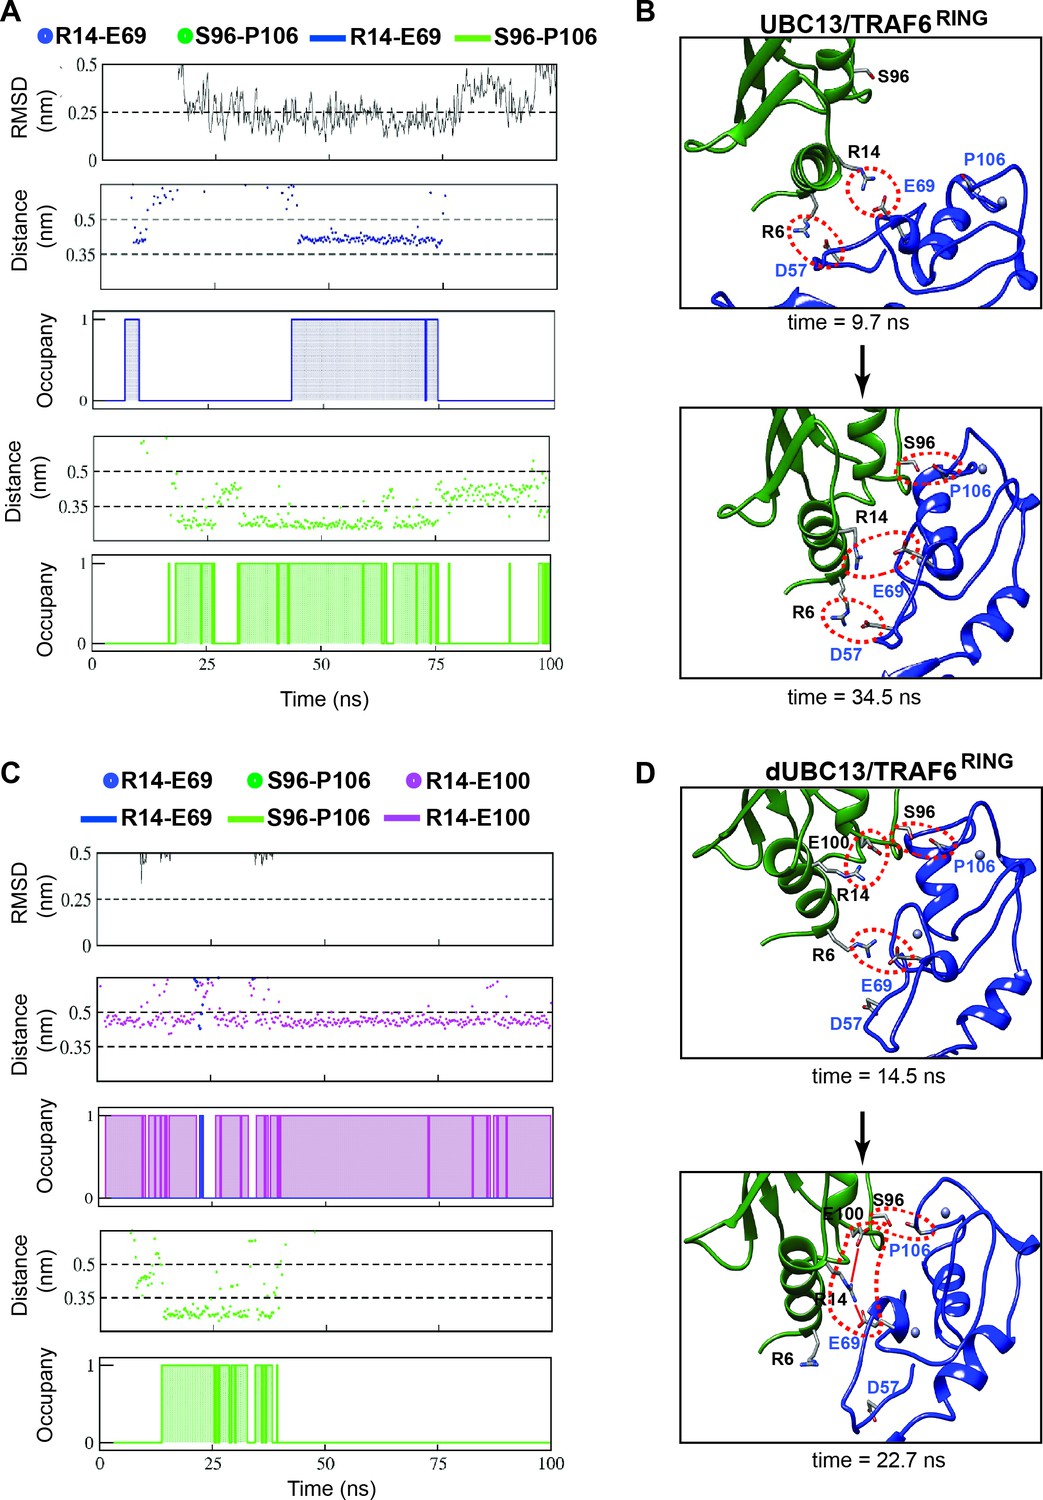
Association pathway of the UBC13/TRAF6 complex from unbiased MD trajectories.
(A) and (C) shows the RMSD of TRAF6RING, the distance between polar contacts and occupancies of polar contacts in UBC13/TRAF6RING and dUBC13/TRAF6RING trajectory, respectively. The occupancies are calculated as in Figure 2B and provided in Supplementary file 1-table S6. (B) Two snapshots from a trajectory in (A) is shown, where the initial contacts formed at 9.7 ns and the native complex formed at 34.5 ns. The polar contacts at the interface are shown by red dotted circles. (D) Two snapshots from a trajectory in (B) is shown, where the transient contacts formed at 14.5 ns, and the salt-bridge competition was observed at 22.7 ns (shown by red lines).
Figure 8—figure supplement 1
Dynamics of R6-D57 salt-bridge and hydrophobic interactions in association MD.
The variation in distance of R6-D57 salt-bridge and hydrophobic contacts for (A) UBC13/TRAF6RING and (B) dUBC13/TRAF6RING. In both (A) and (B), the top panel describes the dynamics of R6-D57 salt-bridge (red, cut-off <= 0.5 nm) while the bottom panel describes the dynamics of two non-polar contacts - R7-L74 (in orange, cut-off <= 0.42 nm) and M64-L72 (in magenta, cut-off <= 0.52 nm).
Figure 9 with 2 supplements
Activity and interactions of the UBC13/RNF38RING complex.
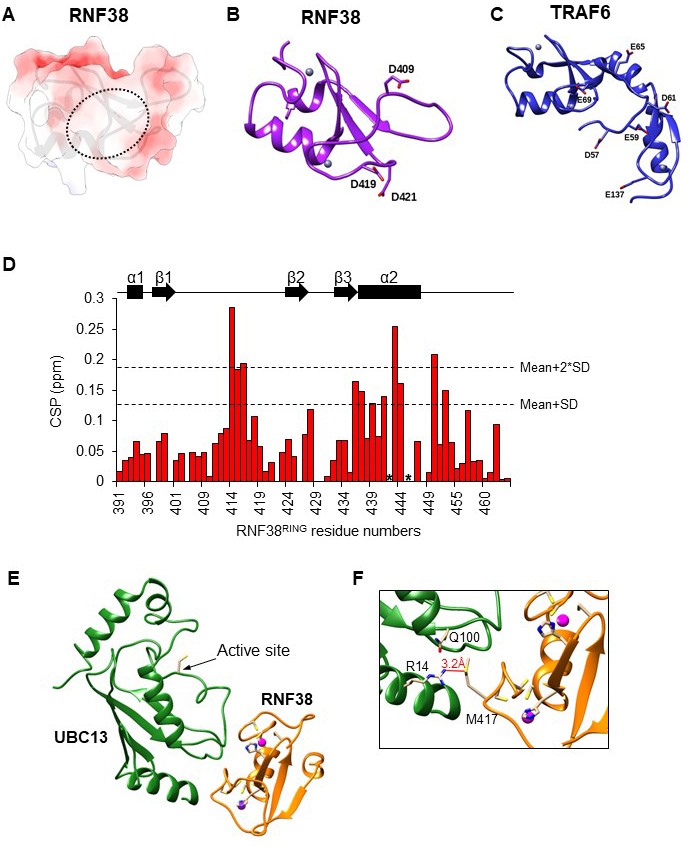
(A) The measured dissociation constants of mutants of UBC13/TRAF6RING complex are given as Mean+/-SD. The difference of free energy of binding was calculated as ΔΔGbinding = RTln(Kd/Kdwt), where T is 298K, and wt is the wild type complex. (B) In vitro ubiquitination assay was performed using UBC13/Mms2 (or dUBC13/Mms2) and RNF38. (C) Overlay of the 15N-edited HSQC spectra of free UBC13 (red) with different stoichiometric ratios of RNF38RING as given in the top left-hand side of the spectra. (D) Regions of the HSQC spectra are expanded to show the UBC13 and dUBC13 peaks during titration with RNF38RING. (E) The CSPs for each residue in UBC13 upon binding to RNF38RING. The orange and red dashed lines correspond to Mean + SD and Mean + 2*SD, respectively. The secondary structure alignment of UBC13 against its sequence is provided above the plot. (F) The CSPs for each residue in dUBC13 upon binding to RNF38RING. The dashed lines are replicated from (E). Significant CSPs were mapped on the UBC13 and dUBC13 structure using both the (G) ribbon and (H) surface representation. The UBC13 and dUBC13 are colored in light blue. The residues with CSPs above Mean + SD and Mean + 2*SD are colored in orange and red, respectively. The RNF38RING domain is surface rendered and colored in magenta. (I) The measured dissociation constants of UBC13 and its mutants with RNF38RING domain are given as Mean+/-SD. The difference in binding is calculated as in A).
-
Figure 9—source data 1
Source data of chemical shift perturbations against UBC13 residue numbers in the UBC13/RNF38RING titration.
- https://cdn.elifesciences.org/articles/49223/elife-49223-fig9-data1-v2.xls
-
Figure 9—source data 2
Source data of chemical shift perturbations against dUBC13 residue numbers in the dUBC13/RING38RING titration.
- https://cdn.elifesciences.org/articles/49223/elife-49223-fig9-data2-v2.xls
Figure 9—figure supplement 1
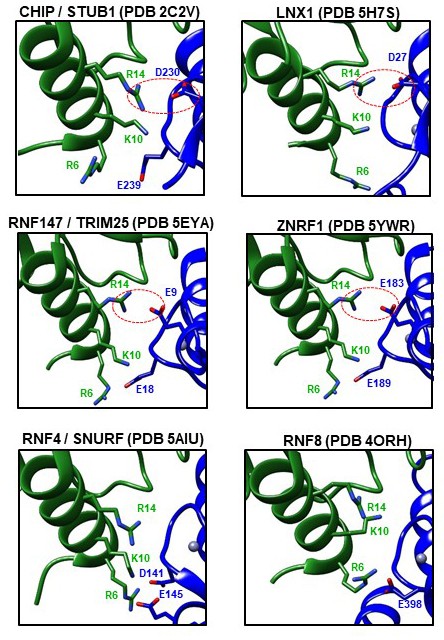
R14-mediated intermolecular salt-bridges observed in crystallographic complexes of UBC13 with RING domains of other E3s.
Dashed red circles are indicative of intermolecular salt-bridges involving R14 in UBC13. RNF4 and RNF8 lack R14-mediated intermolecular salt-bridges.
Figure 9—figure supplement 2
Analysis of UBC13/RNF38RING structure and charge distribution at and near the interface of RNF38/TRAF6RING.
(A) Surface electrostatic potential reveals a lack of salt-bridge acceptors at the RNF38RING interface (circled region). Color scale varies from −8 to +8 kBT/e. (B) Negatively charged residues near the interface of RNF38RING. (C) Negatively charged residues at/near the interface of TRAF6RING. (D) The CSPs for residues in RNF38RING upon binding to UBC13. The black dashed lines correspond to Mean + SD and Mean + 2*SD, respectively. The secondary structure alignment of RNF38RING against its sequence is provided above the plot. A couple of amide resonances at the helix α2 broadened during titration, which is marked by asterisk. (E) The NMR data-driven model of UBC13/RNF38RING complex calculated by HADDOCK (Dominguez et al., 2003). (F) The interface is zoomed in, and the R14/M417 contact at the interface is shown by the red line. The Zn atoms in RNF38 (magenta) and coordinating Cysteines/Histidines are also displayed.
Figure 10 with 3 supplements
Activation of UBC13 ~ Ub conjugates by RING domains.
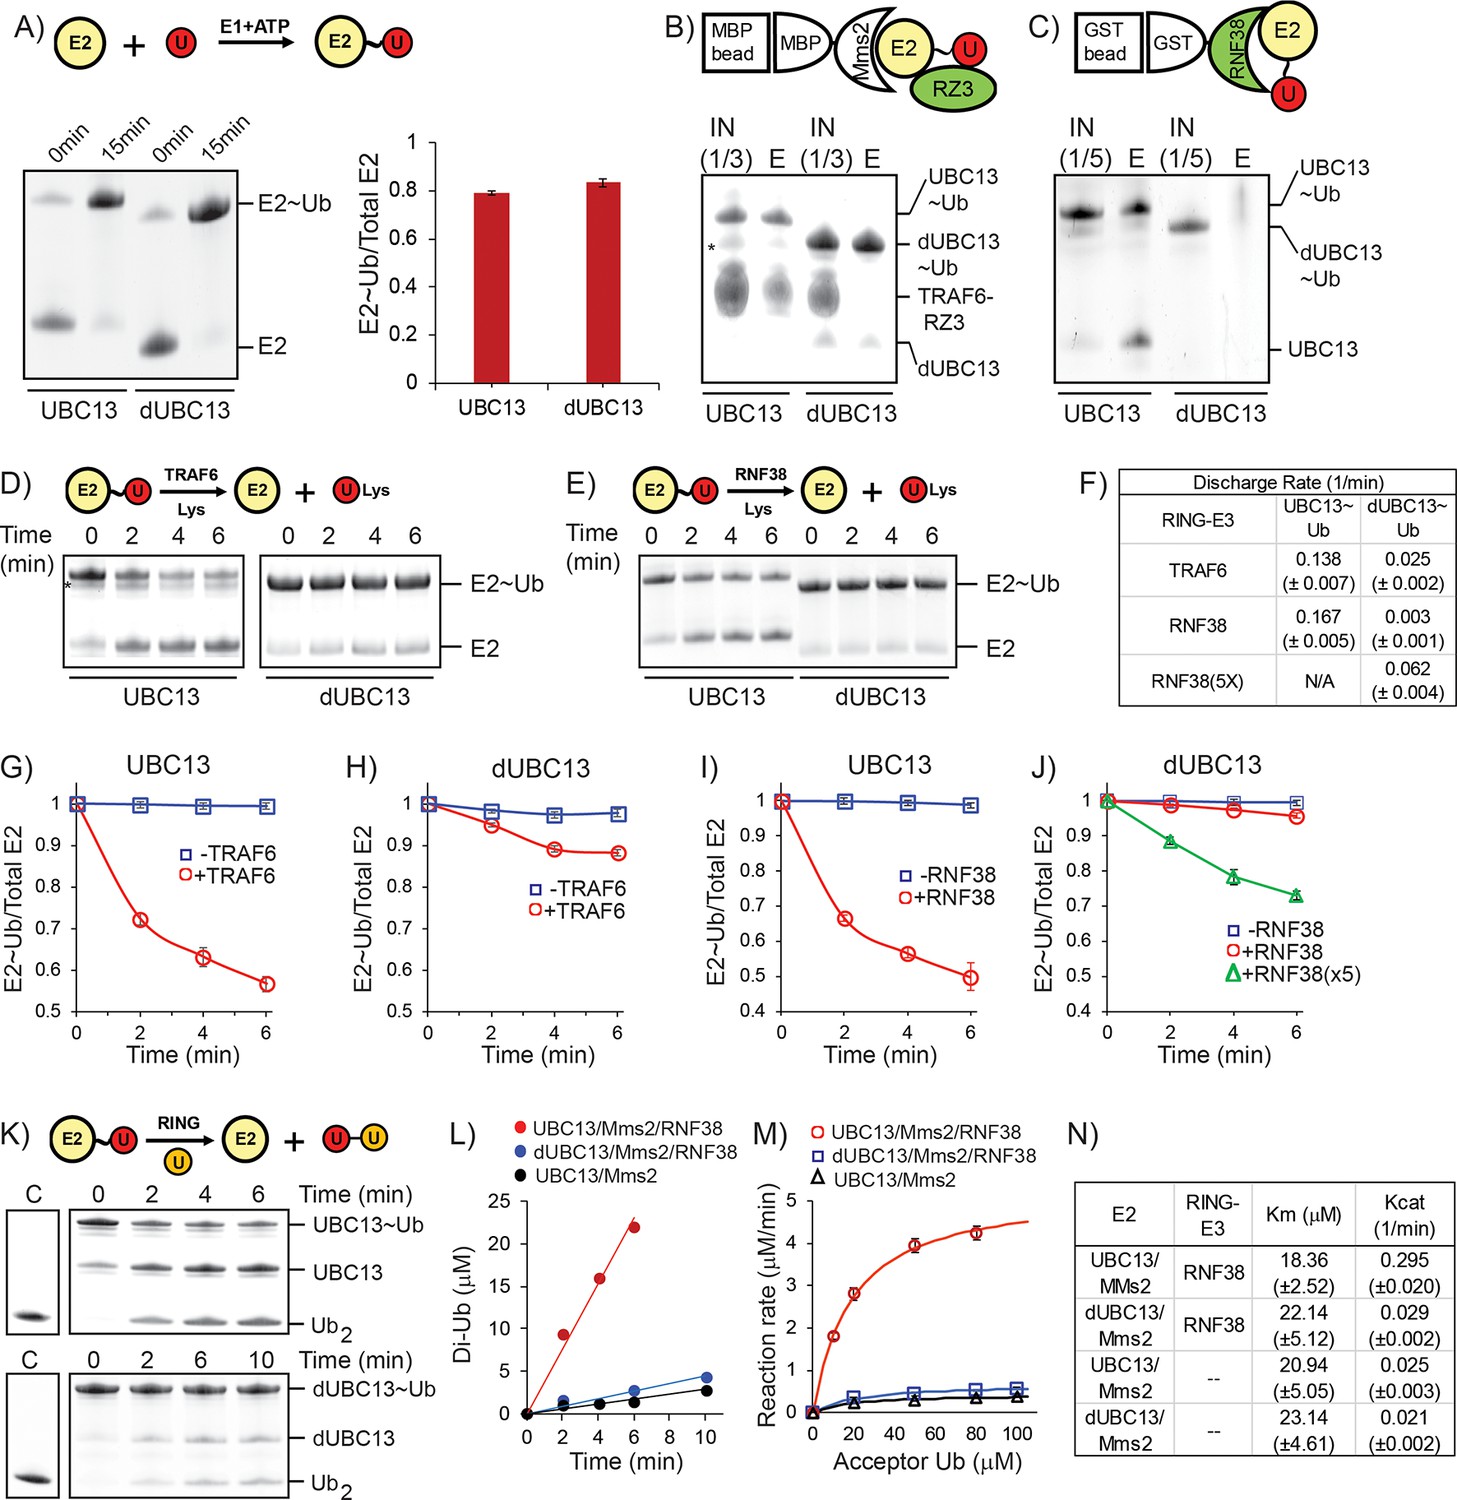
(A) A comparison of Ub conjugation to UBC13 and dUBC13. E1, ATP, and UBC13/dUBC13 were incubated in reaction buffer for 15 min, quenched by adding EDTA and separated on SDS page. The amount of E2 ~ Ub conjugates were quantified and plotted in the right section. The values are the mean of three reactions, and the error is the standard deviation of the same. (B) Affinity pull-down experiment was performed by incubating MBP beads with MBP-Mms2, UBC13 ~ Ub (or dUBC13 ~ Ub) and TRAF6RZ3, washed thoroughly and separated on SDS gels. The asterisk denotes impurities. (C) Affinity pull-down experiment was performed by incubating GST beads with GST-RNF38RING and UBC13 ~ Ub (or dUBC13 ~ Ub), washed thoroughly and separated on SDS gels. (D) Single-round discharge of Ub from UBC13 ~ Ub and dUBC13 ~ Ub catalyzed by TRAF6RING was monitored. UBC13 was conjugated with Ub, and the reaction was quenched. Then Mms2, TRAF6RING, and Lysine were added to the reaction mixture, and E2 ~ Ub and free E2 was monitored over time. The proteins bands in (D) were quantified and plotted in (G) and (H). The plotted values are the mean of triplicates, and the error is the standard deviation of the same. (E) Same as in D), where the discharge is catalyzed by RNF38RING domain. The proteins in (E) are quantified and plotted in (I) and (J). The rate of discharge in each case was calculated as discharge-rate = (Total E2-E2 ~ Ub)/(Total E2.time) for the initial time points and given in (F). (K) The rate of Ub2 synthesis was monitored over time. UBC13 or dUBC13 was conjugated with Ub, and the reaction was quenched. Then Mms2, RNF38RING and Acceptor Ub was added to the reaction mixture, and the synthesis of Ub2 was monitored over time. (L) The rate of Ub2 synthesis for UBC13 and dUBC13 are compared at substrate (acceptor-Ub) concentration of 50 μM. (M) The reaction rates for UBC13 and dUBC13 are compared at various substrate concentrations. (N) The kinetic parameters of Ub2 synthesis for UBC13 and dUBC13 are given in a table. The values are the mean of triplicates, and the error is the standard deviation of the same. The Ub used in all the experiments of this figure is K63A-Ub, except the acceptor Ub used in (K)-(M) is D77-Ub.
Figure 10—figure supplement 1
Kinetics of Ub conjugation, RING-binding, and Ub-discharge.
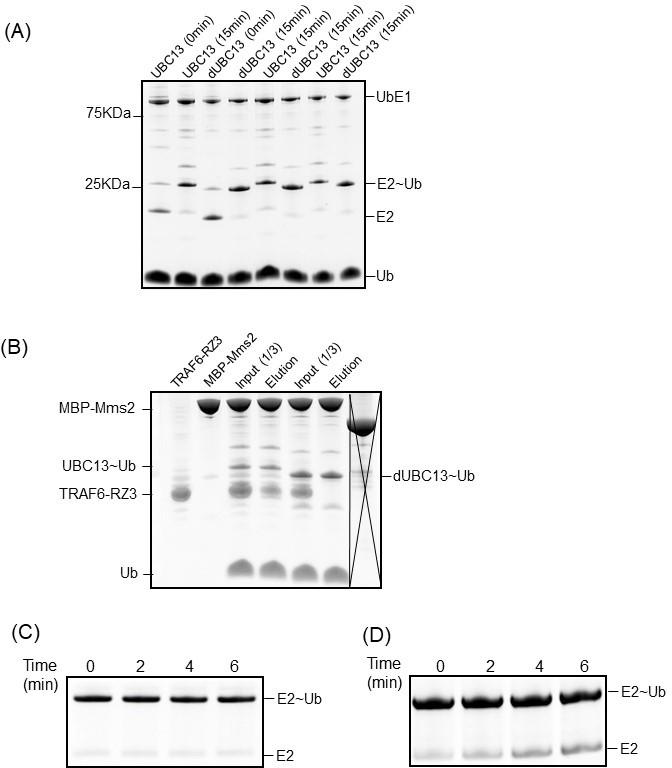
(A) The complete gel-image of the Ub-conjugation reaction shown in Figure 10A. (B) The complete gel-image of TRAF6-RZ3 and UBC13 ~ Ub binding experiment of Figure 10B. (C) The control UBC13 ~ Ub discharge experiment in the absence of the RING domain. (D) The dUBC13 ~ Ub discharge experiment with RNF38(5X).
Figure 10—figure supplement 2
Kinetics of Ub2 synthesis.
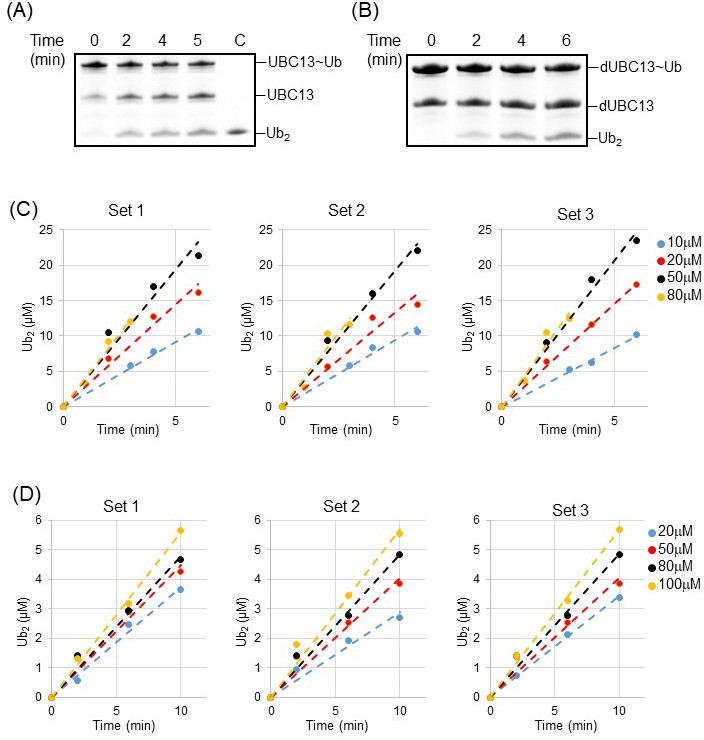
(A) The kinetics of Ub2 synthesis in UBC13/Mms2 the absence of RING domain. The control lane C is purified Ub2. (B) The kinetics of Ub2 synthesis in dUBC13/Mms2 the absence of RING domain. The amount of Ub2 formed by (C) UBC13/Mms2/RNF38RING and (D) dUBC13/Mms2/RNF38RING is plotted against time. The fits of the data are shown as dotted lines. The various substrate (D77-Ub) concentrations are shown by different colors.
Figure 10—figure supplement 3

Stabilization of the UBC13 ~ Ub conjugate by the TRAF6 homodimer.
Structure of the UBC13 ~ Ub-TRAF6RING catalytic complex (PDB 5VO0). The inset shows two essential Arginines located on the distal TRAF6 protomer (dTRAF6), which help to stabilize the closed conformation of UBC13 ~ Ub in addition to the proximal unit (pTRAF6).
Videos
Video 1
Destabilization of the dUBC13/TRAF6RING native complex observed in a conventional MD simulation due to the formation of the R14-E100 intramolecular salt-bridge.
This movie shows a change in the native intermolecular orientation indicated by an increase in RMSD of TRAF6RING beyond 0.5 nm, as shown in Figure 2—figure supplement 2B. Disruption of the R14-E69 salt-bridge occurs at ~ 25 ns followed by the formation of R14-E100 salt-bridge from ~ 75 to 150 ns. During this period, the S96-P106 contact is also lost. Residues R6/R14/S96/E100 in UBC13 (Green) and D57/E69/P106 in TRAF6RING (Blue) are shown in stick representation. A black, dashed-line is drawn between R14 (Cζ) and E100 (Cδ) which indicates the presence/absence of an intramolecular salt-bridge depending on the length of the line.
Video 2
Dissociation pathway of the UBC13/TRAF6RING native complex observed by steered MD.
The movie shows the order of contact disruption during enforced dissociation of TRAF6RING from UBC13 (Figure 5A–C, Figure 5—figure supplement 1A). The loss of S96-P106 and hydrophobic interactions occur by ~9 ns. The R14-E69 salt-bridge persists until ~ 15 ns following which, complete dissociation occurs. Residues R6/R14/S96 in UBC13 (Green) and D57/E69/P106 in TRAF6RING (Blue) are shown in stick representation.
Video 3
Dissociation pathway of the dUBC13/TRAF6RING native complex observed by steered MD.
The movie shows the order of contact disruption during enforced dissociation of TRAF6RING from dUBC13 (Figure 5D–F, Figure 5—figure supplement 1B). The R14-E69 salt-bridge is lost within ~ 3 ns due to competition with E100. Loss of S96-P106 and hydrophobic interactions occur by ~11 ns. The R14-E100 intramolecular salt-bridge persists even after dissociation of the complex. Residues R6/R14/S96/E100 in UBC13 (Green) and D57/E69/P106 in TRAF6RING (Blue) are shown in stick representation. A black, dashed-line is drawn between R14 (Cζ) and E100 (Cδ) which indicates the presence/absence of an intramolecular salt-bridge depending on the length of the line.
Video 4
Association pathway of UBC13/TRAF6RING (10 mM NaCl) observed by conventional MD.
The movie shows the order of contact formation during the association of TRAF6RING and UBC13 (Figure 8A–B, Figure 8—figure supplement 1A). Initial association occurs through the formation of R6-D57 and R14-E69 salt-bridge. Subsequent formation of hydrophobic and S96-P106 contacts lead to the acquisition of the native orientation (top panel, RMSD ~ 0.3 nm). Residues R6/R14/S96 in UBC13 (Green) and D57/E69/P106 in TRAF6RING (Blue) are shown in stick representation.
Video 5
Salt-bridge competition observed during dUBC13/TRAF6RING association (100 mM NaCl) by conventional MD.
The movie shows the order of contact formation during the association of TRAF6RING and dUBC13 (Figure 8C–D, Figure 8—figure supplement 1B). Initial association occurs through the formation of a non-native R6-E69 salt-bridge due to the presence of the R14-E100 intramolecular salt-bridge. Hydrophobic and S96-P106 contacts are weakly present from ~ 5 to 40 ns. At ~ 22 ns, salt-bridge competition occurs, leading to the formation of the R14-E69 salt-bridge. E100UBC13 eventually outcompetes E69TRAF6 for R14 which leads to a disruption of the transient complex by 50 ns. Residues R6/R14/S96/E100 in UBC13 (Green) and D57/E69/P106 in TRAF6RING (Blue) are shown in stick representation. A black, dashed-line is drawn between R14 (Cζ) and E100 (Cδ) which indicates the presence/absence of an intramolecular salt-bridge depending on the length of the line.
Tables
Table 1
Association PMF determined by Umbrella sampling MD.
| Complex | <ΔGPMF> (kcal/mol) |
|---|---|
| Barstar/Barnase | −12.60 (±0.76) |
| UBC13/TRAF6 | −2.03 (±0.27) |
| dUBC13/TRAF6 | −0.67 (±0.50) |
| Q100A-UBC13/TRAF6 | −1.64 (±0.49) |
| R14A-UBC13/TRAF6 | +0.04 (±0.38) |
-
*Standard error of mean is indicated in brackets.
Table 2
Fmax and unbinding work determined by Steered MD.
| Complex | <FMax > (pN) | <Work > (kcal mol−1) |
|---|---|---|
| UBC13/TRAF6 | 466.7 (±31.5) | 38.1 (±2.2) |
| dUBC13/TRAF6 | 425.9 (±42.2) | 29.6 (±1.6) |
| R14A-UBC13/TRAF6 | 450.4 (±45.9) | 31.9 (±2.1) |
-
*Standard error of mean is indicated in brackets.
Table 3
Electrostatic free energies and association rate constants (ka0/kon) of UBC13/TRAF6RING calculated using TransComp web server.
| 10 mM NaCl | 100 mM NaCl | ||||
|---|---|---|---|---|---|
| Transient complex Ensemble | ka0 (106 .M−1s−1) | ΔGel (kcal mol−1) | kon (106 .M−1s−1) | ΔGel (kcal mol−1) | kon (106 .M−1s−1) |
| UBC13/TRAF6 | 0.57 | −2.32 | 28.7 | −1.33 | 5.43 |
| dUBC13/TRAF6 | 0.63 | −1.59 | 9.36 | −0.99 | 3.43 |
| R14A-UBC13/TRAF6 | 0.62 | −1.16 | 4.42 | −0.62 | 1.78 |
Table 4
Summary of unbiased-association MD simulations.
| Association Trajectories* (%) | ||||
|---|---|---|---|---|
| 10 mM NaCl (low salt) | 100 mM NaCl (high salt) | |||
| UBC13 | dUBC13 | UBC13 | dUBC13 | |
| Native-like association | 53 (8) | 20 (3) | 27 (4) | 33 (5) |
| Non-native association | 47 (7) | 60 (9) | 40 (6) | 47 (7) |
| No association | 0 (0) | 20 (3) | 33 (5) | 20 (3) |
| Mean percentage time (i.e., stability) of native-like association (%)** | ||||
| 32 (9) | 14 (9) | 11 (7) | 11 (5) | |
-
*The number of trajectories used is indicated in brackets.
**Standard error of mean is shown in brackets.
Key resources table
| Reagent type (species) or resource | Designation | Source or reference | Identifiers | Additional information |
|---|---|---|---|---|
| TRAF6 (Homo sapiens) | TRAF6RING (50-124) | Thermo Fischer Scientific, USA | ||
| UBC13 (Homo sapiens) | UBC13 | Pruneda et al., 2012 | ||
| RNF38 (Homo sapiens) | RNF38RING (387-465) | Buetow et al., 2015 | ||
| Strain, strain background (Escherichia coli) | BL21(DE3) | Invitrogen | Protein Expression | |
| Strain, strain background (Escherichia coli) | DH5α | Invitrogen | DNA purification | |
| Sequence based reagent | Oligo-dNTP | Sigma | For site-directed mutagenesis of proteins | |
| Commercial assay or kit | NEB HF cloning kit | New England Biolabs, Inc USA | BamHI NotI Phusion HF (Pol) | |
| Commercial assay or kit | DNA purification kit | Promega | Cat no: A4160 | DNA purification |
| Chemical compound, drug | N15- Ammonium Chloride, C13- D-Glucose Deuterium Oxide | Cambridge Isotope Laboratory, Inc | Cat no: NLM-467 CLM-1396 DLM-4 | Isotope enrichment media |
| Chemical compound, drug | NaCl, Tris-HCl, Glycerol, Triton, ATP, MgCl2, BME, EDTA | Sigma Aldrich | Protein purification | |
| Chemical compound, drug | Alexa Fluor Malemide 488 | Invitrogen | Cat no: A10254 | Protein Labelling |
| Software, algorithm | NMR Pipe MATLAB ImageJ GROMACS | Delaglio et al., 1995, https://www.mathworks.com/products/matlab.html Schneider et al., 2012, Nature Materials and methods 9 (7): 671–675. Abraham et al., 2015 | Data processing | |
| Other | SYPRO Ruby stain | Invitrogen | Cat no: S21900 | Protein visualization |
| Other | Amylose bead | NEB | ||
| Other | Glutathione agarose | Thermo Fischer |
Additional files
-
Supplementary file 1
Contains six tables to provide salt-bridge occupancies and other analyzed parameters from molecular dynamics simulations.
- https://cdn.elifesciences.org/articles/49223/elife-49223-supp1-v2.docx
-
Transparent reporting form
- https://cdn.elifesciences.org/articles/49223/elife-49223-transrepform-v2.docx
Download links
A two-part list of links to download the article, or parts of the article, in various formats.
Downloads (link to download the article as PDF)
Open citations (links to open the citations from this article in various online reference manager services)
Cite this article (links to download the citations from this article in formats compatible with various reference manager tools)
Deamidation disrupts native and transient contacts to weaken the interaction between UBC13 and RING-finger E3 ligases
eLife 8:e49223.
https://doi.org/10.7554/eLife.49223


